
Predicting Range Shifts of Five Alnus (Betulaceae) Species in China Under Future Climate Scenarios

 , ,
, ,
Abstract
1. Introduction
2. Results
2.1. Model Accuracy and Key Environmental Variables
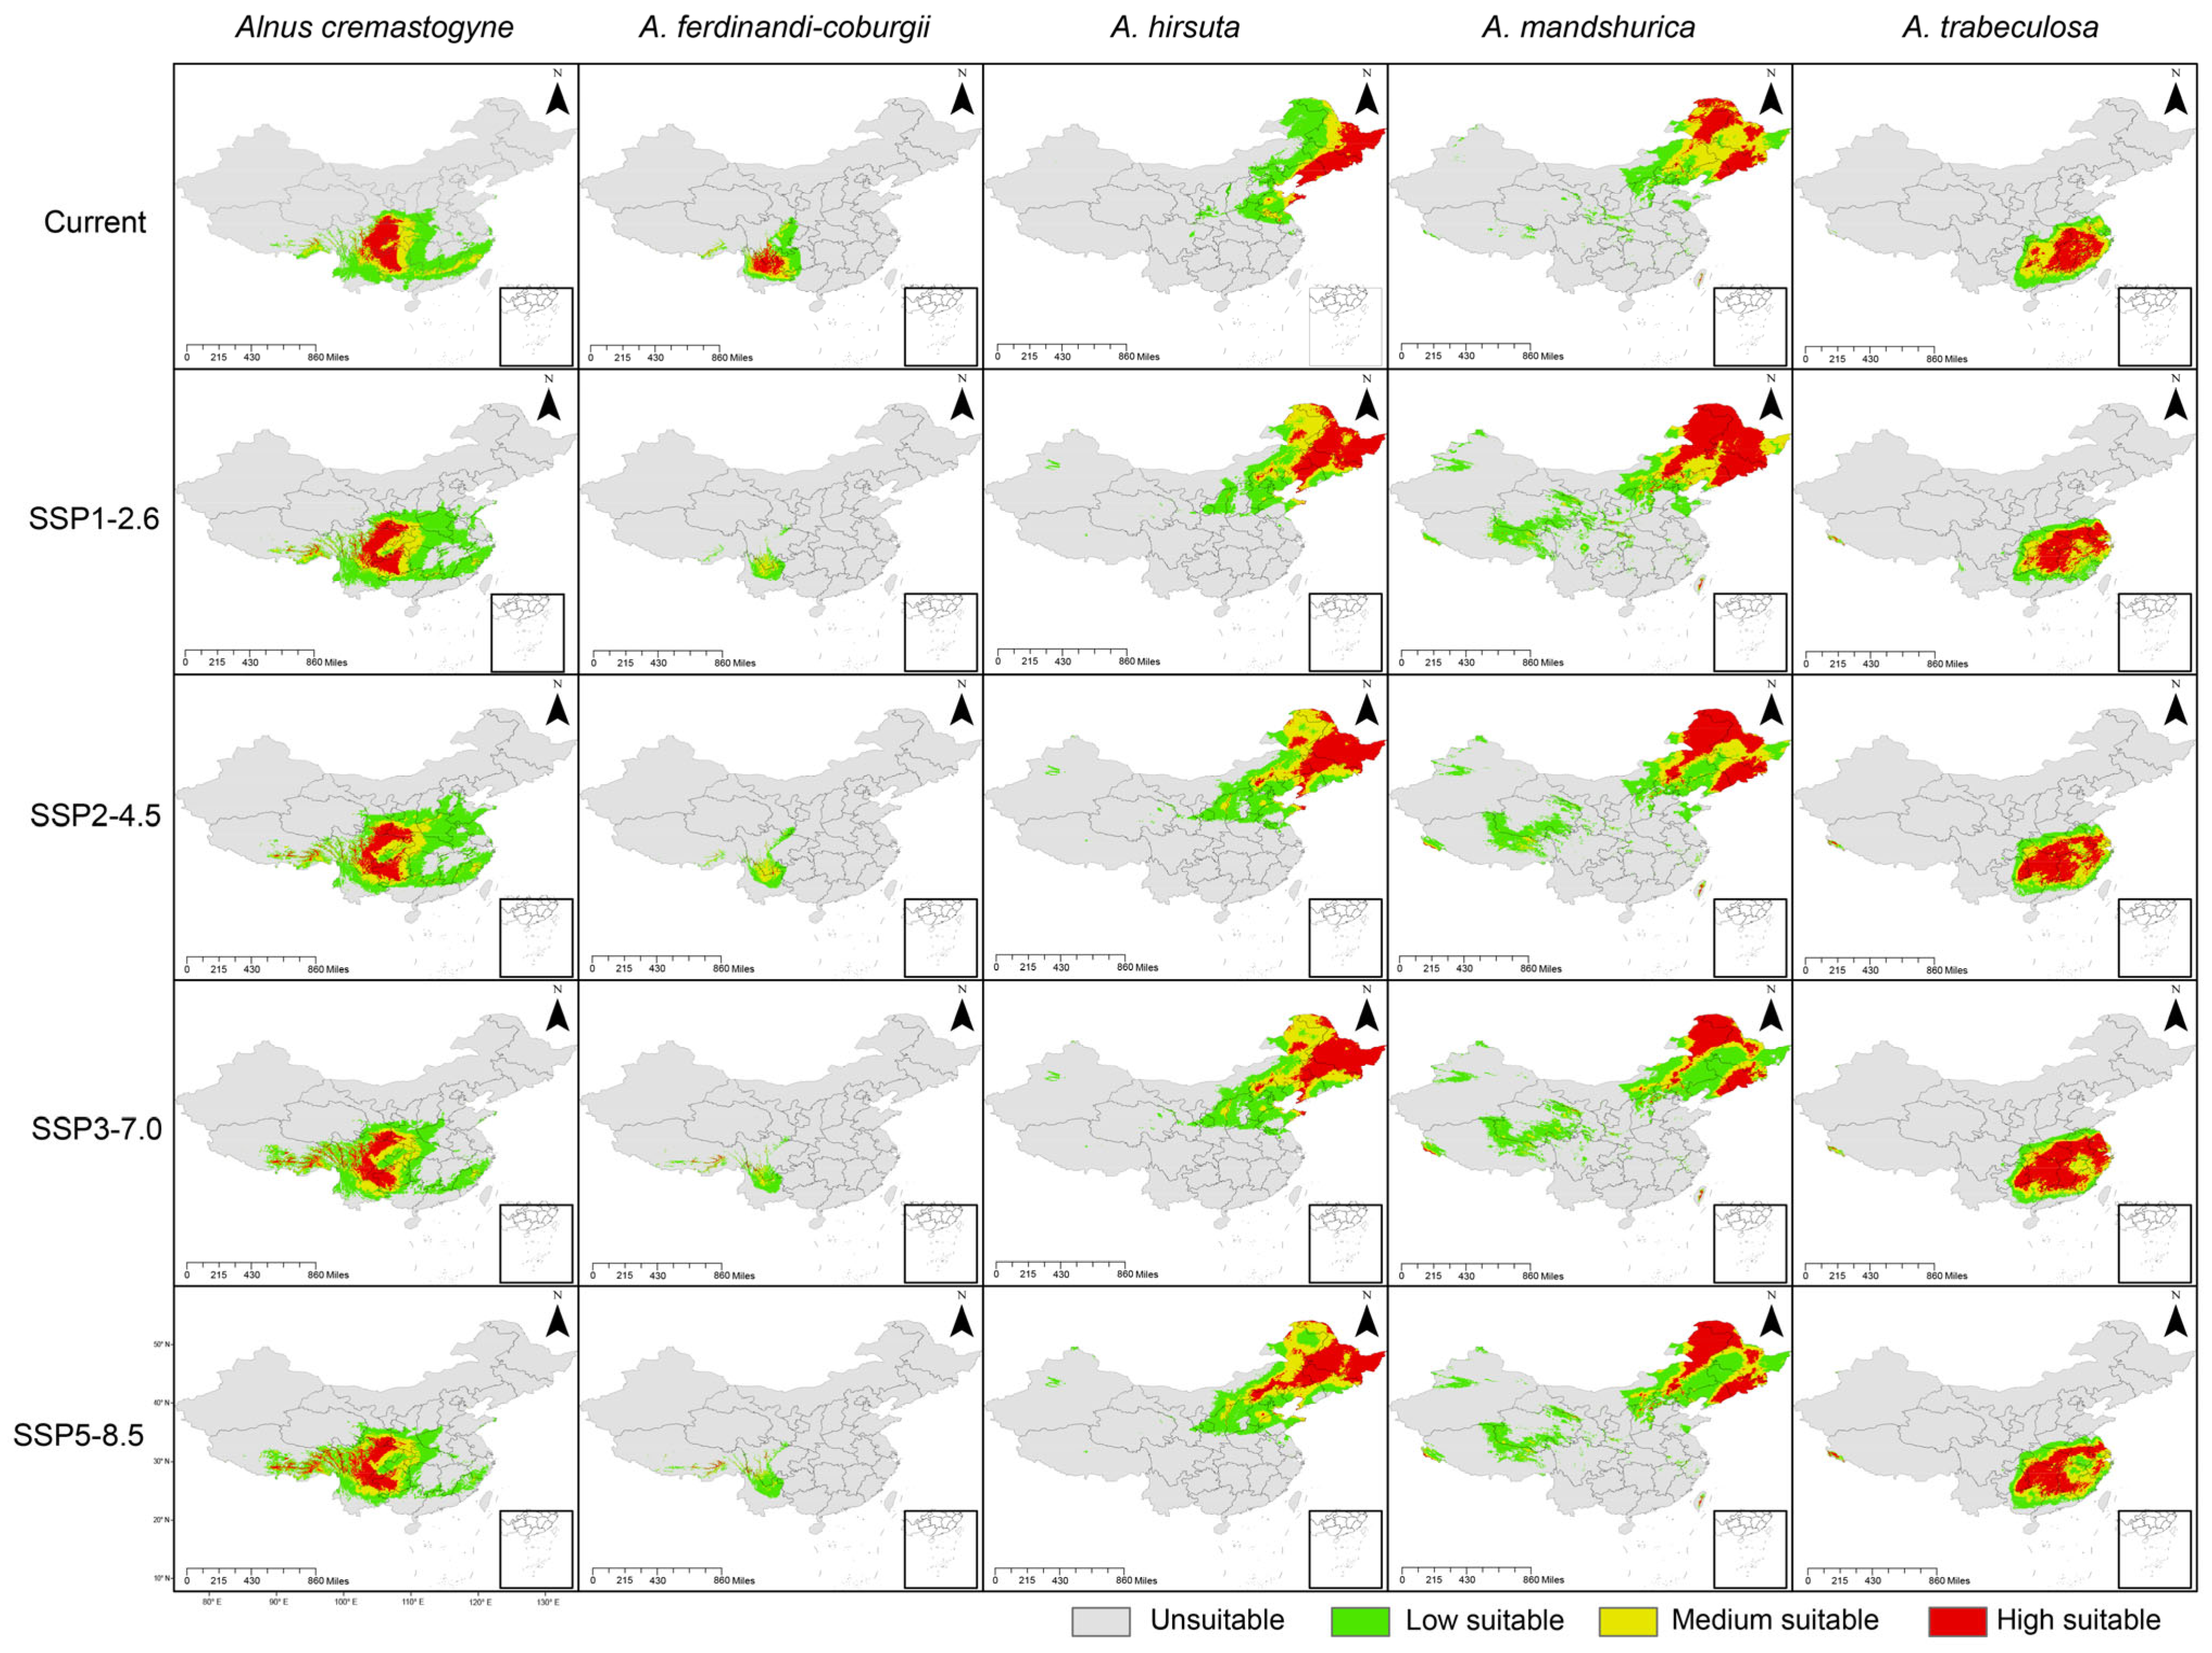
2.2. Predicted Potential Suitable Distribution of the Alnus Species
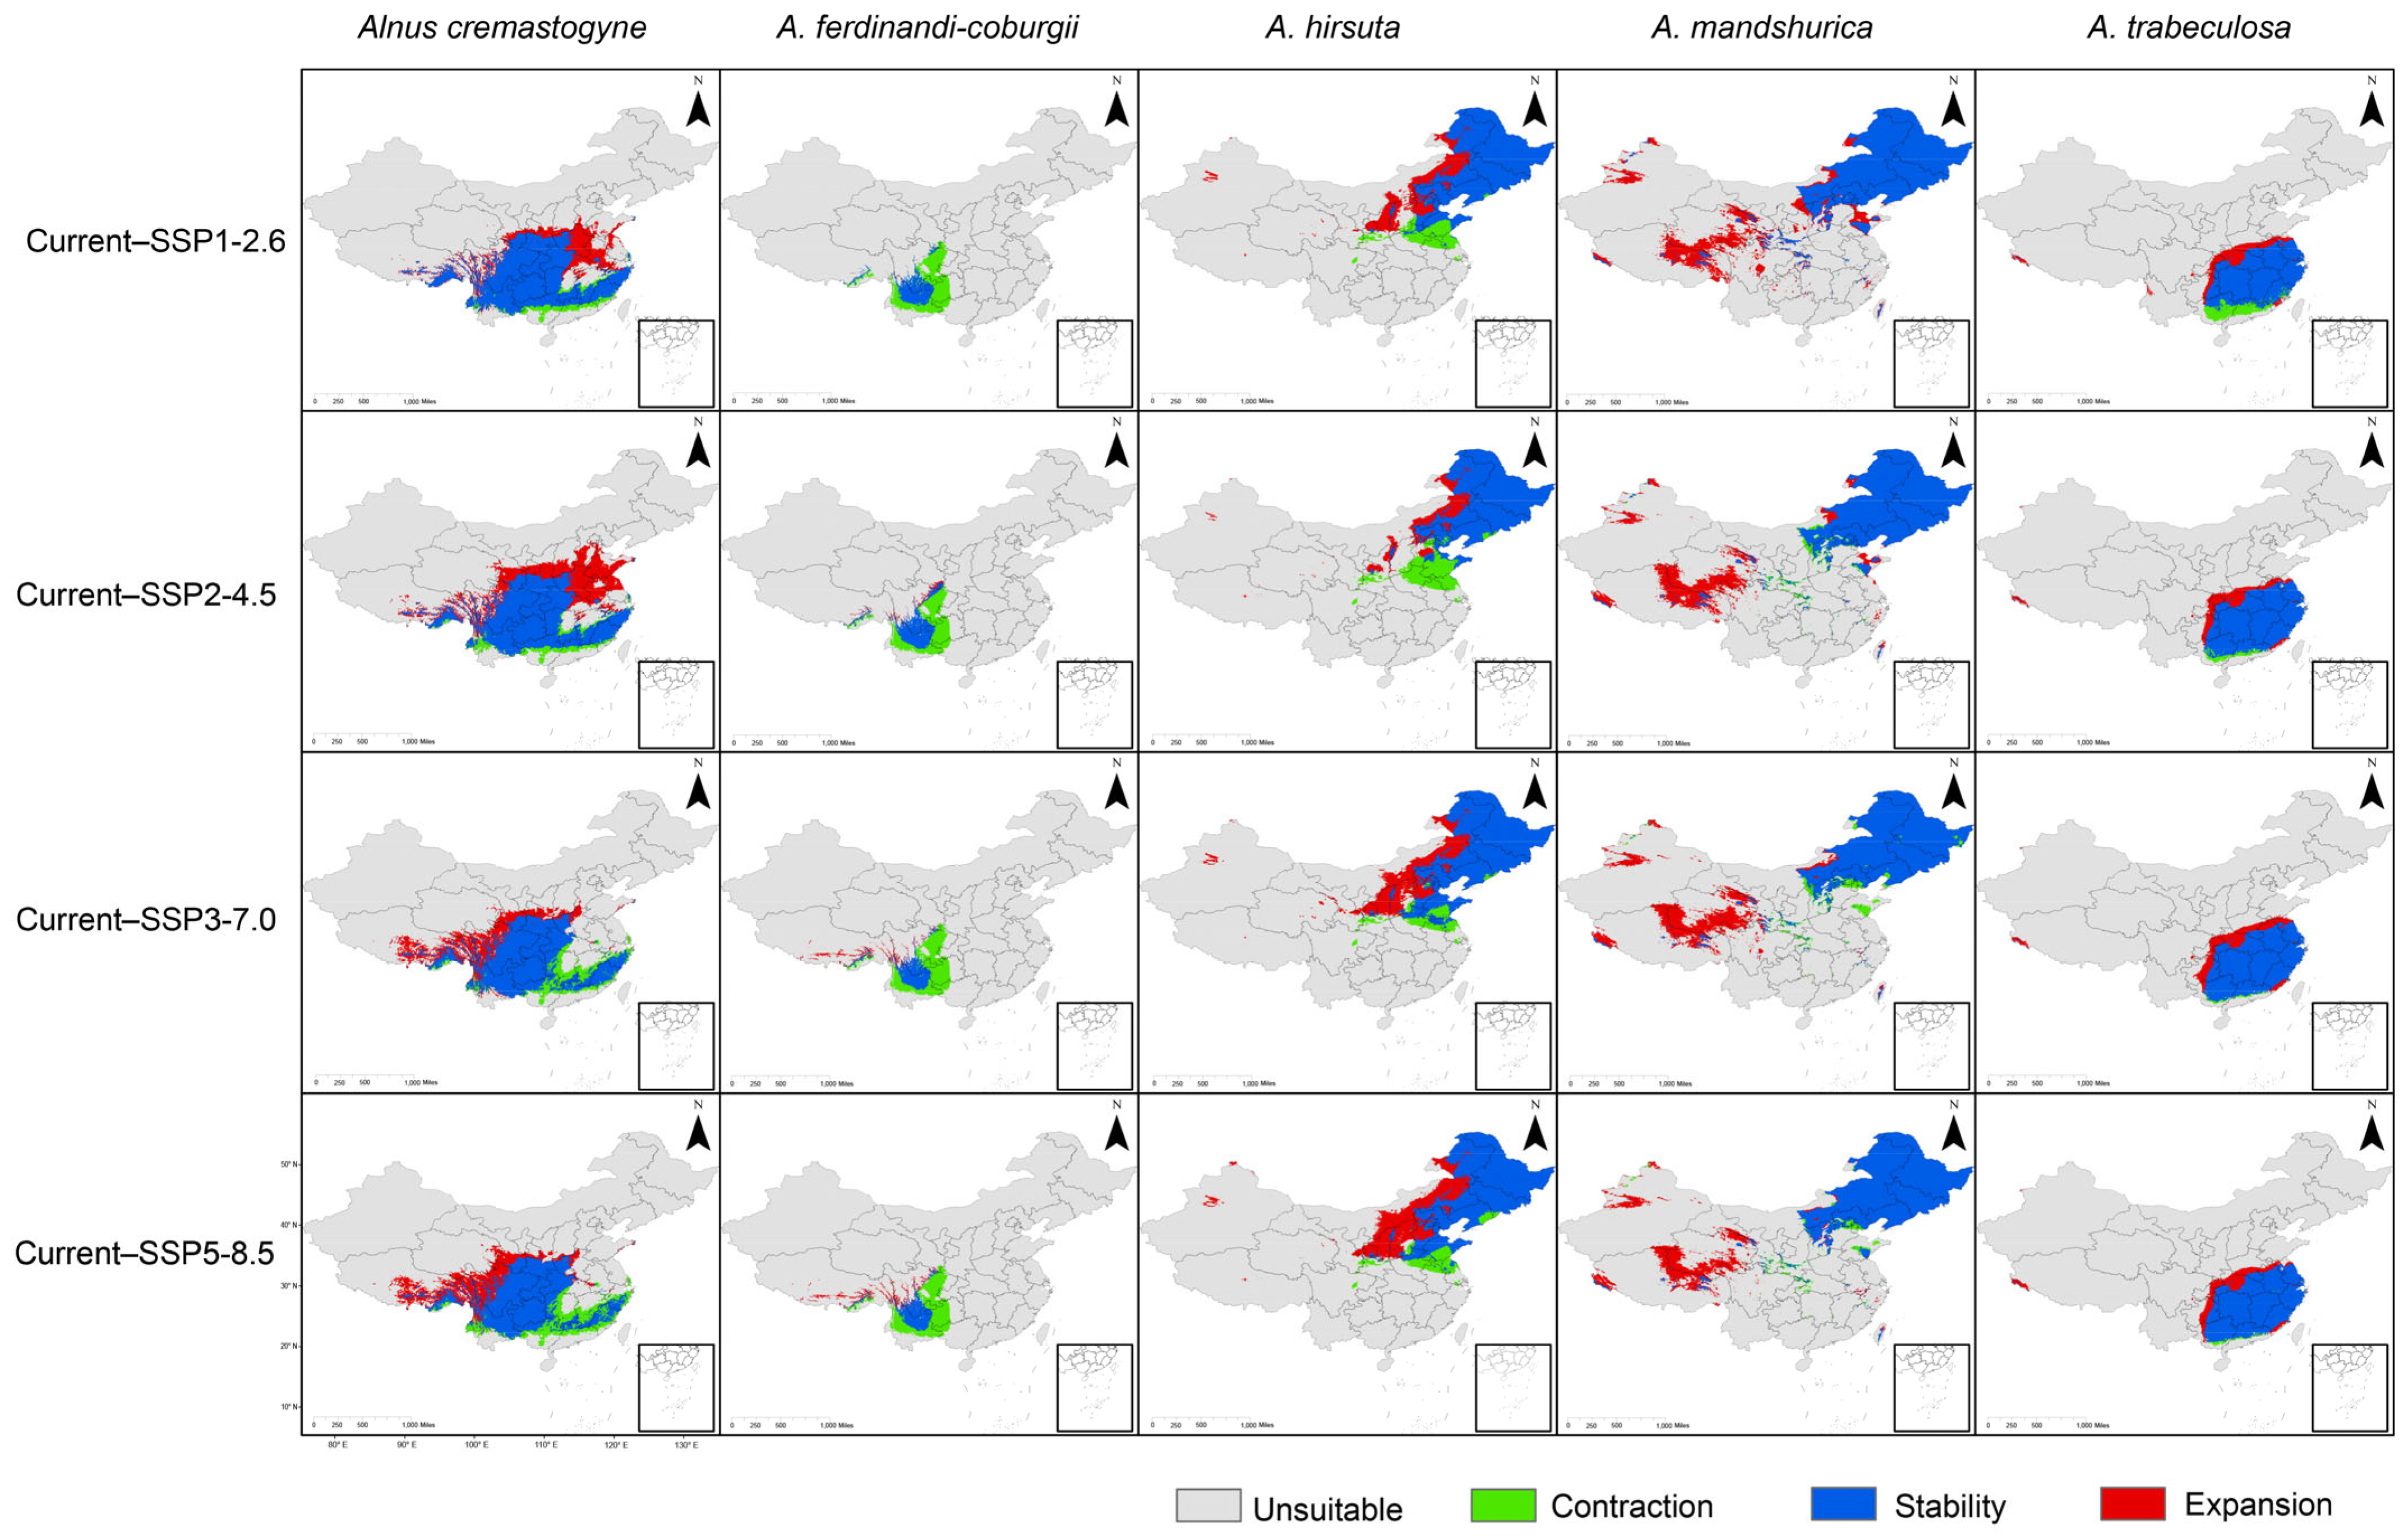
2.3. The Expansion and Contraction of the Distribution Area of Alnus Species
3. Discussion
3.1. Assessment of MaxEnt Model
3.2. Current and Future Potential Distribution Range of the Alnus Species
3.3. Implications for Conservation and Forest Management
3.4. Limitations and Future Research Directions
4. Materials and Methods
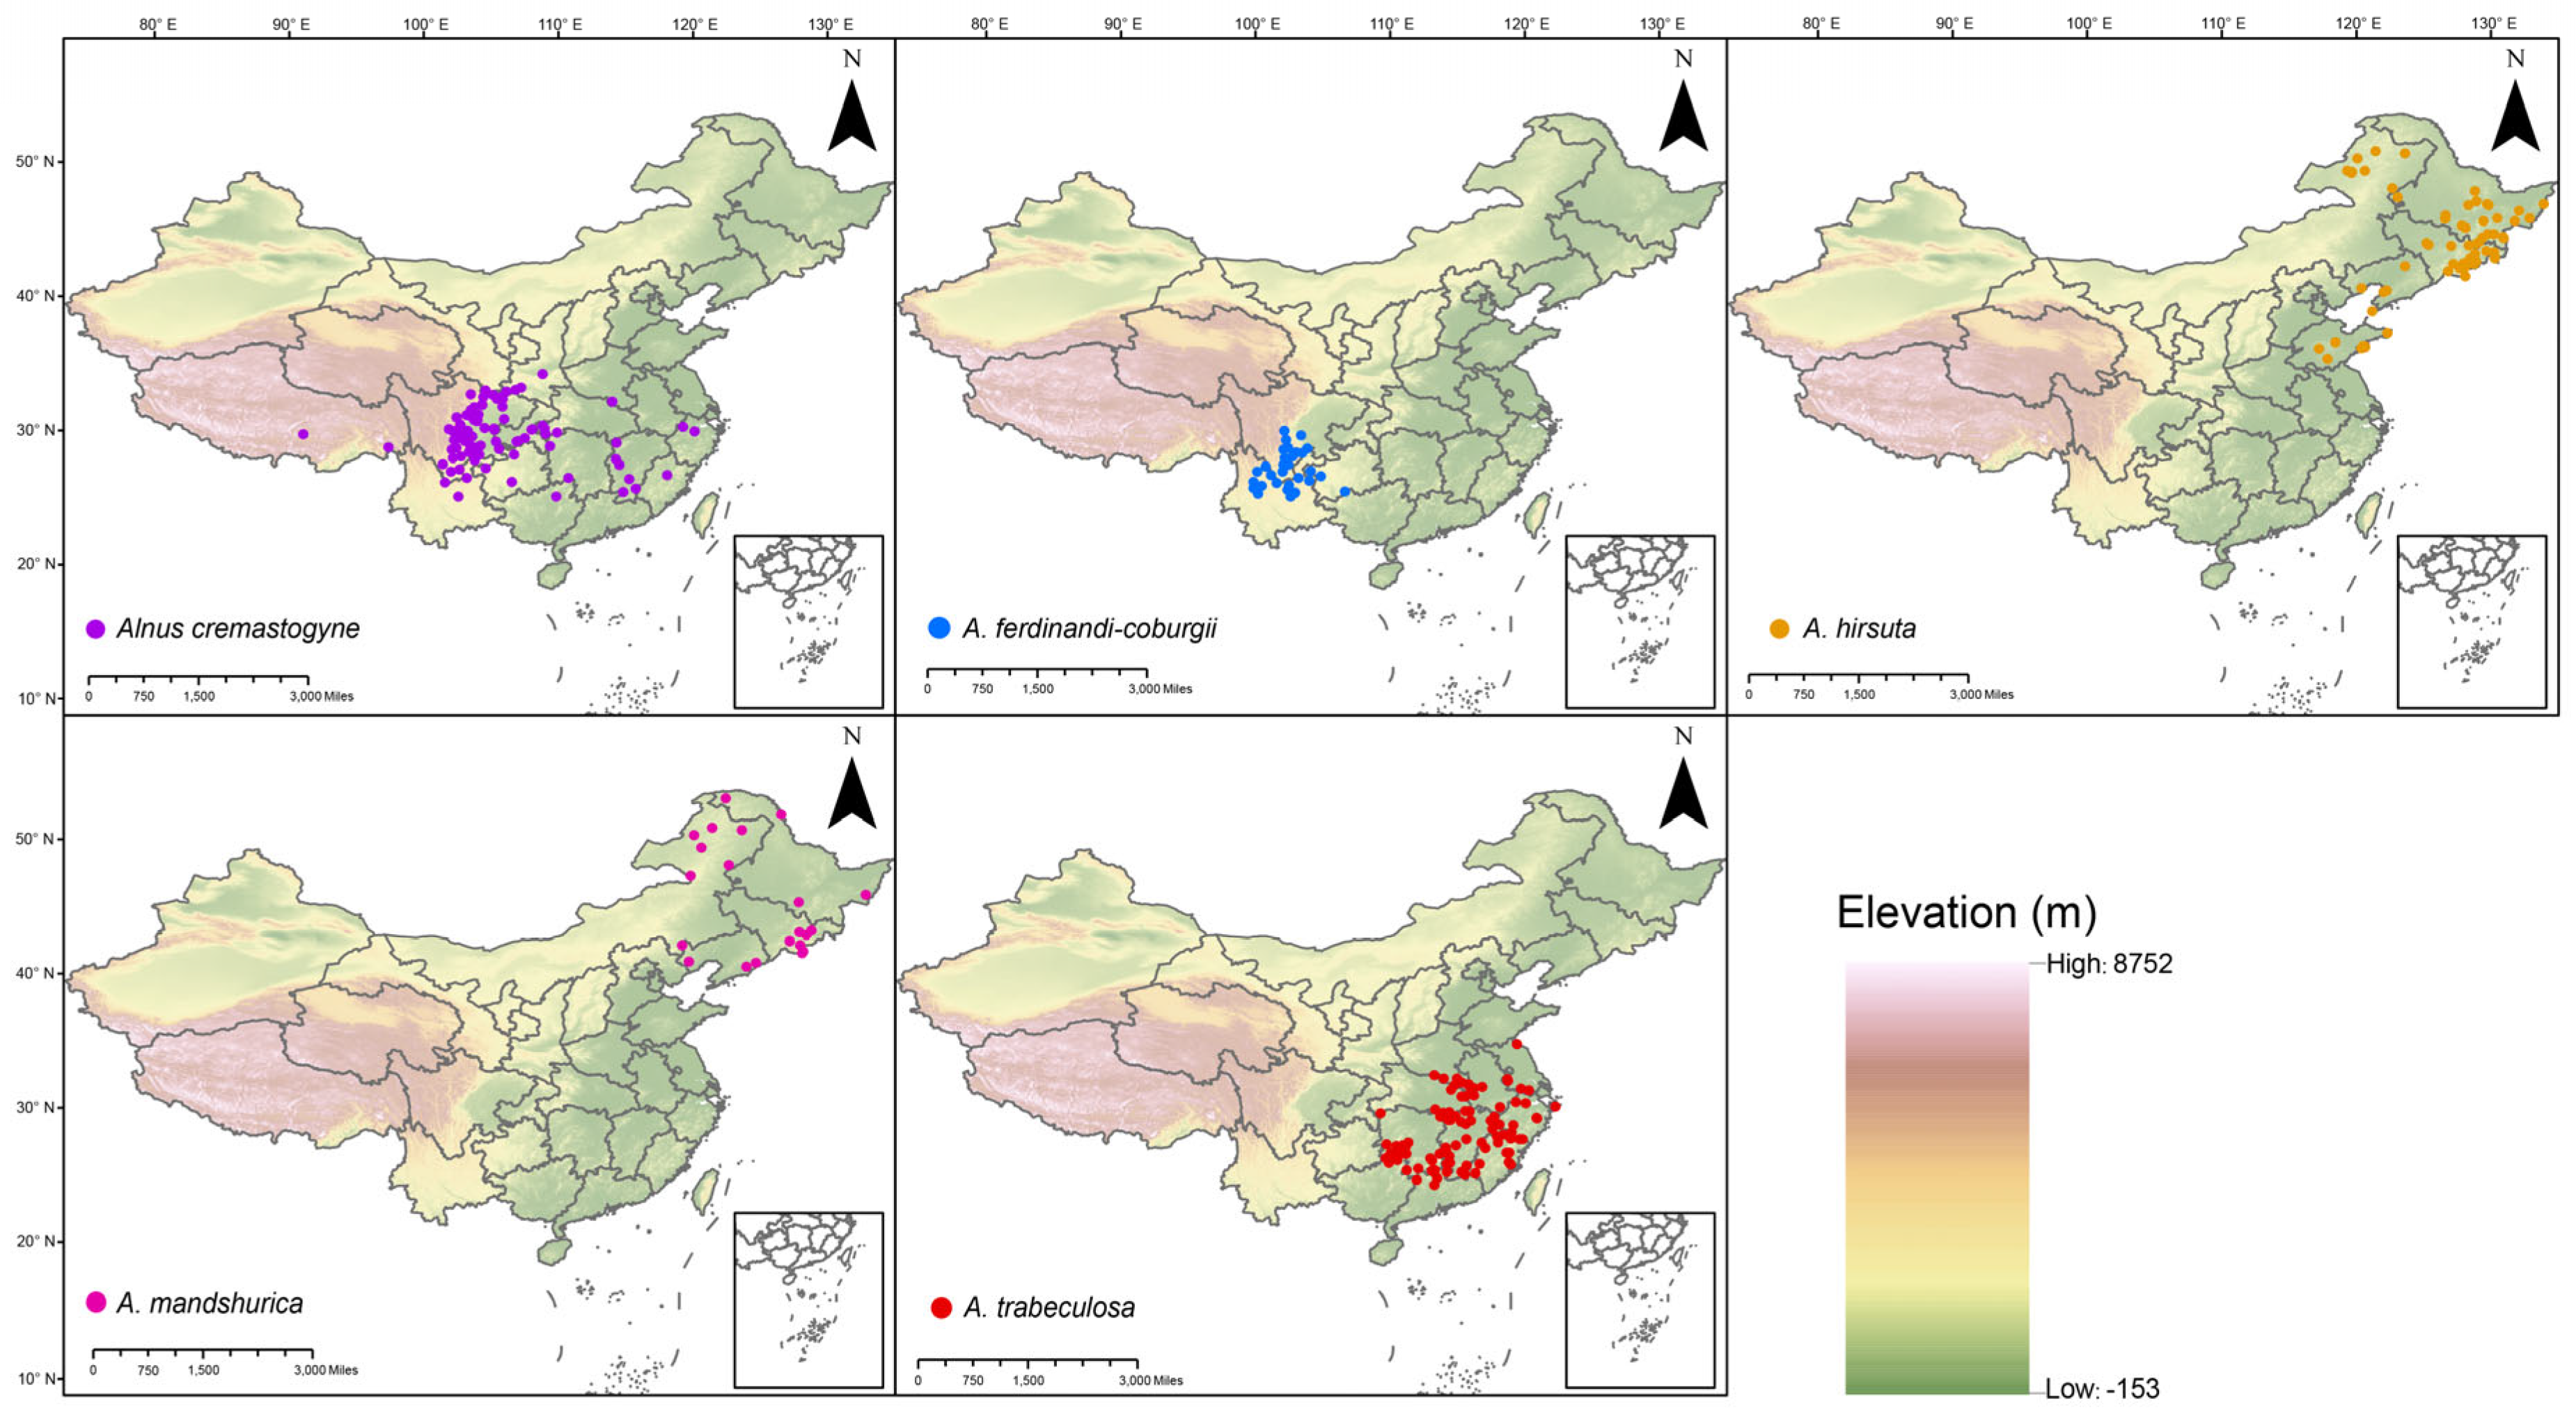
4.1. Species Distribution Data
4.2. Environmental Variables
4.3. Key Environmental Variable Selection
4.4. Model Parameter Optimization
4.5. Model Construction of MaxEnt
4.6. Model Accuracy Evaluation
4.7. Model Output and Data Analysis
5. Conclusions
Supplementary Materials
Author Contributions
Funding
Data Availability Statement
Conflicts of Interest
Abbreviations
| AICc | Akaike Information Criterion corrected |
| AUC | Area Under the Curve |
| FC | Feature Combination |
| OR10 | 10% Training Omission Rate |
| RM | Regularization Multiplier |
| ROC | Receiver Operating Characteristic |
| SDM | Species Distribution Model |
| SSP | Shared Socioeconomic Pathway |
| TSS | True Skill Statistic |
| VIF | Variance Inflation Factor |
References
- Chen, I.-C.; Hill, J.K.; Ohlemüller, R.; Roy, D.B.; Thomas, C.D. Rapid Range Shifts of Species Associated with High Levels of Climate Warming. Science 2011, 333, 1024–1026. [Google Scholar] [CrossRef] [PubMed]
- Parmesan, C. Ecological and Evolutionary Responses to Recent Climate Change. Annu. Rev. Ecol. Evol. Syst. 2006, 37, 637–669. [Google Scholar] [CrossRef]
- Pecl, G.T.; Araújo, M.B.; Bell, J.D.; Blanchard, J.; Bonebrake, T.C.; Chen, I.-C.; Clark, T.D.; Colwell, R.K.; Danielsen, F.; Evengård, B.; et al. Biodiversity Redistribution under Climate Change: Impacts on Ecosystems and Human Well-Being. Science 2017, 355, eaai9214. [Google Scholar] [CrossRef] [PubMed]
- Rubenstein, M.A.; Weiskopf, S.R.; Bertrand, R.; Carter, S.L.; Comte, L.; Eaton, M.J.; Johnson, C.G.; Lenoir, J.; Lynch, A.J.; Miller, B.W.; et al. Climate Change and the Global Redistribution of Biodiversity: Substantial Variation in Empirical Support for Expected Range Shifts. Environ. Evid. 2023, 12, 7. [Google Scholar] [CrossRef] [PubMed]
- Wang, X.; Li, Z.; Zhang, L.; Wang, Y.; Liu, Y.; Ma, Y. The Optimized Maxent Model Reveals the Pattern of Distribution and Changes in the Suitable Cultivation Areas for Reaumuria songarica Being Driven by Climate Change. Ecol. Evol. 2024, 14, e70015. [Google Scholar] [CrossRef]
- Wan, J.-N.; Mbari, N.J.; Wang, S.-W.; Liu, B.; Mwangi, B.N.; Rasoarahona, J.R.E.; Xin, H.-P.; Zhou, Y.-D.; Wang, Q.-F. Modeling Impacts of Climate Change on the Potential Distribution of Six Endemic Baobab Species in Madagascar. Plant Divers. 2021, 43, 117–124. [Google Scholar] [CrossRef]
- Weiskopf, S.R.; Rubenstein, M.A.; Crozier, L.G.; Gaichas, S.; Griffis, R.; Halofsky, J.E.; Hyde, K.J.W.; Morelli, T.L.; Morisette, J.T.; Muñoz, R.C.; et al. Climate Change Effects on Biodiversity, Ecosystems, Ecosystem Services, and Natural Resource Management in the United States. Sci. Total Environ. 2020, 733, 137782. [Google Scholar] [CrossRef]
- Ojha, V.K. Climate Change and Its Impact on Biodiversity: A Global Perspective. Int. J. Geogr. Geol. Environ. 2022, 4, 245–249. [Google Scholar] [CrossRef]
- Wang, Z.; Wang, T.; Zhang, X.; Wang, J.; Yang, Y.; Sun, Y.; Guo, X.; Wu, Q.; Nepovimova, E.; Watson, A.E.; et al. Biodiversity Conservation in the Context of Climate Change: Facing Challenges and Management Strategies. Sci. Total Environ. 2024, 937, 173377. [Google Scholar] [CrossRef]
- Zhang, H.; Zhou, Y.; Zhang, S.; Wang, Z.; Liu, Z. Adaptive Distribution and Priority Protection of Endangered Species Cycas Balansae. Plants 2025, 14, 815. [Google Scholar] [CrossRef]
- Amindin, A.; Pourghasemi, H.R.; Safaeian, R.; Rahmanian, S.; Tiefenbacher, J.P.; Naimi, B. Predicting Current and Future Habitat Suitability of an Endemic Species Using Data-Fusion Approach: Responses to Climate Change. Rangel. Ecol. Manag. 2024, 94, 149–162. [Google Scholar] [CrossRef]
- Guo, K.; Yuan, S.; Wang, H.; Zhong, J.; Wu, Y.; Chen, W.; Hu, C.; Chang, Q. Species Distribution Models for Predicting the Habitat Suitability of Chinese Fire-Bellied Newt Cynops orientalis under Climate Change. Ecol. Evol. 2021, 11, 10147–10154. [Google Scholar] [CrossRef] [PubMed]
- Liu, L.; Wang, R.; Zhang, Y.; Mou, Q.; Gou, Y.; Liu, K.; Huang, N.; Ouyang, C.; Hu, J.; Du, B. Simulation of Potential Suitable Distribution of Alnus cremastogyne Burk. In China under Climate Change Scenarios. Ecol. Indic. 2021, 133, 108396. [Google Scholar] [CrossRef]
- Luo, Y.; Yang, J.; Liu, L.; Zhang, K. MaxEnt Modeling and Effects of Climate Change on Shifts in Habitat Suitability for Sorbus alnifolia in China. Plants 2025, 14, 677. [Google Scholar] [CrossRef] [PubMed]
- Qin, A.; Liu, B.; Guo, Q.; Bussmann, R.W.; Ma, F.; Jian, Z.; Xu, G.; Pei, S. Maxent Modeling for Predicting Impacts of Climate Change on the Potential Distribution of Thuja sutchuenensis Franch., an Extremely Endangered Conifer from Southwestern China. Glob. Ecol. Conserv. 2017, 10, 139–146. [Google Scholar] [CrossRef]
- Nair, R.R.; Peterson, A.T. Mapping the Global Distribution of Invasive Pest Drosophila Suzukii and Parasitoid Leptopilina japonica: Implications for Biological Control. PeerJ 2023, 11, e15222. [Google Scholar] [CrossRef]
- Ren, X.; He, T.; Chang, Y.; Zhao, Y.; Chen, X.; Bai, S.; Wang, L.; Shen, M.; She, G. The Genus Alnus, A Comprehensive Outline of Its Chemical Constituents and Biological Activities. Molecules 2017, 22, 1383. [Google Scholar] [CrossRef]
- Tedersoo, L.; Suvi, T.; Jairus, T.; Ostonen, I.; Põlme, S. Revisiting Ectomycorrhizal Fungi of the Genus Alnus: Differential Host Specificity, Diversity and Determinants of the Fungal Community. New Phytol. 2009, 182, 727–735. [Google Scholar] [CrossRef]
- Tariq, A.; Pan, K.; Olatunji, O.A.; Graciano, C.; Li, Z.; Sun, F.; Zhang, L.; Wu, X.; Chen, W.; Song, D.; et al. Phosphorous Fertilization Alleviates Drought Effects on Alnus cremastogyne by Regulating Its Antioxidant and Osmotic Potential. Sci. Rep. 2018, 8, 5644. [Google Scholar] [CrossRef]
- Zhang, X.; Xiao, W.; Song, C.; Zhang, J.; Liu, X.; Mao, R. Nutrient Responses of Vascular Plants to N2-Fixing Tree Alnus hirsuta Encroachment in a Boreal Peatland. Oecologia 2024, 206, 1–10. [Google Scholar] [CrossRef]
- Miyamoto, N.; Karamoto, N.; Takahashi, M. Ecological and Genetic Effects of Cutting in an Alnus trabeculosa Hand.-Mazz. (Betulaceae) Population. Heredity 2003, 91, 331–336. [Google Scholar] [CrossRef] [PubMed]
- Martín, M.A.; Moreno, R.; Die, J.V.; Cabrera, A.; Castro, P.; Pérez, M.D.; Palomino, C.; Cuenca, B.; Pérez, F.; Solla, A. Distribution, Diversity and Genetic Structure of Alders (Alnus lusitanica and A. glutinosa) in Spain. For. Ecol. Manag. 2024, 562, 121922. [Google Scholar] [CrossRef]
- Tobita, H.; Hasegawa, S.F.; Tian, X.; Nanami, S.; Takeda, H. Spatial Distribution and Biomass of Root Nodules in a Naturally Regenerated Stand of Alnus hirsuta (Turcz.) Var. Sibirica. Symbiosis 2010, 50, 77–86. [Google Scholar] [CrossRef]
- Elith, J.; Leathwick, J.R. Species Distribution Models: Ecological Explanation and Prediction Across Space and Time. Annu. Rev. Ecol. Evol. Syst. 2009, 40, 677–697. [Google Scholar] [CrossRef]
- Zurell, D.; Franklin, J.; König, C.; Bouchet, P.J.; Dormann, C.F.; Elith, J.; Fandos, G.; Feng, X.; Guillera-Arroita, G.; Guisan, A.; et al. A Standard Protocol for Reporting Species Distribution Models. Ecography 2020, 43, 1261–1277. [Google Scholar] [CrossRef]
- Sun, J.; Feng, L.; Wang, T.; Tian, X.; He, X.; Xia, H.; Wang, W. Predicting the Potential Habitat of Three Endangered Species of Carpinus Genus under Climate Change and Human Activity. Forests 2021, 12, 1216. [Google Scholar] [CrossRef]
- Ali, F.; Khan, N.; Khan, A.M.; Ali, K.; Abbas, F. Species Distribution Modelling of Monotheca Buxifolia (Falc.) A. DC.: Present Distribution and Impacts of Potential Climate Change. Heliyon 2023, 9, e13417. [Google Scholar] [CrossRef] [PubMed]
- Samal, P.; Srivastava, J.; Charles, B.; Singarasubramanian, S.R. Species Distribution Models to Predict the Potential Niche Shift and Priority Conservation Areas for Mangroves (Rhizophora apiculata, R. mucronata) in Response to Climate and Sea Level Fluctuations along Coastal India. Ecol. Indic. 2023, 154, 110631. [Google Scholar] [CrossRef]
- Moore, C.E.; Meacham-Hensold, K.; Lemonnier, P.; Slattery, R.A.; Benjamin, C.; Bernacchi, C.J.; Lawson, T.; Cavanagh, A.P. The Effect of Increasing Temperature on Crop Photosynthesis: From Enzymes to Ecosystems. J. Exp. Bot. 2021, 72, 2822–2844. [Google Scholar] [CrossRef]
- Gray, S.B.; Brady, S.M. Plant Developmental Responses to Climate Change. Dev. Biol. 2016, 419, 64–77. [Google Scholar] [CrossRef]
- Kirschbaum, M.U.F. Direct and Indirect Climate Change Effects on Photosynthesis and Transpiration. Plant Biol. 2004, 6, 242–253. [Google Scholar] [CrossRef] [PubMed]
- Chukwuma, E.C.; Mankga, L.T. A MaxEnt Model for Estimating Suitable Habitats for Some Important Pelargonium Species in South Africa. J. Nat. Conserv. 2025, 84, 126845. [Google Scholar] [CrossRef]
- Li, S.; Li, Y.; Hu, M.; Li, Y.; Yang, M.; Wang, S.; Yu, W.; Cheng, C.; Cheng, Q. Ecological Risk Assessment of Future Suitable Areas for Piper Kadsura under the Background of Climate Change. Front. Plant Sci. 2025, 15, 1471706. [Google Scholar] [CrossRef] [PubMed]
- Wang, R.; Yang, Y.; Wang, X.; Li, J.; Gao, Y.; Huang, H.; Zhou, Z.; Wang, P.; Zhao, L. Response of Seed Germination and Seedling Growth of Perennial Ryegrass (Lolium perenne L.) to Drought, Salinity, and pH in Karst Regions. Sci. Rep. 2025, 15, 16874. [Google Scholar] [CrossRef]
- Meng, F.; Zhang, T.; Yin, D. The Effects of Soil Drought Stress on Growth Characteristics, Root System, and Tissue Anatomy of Pinus sylvestris Var. Mongolica. PeerJ 2023, 11, e14578. [Google Scholar] [CrossRef]
- Padilla, F.M.; Pugnaire, F.I. Rooting Depth and Soil Moisture Control Mediterranean Woody Seedling Survival during Drought. Funct. Ecol. 2007, 21, 489–495. [Google Scholar] [CrossRef]
- Song, X.; Katabuchi, M.; Chase, J.M.; Johnson, D.J.; Zhang, W.; Deng, X.; Cao, M.; Yang, J. Drought Tolerance and Species Abundance Mediate Dry Season Negative Density Dependence in a Tropical Forest. Ecology 2024, 105, e4382. [Google Scholar] [CrossRef]
- Bean, W.J.; Bean, W.J. Trees and Shrubs Hardy in the British Isles, 2nd ed.; J. Murray: London, UK, 1916. [Google Scholar]
- Li, P.; Skvortsov, A.K. Betulaceae. In Flora of China: Cycadaceae through Fagaceae; Wu, Z.-Y., Raven, P.H., Eds.; Science Press/Missouri Botanical Gardens Press: Beijing, China; St Louis, MO, USA, 1999; Volume 4, pp. 286–313. [Google Scholar]
- Chen, X.; Zhang, X.; Zhu, X.; Zhang, H.; Liang, X.; Lei, Y. He Exotic Plant Alnus trabeculosa Alters the Composition and Diversity of Native Rhizosphere Bacterial Communities of Phragmites australis. Pedosphere 2016, 26, 108–119. [Google Scholar] [CrossRef]
- Xu, H.; Su, T.; Zhou, Z. Leaf and Infructescence Fossils of Alnus (Betulaceae) from the Late Eocene of the Southeastern Qinghai–Tibetan Plateau. J. Sytematics Evol. 2019, 57, 105–113. [Google Scholar] [CrossRef]
- Wang, Y.; Sun, J.; He, W.; Ye, C.; Liu, B.; Chen, Y.; Zeng, T.; Ma, S.; Gan, X.; Miao, C.; et al. Migration of Vegetation Boundary between Alpine Steppe and Meadow on a Century-Scale across the Tibetan Plateau. Ecol. Indic. 2022, 136, 108599. [Google Scholar] [CrossRef]
- Mao, K.-S.; Wang, Y.; Liu, J.-Q. Evolutionary Origin of Species Diversity on the Qinghai–Tibet Plateau. J. Syst. Evol. 2021, 59, 1142–1158. [Google Scholar] [CrossRef]
- Wang, Y.; Lü, Y.; Lü, D.; Yin, L.; Wang, X. Climate Change and Its Ecological Risks Are Spatially Heterogeneous in High-Altitude Region: The Case of Qinghai-Tibet Plateau. CATENA 2024, 243, 108140. [Google Scholar] [CrossRef]
- Rumpf, S.B.; Hülber, K.; Klonner, G.; Moser, D.; Schütz, M.; Wessely, J.; Willner, W.; Zimmermann, N.E.; Dullinger, S. Range Dynamics of Mountain Plants Decrease with Elevation. Proc. Natl. Acad. Sci. USA 2018, 115, 1848–1853. [Google Scholar] [CrossRef] [PubMed]
- Lenoir, J.; Gégout, J.C.; Marquet, P.A.; de Ruffray, P.; Brisse, H. A Significant Upward Shift in Plant Species Optimum Elevation During the 20th Century. Science 2008, 320, 1768–1771. [Google Scholar] [CrossRef]
- Parmesan, C.; Yohe, G. A Globally Coherent Fingerprint of Climate Change Impacts across Natural Systems. Nature 2003, 421, 37–42. [Google Scholar] [CrossRef] [PubMed]
- Zhu, K.; Woodall, C.W.; Clark, J.S. Failure to Migrate: Lack of Tree Range Expansion in Response to Climate Change. Glob. Change Biol. 2012, 18, 1042–1052. [Google Scholar] [CrossRef]
- Millar, C.I.; Stephenson, N.L.; Stephens, S.L. Climate Change and Forests of the Future: Managing in the Face of Uncertainty. Ecol. Appl. 2007, 17, 2145–2151. [Google Scholar] [CrossRef]
- Schreiber, E.S.G.; Bearlin, A.R.; Nicol, S.J.; Todd, C.R. Adaptive Management: A Synthesis of Current Understanding and Effective Application. Ecol. Manag. Restor. 2004, 5, 177–182. [Google Scholar] [CrossRef]
- Watson, J.E.M.; Rao, M.; Ai-Li, K.; Yan, X. Climate Change Adaptation Planning for Biodiversity Conservation: A Review. Adv. Clim. Change Res. 2012, 3, 1–11. [Google Scholar] [CrossRef]
- Aiello-Lammens, M.E.; Boria, R.A.; Radosavljevic, A.; Vilela, B.; Anderson, R.P. spThin: An R Package for Spatial Thinning of Species Occurrence Records for Use in Ecological Niche Models. Ecography 2015, 38, 541–545. [Google Scholar] [CrossRef]
- Fick, S.E.; Hijmans, R.J. WorldClim 2: New 1-Km Spatial Resolution Climate Surfaces for Global Land Areas. Int. J. Climatol. 2017, 37, 4302–4315. [Google Scholar] [CrossRef]
- Zhang, X.; Fan, Y.; Niu, F.; Lu, S.; Du, W.; Wang, X.; Zhou, X. Impacts of Climate Change on the Potential Suitable Ecological Niches of the Endemic and Endangered Conifer Pinus bungeana in China. Forests 2025, 16, 462. [Google Scholar] [CrossRef]
- Venables, W.N.; Ripley, B.D. Modern Applied Statistics with S; Springer Science & Business Media: Berlin/Heidelberg, Germany, 2003; ISBN 978-0-387-95457-8. [Google Scholar]
- Muscarella, R.; Galante, P.J.; Soley-Guardia, M.; Boria, R.A.; Kass, J.M.; Uriarte, M.; Anderson, R.P. ENMeval: An R Package for Conducting Spatially Independent Evaluations and Estimating Optimal Model Complexity for Maxent Ecological Niche Models. Methods Ecol. Evol. 2014, 5, 1198–1205. [Google Scholar] [CrossRef]
- Phillips, S.J.; Anderson, R.P.; Schapire, R.E. Maximum Entropy Modeling of Species Geographic Distributions. Ecol. Model. 2006, 190, 231–259. [Google Scholar] [CrossRef]
- Wenger, S.J.; Olden, J.D. Assessing Transferability of Ecological Models: An Underappreciated Aspect of Statistical Validation. Methods Ecol. Evol. 2012, 3, 260–267. [Google Scholar] [CrossRef]
- Liu, C.; White, M.; Newell, G. Selecting Thresholds for the Prediction of Species Occurrence with Presence-Only Data. J. Biogeogr. 2013, 40, 778–789. [Google Scholar] [CrossRef]
- Merow, C.; Smith, M.J.; Silander Jr, J.A. A Practical Guide to MaxEnt for Modeling Species’ Distributions: What It Does, and Why Inputs and Settings Matter. Ecography 2013, 36, 1058–1069. [Google Scholar] [CrossRef]
- Lazagabaster, I.A.; Thomas, C.D.; Spedding, J.V.; Ikram, S.; Solano-Regadera, I.; Snape, S.; Bro-Jørgensen, J. Evaluating Species Distribution Model Predictions through Time against Paleozoological Records. Ecol. Evol. 2024, 14, e70288. [Google Scholar] [CrossRef]
- Allouche, O.; Tsoar, A.; Kadmon, R. Assessing the Accuracy of Species Distribution Models: Prevalence, Kappa and the True Skill Statistic (TSS). J. Appl. Ecol. 2006, 43, 1223–1232. [Google Scholar] [CrossRef]

| Species | Distribution Points | Parameter | AUC (SD) | TSS (SD) | |
|---|---|---|---|---|---|
| FC | RM | ||||
| A. cremastogyne | 91 | LQH | 2 | 0.9457 (0.012) | 0.9366 (0.026) |
| A. ferdinandi-coburgii | 32 | LQHPT | 1 | 0.9864 (0.006) | 0.9614 (0.056) |
| A. hirsuta | 69 | LQHP | 1 | 0.9408 (0.013) | 0.9408 (0.013) |
| A. mandshurica | 21 | LQ | 1 | 0.9301 (0.032) | 0.9101 (0.083) |
| A. trabeculosa | 97 | LQHPT | 2 | 0.9629 (0.007) | 0.9525 (0.032) |
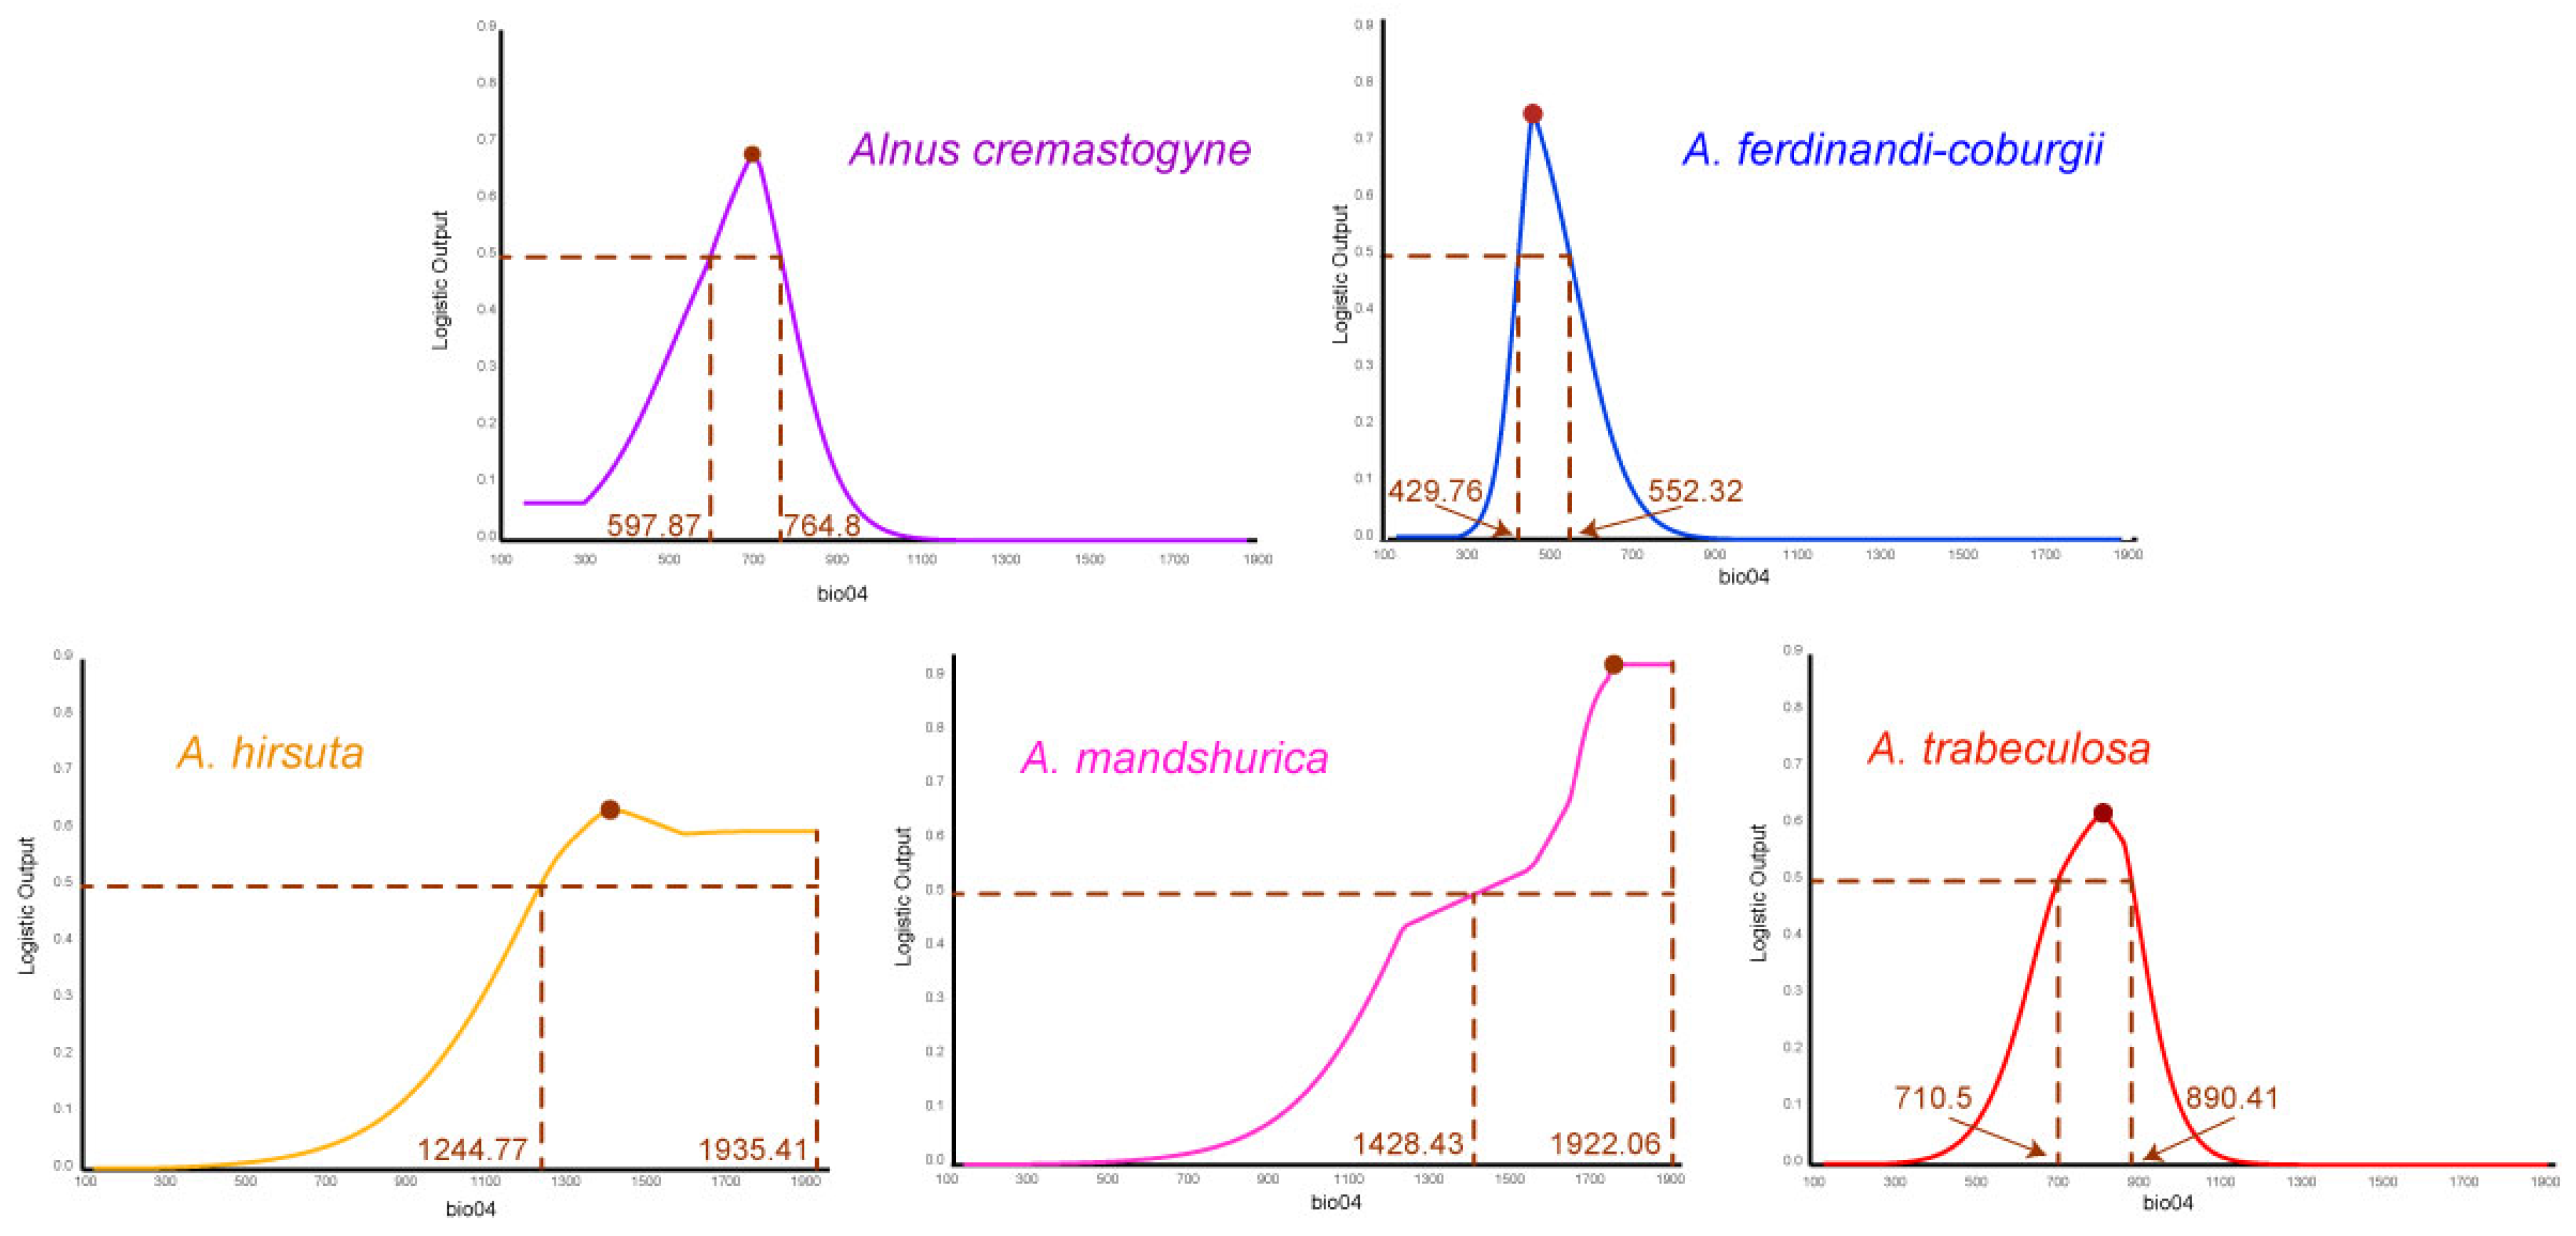
| Species | Variable | Percent Contribution | Logistic > 0.5 | Logistic Max |
|---|---|---|---|---|
| A. cremastogyne | bio12 | 39.9 | 806.14–1359.74 | 944.54 |
| bio06 | 29.3 | −1.72–5.01 | 3.52 | |
| bio04 | 19.3 | 597.87–764.80 | 697.69 | |
| bio19 | 11.5 | 21.46–101.50 | 44.08 | |
| A. ferdinandi-coburgii | bio04 | 44 | 429.76–552.32 | 463.02 |
| bio06 | 30.8 | 1.43–3.95 | 1.26 | |
| bio12 | 15.5 | 793.11–1091.96 | 878.50 | |
| bio19 | 9.7 | 23.40–60.66 | 36.30 | |
| A. hirsuta | bio04 | 39.9 | 1244.77–1935.41 | 1418.34 |
| bio12 | 38.1 | 545.05–758.94 | 616.35 | |
| bio03 | 16 | 14.80–24.84 | 14.80 | |
| bio15 | 6 | 91.16–109.68 | 96.61 | |
| A. mandshurica | bio04 | 55.3 | 1428.43–1922.06 | 1777.50 |
| bio13 | 33.1 | 111.62–199.50 | 124.99 | |
| bio01 | 7.9 | −4.22–4.74 | 0.26 | |
| bio03 | 3.7 | 20.58–26.84 | 25.7 | |
| A. trabeculosa | bio17 | 89 | 131.02–297.01 | 155.65 |
| bio04 | 5.7 | 710.50–890.41 | 820.94 | |
| bio13 | 4 | 218.85–313.89 | 265.5 | |
| bio02 | 1.3 | 7.77–9.12 | 8.66 |
| Species | Scenario | Area (×104 km2) | ||||
|---|---|---|---|---|---|---|
| High Suitable | Medium Suitable | Low Suitable | total Suitable | Unsuitable | ||
| A. cremastogyne | current | 32.82 | 40.41 | 102.39 | 175.62 | 788.39 |
| SSP1-2.6 | 35.59 (+8.44%) | 45.03 (+11.43%) | 129.30 (+26.28%) | 209.92 (+19.53%) | 754.10 (−4.35%) | |
| SSP2-4.5 | 39.44 (+20.17%) | 52.49 (+29.89%) | 149.59 (+46.10%) | 241.53 (+37.53%) | 722.48 (−8.36%) | |
| SSP3-7.0 | 36.38 (+10.85%) | 49.89 (+23.46%) | 112.82 (+10.19%) | 199.09 (+13.36%) | 764.92 (−2.98%) | |
| SSP5-8.5 | 39.73 (+21.05%) | 51.06 (+26.35%) | 102.32 (−0.07%) | 193.11 (+9.96%) | 770.90 (−2.22%) | |
| A. ferdinandi-coburgii | current | 12.15 | 14.05 | 29.90 | 56.10 | 907.91 |
| SSP1-2.6 | 0.12 (−99.01%) | 5.45 (−61.21%) | 13.75 (−54.01%) | 19.32 (−65.56%) | 944.69 (+4.05%) | |
| SSP2-4.5 | 0.28 (−97.70%) | 8.17 (−41.85%) | 17.62 (−41.07%) | 26.07 (−53.53%) | 937.94 (+3.31%) | |
| SSP3-7.0 | 0.98 (−91.93%) | 4.73 (−66.33%) | 17.91 (−40.10%) | 23.63 (−57.88%) | 940.39 (+3.58%) | |
| SSP5-8.5 | 1.14 (−90.62%) | 3.90 (−72.24%) | 20.96 (−29.90%) | 25.99 (−53.67%) | 938.02 (+3.32%) | |
| A. hirsuta | current | 51.32 | 29.38 | 104.60 | 185.29 | 778.72 |
| SSP1-2.6 | 69.24 (+34.92%) | 60.51 (+105.96%) | 75.71 (−27.62%) | 205.46 (+10.89%) | 758.55 (−2.59%) | |
| SSP2-4.5 | 54.86 (+6.90%) | 57.23 (+94.79%) | 64.26 (−38.57%) | 176.36 (−4.82%) | 787.65 (+1.15%) | |
| SSP3-7.0 | 66.74 (+30.05%) | 65.83 (+124.06%) | 94.69 (−9.47%) | 227.26 (+22.65%) | 736.75 (−5.39%) | |
| SSP5-8.5 | 68.93 (+34.31%) | 72.78 (+147.72%) | 90.93 (−13.07%) | 232.64 (+25.55%) | 731.37 (−6.08%) | |
| A. mandshurica | current | 54.93 | 78.72 | 75.73 | 209.37 | 754.64 |
| SSP1-2.6 | 116.73 (+112.51%) | 52.76 (−32.98%) | 117.92 (+55.71%) | 287.41 (+37.27%) | 676.60 (−10.34%) | |
| SSP2-4.5 | 85.58 (+55.80%) | 52.06 (−33.87%) | 127.93 (+68.93%) | 265.57 (+26.84%) | 698.44 (−7.45%) | |
| SSP3-7.0 | 59.29 (+7.94%) | 44.65 (−43.28%) | 156.82 (+107.08%) | 260.77 (+24.55%) | 703.25 (−6.81%) | |
| SSP5-8.5 | 68.65 (+24.98%) | 45.64 (−42.02%) | 140.13 (+85.04%) | 254.42 (+21.52%) | 709.59 (−5.97%) | |
| A. trabeculosa | current | 38.28 | 41.12 | 33.97 | 113.37 | 850.64 |
| SSP1-2.6 | 45.47 (+18.78%) | 36.16 (−12.06%) | 38.01 (+11.89%) | 119.64 (+5.53%) | 844.37 (−0.74%) | |
| SSP2-4.5 | 53.60 (+40.02%) | 39.22 (−4.62%) | 37.41 (+10.13%) | 130.23 (+14.87%) | 833.78 (−1.98%) | |
| SSP3-7.0 | 69.76 (+82.24%) | 38.05 (−7.47%) | 30.84 (−9.21%) | 138.65 (+22.30%) | 825.37 (−2.97%) | |
| SSP5-8.5 | 50.62 (+32.24%) | 42.49 (+3.33%) | 40.84 (+20.22%) | 133.94 (+18.14%) | 830.07 (−2.42%) | |
| Species | Scenario | Area (×104 km2) | ||
|---|---|---|---|---|
| Stability | Contraction | Expansion | ||
| A. cremastogyne | Current-SSP1-2.6 | 159.22 | 16.29 | 50.62 |
| Current-SSP2-4.5 | 156.90 | 18.63 | 84.71 | |
| Current-SSP3-7.0 | 145.97 | 29.65 | 53.12 | |
| Current-SSP5-8.5 | 135.18 | 40.44 | 57.95 | |
| A. ferdinandi-coburgii | Current-SSP1-2.6 | 19.06 | 37.11 | 0.27 |
| Current-SSP2-4.5 | 23.24 | 32.94 | 2.82 | |
| Current-SSP3-7.0 | 17.75 | 38.42 | 5.885 | |
| Current-SSP5-8.5 | 18.21 | 37.96 | 7.762 | |
| A. hirsuta | Current-SSP1-2.6 | 157.77 | 27.52 | 47.65 |
| Current-SSP2-4.5 | 146.51 | 38.78 | 29.80 | |
| Current-SSP3-7.0 | 165.46 | 19.83 | 61.88 | |
| Current-SSP5-8.5 | 161.43 | 23.86 | 71.15 | |
| A. mandshurica | Current-SSP1-2.6 | 208.66 | 0.33 | 78.15 |
| Current-SSP2-4.5 | 198.81 | 10.17 | 66.32 | |
| Current-SSP3-7.0 | 191.64 | 17.32 | 68.59 | |
| Current-SSP5-8.5 | 198.19 | 10.79 | 55.69 | |
| A. trabeculosa | Current-SSP1-2.6 | 97.85 | 15.51 | 21.78 |
| Current-SSP2-4.5 | 108.19 | 5.17 | 22.03 | |
| Current-SSP3-7.0 | 111.39 | 1.98 | 27.25 | |
| Current-SSP5-8.5 | 111.16 | 2.21 | 22.78 | |
Disclaimer/Publisher’s Note: The statements, opinions and data contained in all publications are solely those of the individual author(s) and contributor(s) and not of MDPI and/or the editor(s). MDPI and/or the editor(s) disclaim responsibility for any injury to people or property resulting from any ideas, methods, instructions or products referred to in the content. |
© 2025 by the authors. Licensee MDPI, Basel, Switzerland. This article is an open access article distributed under the terms and conditions of the Creative Commons Attribution (CC BY) license (https://creativecommons.org/licenses/by/4.0/).
Share and Cite
Yang, W.; Huang, Z.; Fu, C.; Zhao, Z.; Yang, X.; Hu, Q.; Wang, Z. Predicting Range Shifts of Five Alnus (Betulaceae) Species in China Under Future Climate Scenarios. Plants 2025, 14, 1597. https://doi.org/10.3390/plants14111597
Yang W, Huang Z, Fu C, Zhao Z, Yang X, Hu Q, Wang Z. Predicting Range Shifts of Five Alnus (Betulaceae) Species in China Under Future Climate Scenarios. Plants. 2025; 14(11):1597. https://doi.org/10.3390/plants14111597
Chicago/Turabian StyleYang, Wenjie, Zhilong Huang, Chenlong Fu, Zhuang Zhao, Xiaoyue Yang, Quanjun Hu, and Zefu Wang. 2025. "Predicting Range Shifts of Five Alnus (Betulaceae) Species in China Under Future Climate Scenarios" Plants 14, no. 11: 1597. https://doi.org/10.3390/plants14111597
APA StyleYang, W., Huang, Z., Fu, C., Zhao, Z., Yang, X., Hu, Q., & Wang, Z. (2025). Predicting Range Shifts of Five Alnus (Betulaceae) Species in China Under Future Climate Scenarios. Plants, 14(11), 1597. https://doi.org/10.3390/plants14111597