Abstract
(1) Background: Heterotrophs can affect plant biomass and alter species diversity–productivity relationships. However, these studies were conducted in systems with a low nitrogen (N) availability, and it is unclear how heterotroph removal affects the relationship between plant species diversity and productivity in different N habitats. (2) Methods: Three typical understory herbaceous plants were selected to assemble the plant species diversity (three plant species richness levels (1, 2, and 3) and seven plant species compositions), and the control, insecticide, fungicide, and all removal treatments were performed at each plant species diversity level in systems with or without N addition treatments. (3) Results: In systems without N addition, the insecticide treatment increased the plant aboveground biomass, total biomass, and leaf area, while the fungicide treatment reduced the plant belowground biomass, root length, and root tip number; the presence of Bidens pilosa increased the plant aboveground biomass. Similarly, the presence of Bletilla striata increased the plant belowground biomass and root diameter under each heterotroph removal treatment. In systems with N addition, all removal treatments reduced the plant belowground biomass and increased the plant leaf area; the presence of B. pilosa significantly increased the plant aboveground biomass, total biomass, and root length under each heterotroph removal treatment. The presence of B. striata significantly increased the plant belowground biomass and leaf area under insecticide and fungicide treatments. (4) Conclusions: Heterotroph removal alters the plant species diversity–biomass relationship by affecting the plant functional traits in systems with different N availabilities. The impact of biodiversity at different trophic levels on ecosystem functioning should be considered under the background of global change.
1. Introduction
Biodiversity is an important determinant of ecosystem function [1]. Plant species diversity (species richness and species identity) could enhance plant productivity through the selection effect and complementary effect [1,2,3,4]. However, most productivity measures did not account for the effects of heterotrophs on productivity [5,6,7]. Heterotrophs include herbivores, predators, scavengers, and pathogens. Previous studies showed that the removal of arthropods and foliar fungi increased plant biomass [8,9,10], while the removal of soil fungi increased the forb biomass in grassland systems [11]. Removing foliar fungi also increased the biomass of trees in forest systems [12]. Increasing the plant species diversity can increase the abundance of arthropods [13,14] or decrease the abundance of fungal pathogens [15], and the impact of heterotrophs on plant biomass may increase or decrease with an increasing plant species diversity. In addition, plant and microbial diversities may have complementary effects on nutrient cycling [16]; plant and herbivore diversities may have opposite effects on plant productivity [17]. Thus, considering the influence of heterotrophs on the plant species diversity–biomass relationship is necessary.
A few studies have concentrated on the impact of heterotroph removal on plant species diversity–biomass relationships [8,12]. In the grassland system, insecticide and fungicide treatments promoted the impact of plant diversity on productivity [8]. In forest systems, the positive relationship between tree species richness and productivity was eliminated when tree crowns were under a fungicide treatment [12]. However, all these studies were conducted in habitats with relatively low nitrogen (N) levels. The impact of heterotroph removal on the plant species diversity–biomass relationship in habitats with a high N level remains unclear.
Human activities such as industrial development and agricultural production have continuously increased atmospheric N deposition in the terrestrial ecosystem [18,19,20,21]. In habitats with a low N availability, N deposition could increase plant biomass [6,22,23]. Nevertheless, continuous N deposition could lead to N saturation, inhibited plant growth, and reduced plant biomass [24]. The increase in N availability in habitats may promote the growth of dominant plants, thereby increasing the selection effects [25]; it may also increase the complementary utilization of N by plants or promote interspecies interactions to enhance the complementary effect [7,26]. In addition, the increase in N availability in habitats may also alter the abundance of heterotrophs. For example, N addition reduced the number of soil microorganisms [27,28]. Thus, exploring the influence of heterotroph removal on plant species diversity–productivity relationships in high N habitats is necessary.
The functional traits of plant leaves and roots, such as the leaf area, root length, and root diameter, can reflect plants’ adaptability to the environment, their self-regulation ability in complex habitats, and their essential characteristics and effective utilization of resources [29]. Previous research showed that N deposition promoted the growth of the aboveground biomass of plants and specific leaf area [30,31], but excessive N would decrease the specific root length and belowground biomass [32]. The presence of herbivorous insects reduced the plant leaf area [33]. There was a direct interaction between soil microbial communities and roots; fungi and rhizobia could affect the ability of roots to capture nutrients from the soil [8,34].
To test how N addition and heterotroph exclusion affect the effect of plant species diversity on plant biomass, we conducted a three-factor (N addition, plant species diversity, and heterotrophic removal) control experiment, selecting three typical understory herbaceous plants, Perilla frutescens, Bletilla striata, and Bidens pilosa, to assemble the plant species diversity, and heterotroph removal was performed at each plant species diversity level. N deposition was simulated by N addition (10 g N m−2 yr−1). The plant above- and belowground biomasses and leaf and root functional traits of herbaceous plants were measured. We investigated the influence of heterotroph removal on plant biomass and functional traits in the system without/with N addition. We further investigated the effect of heterotroph removal on the plant diversity–biomass relationship in the system without/with N addition. We predicted that heterotroph exclusion and N addition may affect the plant species diversity–biomass relationship through the plant functional traits.
2. Results
2.1. Plant Biomass Responds to N Addition and Heterotroph Removal
N addition increased the plant biomass, with the plant aboveground, belowground, and total biomasses increased by 294.3%, 61.6%, and 178.5% on average, respectively (Figure 1). Under different heterotroph removal treatments, N addition improved the plant total and aboveground biomasses; under control and fungicide treatment groups, N addition also improved the plant belowground biomass (Figure 1).
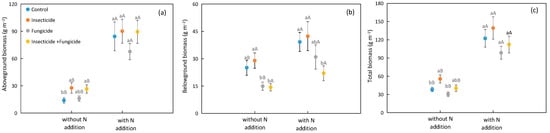
Figure 1.
Difference in plant (a) aboveground, (b) belowground, (c) total biomass among heterotroph removal with or without N addition. Significant differences between systems without or with nitrogen addition were indicated in capital letters, and significant differences among heterotroph removal were indicated in lowercase letters. Each circle represents the average biomass of all species compositions under each heterotroph removal treatment. Blue: control; orange: insecticide; gray: fungicide; yellow: all removal.
In systems without N addition, the insecticide treatment increased the plant aboveground biomass by 98.9%, and all removal treatments increased the plant aboveground biomass by 90.3% relative to the control (Figure 1a); insecticide treatment also increased the plant total biomass by 45.9% relative to the control (Figure 1c). In systems with N addition, the study did not discover significant differences in the aboveground and total biomasses among various heterotroph removal treatments (Figure 1a,c). In systems with or without N addition, all removal treatments decreased the plant belowground biomass by 42.9% and 43.9% relative to the control, but insecticide treatment did not affect the plant belowground biomass (Figure 1b).
2.2. The Relationship between Plant Species Diversity and Plant Biomass
Plant species richness significantly improved the plant aboveground biomass, but plant belowground and total biomasses did not respond to plant species richness (Table S1). Plant species compositions also significantly affected the plant aboveground, belowground, and total biomasses (Table S1).
In systems without N addition, the aboveground biomass of the B. pilosa monoculture was significantly higher than that of the P. frutescens monoculture and B. striata monoculture (Figure 2a), and the presence of B. pilosa significantly increased the plant aboveground and belowground biomasses under each heterotroph removal treatment (Table 1). It is worth noting that the plant total biomass was not affected by plant species identity in the control treatment. However, the plant total biomass was improved with fungicide treatment by 110.2% and all removal treatments by 155.8% when B. pilosa was present (Table 1).
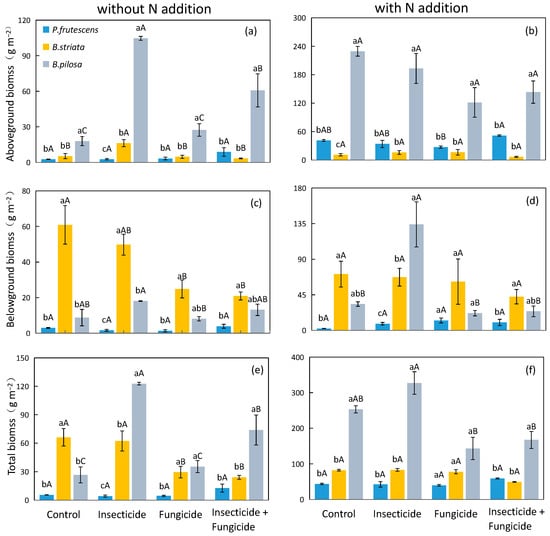
Figure 2.
Difference in monoculture plant aboveground biomass (a), belowground biomass (c), and total biomass (e) in systems without N addition and plant aboveground biomass (b), belowground biomass (d), and total biomass (f) in systems with N addition among heterotroph exclusion with or without N addition. Significant differences between heterotroph removal groups were indicated in capital letters, and significant differences between plant species monocultures were indicated in lowercase letters. Blue bars: P. frutescens monoculture; yellow bars: B. striata monoculture; gray bars: B. pilosa monoculture.

Table 1.
Plant biomass (aboveground, belowground, and total) responses to species identity without N addition; p values are displayed in bold font when p < 0.05.
In systems with N addition, the aboveground and total biomasses of the B. pilosa monoculture were significantly higher than those of the P. frutescens monoculture and B. striata monoculture (Figure 2b,f). Plant aboveground and total biomasses were improved when B. pilosa was present under each heterotroph removal treatment (Table 2). Significantly, the presence of B. striata decreased the aboveground biomass by 58.1% under control treatment, while the presence of B. striata did not affect the plant aboveground biomass after heterotroph removal. The presence of B. striata also increased the plant belowground biomass by 170.9% and 174.2%, respectively, under control and fungicide treatments (Table 2).
Table 2.
Plant biomass (aboveground, belowground, and total) responses to species identity with N addition; p values are displayed in bold font when p < 0.05.
2.3. Functional Traits of Plant Leaves and Roots Respond to N Addition and Heterotroph Removal
N addition increased the plant leaf area, root length, and root tip number by 49.5%, 95.9%, and 53.0% on average, respectively (Figure 3a,b,d). N addition increased the leaf area under control and all removal treatments (Figure 3a); N addition also increased the root length and root tip number in the insecticide, fungicide, and all removal treatment groups (Figure 3b,d); N addition reduced the root diameter under fungicide treatment (Figure 3c).
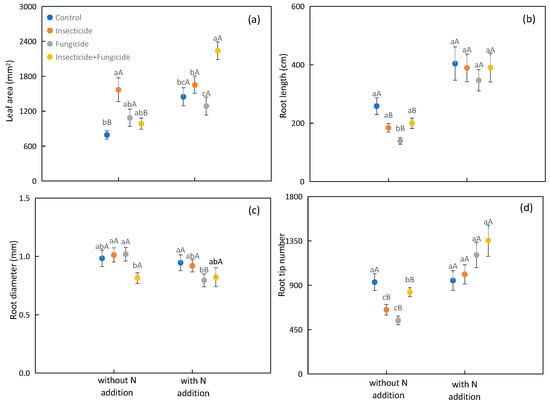
Figure 3.
Difference in plant functional traits of plant leaf area (a), root length (b), root diameter (c), and root tip number (d) among heterotroph removal with or without N addition. Significant differences between systems without or with nitrogen addition were indicated in capital letters, and significant differences between heterotroph removals were indicated in lowercase letters. Each circle represents the average plant functional traits of all species compositions. Blue: control; orange: insecticide; gray: fungicide; yellow: insecticide and fungicide.
In systems without N addition, the insecticide treatment increased the leaf area by 98.1% relative to the control (Figure 3a). Fungicide treatment decreased the root length by 46.2% relative to the control (Figure 3b). Insecticide treatment increased the root diameter by 19.5%, and fungicide treatment increased the root diameter by 20.0% relative to the all removal treatment (Figure 3c). The insecticide, fungicide, and all removal treatments decreased the root tip number by 30.0%, 41.7%, and 10.9% relative to the control, respectively (Figure 3d). In systems with N addition, the all removal treatment increased the leaf area by 54.7%, and fungicide treatment decreased the root diameter by 16.0% relative to the control (Figure 3a,c). There were no significant differences found in the plant root length and tip number among heterotroph removal treatments (Figure 3b,d).
2.4. The Relationship between Plant Species Diversity and Functional Traits of Plant Leaves and Roots
Species richness significantly affected the plant leaf area and root tip number but did not affect the root length and diameter (Table S1). The plant leaf area decreased when the species richness increased to two and three, while the root tip number increased when species richness increased to three. Plant species compositions also significantly affected the plant leaf area, root length, root diameter, and root tip number (Table S1).
In systems without N addition, the leaf area of the B. striata monoculture was significantly higher than that of the P. frutescens monoculture under control treatment groups (Figure 4a). However, the root diameter of the B. striata monoculture was significantly higher than that of the P. frutescens monoculture under each heterotroph removal treatment (Figure 4e), and the plant leaf area and root diameter were improved when B. striata was present (Table 3). The responses of plant root length and root tip number to the species identity were various under different heterotroph removal treatments. The presence of B. striata reduced the root tip number and root length of plants under control and insecticide treatments (Table 3), but the plant species identity did not affect root length under all heterotroph removal treatments.
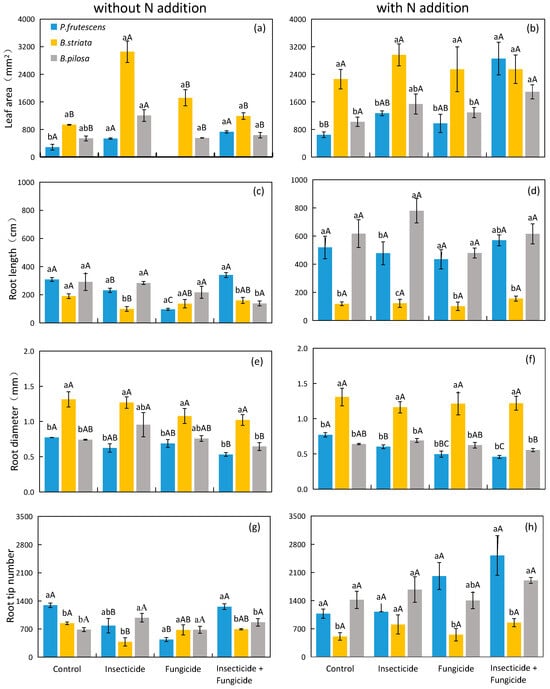
Figure 4.
Difference in monoculture plant leaf area (a), root length (c), root diameter (e), root tip number (g) in systems without N addition and leaf area (b), root length (d), root diameter (f), root tip number (h) in systems with N addition among heterotroph exclusion with or without N addition. Significant differences between heterotroph removals were indicated in capital letters, and significant differences between plant species monocultures were indicated in lowercase letters. Blue bars: P. frutescens monoculture; yellow bars: B. striata monoculture; gray bars: B. pilosa monoculture.
Table 3.
Functional traits of plant leaves and roots respond to species identity without N addition; p values are displayed in bold font when p < 0.05.
In systems with N addition, the root length of the B. striata monoculture was significantly lower than that of the B. pilosa monoculture (Figure 4d), and the presence of B. striata reduced the root length and root tip number under each heterotroph removal treatment. The presence of B. pilosa increased the plant root length under each heterotroph removal treatment (Table 4). The response of plant root length to the species identity remained unchanged after heterotroph removal treatment. The root diameter of the B. striata monoculture was significantly higher than that of the P. frutescens monoculture and B. pilosa monoculture (Figure 4f), and the presence of B. striata increased the root diameter under each heterotroph removal treatment (Table 4).
Table 4.
Functional traits of plant leaves and roots respond to species identity with N addition; p values are displayed in bold font when p < 0.05.
3. Discussion
3.1. The Effect of Heterotroph Removal on Plant Biomass
Previous work found that heterotroph removal can increase plant biomass, and the effects of different heterotroph removals on plant biomass were different, with the highest increase in insecticide treatment groups [8,12,35]. In systems without N addition, the insecticide treatment increased the plant aboveground biomass by 99.0% and total biomass by 54.0%, relative to the control (Figure 1a). Meanwhile, the insecticide treatment increased the leaf area by 98.1% relative to the control (Figure 3a). According to the plant survival strategy, the plant biomass increased with the increase in plant leaf area [36]. We also found a positive correlation between the plant total biomass and leaf area (Figure 5). Insecticide treatment may increase plant biomass by increasing the plant leaf area. Another reason may be that arthropods have a negative impact on biomass [11]; thereby, insecticide treatment accumulates the biomass removed by herbivorous insects. Unlike previous research results, the plant biomass usually increases after fungicide treatment [11]; the plant aboveground and total biomasses did not increase, and even the plant belowground biomass decreased after fungicide treatment in this study (Figure 1b). Fungicide could remove some pathogens. However, some symbiotic bacteria in the soil that are beneficial for plant growth were affected by the fungicide treatment [9]. In addition, the plant root length and root tip number for fungicide treatment groups were lower than those under the control treatment (Figure 3b,d). These results indicated that heterotroph removal may influence the plant biomass by affecting the plant functional traits.
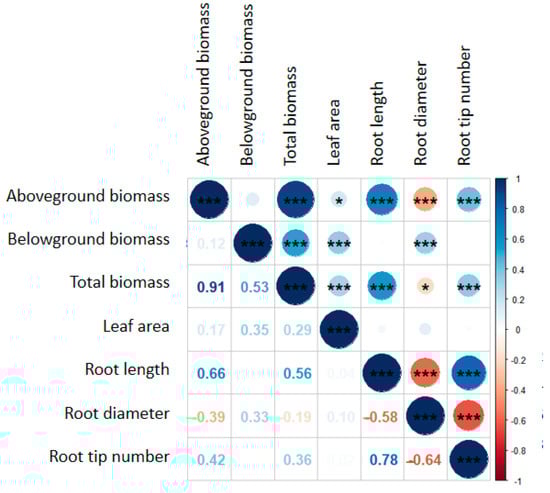
Figure 5.
Correlation analysis between various parameters. * represents a significant relationship (p < 0.05), *** represents a significant relationship (p < 0.001).
In systems with N addition, heterotroph removal did not affect the plant aboveground and total biomasses (Figure 1a,c). This result differs from those in systems without N addition (Figure 1a,c). N addition altered the effect of heterotroph removal on plant biomass. The possible reason may be that N addition provided sufficient environmental resources, increased plant N absorption, promoted photosynthesis, and increased plant biomass production [37], thereby reducing the effect of heterotroph removal on the plant biomass. The root system is the organ in which plants absorb nutrients from the soil, and roots can affect the plant biomass by affecting the soil nutrient turnover, nutrient utilization efficiency, and mycorrhizal infection. Heterotroph removal may affect the ecosystem function through plant functional traits [29,38,39]. In this study, there were no significant differences in the plant root length and diameter among heterotroph removal treatments in systems with N addition (Figure 3b,c). In addition, N addition may reduce the soil microbial community [40,41], further weakening the influence of heterotroph removal on plant biomass. These results indicated that the effect of heterotroph removal on plant biomass depends on the habitat N availability.
3.2. The Effect of Heterotroph Removal on Plant Species Richness–Biomass Relationship
Most research showed that plant productivity increased with the increase in plant species richness, and heterotroph removal altered the plant species diversity effect [4,8,12,42]. In the grassland system, removing the insecticide and fungicide treatments promoted the effect of plant species diversity on productivity [8]. However, in forest systems, a fungicide treatment eliminated the positive relationship between tree species richness and productivity [12]. In this study, the plant biomass did not respond to species richness under each heterotroph removal treatment in systems without N addition (Figure S1a,c,e). The reason may be that only three lower levels of richness were set in this experiment (1, 2, and 3), while most experiments were set to high levels of richness [9,14,43].
In systems with N addition, the impact of the plant species richness on plant aboveground and total biomasses was positive under all removal treatments (Figure S1b,f). High plant species richness improved the plant biomass through enhancing nutrient utilization [44], and N addition may promote this effect. Meanwhile, insecticide and fungicide treatments removed arthropods, leaf fungi, and soil fungi that could reduce plant biomass, causing a significant increase in the plant aboveground and total biomasses when species richness was three (Figure S1b,f). However, plant species richness had a negative impact on the plant belowground biomass under an insecticide treatment (Figure S3d). The reason may be that the abundance of arthropods increased with an increasing plant species richness [45], which may consume more plant leaf area. There was a positive correlation between the plant leaf area and belowground biomass (Figure 5), ultimately leading to a decrease in the plant belowground biomass with an increasing species richness under an insecticide treatment.
3.3. The Effect of Heterotroph Removal on the Effect of Plant Species Identity on Plant Biomass
Plant species identity is an important part of plant species diversity [1], and many studies have shown that the plant species identity affects plant biomass [42,46]. In systems without N addition, the presence of B. striata increased the plant belowground biomass under each heterotroph removal treatment (Table 1); the presence of B. striata also increased the plant leaf area and root diameter (Table 3). There was a significant positive correlation between the leaf area, root diameter, and plant belowground biomass (Figure 5). These results suggested that plant species identity affected the plant biomass by influencing the plant functional traits.
In systems with N addition, the presence of B. striata increased the plant belowground biomass in the control group, while this effect was dismissed after insecticide and fungicide treatments (Table 2). Meanwhile, the change pattern in the plant leaf area of B. striata was consistent with that of the plant belowground biomass (Table 4). Moreover, there was a significant positive correlation between the plant leaf area and plant belowground biomass (Figure 5), indicating that heterotroph removal altered the effect of species identity on the plant biomass by influencing the plant leaf area. In addition, N addition may change the interaction between plant species [26]. In this study, under insecticide or fungicide treatments, the relative yield of B. striata in systems with N addition was higher than that in systems without N addition (Figure S2). We also found that the selection effect became increasingly important in systems with N addition, resulting in an increase in the net biodiversity effect (Figure S3). Interestingly, the presence of B. striata decreased the plant aboveground biomass in the control group but did not affect the plant aboveground biomass after heterotroph removal treatment (Table 4). This study also found that the presence of B. striata increased the plant root diameter but decreased the plant root length and root tip number under each heterotroph removal treatment (Table 4). We observed a significant positive correlation between the plant root length, root tip number, and plant aboveground biomass, and a negative correlation between the root diameter and plant aboveground (Figure 5). These results also indicated that heterotroph removal changed the plant species identity’s effect on plant biomass by affecting the plant functional traits.
4. Materials and Methods
4.1. Experimental Design
The experiment was set up in a greenhouse at Wenzhou University in Wenzhou, Zhejiang Province, China (120°42′4″ E, 27°55′46″ N). The climate was a subtropical monsoon climate. The greenhouse has a transparent plastic roof, shielding the experiment from rainwater while maintaining temperature and humidity levels. A shading net was installed above the plastic roof to simulate the light environment under the forest. A three-factor control experiment was conducted (Figure 6): (1) species diversity: based on the functional trait, three local common understory herbaceous plants were chosen: Perilla frutescens (L.) Britt, Bletilla striata, and Bidens pilosa L. (Table S2) for plant species diversity configuration (all seven plant species compositions); (2) heterotroph removal treatments: control, insecticide, fungicide, and both insecticide and fungicide treatments; (3) N addition: N deposition was simulated by N addition, using without N addition as the control. There are four repetitions for each treatment. In total, 224 pots (30 cm diameter and 20 cm height) were constructed.
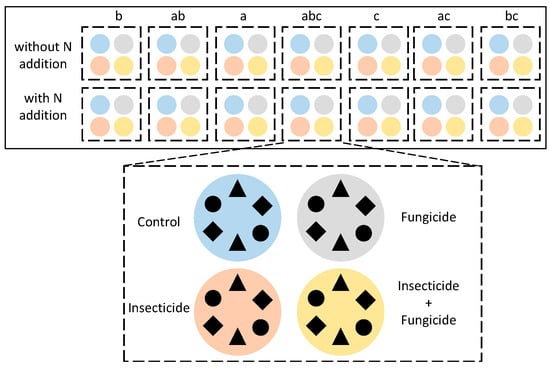
Figure 6.
Experimental design (one block). The letters above the uppermost boxes represent plant species compositions, and species compositions within each group are randomly arranged. Colors represent heterotroph removal treatments: blue: control; orange: insecticide; gray: fungicide; yellow: insecticide and fungicide. The three-species treatment is depicted here, with different shapes representing different species. Six plants are planted in each experimental system uniformly.
In April 2022, the seedlings of the plants were transplanted into pots, with six individuals planted in each pot. From the end of April to the beginning of September, heterotroph removal treatment and N addition treatment were conducted once a month. According to Seabloom et al. (2017), insects were removed by spraying an insecticide water emulsion (0.03% permethrin), fungi were removed by spraying fungicide (30% carbendazim), and the control group added an equal volume of water. Based on the environmental wet N deposition rate in Zhejiang Province (2.69 g N m−2 yr−1), we added ammonium nitrate (NH4NO3) solution every month to simulate high N conditions, with an average amount added each time (10 g N m−2 yr−1), and we added water as a control group.
Pesticides may impact plant growth even in the system without heterotrophs. Therefore, we designed a laboratory to test the impact of insecticides and fungicides on the plant biomass. The soil was homogenized and subjected to high-pressure steam treatment. Three plant species were treated with four heterotroph removal treatments, and each treatment had four replicates, totaling 48 pots with one individual in each pot. The heterotroph removal treatment was applied once a month, and the application amount was the same as the field experiment. Plants were allowed to grow for a total of ten weeks. After ten weeks, harvest each plant and divide it into aboveground and belowground biomasses. Results showed that heterotroph removal treatments do not affect plant biomass in the indoor experiment without consumers (Figure S4).
4.2. Sample Collection and Calculation
Plants were harvested at the end of the plant growth period. After washing harvested plants, three complete leaves and three roots were taken from each plant in each pot. After scanning with a scanner (EPSON GT-X980, Hangzhou, China), the images were analyzed and processed using the Wanshen leaf processing system (version 2018; www.Wseen.com) to obtain the leaf area, root length, root diameter, and number of root tips. Divide the plants into aboveground and belowground parts, dry at 105 °C for 20 min, then dry at 65 °C for 48 h to obtain each species’ aboveground and belowground biomass for each pot. The net effects, complementary effects, and selection effects were calculated according to Loreau and Hector’s calculation method [47]. The net effect refers to the difference between the observed yield (actual yield) and the expected yield (weighted average of individual yield corresponding to species in the mixture based on planting proportion) of the mixture. Complementary effects are measured from changes in the relative yield of species. The selection effect is measured by subtracting the complementary effect from the net effect.
- Plant functional traits of leaves and roots:
To evaluate the response of plant functional traits to N addition and heterotroph removal treatments at the community level, the functional traits’ community weighted mean (CWM) was calculated:
where Eic represents species i’s plant functional traits in composition c, Bic represents species i’s biomass in composition c (when calculating plant leaf area’s CWM, the Bic referred to the proportion of species i’s aboveground biomass in composition c’s aboveground biomass; when calculating plant root traits’ CWM, the Bic referred to the proportion of plant species i’s belowground biomass in composition c’s belowground biomass of composition c), and s referred to species’ amount in composition c.
- 2.
- Relative yield:
To evaluate whether N addition alter the competitiveness of specific species in the mixture, relative yield (RY) of the plant was calculated:
where Oi represents the aboveground biomass of species i per plant in the mixture, while Ei represents the aboveground biomass of species i per plant in the monoculture. If RYi > 1, species i is the dominant species in the mixture.
4.3. Statistical Analysis
The influence of species diversity (species compositions and species richness), N addition, and heterotroph removal treatment on the plant biomass (aboveground, belowground, and total) and functional traits of plant leaves and roots was determined using a three-way ANOVA. The effects of plant species richness on plant biomass under each heterotroph removal treatment were tested using linear regression analysis. The difference in the above parameters between systems with and without N addition under the same heterotroph removal treatment was tested using an independent sample t-test. The effect of heterotroph removal treatment or plant species compositions on the above parameters under the same N habitat level was determined using a one-way ANOVA. If there were significant differences, the Tukey method was conducted. The effect of the plant species identity (the presence of certain species) on each parameter was determined using an independent sample t-test. The difference between the zero and net effects, complementary effects, and selection effects was examined using a single sample t-test. The correlations of various parameters were verified using Pearson’s correlation analysis. Before analysis, the data were ln-transformed to satisfy the equality of variance (Levene’s test) and assumptions of normality (Kolmogorov–Smirnov test). If the data after conversion still did not fulfill the assumptions, a nonparametric Kruskal–Wallis test was employed. All statistical analyses were conducted using the R4.1.1 program. All data were delivered as the mean ± standard error, and the statistical significance level was set as α = 0.05.
5. Conclusions
This study investigated the relationship between the plant species diversity and biomass response to heterotroph removal in systems with and without N addition. Our research findings indicate that heterotroph removal affected plant biomass by influencing the plant leaf area in both systems with or without N addition, and altered the effect of the plant species richness–plant biomass relationship by influencing the plant leaf area in systems with N addition but not in systems without N addition. Heterotroph removal also affected the effect of species identity on the plant biomass by influencing the plant functional traits in both systems with or without N addition. Therefore, it is recommended that in the background of global N deposition, the impact of other trophic level organisms on ecosystem functioning cannot be ignored when analyzing the species diversity–ecosystem functions relationship. In terms of ecosystem management, biodiversity at different trophic levels should be protected. In the future, more high plant species diversity experiments with long-term research are needed to determine the impact of heterotrophs on biodiversity–ecosystem function relationships in high-N habitats.
Supplementary Materials
The following supporting information can be downloaded at: https://www.mdpi.com/article/10.3390/plants13020258/s1, Table S1: Three-way ANOVA Table (a) Effects of nitrogen addition, species compositions, heterotrophs removal treatment, and (b) Effects of nitrogen addition, species richness, and heterotrophs removal treatment on above-, below-ground, total biomass and functional traits of plant leaves and roots; Table S2: The plant functional traits of Perilla frutescens, Bletilla striata and Bidens pilosa; Figure S1. Linear regression of species richness on plant aboveground biomass (a), belowground biomass (c), and total biomass (e) in systems without N addition and plant aboveground biomass (b), belowground biomass (d), and total biomass (f) in systems with N addition under different heterotrophs removal treatment. Figure S2. The relative yield of B. pilosa under different heterotroph treatments and N availability. Significant differences between heterotroph removal were indicated in capital letters, and significant differences between N availability were indicated in lowercase letters. Blue circle: without N addition; yellow, with N addition. Figure S3. Net effect of aboveground biomass (a), belowground biomass (b), and total biomass (c); complementary effect of aboveground biomass (d), belowground biomass (e), and total biomass (f); selection effect of aboveground biomass (g), belowground biomass (h), and total biomass (j) under different heterotroph removal treatments. * Represents a significant effect under this treatment. Blue bar: control; orange, insecticide; gray, fungicide; yellow, insecticide and fungicide. Figure S4. Aboveground (a), belowground (b), and total biomass (c) of plant monoculture under different heterotrophs treatments. Same lowercase letters indicate no difference between het-erotrophs removal. Blue bar: control; orange, insecticide; gray, fungicide; yellow, insecticide and fungicide.
Author Contributions
Conceptualization, W.H.; funding acquisition, W.H.; investigation, X.X., L.Y., K.S., H.C. and Y.L.; writing—original draft, X.X.; writing—review and editing, X.X., L.Y., K.S., H.C., Y.L., J.L. and W.H. All authors have read and agreed to the published version of the manuscript.
Funding
This research was funded by the National Natural Science Foundation of China (31901213) and Zhejiang Provincial Natural Science Foundation (LY22C030003).
Data Availability Statement
Data are available on request from the authors. The data are not publicly available due to [Some data are acquired from other collaborators].
Acknowledgments
We thank Yanru Huang, Wenhao Wu, and Shengtao Zhou for their assistance in the field and laboratory work.
Conflicts of Interest
The authors declare no conflicts of interest.
References
- Tilman, D.; Isbell, F.; Cowles, M.J. Biodiversity and ecosystem functioning. Annu. Rev. Ecol. Evol. Syst. 2014, 45, 471–493. [Google Scholar] [CrossRef]
- Tilman, D.; Knops, J.; Wedin, D.; Reich, P.; Ritchie, M.; Siemann, E. The influence of functional diversity and compositions on ecosystem processes. Science 1997, 277, 1300–1302. [Google Scholar] [CrossRef]
- Tilman, D.; Reich, P.B.; Knops, J.; Wedin, D.; Mielke, T.; Lehman, C. Diversity and productivity in a long-term grassland experiment. Science 2001, 294, 843–845. [Google Scholar] [CrossRef]
- van der Plas, F. Biodiversity and ecosystem functioning in naturally assembled communities. Biol. Rev. 2019, 94, 1220–1245. [Google Scholar] [CrossRef]
- He, J.S.; Bazzaz, F.A.; Schmid, B. Interactive effects of diversity nutrients and elevated CO2 on experimental plant communities. Oikos 2002, 97, 337–348. [Google Scholar] [CrossRef]
- Isbell, F.; Reich, P.B.; Tilman, D.; Hobbie, S.E.; Polasky, S.; Binder, S. Nutrient enrichment biodiversity loss and consequent declines in ecosystem productivity. Proc. Natl. Acad. Sci. USA 2013, 110, 11911–11916. [Google Scholar] [CrossRef]
- Roscher, C.; Schmid, B.; Kolle, O.; Schulze, E.D. Complementarity among four highly productive grassland species depends on resource availability. Oecologia 2016, 181, 571–582. [Google Scholar] [CrossRef]
- Seabloom, E.W.; Kinkel, L.; Borer, E.T.; Hautier, Y.; Montgomery, R.A.; Tilman, D. Food webs obscure the strength of plant diversity effects on primary productivity. Ecol. Lett. 2017, 20, 505–512. [Google Scholar] [CrossRef]
- Zaret, M.M.; Kuhs, M.A.; Anderson, J.C.; Seabloom, E.W.; Borer, E.T.; Kinkel, L.L. Seasonal shifts from plant diversity to consumer control of grassland productivity. Ecol. Lett. 2022, 25, 1215–1224. [Google Scholar] [CrossRef]
- Zaret, M.M.; Kinkel, L.L.; Borer, E.T.; Seabloom, E.W. Soil nutrients cause threefold increase in pathogen and herbivore impacts on grassland plant biomass. J. Ecol. 2023, 111, 1629–1640. [Google Scholar] [CrossRef]
- Seabloom, E.W.; Borer, E.T.; Kinkel, L.L. No evidence for trade-offs in plant responses to consumer food web manipulations. Ecology 2018, 99, 1953–1963. [Google Scholar] [CrossRef] [PubMed]
- Huang, Y.Y.; Schuldt, A.; Hönig, L.; Yang, B.; Liu, X.J.; Bruelheide, H.; Ma, K.P.; Schmid, B.; Niklaus, P.A. Effects of enemy exclusion on biodiversity–productivity relationships in a subtropical forest experiment. J. Ecol. 2022, 110, 2167–2178. [Google Scholar] [CrossRef]
- Borer, E.T.; Seabloom, E.W.; Tilman, D. Plant diversity controls arthropod biomass and temporal stability. Ecol. Lett. 2012, 15, 1457–1464. [Google Scholar] [CrossRef]
- Porazinska, D.L.; Farrer, E.C.; Spasojevic, M.J.; de Mesquita, C.P.B.; Sartwell, S.A.; Smith, J.G.; White, C.T.; King, A.J.; Suding, K.N.; Schmidt, S.K. Plant diversity and density predict belowground diversity and function in an early successional alpine ecosystem. Ecology 2018, 99, 1942–1952. [Google Scholar] [CrossRef] [PubMed]
- Keesing, F.; Holt, R.D.; Ostfeld, R.S. Effects of species diversity on disease risk. Ecol. Lett. 2006, 9, 485–498. [Google Scholar] [CrossRef]
- Jing, X.; Sanders, N.J.; Shi, Y.; Chu, H.Y.; Classen, A.T.; Zhao, K.; Chen, L.T.; Shi, Y.; Jiang, Y.X.; He, J.S. The links between ecosystem multifunctionality and above- and belowground biodiversity are mediated by climate. Nat. Commun. 2015, 6, 8159. [Google Scholar] [CrossRef]
- Duffy, J.E.; Cardinale, B.J.; Mcintyre, P.B.; Thebault, E.; Loreau, M. The functional role of biodiversity in ecosystems: Incorporating trophic complexity. Ecol. Lett. 2007, 10, 522–538. [Google Scholar] [CrossRef]
- Galloway, J.N.; Dentener, F.J.; Capone, D.G.; Boyer, E.W.; Howarth, R.W.; Seitzinger, S.P.; Asner, G.P.; Cleveland, C.C.; Green, P.A.; Holland, E.A.; et al. Nitrogen cycles: Past, present, and future. Biogeochemistry 2004, 70, 153–226. [Google Scholar] [CrossRef]
- Ackerman, D.; Millet, D.B.; Chen, X. Global estimates of inorganic nitrogen deposition across four decades. Glob. Biogeochem. Cycles 2019, 33, 100–107. [Google Scholar] [CrossRef]
- Wilcots, M.E.; Schroeder, K.M.; Delancey, L.C.; Kjaer, S.J.; Hobbie, S.E.; Seabloom, E.W.; Borer, E.T. Realistic rates of nitrogen addition increase carbon flux rates but do not change soil carbon stocks in a temperate grassland. Glob. Chang. Biol. 2022, 28, 4819–4831. [Google Scholar] [CrossRef]
- Ke, Y.G.; Yu, Q.; Wang, H.Q.; Zhao, Y.; Jia, X.T.; Yang, Y.D.; Zhang, Y.L.; Zhou, W.; Wu, H.H.; Xu, C.; et al. The potential bias of nitrogen deposition effects on primary productivity and biodiversity. Glob. Chang. Biol. 2022, 29, 1054–1061. [Google Scholar] [CrossRef] [PubMed]
- Bai, Y.F.; Wu, J.G.; Clark, C.M.; Naeem, S.; Pan, Q.M.; Huang, J.H.; Zhang, L.X.; Han, X.G. Tradeoffs and thresholds in the effects of nitrogen addition on biodiversity and ecosystem functionsing: Evidence from inner Mongolia Grasslands. Glob. Chang. Biol. 2010, 16, 358–372. [Google Scholar] [CrossRef]
- Seabloom, E.W.; Adler, P.B.; Alberti, J.; Biederman, L.; Buckley, Y.M.; Cadotte, M.W.; Collins, S.L.; Dee, L.; Fay, P.A.; Firn, J.; et al. Increasing effects of chronic nutrient enrichment on plant diversity loss and ecosystem productivity over time. Ecology 2021, 102, e03218. [Google Scholar] [CrossRef] [PubMed]
- Tian, D.H.; Wang, H.; Sun, J.; Niu, S.L. Global evidence on nitrogen saturation of terrestrial ecosystem net primary productivity. Environ. Res. Lett. 2016, 11, 024012. [Google Scholar] [CrossRef]
- Fridley, J.D. Resource availability dominates and alters the relationship between species diversity and ecosystem productivity in experimental plant communities. Oecologia 2002, 132, 271–277. [Google Scholar] [CrossRef] [PubMed]
- Grime, J.P. Evidence for the existence of three primary strategies in plants and its relevance to ecological and evolutionary theory. Am. Nat. 1977, 111, 1221–1226. [Google Scholar] [CrossRef]
- Frey, S.D.; Knorr, M.; Parrent, J.L.; Simpson, R.T. Chronic nitrogenenrichment affects the structure and function of the soil microbialcommunity in temperate hardwood and pine forests. Forest Ecol. Manag. 2004, 196, 159–171. [Google Scholar] [CrossRef]
- Zhang, Y.J.; Jin, Y.H.; Xu, J.W.; He, H.S.; Tao, Y.; Yang, Z.P.; Bai, Y.Y. Effects of exogenous N and endogenous nutrients on alpine tundra litter decomposition in an area of high nitrogen deposition. Sci. Total Environ. 2021, 805, 150388. [Google Scholar] [CrossRef]
- Liu, C.C.; Li, Y.; Yan, P.; He, N.P. How to Improve the Predictions of Plant Functional Traits on ecosystem functioning? Front. Plant Sci. 2021, 12, 622260. [Google Scholar] [CrossRef]
- Tatarko, A.R.; Knops, J.M.H. Nitrogen addition and ecosystem functioning: Both species abundances and traits alter community structure and function. Ecosphere 2018, 9, e02087. [Google Scholar] [CrossRef]
- Yan, P.; He, N.P.; Yu, K.L.; Xu, L.; Van Meerbeek, K. Integrating multiple plant functional traits to predict ecosystem productivity. Commun. Biol. 2023, 6, 239. [Google Scholar] [CrossRef] [PubMed]
- Gao, W.; Chen, D.; Hu, X.; Fang, X.; Li, Q.; Huang, Q.; Sun, F.; Zhou, J.; Bai, Y.; Zhang, J.; et al. Nitrogen deposition drives the intricate changes of fine root traits. Glob. Ecol. Conserv. 2023, 43, e02443. [Google Scholar] [CrossRef]
- Price, P.W. The plant vigor hypothesis and herbivore attack. Oikos 1991, 62, 244–251. [Google Scholar] [CrossRef]
- Bardgett, R.D.; Mommer, L.; De Vries, F.T. Going belowground: Root traits as drivers of ecosystem processes. Trends Ecol. Evol. 2014, 29, 692–699. [Google Scholar] [CrossRef] [PubMed]
- Bruno, J.F.; Boyer, K.E.; Duffy, J.E.; Lee, S.C. Relative and interactive effects of plant and grazer richness in a benthic marine community. Ecology 2008, 89, 2518–2528. [Google Scholar] [CrossRef] [PubMed]
- Reich, P.B.; Walters, M.B.; Ellsworth, D.S. From tropics to tundra: Global convergence in plant functioning. Proc. Natl. Acad. Sci. USA 1997, 94, 13730–13734. [Google Scholar] [CrossRef]
- Lawlor, D.W.; Lemaire, G.; Gastal, F. Nitrogen, plant growth and crop yield. In Plant Nitrogen; Lea, P.J., Morot-Gaudry, J.F., Eds.; Springer: Berlin/Heidelberg, Germany, 2001; pp. 343–367. [Google Scholar]
- Diaz, S.; Cabido, M. Vive la différence: Plant functional diversity matters to ecosystem processes. Trends Ecol. Evol. 2001, 16, 646–655. [Google Scholar] [CrossRef]
- Faucon, M.P.; Houben, D.; Lambers, H. Plant functional traits: Soil and ecosystem services. Trends Plant Sci. 2017, 22, 385–394. [Google Scholar] [CrossRef]
- Zhou, Z.H.; Wang, C.K.; Zheng, M.H.; Jiang, L.F.; Luo, Y.Q. Patterns and mechanisms of response by soil microbial communities to nitrogen addition. Soil Biol. Biochem. 2017, 115, 433–441. [Google Scholar] [CrossRef]
- Averill, C.; Waring, B. Nitrogen limitation of decomposition and decay: How can it occur? Glob. Chang. Biol. 2018, 24, 1417–1427. [Google Scholar] [CrossRef]
- Han, W.J.; Chang, J.; Jiang, H.; Niu, S.D.; Liu, Y.; Xu, J.M.; Wu, J.Z.; Ge, Y. Plant species diversity affects plant nutrient pools by affecting plant biomass and nutrient concentrations in high-nitrogen ecosystems. Basic Appl. Ecol. 2021, 56, 213–225. [Google Scholar] [CrossRef]
- Tilman, D. Biodiversity: Population Versus Ecosystem Stability. Ecology 1996, 77, 350–363. [Google Scholar] [CrossRef]
- Knops, J.M.H.; Bradley, K.L.; Wedin, D.A. Mechanisms of plant species impacts on ecosystem nitrogen cycling. Ecol. Lett. 2002, 5, 454–466. [Google Scholar] [CrossRef]
- Haddad, N.M.; Tilman, D.; Haarstad, J.; Ritchie, M.; Knops, J.M.H. Contrasting effects of plant richness and composition on insect communities: A field experiment. Am. Nat. 2001, 158, 17–35. [Google Scholar] [CrossRef]
- Luo, B.; Du, Y.Y.; Han, W.J.; Geng, Y.; Wang, Q.; Duan, Y.Y.; Ren, Y.; Liu, D.; Chang, J.; Ge, Y. Reduce health damage cost of greenhouse gas and ammonia emissions by assembling plant diversity in floating constructed wetlands treating wastewater—ScienceDirect. J. Clean. Prod. 2020, 244, 118927. [Google Scholar] [CrossRef]
- Loreau, M.; Hector, A. Partitioning selection and complementarity in biodiversity experiments. Nature 2001, 412, 72–76. [Google Scholar] [CrossRef]
Disclaimer/Publisher’s Note: The statements, opinions and data contained in all publications are solely those of the individual author(s) and contributor(s) and not of MDPI and/or the editor(s). MDPI and/or the editor(s) disclaim responsibility for any injury to people or property resulting from any ideas, methods, instructions or products referred to in the content. |
© 2024 by the authors. Licensee MDPI, Basel, Switzerland. This article is an open access article distributed under the terms and conditions of the Creative Commons Attribution (CC BY) license (https://creativecommons.org/licenses/by/4.0/).