Article

Aster × chusanensis Growth and Phenolic Acid Composition under Different Cultivation Temperatures

1
Department of GreenBio Science, Gyeongsang National University, Jinju 52725, Republic of Korea
2
Biological Resources Assessment Division, National Institute of Biological Resources, Miryang 50452, Republic of Korea
3
Division of Horticultural Science, College of Agriculture & Life Science, Gyeongsang National University, Jinju 52725, Republic of Korea
4
Species Diversity Research Division, National Institute of Biological Resources, Incheon 22689, Republic of Korea
*
Authors to whom correspondence should be addressed.
These authors contributed equally to this work.
Plants 2024, 13(13), 1855; https://doi.org/10.3390/plants13131855
Submission received: 27 May 2024 / Revised: 3 July 2024 / Accepted: 4 July 2024 / Published: 5 July 2024
(This article belongs to the Special Issue Chemical Characteristics and Bioactivity of Plant Natural Products)

Abstract

:
Plants of the Asteraceae family have been cultivated worldwide for economic, medicinal, and ornamental purposes, including genera such as Aster, Helianthus, and Cosmos. Numerous studies examined their secondary metabolites; however, those of Aster × chusanensis, which is a natural hybrid species in South Korea, are unclear, and optimized propagation methods should be identified. We analyzed phenolic acid concentrations in each part of Aster × chusanensis through HPLC. Further, we investigated the growth characteristics and secondary metabolite concentrations under various growth temperatures using division propagation, followed by growing at 20, 25, and 30 °C in a growth chamber. Chlorogenic acid was the primary compound, which was particularly high in the leaves. The growth characteristics did not differ significantly between temperatures, and 30 °C was most efficient for phenolic acid biosynthesis. Our results provide valuable information on optimized propagation and secondary metabolite concentrations under different temperatures of Aster × chusanensis.

1. Introduction

Plants of the Asteraceae family are frequently cultivated worldwide because of their prominent economic, medicinal, and ornamental purposes [1]. This family comprises approximately 2000 genera and 23,000 species [2]. Aster, Helianthus, Callistephus, and Cosmos are well-known Asteraceae genera. The genus Aster comprises several species, including A. glehnii F. Schmidt, A. ageratoides Turcz., A. oharai Nakai, A. spathulifolius Maxim., and Aster × chusanensis. Among these, A. ageratoides Turcz. is a traditional medicinal plant that is rich in phenolic compounds and is frequently cultivated in the Republic of Korea [3]. A. glehni is the principal native vegetable found on Ulleung Island, Republic of Korea, and its leaves contain numerous terpenoids, quinic acid derivatives, and flavonoids [4]. A. oharai Nakai is mainly distributed in the eastern area of Korea, and its aerial parts have been used in traditional Korean medicine to treat asthma and diuresis [5]. Aster × chusanensis Y.S. Lim, Hyun, Y.D. Kim and H.C. Shin was discovered in Ulleungdo, Ulleung-gun, Gyeongsangbuk-do, Republic of Korea, [6] and is a natural hybrid species whose parents are A. pseudoglehnii and A. oharai Nakai [7].
Many Asteraceae species have biological and medicinal properties. For example, sunflower (Helianthus annuus L.) seeds, an oilseed crop, possess anti-oxidant activity [8]. The roots of Inula helenium contain various secondary metabolites, such as flavonoids, terpenes, and phenolic acids [9].
Phenolic compounds exhibit anti-oxidant effects [10] and anti-allergic [11] and anti-arthritic activities [12]. A. glehni leaves can exert anti-oxidant, anti-inflammatory [13], sedative, and anticonvulsant effects [14], and ethanol extract from A. glehni can be used to treat gout owing to a xanthine oxidase inhibitor [15].
Plants use various defense mechanisms in response to environmental stress, such as producing secondary metabolites, and flavonoids and terpenoids have been shown to accumulate under low-temperature stress [16]. Furthermore, plants can survive in extreme environments by stimulating transcription factors related to the biosynthesis of phenolic compounds, such as anthocyanins and carotenoids, which occurs under high-temperature stress [17].
Closed-type plant production systems, such as vertical farms, offer a controlled environment for year-round crop production. This allows for the precise regulation of light, temperature, and humidity, thereby enabling the manipulation of specific environmental factors [18]. In this context, it is important to explore the potential of plants in the Asteraceae family for various applications in the food industry, cosmetics, and medicine. Comprehensive research is needed to fully understand and characterize these species, including their cultivation methods, identification, and the development of dietary supplements or pharmaceutical-based products [19]. In addition, elucidating the effects of growth temperature on phenolic acid degradation will help to determine their role in the accumulation of each part. Various Asteraceae species have been well studied with regard to their functional compounds; however, the functional compounds of Aster × chusanensis are unknown because the species was described only recently. Molecular studies have been performed to elucidate the hybridization origin and morphology of Aster × chusanensis [7], whereas basic research on its secondary metabolites is currently scarce. Therefore, this study was conducted to confirm efficient cultivation methods and secondary metabolite enhancement methods for domestic native species within closed-type plant production systems by (1) investigating the distribution of phenolic acids in all Aster × chusanensis plant parts and (2) confirming the changing pattern of phenolic acid concentration in each part according to different growth temperature conditions.

2. Results and Discussion

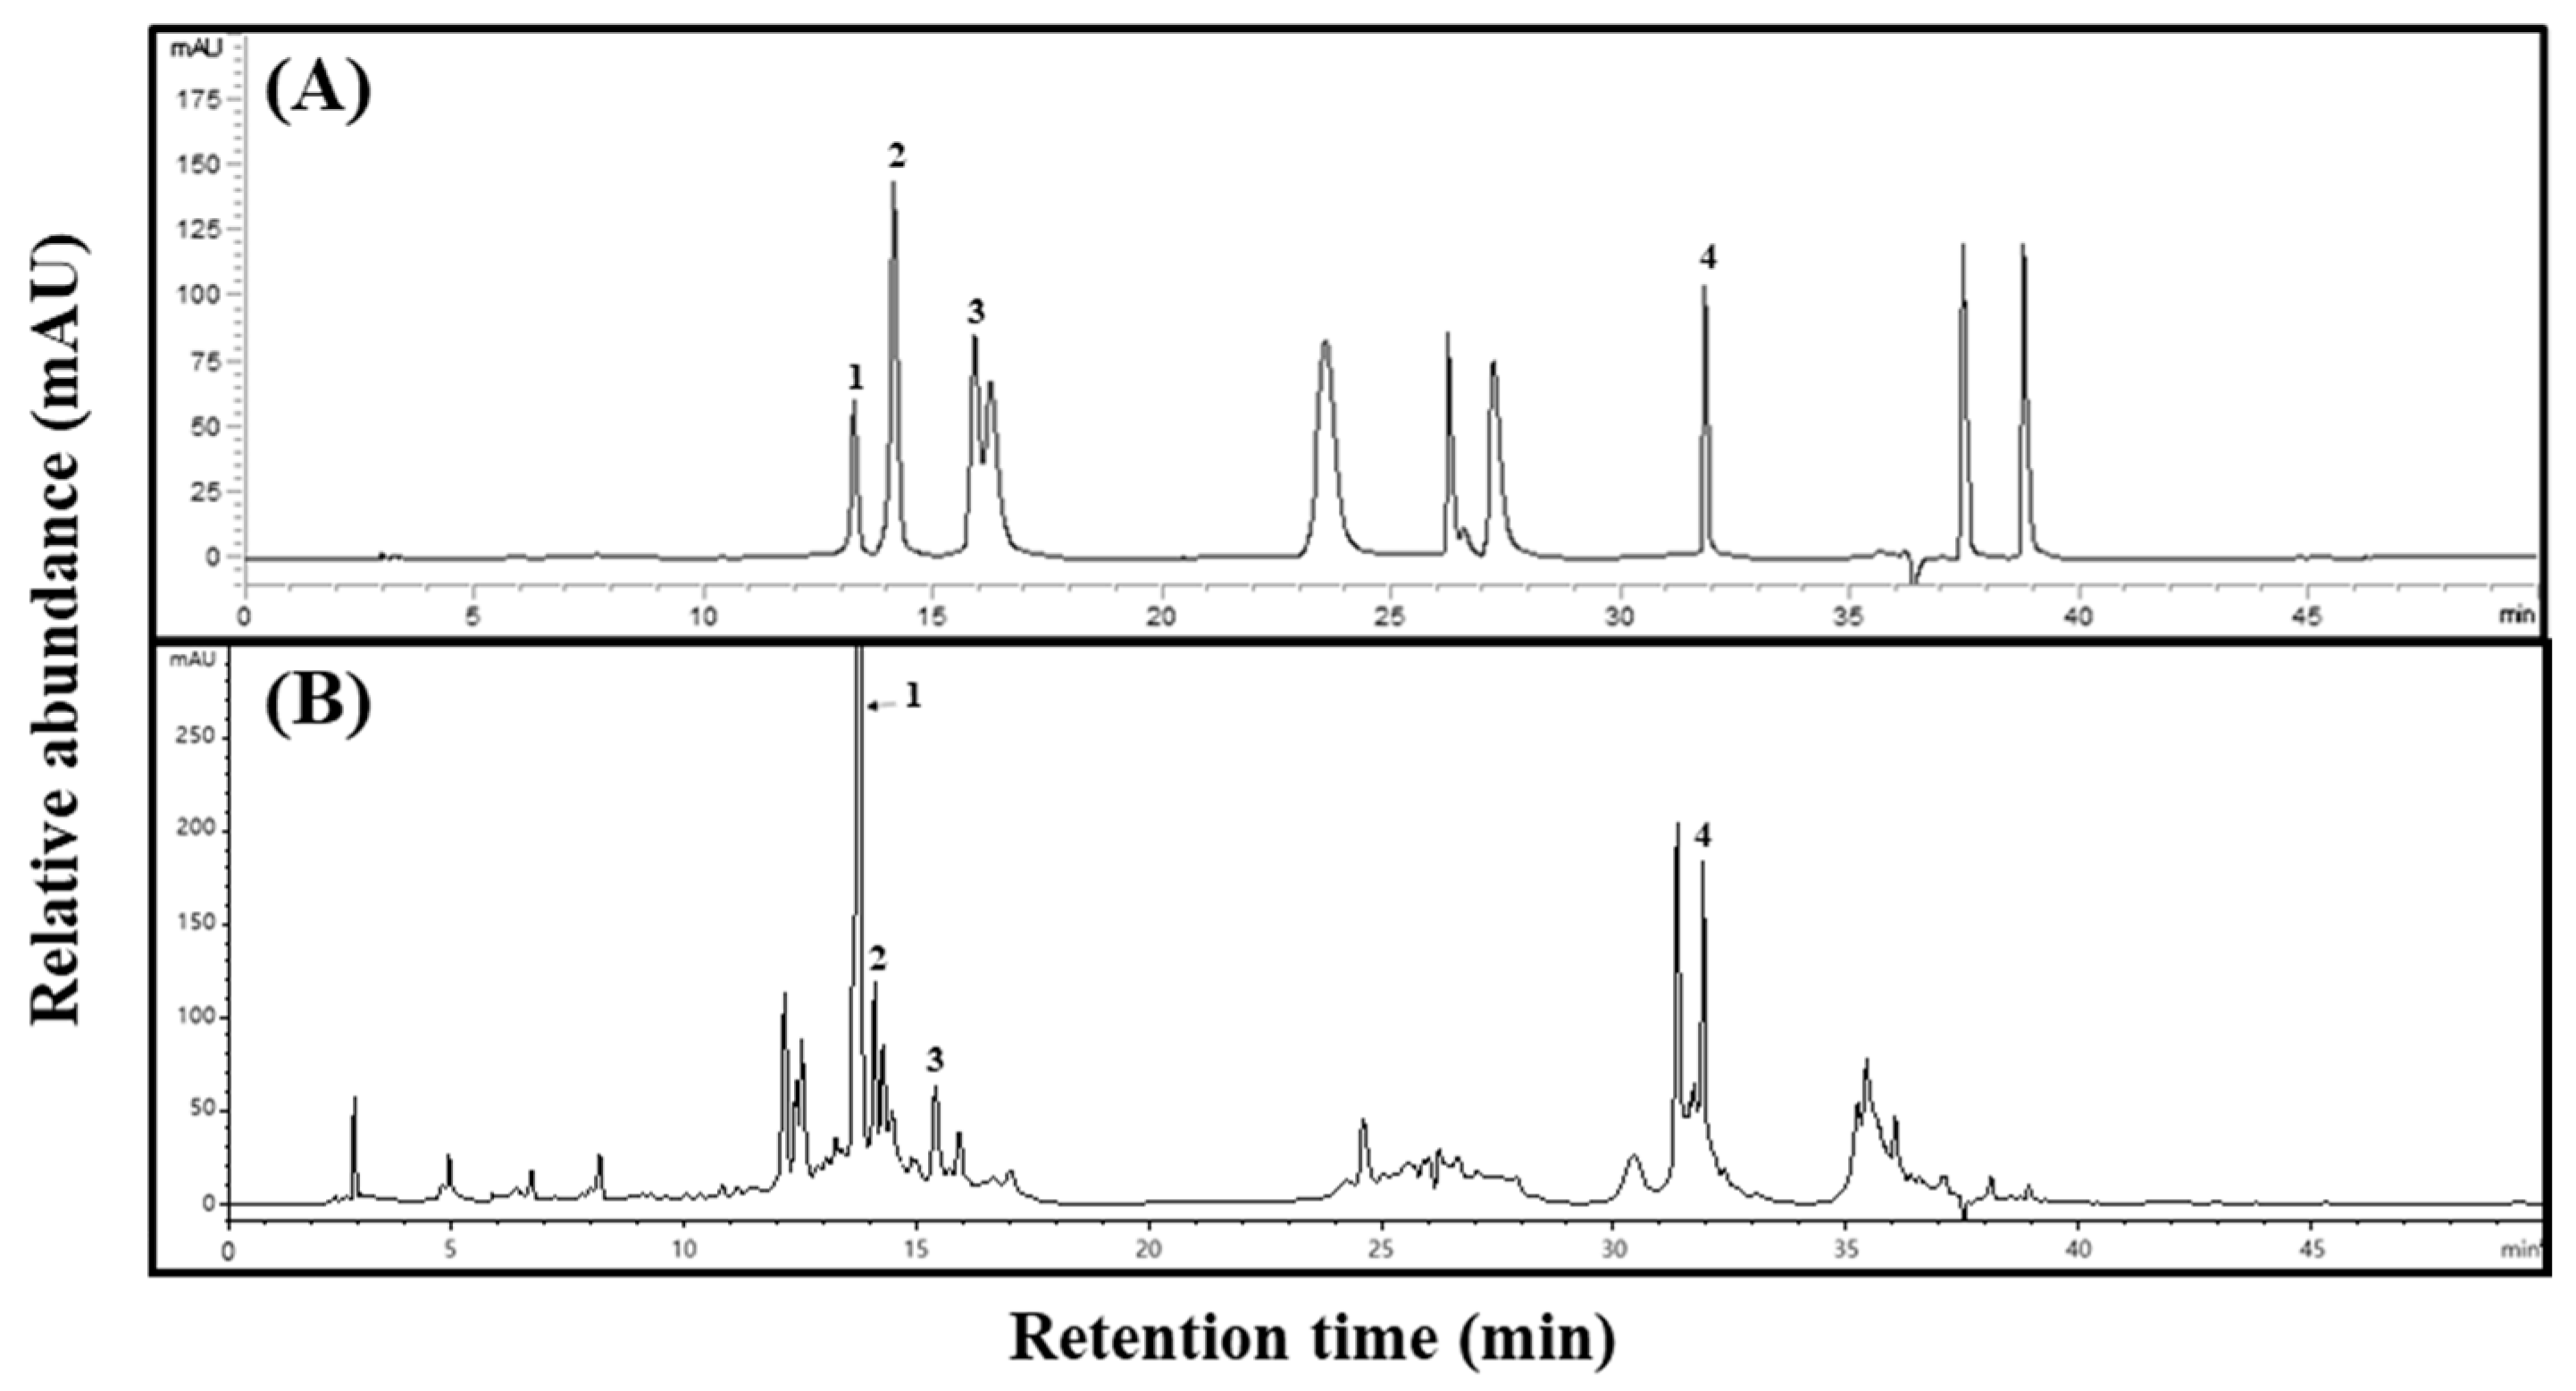
2.1. Phenolic Acid Concentrations of Aster × chusanensis Parts

To confirm the specificity between standard and sample extracts, we confirmed the peak in the high-performance liquid chromatography (HPLC) chromatogram of Aster × chusanensis leaves and selected individual phenolic acids through matching retention times to the standards (Figure 1).
The phenolic acid concentrations differed between Aster × chusanensis parts (Table 1). The total phenolic acid concentration was highest (p < 0.01) in the leaves. In particular, chlorogenic acid showed a high concentration difference among plant parts, and the concentration in the leaves (28,215.82 µg g−1 DW) was approximately 24 times higher (p < 0.01) than that in the roots (1164.48 µg g−1 DW). A previous study reported that chlorogenic acid was the main phenolic compound in the seeds of sunflowers, which also belong to the Asteraceae family [20]. Chlorogenic acid can fulfil several therapeutic functions in the body, including neuroprotective, antiviral, antipyretic, free radical scavenging, and hepatoprotective effects [21]. p-hydroxybenzoic and benzoic acid levels were highest (p < 0.001) in the leaves. These two chemicals have antibacterial, antifungal, anti-inflammatory, and anti-oxidant properties and are used in drugs, cosmetic products, food, and beverages [22]. The leaves had the highest vanillic acid concentration, which can exert neuroprotective, immunostimulatory, and cardioprotective effects [23].

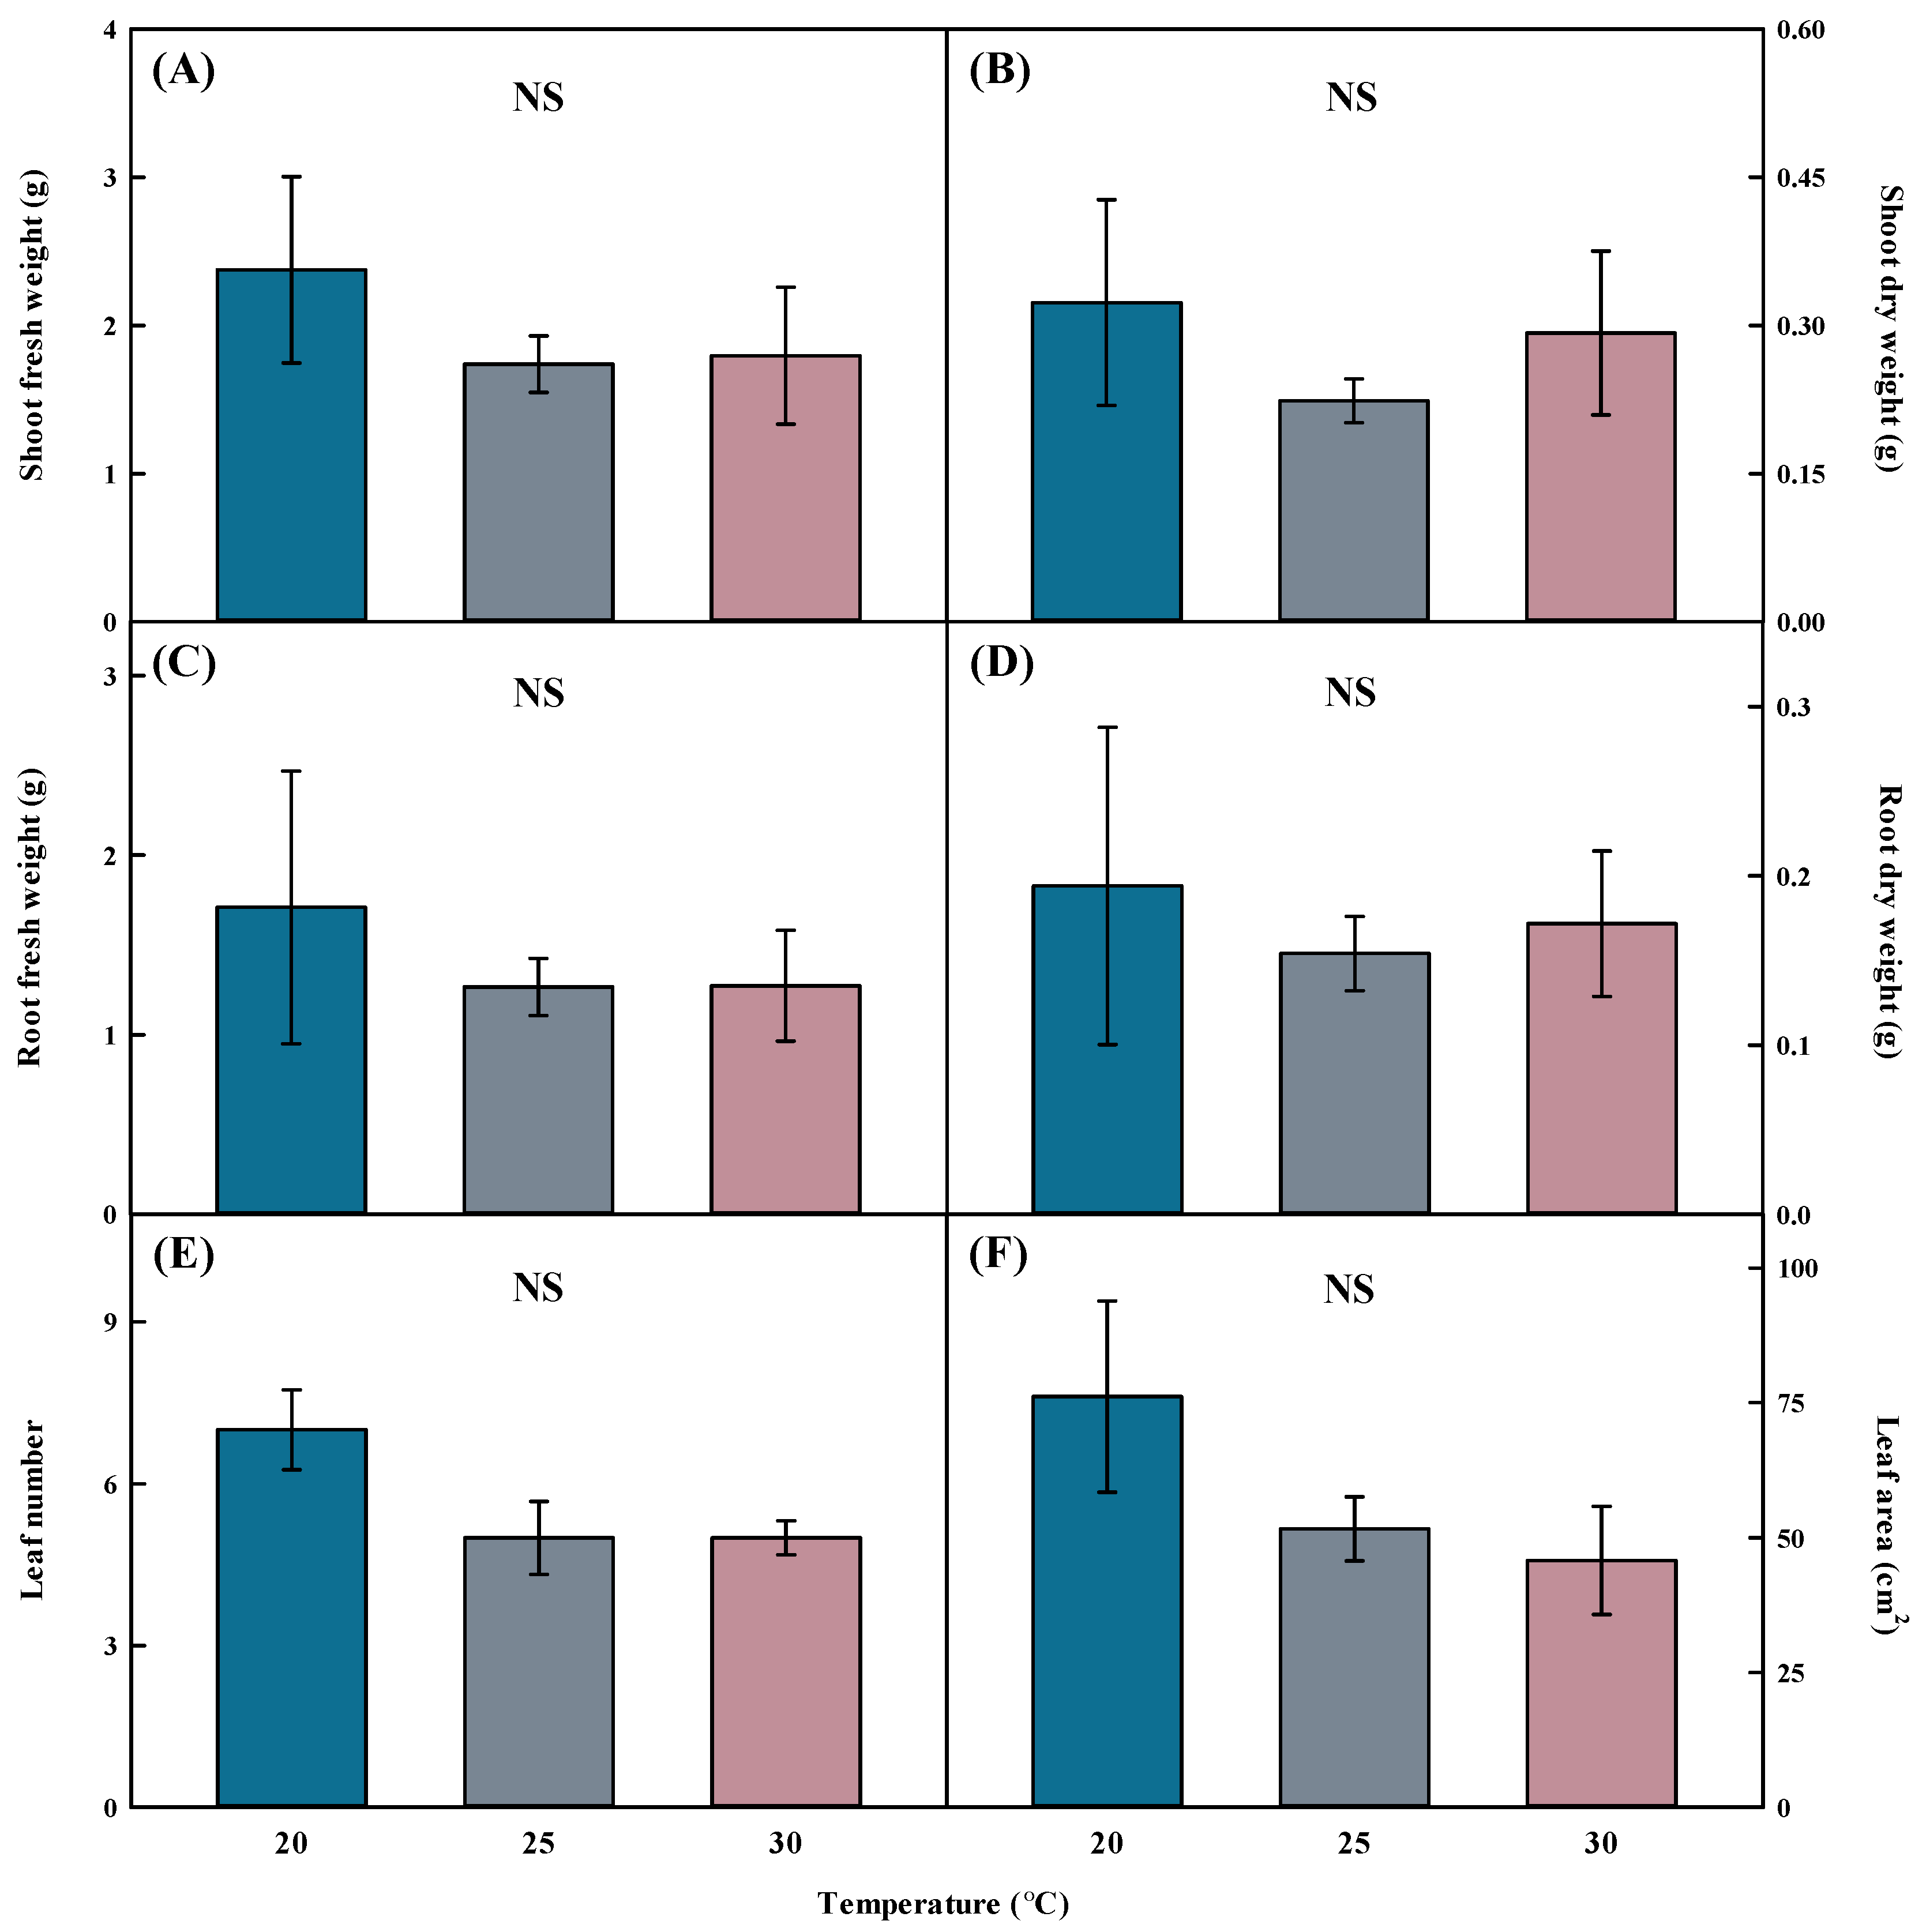
2.2. Growth Characteristic Analysis of Aster × chusanensis under Different Growth Temperatures

A closed-type plant production system and division propagation were used to study Aster × chusanensis. The division cultivation method is a form of plant propagation in which some plant parts are divided, and each part of the plant includes one or more root and stem parts. This method maintains species conservation and genetic diversity, and the cultivation period is shorter than that of seed propagation. Therefore, this method can improve crop productivity and target compound productivity by shortening the time to harvest [24]. Thus, this method is suitable for studying native species by obtaining many Aster × chusanensis individuals propagated in a short period of time.
No significant difference was observed in the fresh and dry weights of the shoots and roots when grown at 20, 25, and 30 °C on Aster × chusanensis transplanted using division cultivation (Figure 2). Growth temperature did not result in statistically significant differences in leaf number and area. Because Aster × chusanensis is a perennial plant that flowers from September to October [25], general growth is possible in a temperature range of 20–30 °C without growth deterioration, according to the results of this study. Therefore, no significant effects of temperature on growth characteristics were observed. At 20 and 30 °C, the standard error was higher than at 25 °C, confirming that uniformity was low in division seedling production, and 25 °C was the optimal temperature for producing uniform division seedlings. However, although the standard error was large at 20 °C, the values of all growth characteristics were high; therefore, 20 °C was the most efficient growth temperature for uniform seedling production.

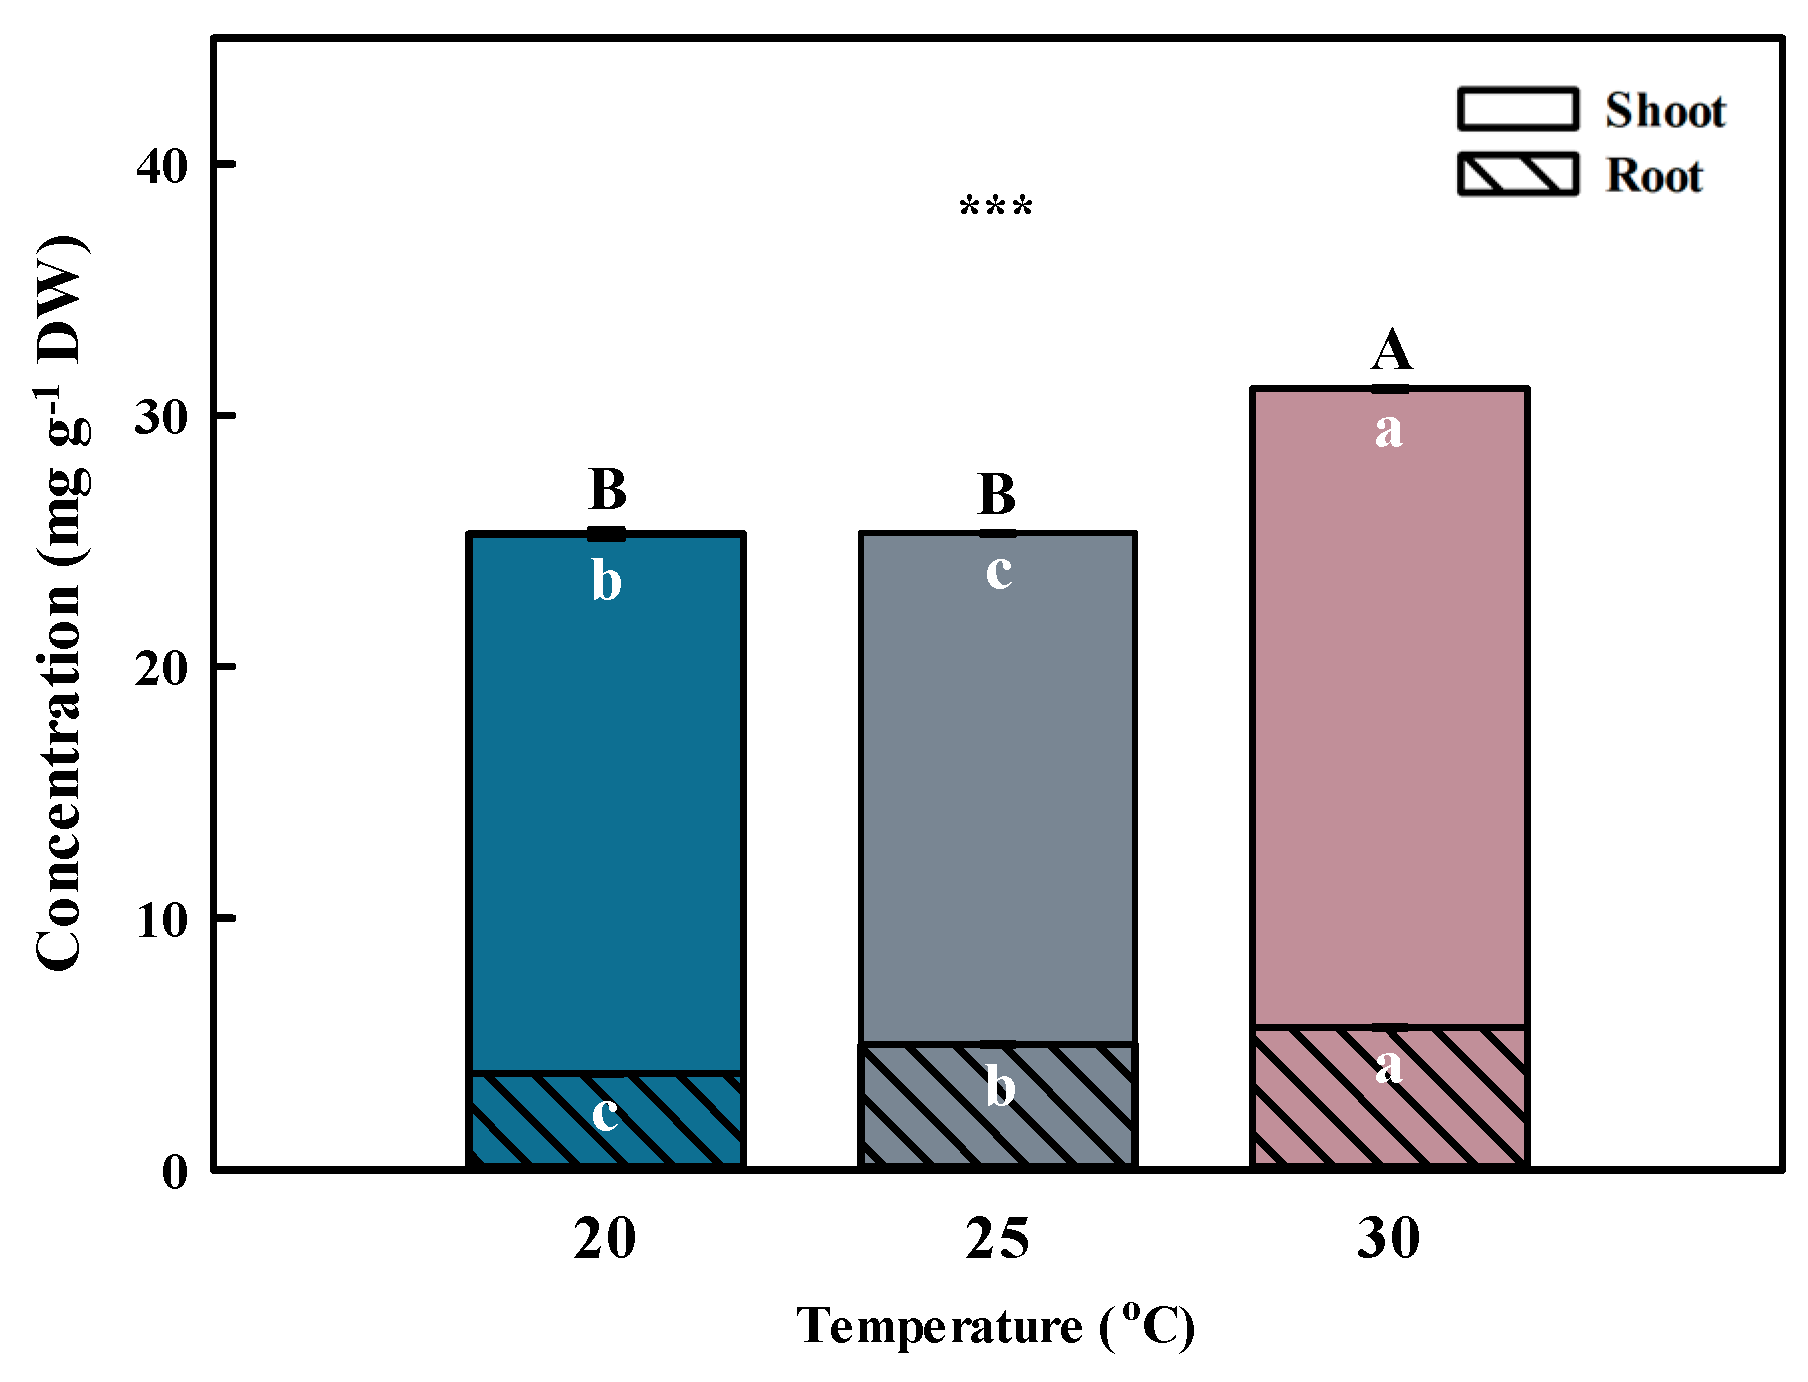
2.3. Phenolic Acid Concentrations in Aster × chusanensis Shoots under Different Growth Temperatures

Temperature is one of the primary environmental factors that affect the accumulation of bioactive compounds in plants. Total phenolic acid concentration was highest (p < 0.001) at 30 °C, followed by 20 and 25 °C (Figure 3 and Figure 4). The total phenolic acid concentration was most affected by chlorogenic acids. A previous study reported that the phenolic acid concentrations were higher at 30 °C than at 25 °C (control) after inducing oxidative stress [26].

2.4. Phenolic Acid Concentrations in Aster × chusanensis Roots under Different Growth Temperatures

Similar to the shoot, the phenolic acid concentration in the root was highest (p < 0.001) at 30 °C, followed by 20 and 25 °C (Figure 3 and Figure 4). Chlorogenic acids were extracted at significantly higher (p < 0.01) concentrations from plants grown at 30 °C compared with the other growth temperatures. Furthermore, benzoic acid had the highest concentration among phenolic acids, showing a significant difference (p < 0.001) at 30 °C.
In plants, the level of responses to temperature stress varies depending on stress intensity [27,28]. Adaptive characteristics expressed in plants exposed to moderate stress intensity are called defense priming [29] and also occur during abiotic stress [30,31]. Excessive heat stress damages the photosystem and reduces plant production [32], and it changes the pattern of secondary metabolites such as the flavonoids and phenolic compounds as a defense mechanism [33]; however, moderate heat stress can repair stress damage by returning to normal temperature after stress treatment [34]. In the present study, 30 °C was not excessive but moderate heat stress because it did not harm growth, so it may represent both an adaptation process and a defense response such as secondary metabolite accumulation.

3. Materials and Methods

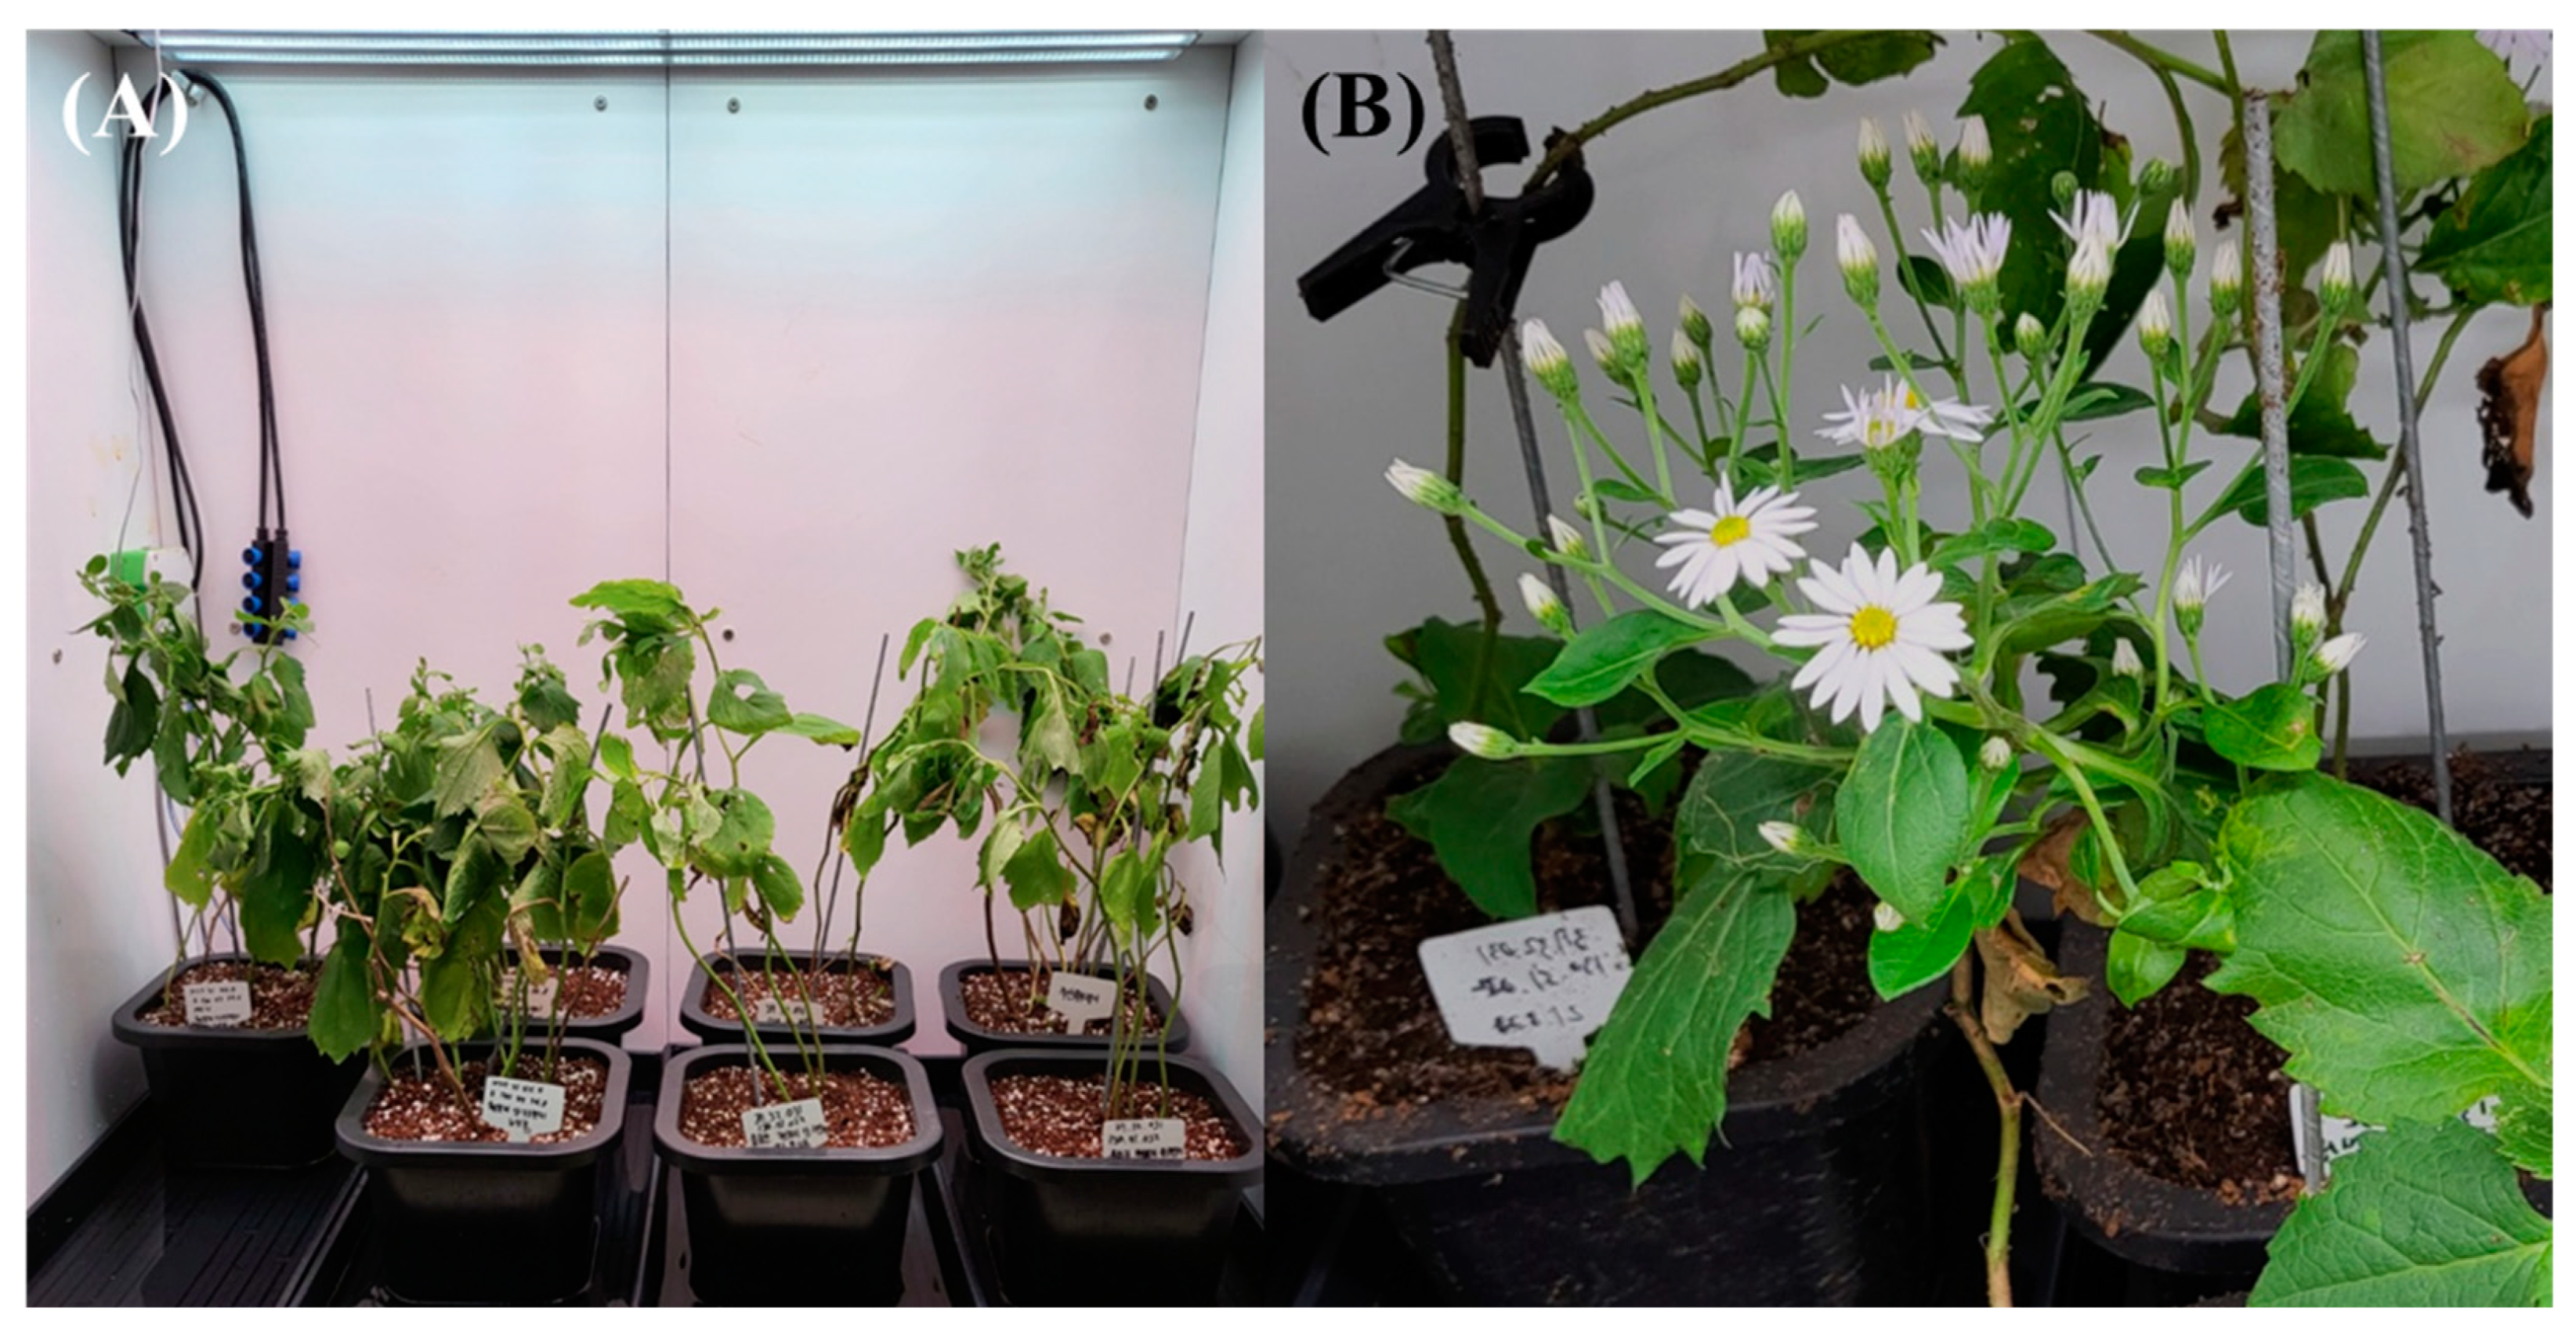
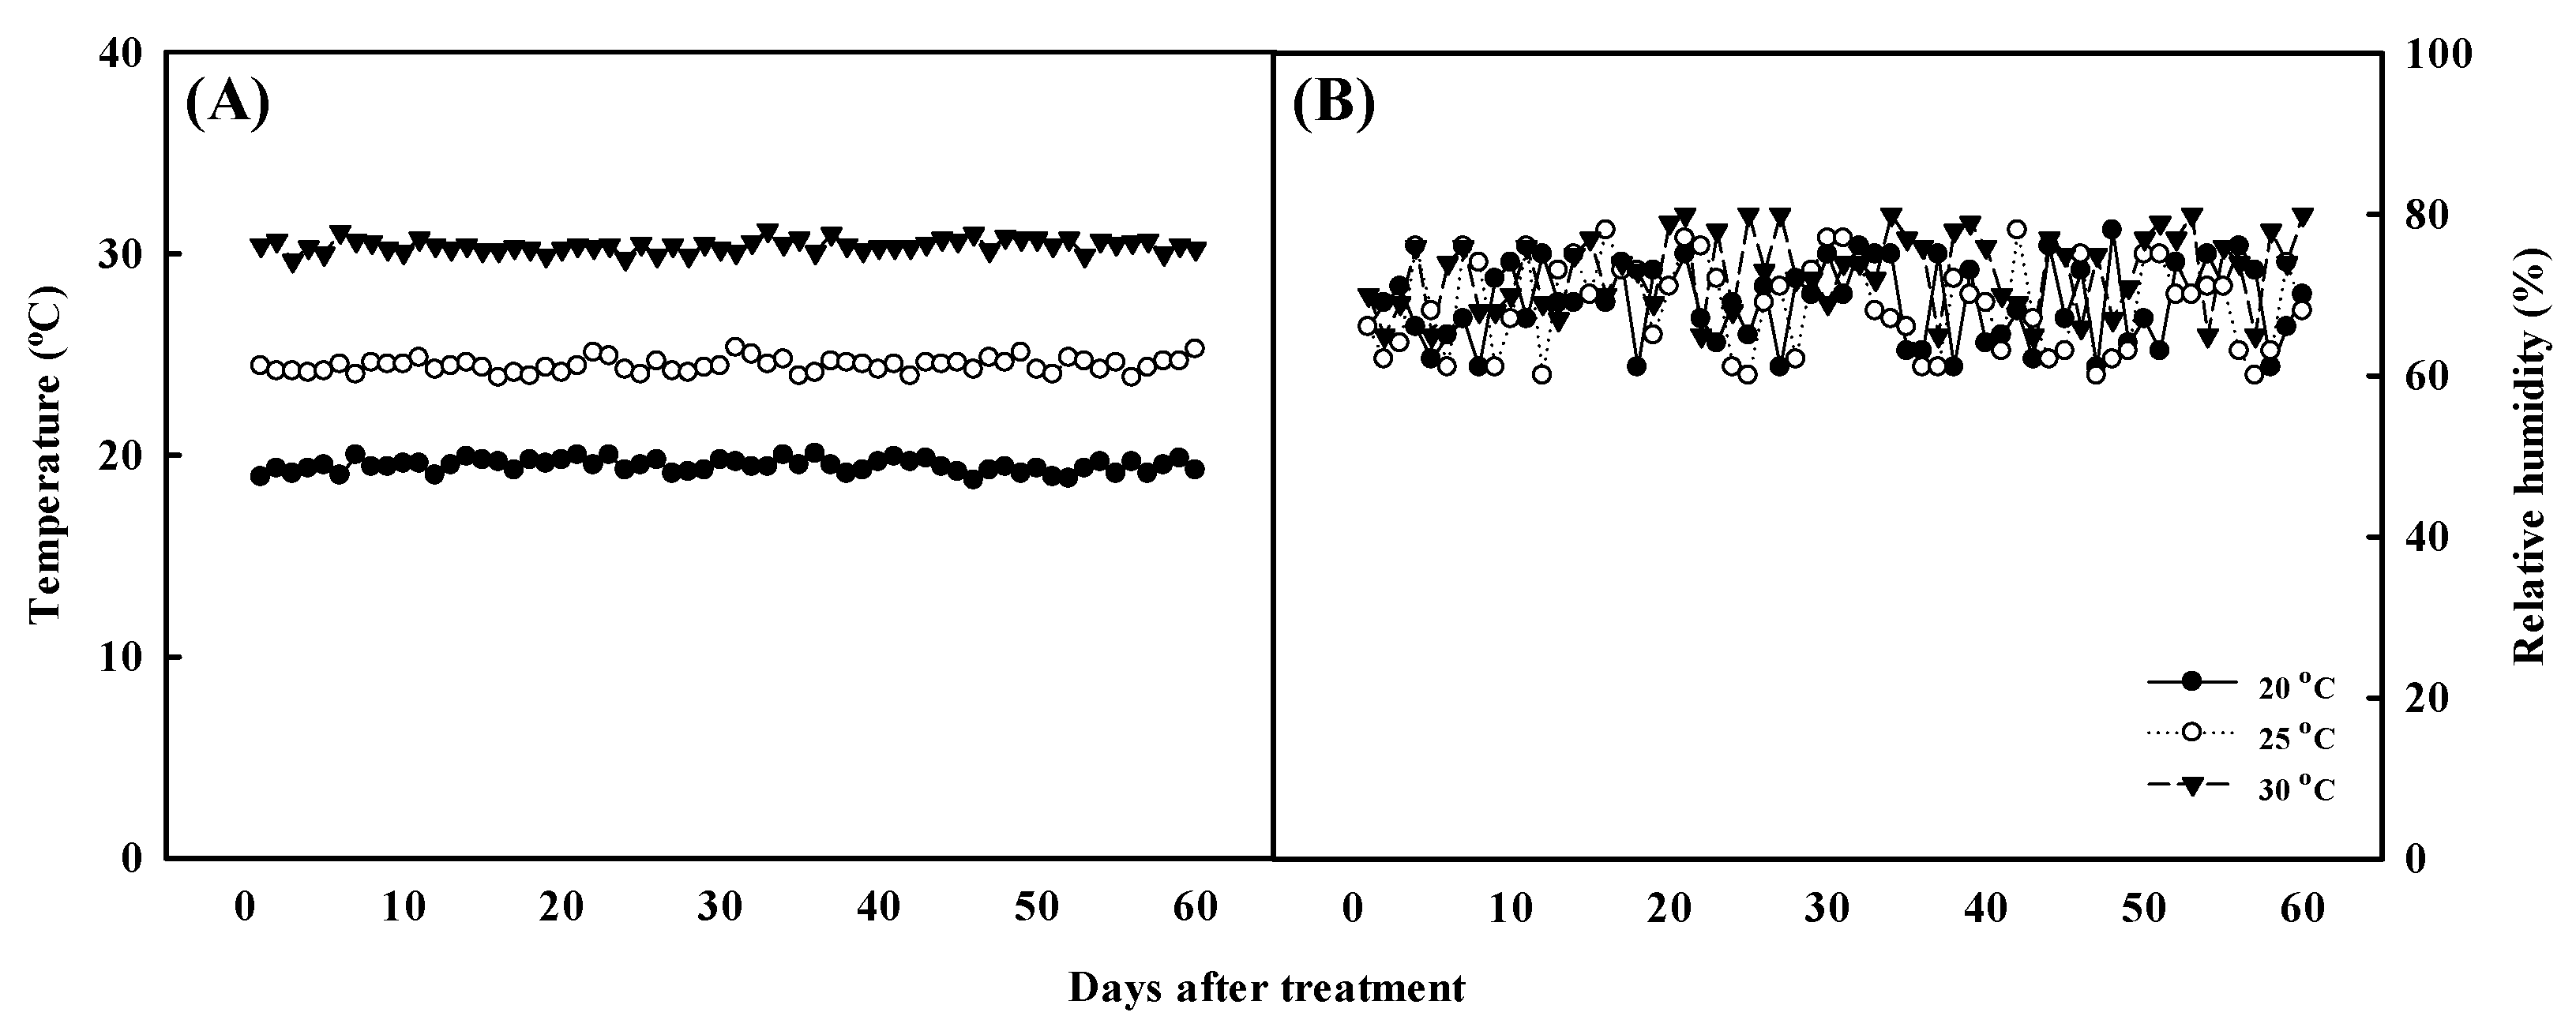
3.1. Plant Material and Growth Temperature Condition

Aster × chusanensis Y.S. Lim, Hyun, Y.D. Kim and H.C. Shin was collected on Ulleung Island, Ulleung-gun, Republic of Korea (37°31′44.4′′ N, 130°49′54.8′′ E and 37°32′031′′ N, 130°51′032′′ E). The plant materials were identified by the National Institute of Biological Resources. Growth chambers (Gaooze; KSTI, Seoul, Republic of Korea) were used to maintain the following conditions: temperature of 20 ± 3 °C, relative humidity of 70 ± 10%, light intensity of 140 ± 10 μmol m−2 s−1, and photoperiod of 12/12 h (day/night); the growth period was 6 days (Figure 5). Water was applied via bottom watering using distilled water when the soil surface had dried. Plant material was analyzed by separating the plants into leaves, stems, and roots.
Using vegetative propagation, Aster × chusanensis individuals were separated from the mother plant, transplanted into a plastic pot containing horticultural soil (Tosilee, Yeast, Hapcheon-gun, Republic of Korea), and grown under different temperatures. Growth temperature conditions were 20 ± 2, 25 ± 2, and 30 ± 2 °C, as maintained using a growth chamber (VS-91G09M-4R, Visionbionex, Republic of Korea). Environmental conditions within the plant growth chamber were maintained at a relative humidity of 70 ± 10%, light intensity of 140 ± 10 μmol m−2 s−1, and a photoperiod of 12/12 h (day/night). Growth temperature and relative humidity were monitored at 2 h intervals during the experiment (Figure 6). After transplantation, the plants were irrigated for 1 week using distilled water and thereafter using Hoagland’s solution (electrical conductivity 1.2 dS m−1 and pH 6.0 at 24.2 °C) once per week. The plants were harvested after cultivation under these conditions for approximately 2 months.

3.2. Growth Characteristic Determination

Before conducting division cultivation and treating at different temperatures, plants were divided into leaves, stems, and roots. Then, the plant samples were dried in a dry oven (WOF-155, DAIHAN Scientific, Seoul, Republic of Korea) at 70 °C for 1 week and analyzed for phenolic acid concentrations. For growth temperature experiments, division cultivation was used. Plants grown at different temperatures for approximately 2 months were divided into shoots and roots, and fresh weight was recorded using an electronic scale (PAG214C, Ohaus Corporation, Parsippany, NJ, USA). Leaf area measurement was completed using Image J software, and each sample was subsequently dried in an oven at 70 °C for 3 days. The dry weight was then recorded, and the leaf was ground to powder for use in the next analysis.

3.3. Phenolic Acid Analysis

The phenolic acid concentrations were measured using a modified version of a previously described method [35]. The calibration curves of phenolic acids were set on nine points (1000, 500, 250, 100, 50, 10, 5, 1, and 0.5 µg/mL) of each standard. A stock solution of each compound was produced using dimethyl sulfoxide. The correlation coefficients of individual curves exceeded 0.998. The plant powder samples (1 g) were weighed using an electronic scale (PAG214C, Ohaus Corporation, Parsippany, NJ, USA) and placed in a conical tube. Then, 20 mL 50% HPLC-grade methyl alcohol diluted with HPLC-grade water was added to the powder followed by incubation (SH-800, SEYOUNG SCIENTIFIC) overnight at 25 °C. The extract was centrifuged (Centrifuge 5430R, Eppendorf, Hamburg, Germany) at 958× g for 10 min. The supernatant was filtered using a 0.45 µm membrane filter (PV2545, Chromdisc, Suwon, Republic of Korea), and 1 mL of extract was transferred to HPLC vials.
Phenolic acid concentrations were determined using HPLC (HPLC Agilent 1260 system, Agilent Technologies, Waldbronn, Germany) with an XTerra™ RP C18 column (4.6 mm × 250 mm, 5 μm; Waters, Milford, MA, USA). The injection volume of the sample was 20 µL, and the sample was analyzed in triplicate. The absorbance of phenolic acids was detected at 280 nm, and the column temperature was maintained at 30 °C. The flow rate was 1.0 mL min−1. As a mobile phase solvent, mobile phase A was 0.2% acetic acid in HPLC water, and mobile phase B was 0.2% acetic acid in acetonitrile. The elution gradient was applied as shown in Table 2.
We confirmed the limit of detection and the limit of quantification and then selected the individual phenolic acids (Table 3). Integration of peak and calculation of the quantification of individual phenolic acids were executed manually. The total phenolic acid concentrations were calculated by adding up the concentration of individual phenolic acids for each repetition and then deriving the average and standard deviation.

3.4. Chemicals

HPLC-grade reagents (water, acetonitrile [99.9%], and methyl alcohol [99.9%]) were purchased from Daejung Co. (Daejung Chemical & Materials Co., Ltd., Siheung, Gyeonggi-Do, Republic of Korea). The reference standards for phenolic acids (chlorogenic acid, p-hydroxybenzoic acid, vanillic acid, and benzoic acid) were purchased from Sigma-Aldrich (St. Louis, MO, USA).

3.5. Statistical Analysis

Analysis of secondary metabolites in each plant part was performed using six replicates per treatment. Analysis of growth characteristics and secondary metabolites by different temperatures was performed using five replicates. Differences in secondary metabolites at the various temperatures were examined using eight replicates. All data were calculated as the mean and standard deviation of each replication. Data analysis was performed using a one-way analysis of variance with the SAS program (SAS 9.4, SAS Institute, Cary, NC, USA). Duncan’s multiple range test was used to test differences among all treatments at p < 0.05.

4. Conclusions

Determining the phenolic acids in Aster plants, including in the leaves, stems, and roots, may provide useful information on Aster × chusanensis. Here, chlorogenic acid was the primary compound in Aster × chusanensis leaves. The various temperature conditions did not result in significant differences in the growth characteristics of Aster × chusanensis after the division propagation method. A growth temperature of 30 °C was efficient for phenolic acid biosynthesis. This study provides valuable information on the propagation methods and secondary metabolite concentrations under different temperatures of Aster × chusanensis, which is a natural hybrid species in South Korea.

Author Contributions

Conceptualization, methodology, software, formal analysis, investigation, resources, data curation, and writing—original draft preparation, H.-S.S. and H.J.K.; data curation, formal analysis, investigation, and methodology, H.-S.S., H.J.K., S.-N.J., G.O.L., I.-J.K., G.-S.Y., G.-H.N., J.E.P. and H.Y.B.; supervision, validation, funding acquisition, and writing—review and editing, Y.-H.Y. and K.-H.S. All authors have read and agreed to the published version of the manuscript.

Funding

This work was supported by a grant from the National Institute of Biological Resources (NIBR), funded by the Ministry of Environment (MOE) of the Republic of Korea (grant number NIBR202215102, NIBR202315101, NIBR202414101).

Data Availability Statement

All the data are available in the paper.

Conflicts of Interest

The authors declare no conflicts of interest.

References

  1. Adedeji, O.; Jewoola, O.A. Importance of leaf epidermal characters in the Asteraceae family. Not. Bot. Horti Agrobot. Cluj-Napoca 2008, 36, 7. [Google Scholar]
  2. Gao, T.; Yao, H.; Song, J.; Zhu, Y.; Liu, C.; Chen, S. Evaluating the feasibility of using candidate DNA barcodes in discriminating species of the large Asteraceae family. BMC Evol. Biol. 2010, 10, 324. [Google Scholar] [CrossRef] [PubMed]
  3. Shin, Y.H.; Kim, H.J.; Ku, J.J.; Park, K.W.; Choi, K.; Jeong, H.S.; Kang, S.H. The folk plants in northern region of Chungcheongbuk-do. Korean J. Plant Resour. 2012, 25, 707–718. [Google Scholar] [CrossRef]
  4. Son, M.J.; Jin, C.; Lee, Y.S.; Lee, J.Y.; Kim, H.J. Characterization of caffeoylglucoside derivatives and hypouricemic activity of the ethyl acetate fraction from Aster glehni. Bull. Korean Chem. Soc. 2015, 36, 503–512. [Google Scholar] [CrossRef]
  5. KIM, T.J. Wild Flowers of Korea; Kugilmedia: Seoul, Republic of Korea, 1996; p. 232. [Google Scholar]
  6. Lim, Y.; Hyun, J.O.; Kim, Y.D.; Shin, H. Aster chusanensis (Asteraceae), a new species from Korea. J. Plant Biol. 2005, 48, 479–482. [Google Scholar] [CrossRef]
  7. Shin, H.; Oh, S.H.; Lim, Y.; Hyun, C.W.; Cho, S.H.; Kim, Y.I.; Kim, Y.D. Molecular evidence for hybrid origin of Aster chusanensis, an endemic species of Ulleungdo, Korea. J. Plant Biol. 2014, 57, 174–185. [Google Scholar] [CrossRef]
  8. De Leonardis, A.; Macciola, V.; Di Rocco, A. Oxidative stabilization of cold-pressed sunflower oil using phenolic compounds of the same seeds. J. Sci. Food Agric. 2003, 83, 523–528. [Google Scholar] [CrossRef]
  9. Spiridon, I.; Nechita, C.B.; Niculaua, M.; Silion, M.; Armatu, A.; Teacă, C.A.; Bodîrlău, R. Antioxidant and chemical properties of Inula helenium root extracts. Cent. Eur. J. Chem. 2013, 11, 1699–1709. [Google Scholar] [CrossRef]
  10. Balasundram, N.; Sundram, K.; Samman, S. Phenolic compounds in plants and agri-industrial by-products: Antioxidant activity, occurrence, and potential uses. Food Chem. 2006, 99, 191–203. [Google Scholar] [CrossRef]
  11. Dos Santos, M.D.; Almeida, M.C.; Lopes, N.P.; De Souza, G.E.P. Evaluation of the anti-inflammatory, analgesic and antipyretic activities of the natural polyphenol chlorogenic acid. Biol. Pharm. Bull. 2006, 29, 2236–2240. [Google Scholar] [CrossRef]
  12. Mamani-Matsuda, M.; Kauss, T.; Al-Kharrat, A.; Rambert, J.; Fawaz, F.; Thiolat, D.; Moynet, D.; Coves, S.; Malvy, D.; Mossalayi, M.D. Therapeutic and preventive properties of quercetin in experimental arthritis correlate with decreased macrophage inflammatory mediators. Biochem. Pharmacol. 2006, 72, 1304–1310. [Google Scholar] [CrossRef] [PubMed]
  13. Kim, H.H.; Park, G.H.; Park, K.S.; Lee, J.Y.; An, B.J. Anti-oxidant and Anti-inflammation Activity of Fractions from Aster glehni Fr. Schm. Microbiol. Biotechnol. Lett. 2010, 38, 434–441. [Google Scholar]
  14. Nugroho, A.; Kim, M.H.; Choi, J.; Choi, J.S.; Jung, W.T.; Lee, K.T.; Park, H.J. Phytochemical studies of the phenolic substances in Aster glehni extract and its sedative and anticonvulsant activity. Arch. Pharmacal Res. 2012, 35, 423–430. [Google Scholar] [CrossRef] [PubMed]
  15. Kang, D.H.; Han, E.H.; Jin, C.; Kim, H.J. Inhibitory Effects of Ethanolic Extracts from Aster glehni on Xanthine Oxidase and Concentration Determination of Bioactive Components Using HPLC-UV. J. Korean Soc. Food Sci. Nutr. 2016, 45, 1610–1616. [Google Scholar] [CrossRef]
  16. He, J.; Yao, L.; Pecoraro, L.; Liu, C.; Wang, J.; Huang, L.; Gao, W. Cold stress regulates accumulation of flavonoids and terpenoids in plants by phytohormone, transcription process, functional enzyme, and epigenetics. Crit. Rev. Biotechnol. 2023, 43, 680–697. [Google Scholar] [CrossRef] [PubMed]
  17. Hassan, M.U.; Chattha, M.U.; Khan, I.; Chattha, M.B.; Barbanti, L.; Aamer, M.; Iqbal, M.M.; Nawaz, M.; Mahmood, A.; Ali, A.; et al. Heat stress in cultivated plants: Nature, impact, mechanisms, and mitigation strategies—A review. Plant Biosyst. Int. J. Deal. All Asp. Plant Biol. 2021, 155, 211–234. [Google Scholar] [CrossRef]
  18. Razzak, M.A.; Asaduzzaman, M.; Tanaka, H.; Asao, T. Effects of supplementing green light to red and blue light on the growth and yield of lettuce in plant factories. Sci. Hortic. 2022, 305, 111429. [Google Scholar] [CrossRef]
  19. Bessada, S.M.; Barreira, J.C.; Oliveira, M.B.P. Asteraceae species with most prominent bioactivity and their potential applications: A review. Ind. Crops Prod. 2015, 76, 604–615. [Google Scholar] [CrossRef]
  20. Gai, F.; Karamać, M.; Janiak, M.A.; Amarowicz, R.; Peiretti, P.G. Sunflower (Helianthus annuus L.) plants at various growth stages subjected to extraction—Comparison of the antioxidant activity and phenolic profile. Antioxidants 2020, 9, 535. [Google Scholar] [CrossRef] [PubMed]
  21. Naveed, M.; Hejazi, V.; Abbas, M.; Kamboh, A.A.; Khan, G.J.; Shumzaid, M.; Ahmad, F.; Babazadeh, D.; FangFang, X.; Modarresi-Ghazani, F.; et al. Chlorogenic acid (CGA): A pharmacological review and call for further research. Biomed. Pharmacother. 2018, 97, 67–74. [Google Scholar] [CrossRef]
  22. Manuja, R.; Sachdeva, S.; Jain, A.; Chaudhary, J. A comprehensive review on biological activities of p-hydroxy benzoic acid and its derivatives. Int. J. Pharm. Sci. Rev. Res. 2013, 22, 109–115. [Google Scholar]
  23. Sharma, N.; Tiwari, N.; Vyas, M.; Khurana, N.; Muthuraman, A.; Utreja, P. An overview of therapeutic effects of vanillic acid. Plant Arch. 2020, 20, 3053–3059. [Google Scholar]
  24. Megersa, H.G. Propagation methods of selected horticultural crops by specialized organs: Review. J. Hortic. 2017, 4, 198. [Google Scholar] [CrossRef]
  25. Im, H.J.; Yang, J.C.; Lee, D.J.; Na, C.S.; Che, S.H. Influence of Cytokinins on Callus and Shoot Induction of Aster × chusanensis Y.; Lim, JO Hyun, YD Kim & H. Shin. Flower Res. J. 2023, 31, 260–266. [Google Scholar]
  26. Ampofo, J.; Ngadi, M.; Ramaswamy, H.S. The impact of temperature treatments on elicitation of the phenylpropanoid pathway, phenolic accumulations and antioxidative capacities of common bean (Phaseolus vulgaris) sprouts. Food Bioprocess Technol. 2020, 13, 1544–1555. [Google Scholar] [CrossRef]
  27. Pazouki, L.; Kanagendran, A.; Li, S.; Kännaste, A.; Memari, H.R.; Bichele, R.; Niinemets, Ü. Mono-and sesquiterpene release from tomato (Solanum lycopersicum) leaves upon mild and severe heat stress and through recovery: From gene expression to emission responses. Environ. Exp. Bot. 2016, 132, 1–15. [Google Scholar] [CrossRef] [PubMed]
  28. Zhu, L.; Bloomfield, K.J.; Hocart, C.H.; Egerton, J.J.; O’Sullivan, O.S.; Penillard, A.; Weerasinghe, L.K.; Atkin, O.K. Plasticity of photosynthetic heat tolerance in plants adapted to thermally contrasting biomes. Plant Cell Environ. 2018, 41, 1251–1262. [Google Scholar] [CrossRef] [PubMed]
  29. Martinez-Medina, A.; Flors, V.; Heil, M.; Mauch-Mani, B.; Pieterse, C.M.; Pozo, M.J.; Ton, J.; van Dam, N.M.; Conrath, U. Recognizing plant defense priming. Trends Plant Sci. 2016, 21, 818–822. [Google Scholar] [CrossRef]
  30. Beckers, G.J.; Conrath, U. Priming for stress resistance: From the lab to the field. Curr. Opin. Plant Biol. 2007, 10, 425–431. [Google Scholar] [CrossRef]
  31. Theocharis, A.; Bordiec, S.; Fernandez, O.; Paquis, S.; Dhondt-Cordelier, S.; Baillieul, F.; Clément, C.; Barka, E.A. Burkholderia phytofirmans PsJN primes Vitis vinifera L. and confers a better tolerance to low nonfreezing temperatures. Mol. Plant Microbe Interact. 2012, 25, 241–249. [Google Scholar] [CrossRef]
  32. Allakhverdiev, S.I.; Kreslavski, V.D.; Klimov, V.V.; Los, D.A.; Carpentier, R.; Mohanty, P. Heat stress: An overview of molecular responses in photosynthesis. Photosynth. Res. 2008, 98, 541–550. [Google Scholar] [CrossRef] [PubMed]
  33. Ashraf, M.A.; Iqbal, M.; Rasheed, R.; Hussain, I.; Riaz, M.; Arif, M.S. Environmental stress and secondary metabolites in plants: An overview. In Plant Metabolites and Regulation under Environmental Stress; Academic Press: Cambridge, MA, USA, 2018; pp. 153–167. [Google Scholar]
  34. Luo, H.B.; Ma, L.; Xi, H.F.; Duan, W.; Li, S.H.; Loescher, W.; Wang, J.F.; Wang, L.J. Photosynthetic responses to heat treatments at different temperatures and following recovery in grapevine (Vitis amurensis L.) leaves. PLoS ONE 2011, 6, e23033. [Google Scholar] [CrossRef] [PubMed]
  35. Lee, H.Y.; Cho, D.Y.; Kim, D.H.; Park, J.H.; Jeong, J.B.; Jeon, S.H.; Lee, J.H.; Ko, E.J.; Cho, K.M. Examining the Alterations in Metabolite Constituents and Antioxidant Properties in Mountain-Cultivated Ginseng (Panax ginseng CA Meyer) Organs during a Two-Month Maturation Period. Antioxidants 2024, 13, 612. [Google Scholar] [CrossRef] [PubMed]
Figure 1. Phenolic acid HPLC chromatograms of Aster × chusanensis leaves. (A) Standard of phenolic acids and (B) leaves. The absorbance of individual compounds was detected at 280 nm. The concentration of the standards was 100 µg/mL, and the concentration of the extract was 50,000 µg/mL. Peak 1, chlorogenic acid; peak 2, p-hydroxybenzoic acid; peak 3, vanillic acid; peak 4, benzoic acid.
Plants 13 01855 g001
Figure 2. Shoot fresh weight (A), shoot dry weight (B), root fresh weight (C), root dry weight (D), leaf number (E), and leaf area (F) by different temperatures of Aster × chusanensis (n = 5). Bar heights indicate the mean, and error bars show the mean standard deviation. Mean separation by Duncan’s multiple range test at 5% level. NS—difference not significant.
Plants 13 01855 g002
Figure 3. Total phenolic acid concentrations by different temperatures for the shoot and root of Aster × chusanensis (n = 8). Bar height indicates the mean, and error bars show the standard deviation. Mean separation by Duncan’s multiple range test at 5% level. Different letters (A–B, a–c) indicate significant differences at p < 0.001 (***).
Plants 13 01855 g003
Figure 4. Individual phenolic acid concentrations by different temperatures for the shoots and roots of Aster × chusanensis (n = 8). (A) Chlorgenic acid, (B) p-hydroxybenzoic acid, (C) vanilic acid, and (D) benzoic acid. Bar height indicates the mean, and error bars show the standard deviation. Mean separation by Duncan’s multiple range test at 5% level. Different letters (a–c) above the bar mean significant differences (*, p < 0.05; **, p < 0.01; ***, p < 0.001). ND—non-detection; NS—no significant difference.
Plants 13 01855 g004
Figure 5. Aster × chusanensis grown in a growth chamber (A) and Aster × chusanensis used for the analysis of individual phenolic acid concentrations in each part (B).
Plants 13 01855 g005
Figure 6. Temperature (A) and relative humidity (B) monitored at 2 h intervals during the experiment.
Plants 13 01855 g006
Table 1. Phenolic acid concentrations of each part of Aster × chusanensis (n = 6). Concentrations expressed in μg g−1 dry weight.
Phenolic AcidLeafStemRootSig
Chlorgenic acid28,215.82 ± 3711.68 z a y1593.63 ± 21.20 b1164.48 ± 25.75 b**
p-hydroxybenzoic acid498.64 ± 1.33 a155.10 ± 0.58 b147.83 ± 0.79 c***
Vanilic acid354.12 ± 5.94 aND x207.26 ± 31.12 b**
Benzoic acid5231.75 ± 271.42 a560.58 ± 0.67 c1601.37 ± 60.51 b***
Total34,300.31 ± 3435.43 a2309.29 ± 19.96 b3120.91 ± 118.15 b**
z Mean ± standard deviation. y Mean separation within rows by Duncan’s multiple range test at 5% level. Different letters (a–c) indicate significant differences. Sig—significance; ** and *** mean p < 0.01 and p < 0.001, respectively; ND x—non-detection.
Table 2. Elution gradient used for phenolic acid analysis.
Time (min)Mobile Phase A (%)Mobile Phase B (%)
01000
3973
5955
89010
108515
15955
17928
199010
208515
228020
268515
278020
287030
326040
364060
377030
386040
405050
454060
552080
601090
650100
Table 3. The LOQ and LOD of HPLC analysis.
Phenolic AcidLOD (µg mL)LOQ (µg mL)
( 3.3   ×   σ /S) ( 10   ×   σ /S)
Chlorogenic acid33.594101.801
p-hydroxybenzoic acid42.326128.261
Vanillic acid41.386125.413
Benzoic acid3.77311.433
HPLC—high-performance liquid chromatography; LOD—limit of detection; LOQ—limit of quantification.
Disclaimer/Publisher’s Note: The statements, opinions and data contained in all publications are solely those of the individual author(s) and contributor(s) and not of MDPI and/or the editor(s). MDPI and/or the editor(s) disclaim responsibility for any injury to people or property resulting from any ideas, methods, instructions or products referred to in the content.

