Article

Tolerance with High Yield Potential Is Provided by Lower Na+ Ion Accumulation and Higher Photosynthetic Activity in Tolerant YNU31-2-4 Rice Genotype under Salinity and Multiple Heat and Salinity Stress

by
Lutfun Nahar
1,2,
Murat Aycan
3,4,*,
Ermelinda Maria Lopes Hornai
1,5,
Marouane Baslam
4,6,7 and
Toshiaki Mitsui
1,4,*
1
Department of Life and Food Science, Graduate School of Science and Technology, Niigata University, Niigata 950-2181, Japan
2
Department of Agricultural Botany, Sher-e-Bangla Agricultural University, Dhaka 1207, Bangladesh
3
JSPS International Research Fellow, Graduate School of Science and Technology, Niigata University, Niigata 950-2181, Japan
4
Laboratory of Biochemistry, Faculty of Agriculture, Niigata University, Niigata 950-2181, Japan
5
National Division of Research and Statistics, Timor-Leste Ministry of Agriculture and Fisheries, Dili 626, Timor-Leste
6
Centre d’Agrobiotechnologie et Bioinge’ Nierie, Unite’ deRecherche labellise’ e CNRST (Centre AgroBio-tech-URL-CNRST-05), Universite’ Cadi Ayyad, Marrakech 40000, Morocco
7
Laboratory of Agro-Food, Biotechnologies, and Valorization of PlantBioresources (AGROBIOVAL), Department of Biology, Faculty of Science Semlalia, Cadi Ayyad University (UCA), Marrakesh 40000, Morocco
*
Authors to whom correspondence should be addressed.
Plants 2023, 12(9), 1910; https://doi.org/10.3390/plants12091910
Submission received: 9 March 2023 / Revised: 18 April 2023 / Accepted: 3 May 2023 / Published: 8 May 2023

Abstract

:
The yield-reduction effect of abiotic stressors such as salinity and heat stresses with the growing world population threatens food security. Although adverse effects of salinity and heat stress on plant growth and production parameters have been documented, in nature, abiotic stresses occur sequentially or simultaneously. In this study, the stress tolerance and yield capacity of Yukinkomai, YNU31-2-4, and YNU SL rice genotypes tested under control (26 °C, 0 mM NaCl), salinity (26 °C, 75 mM NaCl), heat (31 °C, 0 mM NaCl), and heat and salinity (31 °C, 75 mM NaCl) stress combinations at vegetative and reproductive stages with six different scenarios. The results show that salinity and the heat and salinity combination stresses highly reduce plant growth performance and yield capacity. Heat stress during reproduction does not affect the yield but reduces the grain quality. The YNU31-2-4 genotype performs better under heavy salt and heat and salinity stress then the Yukinkomai and YNU SL genotypes. YNU31-2-4 genotypes accumulate less Na+ and more K+ under salt and multiple stresses. In the YNU31-2-4 genotype, low Na+ ion accumulation increases photosynthetic activity and pigment deposition, boosting the yield. Stress lowers the glucose accumulation in dry seeds, but the YNU31-2-4 genotype has a higher glucose accumulation.

1. Introduction

After receiving the first dangerous wave of global warming effects, environmental stressors have gained more importance relating to plant-yield potential. In particular, the yield reduction combined with the growing world population poses a danger to food security and creates a global alarm in agricultural associations. The issue of food security is of the highest priority due to the exponential increase in the global population, projected to reach 9 billion within the next three decades [1]. Presently, it is estimated that approximately 690 million people, which accounts for 11% of the global population, are confronted with hunger. Furthermore, projections indicate that the need for sustenance is expected to rise by 85%, equating to roughly 2.7 billion people, by the year 2050 [2,3]. Soil salinity and heat (high temperature) stresses become the most critical limiting factors to crop production worldwide [4]. Over 20% of the total global irrigated area is affected by high salinity [5,6]. High salt concentrations, affecting > 3% (397 Mha) of the total land area and crop productivity, cause losses of 55%, 28%, and 15% in corn, wheat, and cotton yield and US$ 27.3 billion a year [7]. By 2050, approximately 50% of the total arable agricultural land is expected to face high salinity problems [8]. Between 1880 and 2012, the average global combined land and ocean surface temperature increased by 0.85 degrees Celsius [9]. From here on, an average increase of at least 0.2 degrees Celsius every decade is predicted. The increasing concentration of greenhouse gases is a significant contributor to global warming. CO2 and methane concentrations have increased by 30 and 150% over the last 250 years [10,11]. These pressures have the most significant impact on plant development and productivity of any environmental element. For example, worldwide wheat production was predicted to fall by 6% for every degree Celsius increase in temperature [12]. Although rising temperatures benefit crop output in certain, more excellent, parts of the planet, the overall impact on global food security remains negative [13].
The detrimental impacts of salinity and heat stress on plant growth and production parameters have been extensively documented by numerous researchers [14,15,16,17,18]. However, under field conditions, plants may well be exposed to various abiotic stresses that occur sequentially or simultaneously during their lifespan. The responses of plants subjected to multiple stress combinations remain unknown [19]. The impact of a singular stressor on a plant’s response to various stressors may exhibit either complementary or antagonistic effects. This is because distinct stress factors influence the plant’s reaction to different stressors, even though individual stress variables control the plant’s response to other stressors [20]. Stresses that occur concurrently in the field may modify plant metabolism more precisely than different stress. In the face of concurrent heat and salt stress, plants exhibit a heightened K+ concentration and a diminished Na+/K+ ratio through the accumulation of glycine betaine and trehalose [21]. As a physiological activity, plants cannot sustain a high K+/Na+ ratio in their cytosol because salinity increases Na+ efflux [22], while heat stress decreases K+ efflux [23] in the roots. To adjust to such a stressful situation, crops endogenously develop compatible solutes (e.g., sugars, proline, carbohydrates, amino acids, phenolics, polyols, polyamines, or lipids) which have many different biological functions [24] and protective (e.g., heat shock proteins) proteins [25,26,27] to counteract oxidative stress. Upregulation of HKT, NHX, and SOS genes are just a few ways plants keep their Na+ and K+ levels stable. In addition, earlier research has shown that heat stress transcription factors (HSFs) regulate the HSP70 and HSP22 genes, which play critical roles in cell responses to heat stress [28]. Phytohormones such as ABA [29] and SA [30] mitigate the suppressive impact of salinity and high temperature through the regulation of biological and biochemical mechanisms associated with developmental processes.
Previously we showed rice genotypes’ tolerance capacity and mechanism under salinity, high-temperature stress, and stress release at the seedling stage [31]. However, plants may be exposed to various abiotic stress combinations that occur sequentially or simultaneously in natural habitats. In this study, we aim to test three rice genotypes under 6 different stress scenarios combinations of control (26 °C, 0 mM NaCl), salinity (26 °C, 75 mM NaCl), heat (31 °C, 0 mM NaCl), and heat and salinity (31 °C, 75 mM NaCl) stress at vegetative and reproductive stages. We determine yield and yield-related traits, leaf gas exchange traits, and morphologic and biochemical traits under single stress and stress combinations and evaluate all data by tolerance-related traits/markers by deep learning approaches to identify multiple stress tolerant genotypes.

2. Results

2.1. YNU31-2-4 Rice Genotype Shows Higher Growth Performance under Salinity and Heat and Salinity Stress

The plant growth performance of Yukinkomai, YNU31-2-4, and YNU SL rice genotypes from the vegetative stage under control, salinity, heat, and heat and salinity stress combinations (T1, T2, T3, T4, T5, and T6) are shown in Figure 1 and Figure S1. Under control (26 °C, 0 mM NaCl) conditions at the seedling stage (SS), vegetative stage (VS), and reproductive stage (RS), which is treatment 1 (T1), the YNU31-2-4 genotype shows a higher growth compared with the Yukinkomai genotype. Still, the YNU SL genotype does not show significantly different growth performance compared with the YNU31-2-4 and Yukinkomai genotypes at week 8 (W8) under control conditions (Figure 1A). Although uniform-looking plants were selected as beginning populations at the VS (Figure 1, 0 points of X axis), in the next 3 weeks, the YNU SL and Yukinkomai genotypes show different developmental responses under control conditions (Figure 1A,E). These differences may be welded genotypic and environmental conditions under control conditions. Treatment 2 (T2) represents salinity (26 °C, 75 mM NaCl) stress at only VS, and the YNU31-2-4 genotype shows significantly highest growth performance from W3 to W8 under T2 compared with the Yukinkomai and YNU SL rice genotypes (Figure 1B). Salinity stress at VS and RS was applied in treatment 3 (T3), and the YNU31-2-4 genotype shows a salinity tolerance as better plant growth compared with the Yukinkomai and YNU SL genotypes (Figure 1C). The rice genotypes were subjected to salinity at VS and heat (31 °C, 0 mM NaCl) at RS in treatment 4 (T4), and YNU31-2-4 shows the highest durability, followed by the Yukinkomai and YNU SL genotypes, respectively (Figure 1D). Treatment 5 (T5) represents heat stress at RS. Surprisingly all genotypes show almost similar growth patterns, and significantly different plant growth are not observed among all genotypes (Figure 1E). Treatment 6 (T6) represents salinity at VS and heat and salinity (31 °C, 75 mM NaCl) at RS as multiple stress conditions. The YNU31-2-4 rice genotype shows the highest growth performance not only with salinity stress at VS but also under heat and salinity stress at RS (Figure 1F).

2.2. YNU31-2-4 Rice Genotype Defense Photosynthetic Activity by Higher Chlorophyll Content and Stomatal Conductance from Heat and Salinity Stress Damage

The salt stress at the VS (T2) significantly reduces Chlb and ChlT in all genotypes compared with the T1 condition, but the reduction percentage is lower in the YNU31-2-4 genotype. The T2 condition significantly increases An and gs traits in all genotypes compared with the T1 condition. The highest An and gs are found in the YNU SL genotype compared with the Yukinkomai and YNU31-2-4 genotypes (Figure 2A and Table A1 and Table A2). The salinity stress at the VS and RS (T3) significantly reduces all traits except An in Yukinkomai and YNU31-2-4 genotypes and WUE traits. The highest An, gs, E, Chla, Chlb, ChlT, and RWC are found in the YNU31-2-4 genotype compared with the Yukinkomai and YNU SL genotypes (Figure 2B and Table A1 and Table A2). The salinity and heat stress at the VS and RS (T4) increases the WUE in Yukinkomai (39%), YNU31-2-4 (7%), and YNU SL (26%) genotypes. The highest Ci, Chla, Chlb, ChlT, and RWC traits are found in the YNU31-2-4 genotype. The highest An and gs are found in the Yukinkomai genotype, while it is significantly decreased in the YNU31-2-4 and YNU SL genotypes (Figure 2C and Table A1 and Table A2). The heat stress at the RS (T5) significantly increases gs and E compared with T1 in all genotypes. The highest An and WUE are detected in the YNU31-2-4 genotype. Furthermore, T5 significantly reduces the Chla content in all genotypes, but the reduction percentage is lower in the YNU31-2-4 genotype compared with the Yukinkomai and YNU SL genotypes (Figure 2D and Table A1 and Table A2). The salinity at VS and heat and salinity at RS (T6) significantly reduce gs, Ci, E, Ci/Ca, Chla, Chlb, ChlT, and RWC in all genotypes, but the lowest reduction is recorded in the YNU31-2-4 genotype compared with the Yukinkomai and YNU SL genotypes. The highest An, gs, Ci, Ci/Ca, Chla, Chlb, ChlT, and RWC are observed in the YNU31-2-4 genotype (Figure 2E and Table A1 and Table A2 and Table S1).

2.3. YNU31-2-4 Genotype Shows Higher Plant Growth and Yield Performance under Salt, Heat, and Heat + Salt Stress Treatments

The salt stress at the VS (T2) significantly reduces plant height (PH), plant biomass (PB), root length (RL), root biomass (RB), root length (RL), root biomass (RB), panicle number (PN), panicle length (PL), flag leaf area (FLA), grain number per panicle (GPP), spikelet number (SN), 100-grain weight (TGW), and yield per plant (YPP) in all genotypes, except the panicle number of YNU31-2-4 genotype is significantly increased by 22% compared with T1. Although reductions are observed, less reduction is recorded in the YNU31-2-4 genotype under T2 compared with T1 conditions (Figure 3A and Table A3 and Table A4). The salinity stress at the VS and RS (T3) significantly reduce all measured traits; in particular, the plant biomass of Yukinkomai, YNU31-2-4, and YNU SL genotypes are decreased by 82, 52, and 81% under T3 compared with T1 conditions. The YNU31-2-4 genotype reduces all measured traits less than the Yukinkomai and YNU SL genotypes under T3 conditions (Figure 3B and Table A3 and Table A4). The salinity and heat stress at the VS and RS (T4) reduces all measured traits. The PB and RB are highly reduced by approximately 68 to 83% in the Yukinkomai and YNU SL genotypes, but it is reduced by 29 and 47% in the YNU31-2-4 genotype, respectively. The highest PH, PB, RB, PL, FLA, GNPP, SN, TGW, and YPP were found in the YNU31-2-4 rice genotype under the T4 condition (Figure 3C and Table A3 and Table A4). The heat stress at the RS (T5) negatively affects measured traits less than T2, T3, T4, and T6 conditions. The YNU31-2-4 genotype shows significantly higher RL, RB, and TGW under T5 conditions. The other measured traits show no significant differences among the Yukinkomai, YNU31-2-4, and YNU SL genotypes under the T5 condition (Figure 3D and Table A3 and Table A4). The salinity at VS and heat and salinity at RS (T6) are significantly reduced in all measured traits compared with T1. The YNU31-2-4 genotype shows the lowest reduction in PH, PB, RB, PN, PL, FLA, GNPP, SN, TGW, and YPP traits, and it shows the highest PH, PB, PL, FLA, GNPP, TGW, and YPP compared with T1 under T6 condition (Figure 3E and Table A3 and Table A4).

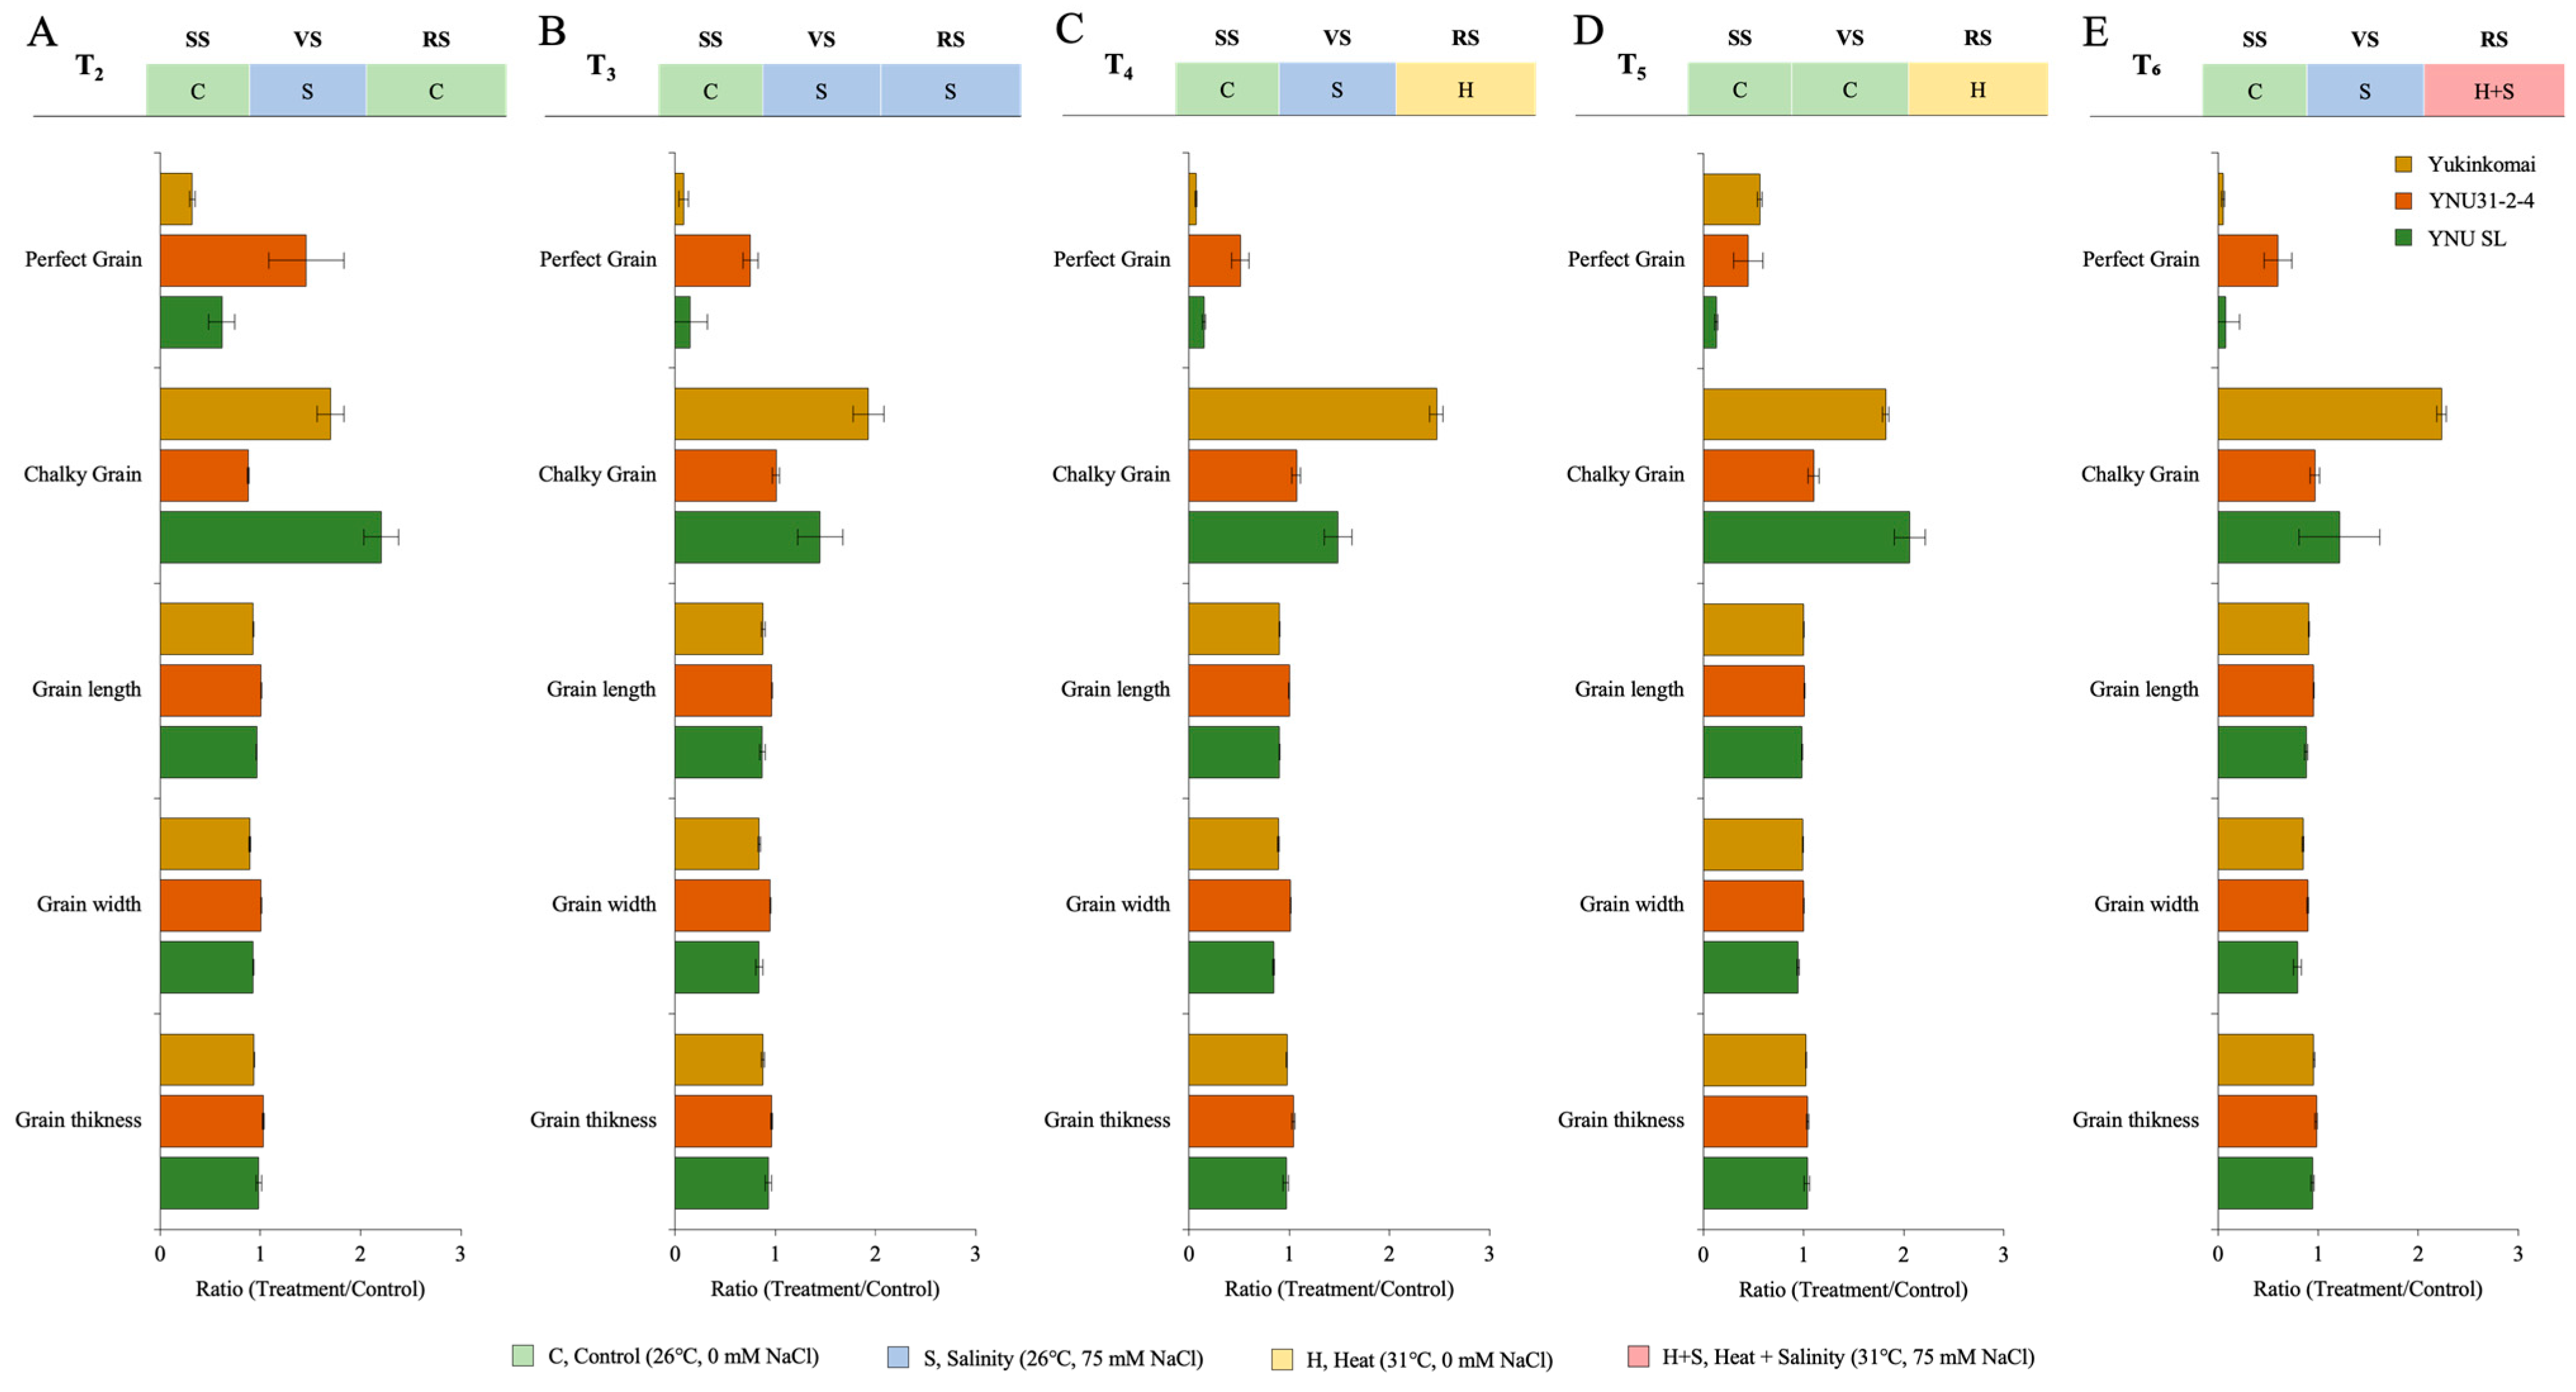
2.4. YNU31-2-4 Genotype Has High Perfect Grain Potential under Salinity and Heat and Salinity Stress Treatments

The grain size and quality parameters, such as grain length (GL), grain width (GW), grain thickness (GT), and perfect grain (PG) numbers, are significantly reduced under all stress treatments. Still, the number of chalky grains (CG) significantly increases. The salinity at VS (T2) significantly decreases grain size (GL, GW, and GT) and PG number in the Yukinkomai and YNU SL genotypes. Still, the YNU31-2-4 genotype increases the PG number by 45% and reduces the CG number by 12% compared with T1 under the T2 condition (Figure 4A and Table A5). The salinity stress at VS and RS (T3) significantly reduces grain size and PG number. Surprisingly, the PG number decreases by 91 and 85% in Yukinkomai and YNU SL genotypes, and the PG number of YNU31-2-4 is only reduced by 24% compared with T1 under the T3 condition. The CG number is increased in Yukinkomai (92%) and YNU SL (44%) genotypes but almost not changed in YNU31-2-4 (0.6%) genotypes. The grain size is also significantly reduced in all genotypes, but the reduction percentage is lower in the YNU31-2-4 rice genotype than in T1 under the T3 condition (Figure 4B and Table A5). A similar pattern is also observed under the T4 condition. The YNU31-2-4 genotype only has a 24% reduction in the PG number, but the Yukinkomai and YNU SL genotypes have a 91 and 85% reduction in PG number compared with T1 under the T4 condition, respectively. The CG number is significantly increased by 146 and 48% in the Yukinkomai and YNU SL genotypes, but the CG number of the YNU31-2-4 genotype just increases by 7% compared with T1 under the T4 condition. Furthermore, less grain size reduction is recorded in the YNU31-2-4 genotype compared with the Yukinkomai and YNU SL genotypes under the T4 condition (Figure 4C and Table A5). The heat stress at RS negatively affects the PG number in all genotypes, but the Yukinkomai genotype has a lower reduction than the YNU31-2-4 and YNU SL genotypes under the T5 condition. The CG number is found to increase in all genotypes. Still, an increment in the percentage of YNU31-2-4 is detected as lower than in Yukinkomai and YNU SL genotypes under the T5 condition. The heat stress increases the GT number in all genotypes, and the highest increment is observed in the YNU31-2-4 genotype under the T5 condition (Figure 4D and Table A5). The salinity at VS and heat and salinity stress at RS significantly reduce the PG number by 95 and 92% in Yukinkomai and YNU SL genotypes. Still, it reduces the PG number by 40% in the YNU31-2-4 genotype under the T6 condition. The CG number significantly increases by 123 and 21% in Yukinkomai and YNU SL genotypes, and it is raised by just 3% in the YNU31-2-4 genotype under the T6 condition. The T6 significantly reduces grain size, but the reduction rate is lower in the YNU31-2-4 genotype than in the Yukinkomai and YNU SL genotypes under the T6 condition (Figure 4E and Table A5).

2.5. YNU31-2-4 Genotype Increased CAT Activity under Stress Conditions

The salinity at VS (T2) shows a significant reduction of protein (PROT), proline (PRO) content, superoxide dismutase (SOD) partly, and ascorbate peroxidase (APX) activity in all genotypes. The malondialdehyde (MDA) content is significantly increased in all genotypes, but lower MDA content and higher PRO and APX content are recorded in the YNU SL genotype under T2. The CAT activity of the YNU31-2-4 genotype is significantly increased compared with the control (T1) under the T2 condition (Figure 5A and Table A6). The salinity at VS and RS (T3) reduces the protein content in Yukinkomai and YNU SL genotypes but increases in the YNU31-2-4 genotype under the T3 condition. The highest MDA, PRO content, SOD, and APX activity is observed in the Yukinkomai genotype. YNU31-2-4 genotype shows higher CAT activity under the T3 condition (Figure 5B and Table A6). The salinity at VS and heat at RS (T4) reduce SOD activity in all genotypes. Still, less reduction and higher production are observed in the YNU31-2-4 genotype compared with the Yukinkomai and YNU SL genotypes under T4. Furthermore, PRO and SOD reduction is lower in the YNU31-2-4 genotype than in other tested genotypes under the T4 condition (Figure 5C and Table A6). The heat stress at RS (T5) reduces the PRO accumulation and increases PROT, CAT, SOD, and APX activity in all genotypes. The YNU31-2-4 genotype shows less PRO reduction than the Yukinkomai and YNU SL genotypes under the T5 condition. Furthermore, the YNU31-2-4 genotype shows a higher increment by 178, and 278% in CAT and SOD activity under the T5 condition, respectively (Figure 5D and Table A6). The salinity at VS and heat and salinity at RS (T6) increase PROT, PRO, CAT, SOD, and APX by 16, 63, 195, 52, and 64% in the YNU31-2-4 genotype, respectively (Figure 5E and Table A6).

2.6. YNU31-2-4 Genotype Has Lower Na+ Ion Accumulation under Salinity Stress Conditions

The salinity stress as VS (T2) increases ion accumulation in all genotypes compared with the T1 condition. The genotypes of Yukinkomai and YNU SL exhibit the greatest accumulation of Na+ ions in their shoots and roots. The YNU31-2-4 genotype exhibits reduced levels of shoot and root Na+ accumulation compared to the Yukinkomai and YNU SL genotypes when subjected to T2 conditions. The genotype YNU31-2-4 exhibits the greatest accumulation of K+ in shoot tissues during T2. Furthermore, it is observed that the YNU31-2-4 genotype exhibits a decreased Na+/K+ ratio when subjected to T2 (Figure 6A and Table A7). The salinity stress at VS and RS (T3) increases Na+ accumulation in the Yukinkomai, YNU31-2-4, and YNU SL genotypes compared with T1 and T2 conditions. Under the T2 condition, the highest Na+ accumulation at the shoot and root tissues is recorded in the YNU SL genotype, and the lowest Na+ accumulation is observed in the YNU31-2-4 genotype.
The highest K+ accumulation at the shoot and root tissues is recorded in the YNU31-2-4 genotype under the T3 condition. The lowest Na+/K+ ratio is also observed in the YNU31-2-4 genotype (Figure 6B and Table A7). The salinity stress at VS and heat stress at RS (T4) significantly reduce Na+ ion accumulation at the shoot and root tissues in all genotypes compared with the control (T1) treatment. The lowest Na+ accumulation at the shoot and root tissues is observed in the YNU31-2-4 genotype compared with Yukinkomai and YNU SL genotypes. The highest K+ ion accumulation at the shoot and root tissues is recorded in YNU31-2-4 genotype under T4. The Na+/K+ ratio is also lower in YNU31-2-4 genotype under T2 (Figure 6C and Table A7). The ion accumulation of all genotypes is found to be very low under heat stress at RS (T5). The K+ ion accumulation of the Yukinkomai genotype at shoot tissues is increased by 172% compared with the control (T1) condition, and K+ accumulation of the YNU31-2-4 genotype at root tissues is increased by 198% compared with the control (T1) condition under T5 condition (Figure 6D and Table A7). The salinity stress at VS and heat and salinity stress at RS (T6) significantly increases Na+ ion accumulation compared with the control (T1) condition. The lowest Na+ ion accumulation and Na+/K+ ratio at the shoot and root tissues are observed in the YNU31-2-4 genotype under the T6 condition. Surprisingly, a higher K+ accumulation is observed in the YNU SL genotype under the T6 condition (Figure 6E and Table A7).

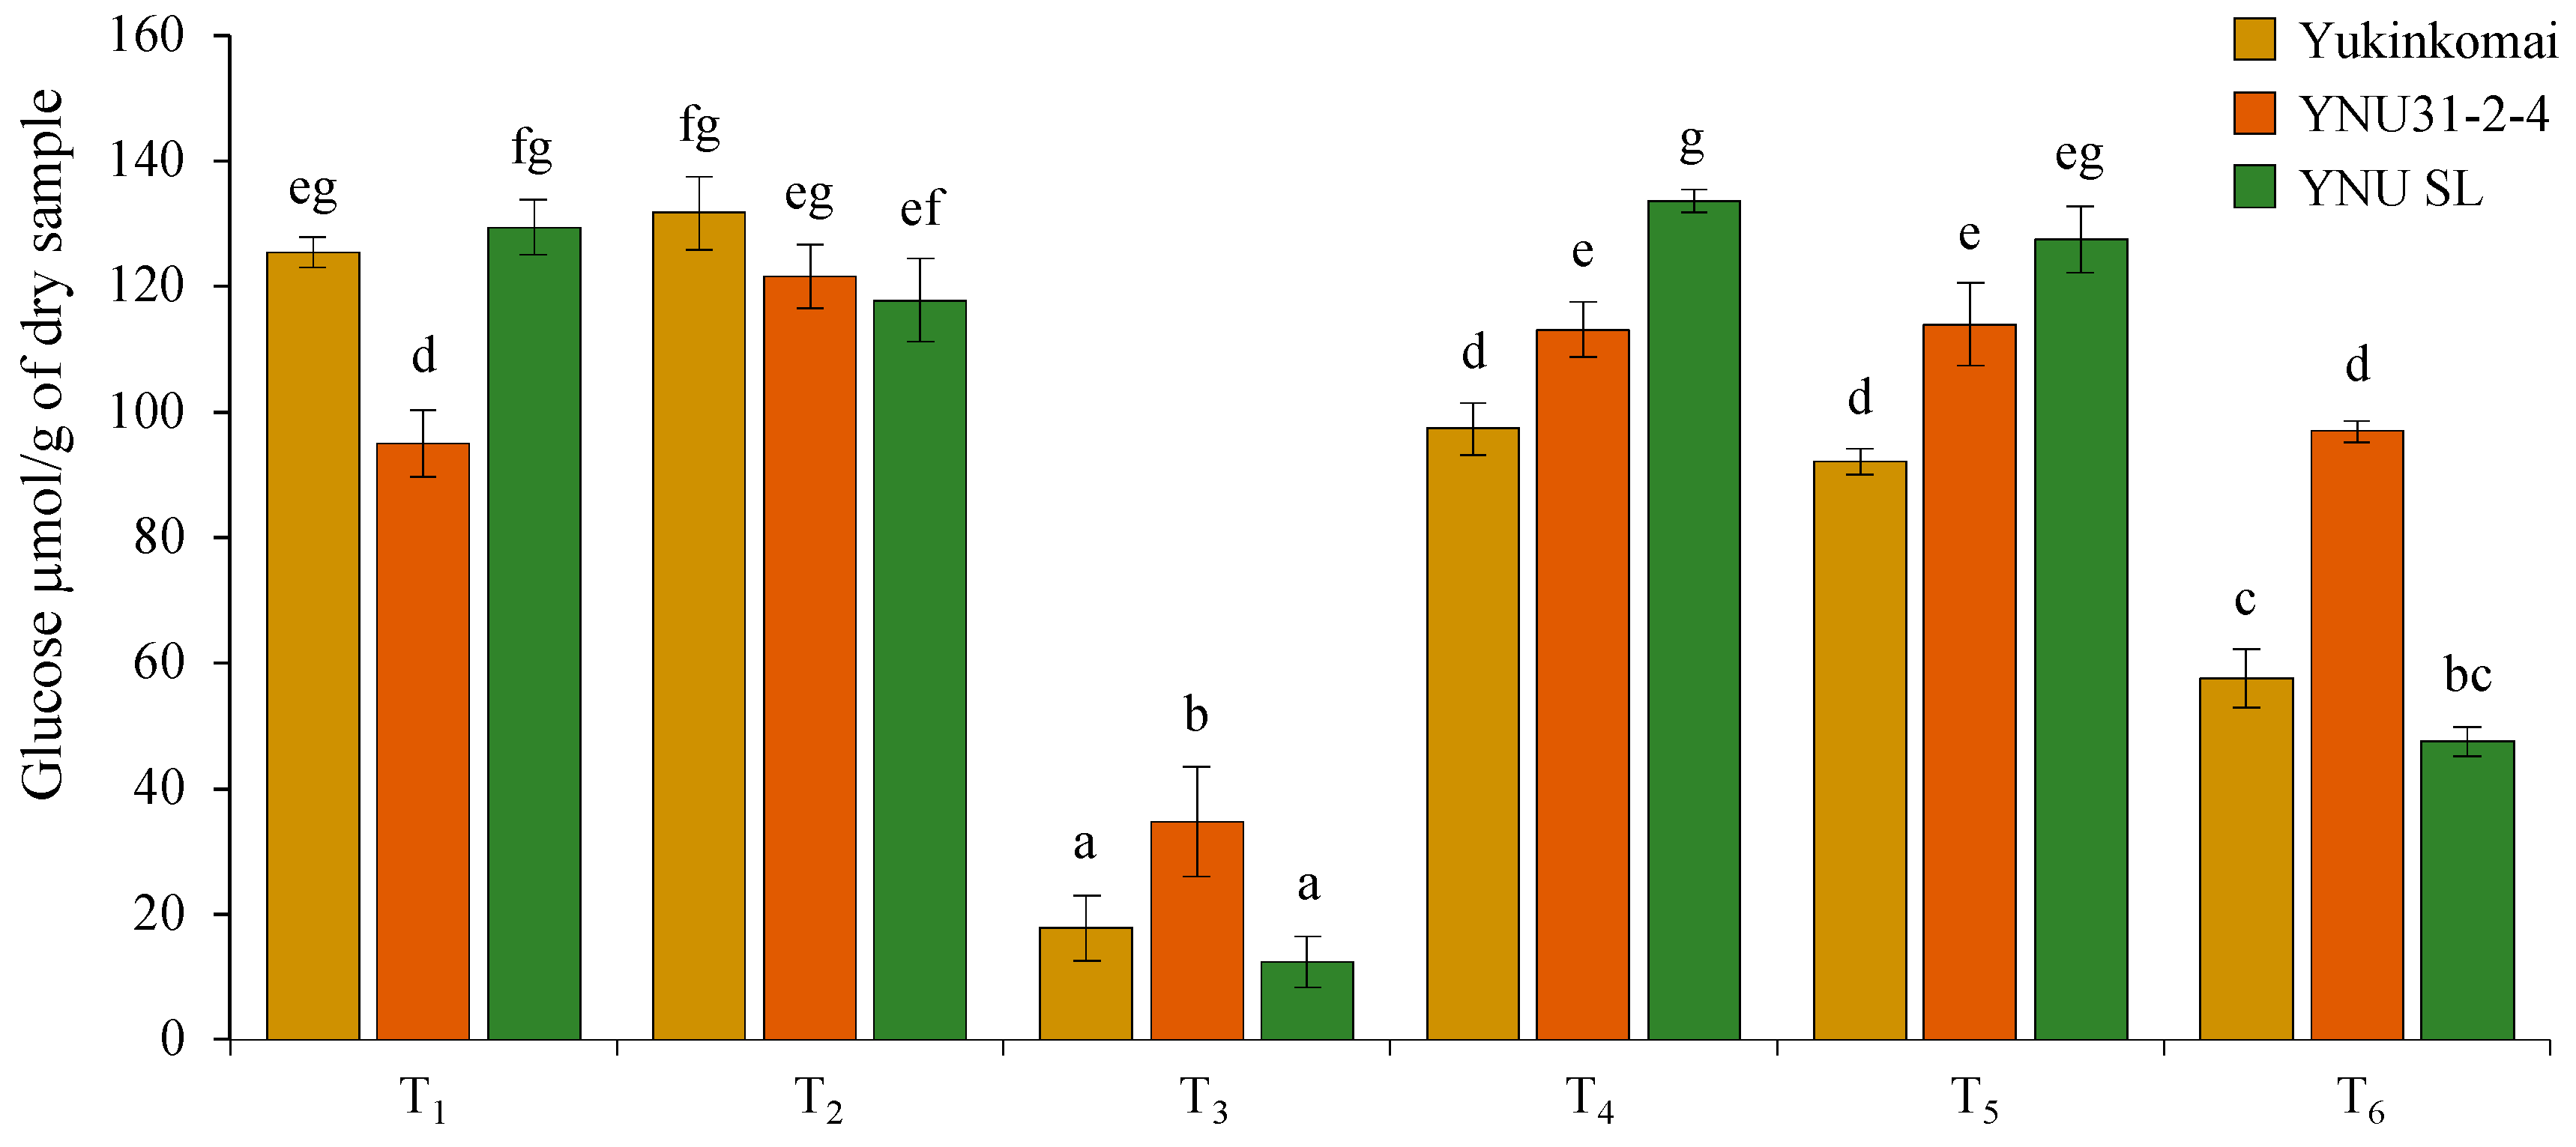
2.7. Salinity Reduces Glucose Accumulation in Dry Seeds, but the YNU31-2-4 Genotype Has Higher Glucose Accumulation under Salinity and Heat and Salinity Stress

Under control (T1) conditions, the YNU31-2-4 genotype has lower glucose (GLU) content in dry seeds compared with Yukinkomai and YNU SL genotypes. It is clear that the salinity stress at VS (T2) does not affect the GLU accumulation of the Yukinkomai and YNU SL genotypes, but it increases the GLU accumulation by 27% in the YNU31-2-4 genotype. The salinity stress at VS and RS (T3) significantly reduces the GLU accumulation by 85, 63, and 90% in dry seeds of Yukinkomai, YNU31-2-4, and YNU SL genotypes. The highest GLU accumulation is recorded in the YNU31-2-4 genotype under the T3 condition. The salinity stress at VS and heat stress at RS (T4) decrease GLU accumulation by 22% in the Yukinkomai genotype but significantly increase GLU accumulation by 19 and 3% in YNU31-2-4 and YNU SL genotypes compared with control (T1) condition, respectively. The heat stress at RS (T5) significantly reduces the GLU accumulation by 26 in the Yukinkomai genotype, but it significantly increases the GLU accumulation by 20% in the YNU31-2-4 genotype. Lastly, the salinity stress at VS and heat and salinity stress at RS (T6) significantly reduce GLU accumulation by 54 and 63% in Yukinkomai and YNU SL genotypes compared with control (T1) conditions. Still, they do not change the GLU accumulation in the YNU31-2-4 genotype (Figure 7).

2.8. YNU31-2-4 Genotype Showed Higher Salinity Stress and Heat and Salinity Stress Tolerance according to the Overall Result Evaluation by PCA and HCA Clustering

The principal component analysis (PCA) was performed on measured traits from three rice genotypes under six treatments (T1 to T6) to evaluate the salinity, heat, and heat and salinity stress tolerance capacity of genotypes and identify response similarity among treatments. The PCA showcases the performance of rice genotypes across various stress conditions. The analysis reveals two significant variables, namely Dimension 1 (Dim1) and Dim2, with Dim1 accounting for the majority share of 52.1% and Dim2 contributing 10.2%. In total, Dim1 and Dim2 together account for 62.3% of the observed variance (Figure 8A and Table S2). The hues of the distinct variables denote their level of representation quality of the principal component, which is abbreviated as ‘Cos2’ (Table S2). The Yukinkomai, YNU31-2-4, and YNU SL genotypes are clearly separate from each other based on the stress treatment in Figure 8A. The T1 and T5, T2 and T4, and T3 and T6 conditions are grouped, but the YNU31-2-4 genotypes group differently from the Yukinkomai and YNU SL genotypes under T2 and T4 and T3 and T6 conditions. The analysis of Euclidean distance, which depicts the correlation between rice germplasms cultivated under stress conditions, provides evidence for the differentiation between germplasms with higher and lower stress tolerance. (Figure 8A, right-top panel). Statistically significant differences (p < 0.05) are observed in the Euclidean distance between T1 and T6, with the YNU SL genotype showing the highest distance, followed by Yukinkomai. Conversely, the YNU31-2-4 genotype exhibits the lowest distance under T2, T3, T4, and T6 conditions. The data presented indicate the presence of elements in the Euclidean distance matrix of the tested accessions, which validate the YNU31-2-4 genotype as having significantly distinct responses to stress combinations T2, T3, T4, and T6. The WUE, PRO, SOD, APX, NaS, NaR, KS, NaKS, and NaKR traits are associated with the T3 and T6 conditions. CAT, KR, An, CG, MDA, Gs, PN, Ci, Ci, Ca, Chla, E, RL, and RWC traits are associated with the T2 and T4 conditions, and the rest of the traits are detected associated with the T1 and T5 conditions (Figure 8B).
The results of the two-way hierarchical clustering analysis (HCA) indicate that the measured traits observed under T1 to T6 conditions can be grouped into two distinct primary clusters, as depicted in the generated heat map (Figure 8C, groups I and II). Group I (PRO, WUE, KS, NaR, NaS, NaKS, NaKR, APX, and SOD) traits are highly expressed in the T3 and T6 conditions in all genotypes. Group II traits are highly expressed in T1 and T5 traits in all genotypes. The heatmap categorizes the Yukinkomai, YNU31-2-4, and YNU SL genotypes into five clusters using data from the T1 to T6 conditions (Figure 8C, groups C1 to C5). Under T3 and T6 conditions, Cluster 1 (C1) indicates Yukinkomai (Y) and YNU SLU (S) genotypes. The Yukinkomai genotype shows a high sensitivity to salinity and heat and salinity stress. The YNU31-2-4 (N) genotypes under T3 and T6 conditions are both assigned to C2. The Yukinkomai and YNU SL genotypes under T2 and T4 conditions regrouped in C3. Under the same condition (T2 and T4), the YNU31-2-4 genotype is separated from other genotypes and located in C4. Lastly, C5 represents the Yukinkomai, YNU31-2-4, and YNU SL genotypes under T1 and T5 conditions (Figure 8C).

3. Discussion

Plant growth is vulnerable to unfavorable climatic conditions, and agricultural systems take significant damage if there are not enough precautions to adapt plants to the changing environment [32]. Salinity, heat, drought, pollution, and soil nutrient deficiency are the main environmental limitations for modern agricultural applications. These abiotic stress factors compromise plant growth and development through morphological, physiological, biochemical, and molecular processes and result in yield reduction, in which animals and humans may face hunger soon [33]. The current approaches to evaluating the stress tolerance capacity of plants are based on single stress factor effects. Still, in natural habitats, plants may be exposed to various abiotic stress combinations that occur sequentially or simultaneously [20]. Our stress scenarios (T1, T3, T5, and T6) are modeled based on natural events, but two (T3 and T4) are hypothetical. In this experiment, plants are not exposed to any stress at the seedling stage (T1) because of two reasons: firstly, we tested the seedling stage multiple stress tolerance levels of rice genotypes in our previous study [31], and secondly, rice seedlings generally are planted in paddy fields at around 15–30 days old [34], so plants may not be exposed to stress factors during the seedling stage. In agriculture, soil salinity is typically assessed based on the electrical conductivity of the saturation extract (ECe), with a threshold of 4 deci-Siemens per meter (dSm−1) commonly used to define saline soils. Rice is very sensitive to salinity. Field studies have shown that a seasonal salinity of the field water over 1.9 dSm−1 can decrease grain yields; current recommendations suggest that salinity impacts most cultivated rice genotypes’ yield at or above 3.0 dSm−1 or around 30 mM NaCl [35,36]. For example, rice grown in soils with an ECe as low as 3.5 dSm−1 has been found to experience a yield loss of approximately 10%, and at an ECe of 7.2 dSm−1, yield loss can reach up to 50% [37]. According to the findings of another study, paddy rice yields begin to decrease at salinity levels of more than 3 dSm−1, after which a fall of 12% in yield may be anticipated for every 1 dS m1 increase in ECe [38]. Especially after the tsunami, a considerable geographical variation in the salinity level of ponded water was observed. The ECe in Japan ranges from 0.31 to 68.2 mScm−1, and it has been found that the salinity level varied greatly across the country [39]. In our study, a salt concentration of 75 mM was selected as the reference point for soil affected by a potential tsunami disaster, based on the salt concentration of the Japan Sea and Pacific Ocean [40] at VS (T2 and T4) and VS and RS (T3 and T6). Furthermore, in accordance with previous studies and our preliminary experiments, a single concentration of 75 mM NaCl was used as the salt stress in our investigation due to its close approximation to the LD50 value [37].
Based on the developmental phase, approximately 28 °C temperature is considered for the optimum growth and development of Oryza sativa L. [41,42]. The heat stress was applied at 31 °C, which refers to the global temperature rise [43]. The plants were exposed to heat stress only during the reproductive stage because of the most physiologically critical temperatures in the reproductive stage [44]. Additionally, multiple heat and salinity stresses were applied for the seen effect of multiple stress at RS in treatment 6 (T6) on rice genotypes.
Several abiotic stressors may have a cumulative or synergistic effect on plant development. Combined conditions, such as salinity and heat, are more damaging to plant growth than just one of these factors alone [19]. The first observation of the stress effect on plants is growth and photosynthesis performance under osmotic stress, which results from salinity and heat stress conditions [45,46,47]. While the rice plants can sense the stress, especially salinity stress, within five days at the seedling stage [31], bigger plants (at the vegetative stage) sense the salinity stress after three weeks in our experiment. After three weeks, salinity stress application devastates the plant growth of salt-sensitive genotypes (Yukinkomai and YNU SL). The Yukinkomai and YNU SL genotypes show different developmental responses under control conditions, and these differences can be welded to genotypic and environmental factors. Genetic copies of the plant genotype can exhibit strikingly distinct phenotypes under divergent naturalistic greenhouse conditions [48]. After eight weeks, the grain-filling stage and stress tolerance appear in the YNU31-2-4 genotype (Figure 1). Surprisingly, the heat stress at RS does not make any significant differences in plant growth performance because the plant growth was already completed at the reproductive stage (around 80 days old) to produce generative organs [49].
Photosynthesis is the most fundamental and intricate physiological event that directly affects plant growth and can be negatively affected by stressful environments such as heat and salinity [50]. The net photosynthesis rate (An) was negatively affected by stress conditions in sensitive genotype YNU SL but primarily significantly increased in the YNU31-2-4 genotype. The YNU31-2-4 genotype showed significantly higher An under T3 (salinity at VS and RS) and T6 (salinity at VS and heat and salinity at RS) conditions (Figure 2 and Table A1 and Table A2). These stressors limit photosynthetic rate due to stomatal or nonstomatal constraints caused by stress [51,52]. For instance, in most green plants, drought stress, even at its low severity, can impede stomatal conductance and leaf photosynthesis [53]. The modulation of leaf stomatal conductance (gs) is an essential phenomenon in plants because it is necessary for desiccation avoidance and plant growth [54,55]. Although stress applications significantly reduce gs in all genotypes, the gs is higher in the YNU31-2-4 genotype than in other tested genotypes under T3 and T6 conditions (Figure 2 and Table A1 and Table A2).
The effects of osmotic stress caused by salinity on photosynthetic apparatus and metabolism are to be expected. Large concentrations of harmful ions, such as Na+ and Cl, are known to damage thylakoid membranes when they accumulate in chloroplasts during salt stress [56,57]. The chloroplast is the binding site for photosynthesis, in which light and dark reactions occur. Salt stress can break down chlorophyll (Chl), the effect ascribed to an increased level of the toxic cation, Na+ [58,59,60,61]. Under salinity and multiple heat and salinity stress conditions, the YNU31-2-4 genotype shows a higher Chl accumulation (Figure 2 and Table A3 and Table A4). Although salt stress reduces the Chl concentration, the reduction level depends on the plant salt tolerance. For example, it is well known that Chl concentration increases in salt-tolerant species while decreasing in salt-sensitive species in saline regimes [62,63,64]. As a result, Chl accumulation has been recommended as one of the potential biochemical indicators of salt tolerance in various crops, such as wheat and rice [31,64].
Stressful environments have been shown to limit plant growth [65,66] and reduce crop yields through gas exchange characteristics [67,68,69]. In our experiment, salinity, heat, and heat and salinity stressors significantly reduce all harvesting parameters, grain size, and quality. The YNU31-2-4 genotype is less negatively affected than Yukinkomai and YNU SL genotypes under stressful environments. Although salinity and multiple heat and salinity stress reduce harvesting parameters, the YNU31-2-4 genotype shows higher PH, PB, RB, PN, PL, FLA, GNPP, SN, TGW, and YPP traits compared with other tested genotypes (Figure 3 and Table A5). Additionally, grain size and quality are higher in the YNU31-2-4 genotype than in the Yukinkomai and YNU SL genotypes under stress conditions (Figure 4 and Table A6). The heat and salinity stress causes substantial yield losses, and yield parameters are the primary tolerance determinant in crops [70]. It is seen that the YNU31-2-4 genotype has higher salinity and multiple heat and salinity stress tolerance capacity with higher yield and grain quality performance. Previously salt- and heat-tolerant genotypes also show similar responses under single stresses [71,72,73,74,75,76,77,78]. YNU31-2-4 genotype has a tolerance to salinity and heat stress and the tolerant capacity to multiple heat and salinity stress. The reason behind the tolerance mechanism of the YNU31-2-4 genotype can be seen in increasing CAT activity, lower toxic Na+ ion accumulation, and higher K+ accumulation (Figure 5 and Figure 6, and Table A6 and Table A7). Previously, we found low Na+ and high K+ accumulation as similar patterns under salt stress in the YNU31-2-4 genotype [31,79,80]. Related to salinity tolerance, we also find higher glucose accumulation in dry seeds of the YNU31-2-4 genotype; however, salinity and multiple heat and salinity stress reduce glucose accumulation in all tested genotypes (Figure 7). Glucose is a crucial signaling molecule in the stress tolerance mechanism, and higher glucose increases plant growth, photosynthesis, and salinity tolerance in plants [81].
This study’s findings reveal the YNU31-2-4 genotype’s ability to tolerate salinity and heat, thereby corroborating the efficacy of the PCA and HCA methodology in assessing stress tolerance in rice genotypes. As depicted in Figure 8, the stress treatments are categorized into T1 and T5, T2 and T4, and T3 and T6 conditions. However, the YNU31-2-4 genotype is located differently than other tested genotypes near the control (T1) treatment under T2, T3, T4, and T6 conditions. The PCA results indicated that the YNU31-2-4 genotype exhibits a greater capacity for stress tolerance. Furthermore, the Euclidean distance analysis reveals a correlation between the stress treatments and the separation of rice germplasms into more resilient and less resilient stress tolerance groups (Figure 8A, right-top panel) as previously described in other crop species [82,83]. The Yukinkomai and YNU SL genotypes are sensitive to salinity and heat and salinity stresses. Still, the YNU31-2-4 genotype shows a higher tolerance under both stress conditions with higher photosynthesis, CAT activity, and lower Na+ ion accumulation.

4. Materials and Methods

4.1. Plant Material and Experimental Design

In this study, we used ‘Yukinkomai’ [84] and ‘YNU sister line (SL)’ [79] as salt-sensitive and ‘YNU31-2-4’ [80] as salt-tolerant rice genotypes. The ‘YNU31-2-4’ genotype was made by adding the hitomebore salt tolerant 1 (hst1) gene from “Kaijin” in an exact way using a method called “single nucleotide polymorphism (SNP) marker-assisted selection” (MAS). The SNP that caused the hst1 mutant line to tolerate high salt was found to be in the third exon of the Os06g0183100 gene, which is thought to code for a B-type response regulator called OsRR22. The ‘Yukinkomai’ genotype is a wild-type form of the ‘YNU31-2-4’ genotype [80], and the ‘YNU sister line (SL)’ is a salt-sensitive 99% identical genotype with ‘YNU31-2-4’ [79].
The rice seeds that had been stripped of their husks underwent a process of surface sterilization and were subsequently washed with a 2% hypochlorite solution (Fujifilm Wako Pure Chemical Corporation in Osaka, Japan). This process lasted for a duration of 20 min, after which the seeds were rinsed three times with sterile distilled water for a minute each time to eliminate any residual surface sterilization agents. The seeds that underwent sterilization were positioned on agar plates with a 1% concentration. These plates were supplemented with half of the Murashige and Skoog (MS) medium and were maintained at a pH of 5.8. The incubation process was carried out at a temperature of 26 °C. Ten-day-old seedlings were then transplanted to a tray with rice nursery culture soil containing 0.5 g N, 0.9 g P, and 0.5 g K kg−1 with the growth conditions 26/23 °C Day/night, 13/11 h day/night cycle, 350 µmol m−2 s−1 light intensity, and 70% relative humidity for 20 days. Thirty-day-old seedlings were transplanted into a 2.5 L pot containing rice nursery culture soil in the Kariwa Village Advanced Agro-Biotechnological Research Center (KAAB), Kashiwasaki, controlled growth chamber Niigata, Japan. Plants were grown at 26/23 °C Day/night temperature for 10 days to adapt to the greenhouse conditions. Forty-day-old uniform looking rice seedlings were accepted as the beginning of the vegetative stage and were subject to 6 different (Control; 26/23 °C, 0 mM NaCl, Salinity; 26/23 °C, 75 mM NaCl, Heat; 31/28 °C, 0 mM NaCl, and Heat and Salt; 31/28 °C, 75 mM NaCl) stress at different (SS; seedling stage, VS; vegetative stage, and RS; reproductive stage) growth periods (Table 1). The pots with plants under 75 mM salinity conditions (T2 and T4) were transferred to the 0 mM non-saline conditions after the removal of the salinity by washing to the control (26/23 °C) chamber (T2) or heat (31/28 °C) chamber (T4). Furthermore, the pots with plants under 0 mM non-saline conditions (26/23 °C) at the vegetative stage were transferred to a heat (31/28 °C) chamber at the reproductive stage (T5).

4.2. Sampling, Phenotyping, and Harvesting Determination

The experimental treatments were organized in a design that was completely randomized. Measurements were started a week after salt-stress treatment, and weekly plant growth was recorded. All experiments were performed in biological 3–5 replicates. Relative water content (RWC) was calculated according to Sade et al., (2009) from flag leaf as the following formula: %RWC = (FW–DM)/(Turgid Weight–DM) × 100.
The main agronomic traits such as plant height (PH), plant biomass (PB), root length (RL), root biomass (RB), panicle number (PN), panicle length (PL), flag leaf area (FLA), grain number per panicle (GNPP), spikelet number (SN), 1000-grain weight (TG), and yield per plant (YPP) were measured at the physiological maturity of grains. They were determined in 5 plants per genotype and treatment. Perfect grain (PG), chalky grain (CG), grain length (GL), grain width (GW), and grain thickness (GT) were determined as three replicates of 300-seed samples of each genotype for each treatment with a rice grain grader (RGQI20A, Satake, Hiroshima, Japan).

4.3. Chlorophyll Content and Leaf Gas Exchange Measurements

Chlorophyll pigments chlorophyll a (Chla), chlorophyll b (Chl b), and total chlorophyll (ChlT) contents were determined using the method of Hori et al. [85].
A portable photosynthesis LI-6400XL equipment was used to assess leaf gas exchange (LI-6400-20, LiCor Biosciences, Lincoln, NE, USA). The net photosynthetic rate (An) (μmol CO2 m−2 s−1), stomatal conductance (gs) (mmol m−2 s−1), transpiration rate (E) (mmol m−2 s−1), intercellular CO2 concentration (Ci), and the ratio of intercellular to ambient CO2 concentration (Ci/Ca) of the flag leaves (fully expanded functional leaves) were measured when the active photosynthetic radiation (PAR) was ≥1000 µmol m−2 s−1 to ensure maximum values at sunny without cloudy days during 9:00–13:00 and relative humidity ranging between 45–55%, a leaf temperature of 26 °C (NT) and 31 °C (HT) at the flowering stage. The ratio of An/E, which is the quantity of CO2 fixed per unit amount of water lost by transpiration, was used to compute the instantaneous water usage efficiency (WUE). Leaf gas exchange measurements were taken from five flag leaves of rice plants for each treatment.

4.4. Malondialdehyde (MDA), Proline, Protein, and Antioxidant Enzyme Activities

The free proline content was determined using a modified version of the method described by Bates et al. [86]. Briefly, 0.5 g of fresh leaf samples were homogenized in 10 mL of 3% sulfosalicylic acid and incubated at 4 °C for 24 h. The homogenate was centrifuged at 10,000× g at 25 °C for 5 min, and the supernatant (1 mL) was reacted with 1 mL of ninhydrin reagent and 1 mL of glacial acetic acid in a test tube at 100 °C for 1 h. The reaction was interrupted by placing the test tubes in an ice bath for 20 min. The proline was extracted with 2 mL of toluene and incubated for 30 min at ambient temperature. The toluene phase was discarded, and the absorbance at 520 nm was measured with a double beam spectrophotometer U-2900. (Hitachi, Tokyo, Japan).
The quantification of Malondialdehyde (MDA) was conducted using a refined technique developed by Dhindsa and Matowe [87]. In summary, the leaf specimen weighing 0.5 g was subjected to homogenization using 5 mL of 0.1% trichloroacetic acid and subsequently centrifuged at 12,500× g at a temperature of 25 °C for a duration of 20 min. Two milliliters of supernatant were combined with two milliliters of thiobarbituric acid-TCA. The mixture underwent incubation at a temperature of 90 °C for a duration of 30 min, following which the reaction was terminated by transferring the tube to an ice bath for a period of 10 min. The chromogen was quantified at wavelengths of 520 and 600 nm utilizing a double beam spectrophotometer model U-2900. (Hitachi, Tokyo, Japan).
The frozen leaf powder samples weighing 1 g were subjected to homogenization in a cold mortar using 4 milliliters of 1 molar phosphate buffer with a pH of 7.0. The buffer contained 0.1 millimolar of Na-EDTA. (10 mL). The homogenate underwent centrifugation at a force of 15,000 times the acceleration due to gravity for a duration of 15 min at a temperature of 4 degrees Celsius. The resulting supernatant was utilized for the purpose of quantifying antioxidant enzyme activities, as described in reference [88]
The protein concentration was determined by using a Bradford Protein Assay Kit (Bio-Rad Laboratories GmbH, Hercules, CA, USA).
The determination of Catalase (CAT) activity was carried out by observing the rate of reduction in absorbance at 240 nm over a period of three minutes subsequent to the utilization of H2O2 [89]. The experimental setup involved combining 0.8 mL of a 50 mM phosphate buffer solution (pH 7.6) containing 0.1 mM Na-EDTA, 0.1 mL of 100 mM H2O2, and 0.1 mL of enzyme extract in a 2 mL volume to form the reaction mixture.
The determination of the Superoxide Dismutase (SOD) method employed by Cakmak and Marschner [90] is carried out by measuring its ability to inhibit the photochemical reduction of nitro blue tetrazolium (NBT). The definition of a single unit of SOD was established as the quantity of the enzyme necessary to elicit a 50% reduction in NBT reduction at a temperature of 25 °C. The expression of Superoxide Dismutase (SOD) activity was quantified in units per minute per gram of fresh weight (FW). The measurement of absorbance was conducted at a wavelength of 650 nm utilizing a double beam spectrophotometer model U-2900. (Hitachi, Tokyo, Japan).
The activity of ascorbate peroxidase (APX) was evaluated by measuring the reduction in absorbance at 290 nm over a period of 1 min, using the method described by Amako et al. [91]. The experimental solution comprised 100 μL of extract sample, 50 mM potassium phosphate buffer (pH 7.6), 0.5 mM H2O2, and 0.1 mM ascorbate. The enzymatic reaction was commenced through the introduction of the enzyme extract, and subsequently, the reduction in absorbance was documented.

4.5. Na+ and K+ Measurement

The quantification of sodium (Na+) and potassium (K+) ions in shoots and roots was performed using a wet digestion method [92]. Plant samples, which were dried and finely powdered, weighing 10 mg, underwent digestion in a solution of HNO3. The specimens were subjected to incubation in a thermal bath at a temperature of 60 °C for a duration of 2 h. Following the cooling process, hydrogen peroxide was introduced to the digestion solution and subsequently subjected to heating within the range of 60 to 120 °C. The solution that underwent digestion was subjected to gentle shaking and filtration using 0.2-µm filters (Whatman, Maidstone, UK), with the solid residue being excluded. The quantification of Na+ and K+ contents in the extract was performed using Polarized Zeeman Atomic Absorption spectrophotometry. (Z-6100, Hitachi, Tokyo, Japan).

4.6. Measurement of Glucose Content

The measurement of glucose was done using the modified protocol of Kaneko et al. [93]. In brief, 50 mg of rice flour sample was taken into a 2 mL tube and treated with 0.5 mL of 80% ethanol and boiling dry heat bath for 5 min, and the mixture was centrifuged at 12,000× g for 10 min. The supernatant was boiled again for 20 min. The ethanol extraction process was repeated two times. The boiled supernatant was wholly dried in a vacuum concentrator, and then 60 µL ultrapure water was added to measure the free sugar extraction. The soluble glycan was hydrolyzed by 5 units of amyloid glycosidase and 1 unit of α-amylase, and the released glucose from soluble glycan was measured by a coupled enzyme reaction using hexokinase (HK) and Glc-6-P dehydrogenase (G6PDH) [94]. The assay mixture, composed of 100 mM Tris-HCl (pH 7.6), 3 mM MgCl2, 2 mM ATP, 0.6 mM NAD+, 1 unit of HK, and 1 unit of G6PDH, was incubated at 37 °C for 30 min. After chilling, a spectrophotometer was used to detect absorbance at 340 nm (NanoDrop OneC, Thermo Fisher Scientific, Waltham, MA, USA).

4.7. Statistical Analysis

The recorded data average for each trait is standardized, obtaining a ratio (Treatment/Control). To evaluate differences between genotypes and environments (treatments), collected data are submitted to a two-way analysis of variance (ANOVA) using R software (V3.6.1, https://www.r-project.org/, accessed on 8 March 2023). Tukey’s honest significant difference (HSD) test at p < 0.05 is used with R software, including the ‘glht’ function in the ‘multcomp’ package [95]. The correlation matrix of 3 genotypes and 6 different treatments is subjected to principal component analysis (PCA). The index values for each treatment are first determined by comparing the stress reaction to the control value. For the PCA analysis, all of the traits in each treatment re merged and used as index values. These index values are used to determine the ordination space association of response variable vectors and genotypes. A two-way heatmap clustering analysis (HCA) is performed on the same dataset with PCA analysis. To compute the dissimilarity matrix, Pearson correlation and a ‘euclidean algorithm’ are used. PCA and HCA re generated using the R software, specifically the ‘prcomp’ function in the ‘factoextra’ library [96]. The heatmap function in the ‘pheatmap’ library with R software is used to organize data hierarchically [97].

5. Conclusions

All stress scenarios applied at vegetative and reproductive stages reduce the plant growth performance and yield in all genotypes. Interestingly, heat stress during the reproductive stage has little effect on rice genotype yield performance but does impair grain quality indicators. While salt and repeated heat and salinity stress have a substantial impact on yield performance and grain quality in the Yukinkomai and YNU SL genotypes, the YNU31-2-4 genotype demonstrates a greater yield and grain quality under heavy stress. The data show that the YNU31-2-4 genotype accumulates less Na+ and more K+ under salinity and various stresses. In the YNU31-2-4 genotype, low-level harmful ion accumulation leads to increased photosynthetic activity and pigment accumulation, which promotes yield capacity. Likewise, whereas stress reduces glucose accumulation in dry seeds, the YNU31-2-4 genotype shows an increased glucose accumulation in dry seeds.

Supplementary Materials

The following supporting information can be downloaded at: https://www.mdpi.com/article/10.3390/plants12091910/s1, Table S1: Variance analysis tables; Table S2: Loading values and percentage contribution of variables on the axis identified by the principal component analysis (PCA) for all cultivars under control and saline conditions. Figure S1: The plant and tiller images of genotypes under (A) T1, (B) T2, (C) T3, (D) T4, (E) T5, and (F) T6 conditions.

Author Contributions

Conceptualization, L.N., M.A., M.B. and T.M.; methodology, L.N. and M.A.; software, M.A. and M.B.; validation, L.N., E.M.L.H. and M.A.; formal analysis, L.N.; investigation, M.B.; data curation, L.N. and M.A.; writing—original draft preparation, L.N.; writing—review and editing, M.A.; visualization, M.A.; supervision, T.M.; funding acquisition, M.A. and T.M. All authors have read and agreed to the published version of the manuscript.

Funding

This research was funded by Grant-in-Aid for JSPS Fellows (23KF0033 to M.A.), the Japan Science and Technology Agency (JPMJSC16C5 to T.M.), and the Grant for Promotion of KAAB Projects (Niigata University) from the Ministry of Education, Culture, Science and Technology (Japan).

Institutional Review Board Statement

Not applicable.

Informed Consent Statement

Not applicable.

Data Availability Statement

Not applicable.

Acknowledgments

We would like to thank Shigeru Hanamata for the technical support.

Conflicts of Interest

The authors declare no conflict of interest.

Appendix A

Table A1. Photosynthetic parameters (the net photosynthetic rate, An; stomatal conductance, gs; the intercellular CO2 concentration, Ci; transpiration rate, E; and the ratio of intercellular to ambient CO2 concentration, Ci/Ca) of Yukinkomai, YNU31-2-4, and YNU SL rice genotypes under treatment 1 (T1), T2, T3, T4, T5, and T6. The Tukey HSD test from three independent biological replicates (n = 3) shows that means (±SD) in the same graph followed by letters are substantially different at p < 0.05.
AngsCiECi/Ca
T1Yukinkomai27.24 ± 2.143 b0.262 ± 0.008 ce195.094 ± 15.722 ce0.005 ± 0.001 cd0.502 ± 0.038 fg
YNU31-2-436.565 ± 0.735 df0.294 ± 0.014 de270.645 ± 16.142 i0.006 ± 0.001 d0.646 ± 0.024 hi
YNU SL51.712 ± 4.159 hi0.447 ± 0.016 g186.313 ± 17.761 cd0.008 ± 0.000 fg0.762 ± 0.021 j
T2Yukinkomai47.030 ± 0.903 gh0.444 ± 0.040 g258.815 ± 32.877 hi0.006 ± 0.001 def0.692 ± 0.051 ij
YNU31-2-435.554 ± 3.414 bde0.341 ± 0.027 ef198.411 ± 9.735 ce0.006 ± 0.001 def0.275 ± 0.043 cd
YNU SL59.379 ± 3.999 j0.651 ± 0.033 i213.957 ± 10.706 deg0.006 ± 0.001 def0.563 ± 0.029 gh
T3Yukinkomai39.280 ± 2.290 ef0.251 ± 0.024 cd164.123 ± 9.049 c0.003 ± 0.000 ac0.404 ± 0.039 ef
YNU31-2-448.602 ± 2.046 gh0.235 ± 0.017 cd69.973 ± 7.970 ab0.005 ± 0.001 bcd0.190 ± 0.014 bc
YNU SL17.033 ± 1.216 a0.073 ± 0.020 a93.351 ± 3.303 b0.002 ± 0.000 a0.266 ± 0.027 cd
T4Yukinkomai57.288 ± 1.646 ij0.462 ± 0.026 g166.029 ± 16.803 c0.008 ± 0.001 eg0.502 ± 0.074 fg
YNU31-2-434.367 ± 5.005 cde0.212 ± 0.027 bc247.628 ± 14.765 gi0.005 ± 0.001 cd0.214 ± 0.055 bd
YNU SL47.027 ± 2.426 gh0.258 ± 0.026 cd199.569 ± 17.701 cef0.006 ± 0.001 de0.317 ± 0.039 de
T5Yukinkomai33.770 ± 1.422 bde0.420 ± 0.011 fg245.587 ± 1.999 gi0.011 ± 0.000 h0.633 ± 0.007 hi
YNU31-2-443.255 ± 1.740 fg0.468 ± 0.018 fh228.309 ± 3.413 egh0.010 ± 0.001 gh0.598 ± 0.010 gi
YNU SL38.179 ± 1.264 df0.546 ± 0.062 h239.284 ± 2.934 fgi0.010 ± 0.000 h0.681 ± 0.020 ij
T6Yukinkomai28.802 ± 0.807 bc0.115 ± 0.018 a30.912 ± 2.471 a0.004 ± 0.000 ac0.080 ± 0.005 a
YNU31-2-452.535 ± 1.267 hj0.233 ± 0.029 cd53.508 ± 2.453 ab0.005 ± 0.000 cd0.131 ± 0.010 ab
YNU SL31.766 ± 0.875 bd0.144 ± 0.009 ab35.912 ± 1.767 a0.003 ± 0.000 ab0.074 ± 0.009 a
Table A2. Photosynthetic parameters (Water use efficiency, WUE (An/gs); chlorophyll a, Chla; chlorophyll b, Chlb; total chlorophyll, chlT content; and relative water content, RWC) of Yukinkomai, YNU31-2-4, and YNU SL rice genotypes under treatment 1 (T1), T2, T3, T4, T5, and T6. The Tukey HSD test from three independent biological replicates (n = 3) shows that means (±SD) in the same graph followed by letters are substantially different at p < 0.05.
WUEChlaChlbChlTRWC
T1Yukinkomai5356.450 ± 222.552 acd173.194 ± 0.716 e153.654 ± 3.269 fgh151.35 ± 2.741 fghi82.158 ± 4.546 bcd
YNU31-2-46420.039 ± 658.935 bce168.620 ± 3.417 e214.242 ± 22.012 ik199.261 ± 17.123 ijl86.986 ± 2.844 d
YNU SL6525.314 ± 363.796 bce164.792 ± 4.350 de236.165 ± 21.879 jk216.246 ± 16.866 kl81.667 ± 2.357 cd
T2Yukinkomai7405.811 ± 1249.448 deg152.335 ± 6.312 de93.577 ± 5.494 bcde101.040 ± 4.813 cde83.397 ± 5.656 cd
YNU31-2-45862.909 ± 808.315 ade174.102 ± 1.434 e148.976 ± 12.820 eg147.740 ± 10.525 egh87.774 ± 3.754 d
YNU SL9635.331 ± 1925.732 fgi157.486 ± 6.956 de131.329 ± 33.090 dg136.017 ± 32.179 dg75.797 ± 9.239 bcd
T3Yukinkomai11,742.127 ± 1884.126 i104.073 ± 1.979 b65.102 ± 15.081 ac69.014 ± 15.757 ac68.004 ± 7.417 ac
YNU31-2-410,252.976 ± 1707.586 gi154.695 ± 7.976 de105.15 ± 3.273 cdef109.415 ± 3.497 cdef77.548 ± 2.260 bcd
YNU SL9511.533 ± 314.831 fgi59.195 ± 16.011 a33.682 ± 12.376 a35.349 ± 13.308 a65.027 ± 7.742 ab
T4Yukinkomai7455.155 ± 686.156 deg141.545 ± 4.980 cd86.637 ± 0.722 ad92.099 ± 0.676 bcd73.158 ± 6.835 ad
YNU31-2-46860.766 ± 627.490 cef169.760 ± 7.829 e217.640 ± 37.459 ik201.802 ± 28.990 jl79.069 ± 4.280 bcd
YNU SL8246.898 ± 1111.925 egh151.440 ± 14.435 ce119.849 ± 10.642 cdg123.383 ± 12.547 dg78.278 ± 2.683 bcd
T5Yukinkomai3198.187 ± 24.146 a163.181 ± 8.136 de265.235 ± 28.815 k242.345 ± 25.235 l88.549 ± 2.595 d
YNU31-2-44514.127 ± 518.664 ac163.873 ± 2.306 de206.358 ± 13.852 hij189.627 ± 14.032 hjk86.706 ± 2.406 d
YNU SL3646.112 ± 265.588 ab172.111 ± 0.592 e173.085 ± 9.185 gi166.777 ± 7.280 gj84.553 ± 2.596 cd
T6Yukinkomai8192.701 ± 337.352 degh128.363 ± 12.34884.637 ± 17.380 ad87.566 ± 14.384 bcd72.563 ± 1.532 ad
YNU31-2-49935.842 ± 518.927 gi163.280 ± 2.355168.113 ± 27.65 gi161.552 ± 22.384 gj76.905 ± 8.693 bcd
YNU SL10,534.637 ± 282.673 hi78.732 ± 7.22139.708 ± 4.669 ab44.599 ± 4.878 ab57.663 ± 11.171 a
Table A3. Harvesting parameters (plant height, plant biomass, root length, root biomass, panicle number, panicle length, flag leaf area, grain number per panicle, spikelet number, 1000-grain weight, and yield per plant) of Yukinkomai, YNU31-2-4, and YNU SL rice genotypes under treatment 1 (T1), T2, T3, T4, T5, and T6. The Tukey HSD test from three independent biological replicates (n = 3) shows that means (±SD) in the same graph followed by letters are substantially different at p < 0.05.
Plant HeightPlant BiomassRoot LengthRoot BiomassPanicle NumberPanicle Length
T1Yukinkomai116.120 ± 4.348 b125.366 ± 4.282 k34.440 ± 1.766 h17.792 ± 2.179 eg22.400 ± 1.517 f17.791 ± 0.335 h
YNU31-2-4125.480 ± 2.777 c112.752 ± 3.730 j34.800 ± 1.483 hi19.830 ± 1.598 fg21.800 ± 0.837 f18.313 ± 0.591 hi
YNU SL120.540 ± 3.957 bc104.315 ± 2.263 ij28.200 ± 2.168 df16.127 ± 2.948 def21.000 ± 1.581 f18.929 ± 0.634 i
T2Yukinkomai89.620 ± 2.309 a35.323 ± 2.772 ce25.440 ± 1.901 ade3.774 ± 0.522 a19.200 ± 1.643 ef12.565 ± 0.237 de
YNU31-2-4113.480 ± 3.989 b98.184 ± 3.310 hi33.970 ± 2.815 gh13.127 ± 2.666 cd27.400 ± 3.209 g15.281 ± 0.238 fg
YNU SL92.740 ± 3.686 a38.495 ± 3.370 de25.000 ± 2.000 ade4.004 ± 0.641 a20.600 ± 2.793 f13.500 ± 0.141 e
T3Yukinkomai91.340 ± 1.685 a21.620 ± 2.534 ab22.900 ± 1.949 abc4.520 ± 0.820 a7.000 ± 1.732 ab10.953 ± 0.345 ab
YNU31-2-4116.680 ± 4.218 bc53.845 ± 4.672 f25.400 ± 1.380 ade9.350 ± 2.448 bc14.800 ± 2.280 de14.639 ± 0.232 f
YNU SL92.320 ± 4.322 a19.351 ± 4.236 ab21.200 ± 2.308 a3.359 ± 1.300 a5.600 ± 2.702 ab11.282 ± 0.824 ac
T4Yukinkomai95.400 ± 1.319 a37.731 ± 6.384 de27.420 ± 1.675 cdf3.856 ± 0.137 a18.400 ± 1.140 ef12.307 ± 0.358 cd
YNU31-2-4117.760 ± 4.091 bc79.920 ± 4.778 g31.600 ± 2.074 fh10.491 ± 1.124 c22.400 ± 1.342 f15.827 ± 0.685 g
YNU SL89.640 ± 1.713 a33.379 ± 4.449 cd26.000 ± 1.837 bde2.584 ± 0.975 a21.200 ± 1.789 f11.965 ± 0.272 bcd
T5Yukinkomai118.140 ± 1.435 bc93.131 ± 3.345 h24.000 ± 1.581 ad14.375 ± 2.385 de18.600 ± 1.673 ef18.721 ± 0.137 hi
YNU31-2-4122.300 ± 2.432 bc106.441 ± 5.899 ij39.200 ± 2.588 i20.162 ± 1.942 g18.400 ± 0.894 ef18.595 ± 0.165 hi
YNU SL117.720 ± 8.164 bc103.708 ± 3.477 ij29.600 ± 2.881 efg12.959 ± 1.989 cd21.800 ± 1.304 f18.517 ± 0.287 hi
T6Yukinkomai95.120 ± 8.007 a25.953 ± 2.461 bc20.800 ± 2.864 a3.683 ± 1.056 a10.000 ± 3.937 bc12.018 ± 0.602 bcd
YNU31-2-4120.340 ± 2.791 bc44.673 ± 6.520 ef26.440 ± 1.170 bde6.147 ± 1.218 ab11.800 ± 2.588 cd15.825 ± 0.812 g
YNU SL95.180 ± 2.194 a13.672 ± 4.876 a22.000 ± 1.581 ab3.223 ± 0.703 a3.200 ± 1.643 a10.716 ± 0.612 a
Table A4. Harvesting parameters (flag leaf area, grain number per panicle, spikelet number, 1000-grain weight, and yield per plant) of Yukinkomai, YNU31-2-4, and YNU SL rice genotypes under treatment 1 (T1), T2, T3, T4, T5, and T6. The Tukey HSD test from three independent biological replicates (n = 3) shows that means (±SD) in the same graph followed by letters are substantially different at p < 0.05.
Flag Leaf AreaGrain Number per PanicleSpikelet Number1000-Grain WeightYield per Plant
T1Yukinkomai48.637 ± 2.186 bd75.260 ± 5.974 gh76.894 ± 6.279 e26.677 ± 0.911 jk40.502 ± 3.234 gh
YNU31-2-452.717 ± 2.521 d66.495 ± 3.762 g71.588 ± 4.566 e28.055 ± 0.298 k36.941 ± 1.740 g
YNU SL46.600 ± 2.623 bd80.511 ± 6.279 h82.908 ± 5.714 e25.673 ± 0.645 ij40.822 ± 1.943 gh
T2Yukinkomai25.153 ± 3.798 a13.523 ± 2.564 ac30.755 ± 3.580 ab22.340 ± 0.352 efg6.069 ± 0.678 cd
YNU31-2-445.527 ± 2.781 bd41.892 ± 5.801 f57.665 ± 7.070 d26.186 ± 0.242 ik28.347 ± 4.024 f
YNU SL19.183 ± 1.207 a11.775 ± 4.717 ab36.068 ± 7.582 ab20.837 ± 0.577 cdf9.211 ± 1.930 d
T3Yukinkomai21.560 ± 3.175 a3.677 ± 2.505 a39.364 ± 6.884 abc18.918 ± 0.671 bc0.430 ± 0.288 ab
YNU31-2-439.233 ± 1.405 b30.127 ± 7.227 de50.889 ± 6.692 cd23.421 ± 0.242 gh10.024 ± 1.773 d
YNU SL22.720 ± 4.095 a7.447 ± 3.387 a40.917 ± 7.252 abc16.083 ± 0.520 a0.606 ± 0.265 ab
T4Yukinkomai19.520 ± 6.323 a19.751 ± 4.089 bcd28.338 ± 7.168 a20.399 ± 0.401 bde7.189 ± 1.643 d
YNU31-2-439.973 ± 3.470 bc32.939 ± 7.145 ef44.211 ± 8.162 bd27.615 ± 0.511 jk20.247 ± 4.246 e
YNU SL26.173 ± 2.317 a13.260 ± 3.501 ac27.477 ± 1.645 a21.715 ± 0.537 dfg5.619 ± 1.221 bcd
T5Yukinkomai52.857 ± 3.170 d72.552 ± 4.786 gh74.229 ± 4.866 e25.744 ± 0.671 ij41.552 ± 4.508 gh
YNU31-2-449.530 ± 1.924 cd74.066 ± 2.634 gh80.502 ± 3.817 e27.760 ± 0.147 k37.811 ± 1.754 gh
YNU SL51.910 ± 4.556 d80.670 ± 2.711 h83.154 ± 2.068 e24.467 ± 0.298 hi43.067 ± 1.837 h
T6Yukinkomai19.093 ± 4.575 a5.503 ± 4.605 a37.059 ± 6.249 ab19.809 ± 0.632 bd1.135 ± 0.787 ac
YNU31-2-445.493 ± 3.169 bd23.268 ± 8.025 ce39.022 ± 3.049 abc22.557 ± 1.242 fh6.386 ± 2.514 cd
YNU SL23.233 ± 0.907 a4.300 ± 2.273 a29.030 ± 7.712 a18.475 ± 1.305 b0.230 ± 0.200 a
Table A5. Grain quality parameters (Grain length, grain width, grain thickness, perfect grain, and chalky grain) of Yukinkomai, YNU31-2-4, and YNU SL rice genotypes under treatment 1 (T1), T2, T3, T4, T5, and T6. The Tukey HSD test from three independent biological replicates (n = 3) shows that means (±SD) in the same graph followed by letters are substantially different at p < 0.05.
Perfect GrainChalky GrainGrain LengthGrain WidthGrain Thickness
T1Yukinkomai62.350 ± 0.071 f34.533 ± 0.321 a5.127 ± 0.016 h2.737 ± 0.006 g2.007 ± 0.006 ghi
YNU31-2-416.567 ± 3.353 bd83.100 ± 3.504 fhj5.080 ± 0.010 h2.853 ± 0.006 hi2.057 ± 0.015 ij
YNU SL53.433 ± 3.355 f44.167 ± 3.528 ab5.073 ± 0.006 h2.770 ± 0.010 gh1.967 ± 0.058 eh
T2Yukinkomai19.900 ± 1.637 cd58.667 ± 5.033 bcd4.750 ± 0.020 de2.440 ± 0.017 d1.880 ± 0.000 bcd
YNU31-2-424.133 ± 1.159 de72.667 ± 3.512 deh5.100 ± 0.000 h2.867 ± 0.006 hi2.117 ± 0.006 jk
YNU SL32.867 ± 5.129 e97.333 ± 15.144 j4.873 ± 0.012 eg2.567 ± 0.021 e1.933 ± 0.006 def
T3Yukinkomai5.433 ± 2.892 a66.600 ± 5.717 cefg4.510 ± 0.095 ac2.300 ± 0.026 ab1.760 ± 0.035 a
YNU31-2-412.467 ± 1.686 abc83.667 ± 1.650 ghj4.897 ± 0.021 fg2.710 ± 0.000 fg1.983 ± 0.006 fh
YNU SL8.000 ± 10.046 ab63.933 ± 8.701 ce4.420 ± 0.140 a2.327 ± 0.090 bc1.830 ± 0.017 ab
T4Yukinkomai4.167 ± 0.321 a85.233 ± 1.595 hj4.603 ± 0.006 bc2.433 ± 0.012 cd1.957 ± 0.006 efg
YNU31-2-48.500 ± 1.609 ab89.000 ± 1.179 hj5.067 ± 0.006 h2.883 ± 0.006 i2.140 ± 0.010 k
YNU SL7.867 ± 0.351 ab65.567 ± 1.79 cef4.547 ± 0.015 ac2.333 ± 0.021 bd1.900 ± 0.010 be
T5Yukinkomai35.033 ± 1.401 e63.000 ± 0.721 ce5.133 ± 0.006 h2.713 ± 0.015 fg2.057 ± 0.006 ij
YNU31-2-47.433 ± 2.228 ab91.267 ± 2.228 ij5.103 ± 0.012 h2.850 ± 0.000 hi2.143 ± 0.006 k
YNU SL6.767 ± 0.850 ab90.967 ± 0.950 ij5.000 ± 0.000 gh2.623 ± 0.015 ef2.037 ± 0.006 hi
T6Yukinkomai3.000 ± 1.000 a77.133 ± 0.902 ehi4.637 ± 0.021 cd2.330 ± 0.030 bc1.920 ± 0.017 cef
YNU31-2-49.933 ± 0.503 abc80.567 ± 1.007 ehj4.850 ± 0.017 ef2.557 ± 0.012 e2.020 ± 0.010 ghi
YNU SL4.167 ± 7.217 a53.633 ± 13.359 bc4.470 ± 0.092 ab2.200 ± 0.104 a1.857 ± 0.060 bc
Table A6. Protein, malondialdehyde (MDA), proline (PRO) content, catalase (CAT), superoxide dismutase (SOD), and ascorbate peroxidase (APX) activity of Yukinkomai, YNU31-2-4, and YNU SL rice genotypes under treatment 1 (T1), T2, T3, T4, T5, and T6. The Tukey HSD test from three independent biological replicates (n = 3) shows that means (±SD) in the same graph followed by letters are substantially different at p < 0.05.
ProteinMDAPROCATSODAPX
T1Yukinkomai3050.106 ± 68.337 bd6.237 ± 0.453 a0.533 ± 0.024 ad2.401 ± 0.337 ab23.676 ± 1.074 ef157.972 ± 6.912 bc
YNU31-2-42938.287 ± 78.909 abc9.281 ± 0.901 bd0.409 ± 0.055 a2.045 ± 0.013 a10.386 ± 0.913 abc254.73 ± 14.490 d
YNU SL3361.854 ± 39.895 ef11.452 ± 1.137 df0.739 ± 0.034 bd15.632 ± 1.557 e7.023 ± 0.267 a169.462 ± 20.805 bc
T2Yukinkomai2782.591 ± 65.920 ab9.274 ± 0.980 bd0.859 ± 0.066 d2.671 ± 0.430 ab8.539 ± 0.103 a145.742 ± 7.114 bc
YNU31-2-43178.910 ± 142.256 cdf11.741 ± 0.979 df0.385 ± 0.039 a31.873 ± 5.326 h8.106 ± 0.773 a79.500 ± 11.281 a
YNU SL2868.295 ± 74.170 ab13.467 ± 1.310 f0.495 ± 0.018 abc20.659 ± 1.769 fg11.198 ± 0.645 abc125.077 ± 10.497 ab
T3Yukinkomai2703.326 ± 68.249 a12.519 ± 0.943 ef3.401 ± 0.301 g7.077 ± 0.516 bd67.569 ± 1.149 h354.956 ± 48.535 ef
YNU31-2-43144.940 ± 49.216 cde11.607 ± 0.862 df2.411 ± 0.094 f21.514 ± 1.351 g10.682 ± 0.676 abc125.488 ± 11.578 ab
YNU SL2833.404 ± 124.041 ab9.667 ± 0.757 bd0.787 ± 0.047 cd18.677 ± 0.735 eg17.053 ± 1.275 cde147.717 ± 5.814 bc
T4Yukinkomai2853.503 ± 74.106 ab7.393 ± 1.054 ab0.430 ± 0.060 ab16.007 ± 0.795 ef9.761 ± 1.454 ab176.568 ± 25.973 bc
YNU31-2-43224.983 ± 84.522 df9.571 ± 0.334 bd0.446 ± 0.023 ab10.385 ± 0.903 d8.358 ± 1.377 a251.031 ± 21.805 d
YNU SL2844.215 ± 55.318 ab7.504 ± 0.862 ab0.809 ± 0.034 cd5.658 ± 0.450 abc5.236 ± 0.495 a204.629 ± 8.371 cd
T5Yukinkomai3363.057 ± 78.570 ef11.763 ± 0.312 df0.446 ± 0.033 ab5.408 ± 0.216 abc27.371 ± 0.74 f475.974 ± 18.797 gh
YNU31-2-43238.358 ± 50.660 df9.178 ± 0.640 bd0.378 ± 0.032 a5.697 ± 0.895 ad40.458 ± 7.777 g527.775 ± 16.803 h
YNU SL3650.955 ± 191.165 g10.659 ± 0.634 de0.497 ± 0.073 abc18.724 ± 1.190 eg22.567 ± 1.508 df134.957 ± 4.541 ab
T6Yukinkomai2683.227 ± 58.142 a10.200 ± 0.954 cde0.795 ± 0.090 cd8.535 ± 1.023 cd21.685 ± 1.503 df322.044 ± 24.748 e
YNU31-2-43431.423 ± 94.090 fg10.000 ± 0.794 bde0.667 ± 0.060 ad6.048 ± 0.376 ad15.865 ± 1.491 bd418.579 ± 38.202 fg
YNU SL2762.774 ± 37.099 a7.882 ± 1.148 abc1.664 ± 0.264 e4.710 ± 0.679 abc25.791 ± 3.874 f457.374 ± 20.386 g
Table A7. Ion content (root and shoot) of Yukinkomai, YNU31-2-4, and YNU SL rice genotypes under treatment 1 (T1), T2, T3, T4, T5, and T6. The Tukey HSD test from three independent biological replicates (n = 3) shows that means (±SD) in the same graph followed by letters are substantially different at p < 0.05.
Na⁺ (Shoot)Na⁺ (Root)K⁺ (Shoot)K⁺ (Root)Na⁺/K⁺ (Shoot)Na⁺/K⁺ (Root)
T1Yukinkomai7.153 ± 0.307 ab6.443 ± 1.821 ab36.999 ± 0.320 a9.979 ± 3.646 ab0.193 ± 0.007 ab0.756 ± 0.486 ab
YNU31-2-44.015 ± 0.461 a5.815 ± 0.209 a73.580 ± 10.387 bc9.540 ± 2.286 ab0.055 ± 0.006 a0.638 ± 0.180 ab
YNU SL2.395 ± 0.623 a4.278 ± 0.475 a103.244 ± 4.470 d19.745 ± 3.525 bce0.024 ± 0.007 a0.224 ± 0.065 a
T2Yukinkomai52.891 ± 3.861 e21.774 ± 3.349 c39.277 ± 7.142 a58.186 ± 6.054 fg1.370 ± 0.204 h0.374 ± 0.042 a
YNU31-2-438.461 ± 1.138 de12.693 ± 1.506 ac101.262 ± 11.89 d25.517 ± 1.060 ce0.383 ± 0.035 bc0.496 ± 0.039 a
YNU SL46.925 ± 0.740 e14.504 ± 2.699 ac59.984 ± 8.697 ab33.589 ± 0.869 e0.793 ± 0.115 d0.431 ± 0.076 a
T3Yukinkomai173.428 ± 10.181 g42.970 ± 2.422 d163.663 ± 20.843 gh14.358 ± 1.173 acd1.074 ± 0.185 fg3.008 ± 0.330 d
YNU31-2-4131.200 ± 13.936 f17.729 ± 0.633 bc237.981 ± 2.467 i26.135 ± 3.356 ce0.551 ± 0.062 cd0.687 ± 0.104 ab
YNU SL259.658 ± 12.609 j38.881 ± 1.899 d215.377 ± 9.604 i17.085 ± 2.165 acd1.209 ± 0.112 gh2.301 ± 0.323 cd
T4Yukinkomai24.048 ± 3.714 bcd14.335 ± 0.665 ac165.506 ± 2.965 gh54.866 ± 12.976 f0.145 ± 0.024 ab0.270 ± 0.055 a
YNU31-2-418.563 ± 2.238 ac6.056 ± 1.404 c185.275 ± 8.845 h158.934 ± 10.385 h0.100 ± 0.015 a0.038 ± 0.008 a
YNU SL34.999 ± 3.478 ce14.026 ± 1.653 ac162.721 ± 1.295 gh69.164 ± 3.512 g0.215 ± 0.023 ab0.203 ± 0.015 a
T5Yukinkomai2.655 ± 0.138 a6.403 ± 0.243 ab100.987 ± 5.386 cd14.312 ± 2.986 acd0.026 ± 0.000 a0.459 ± 0.086 a
YNU31-2-42.129 ± 0.216 a6.159 ± 3.117 ab108.075 ± 4.447 de28.459 ± 0.918 de0.020 ± 0.002 a0.215 ± 0.102 a
YNU SL3.720 ± 0.494 a7.716 ± 1.824 ab124.550 ± 3.831 de4.760 ± 0.505 a0.030 ± 0.003 a1.626 ± 0.367 bc
T6Yukinkomai256.632 ± 3.638 j35.668 ± 3.350 g132.577 ± 7.727 ef5.065 ± 0.248 a1.939 ± 0.084 i7.062 ± 0.886 e
YNU31-2-4198.885 ± 8.74 h26.292 ± 3.969 e155.934 ± 8.892 fg12.507 ± 1.528 ac1.280 ± 0.127 gh2.140 ± 0.503 cd
YNU SL235.424 ± 10.79 i55.548 ± 9.217 f268.199 ± 15.224 j20.706 ± 1.664 bce0.880 ± 0.075 ef2.718 ± 0.674 d

References

  1. Tyczewska, A.; Woźniak, E.; Gracz, J.; Kuczyński, J.; Twardowski, T. Towards Food Security: Current State and Future Prospects of Agrobiotechnology. Trends Biotechnol. 2018, 36, 1219–1229. [Google Scholar] [CrossRef] [PubMed]
  2. FAO. The Future of Food and Agriculture: Trends and Challenges. Available online: http://www.fao.org/3/a-I6583e.pdf (accessed on 8 January 2023).
  3. UN. United Nations Set Out 17 Sustainable Development Goals (SDGs). Available online: https://www.un.org/sustainabledevelopment/hunger/ (accessed on 2 February 2023).
  4. Lobell, D.B.; Schlenker, W.; Costa-Roberts, J. Climate Trends and Global Crop Production since 1980. Science 2011, 333, 616–620. [Google Scholar] [CrossRef] [PubMed]
  5. Uri, N. Cropland Soil Salinization and Associated Hydrology: Trends, Processes and Examples. Water 2018, 10, 1030. [Google Scholar] [CrossRef]
  6. Singh, A. Soil Salinization Management for Sustainable Development: A Review. J. Environ. Manag. 2021, 277, 111383. [Google Scholar] [CrossRef] [PubMed]
  7. Kumar, P.; Sharma, P.K. Soil Salinity and Food Security in India. Front. Sustain. Food Syst. 2020, 4, 533781. [Google Scholar] [CrossRef]
  8. Bannari, A.; Al-Ali, Z.M. Assessing Climate Change Impact on Soil Salinity Dynamics between 1987-2017 in Arid Landscape Using Landsat TM, ETM+ and OLI Data. Remote Sens. 2020, 12, 2794. [Google Scholar] [CrossRef]
  9. IPCC. Climate Change 2014: Synthesis Report. Contribution of Working Groups I, II and III to the Fifth Assessment Report of the Intergovernmental Panel on Climate Change; Core Writing Team, Pachauri, R.K., Meyer, L.A., Eds.; IPCC: Geneva, Switzerland, 2014; p. 151. Available online: https://www.ipcc.ch/site/assets/uploads/2018/02/SYR_AR5_FINAL_full.pdf (accessed on 12 January 2023).
  10. Friedlingstein, P.; Houghton, R.A.; Marland, G.; Hackler, J.; Boden, T.A.; Conway, T.J.; Canadell, J.G.; Raupach, M.R.; Ciais, P.; le Quéré, C. Update on CO2 Emissions. Nat. Geosci. 2010, 3, 811–812. [Google Scholar] [CrossRef]
  11. Lal, R. Soil Carbon Sequestration to Mitigate Climate Change. Geoderma 2004, 123, 1–22. [Google Scholar] [CrossRef]
  12. Asseng, S.; Ewert, F.; Martre, P.; Rötter, R.P.; Lobell, D.B.; Cammarano, D.; Kimball, B.A.; Ottman, M.J.; Wall, G.W.; White, J.W.; et al. Rising Temperatures Reduce Global Wheat Production. Nat. Clim. Chang. 2015, 5, 143–147. [Google Scholar] [CrossRef]
  13. Challinor, A.J.; Watson, J.; Lobell, D.B.; Howden, S.M.; Smith, D.R.; Chhetri, N. A Meta-Analysis of Crop Yield under Climate Change and Adaptation. Nat. Clim. Chang. 2014, 4, 287–291. [Google Scholar] [CrossRef]
  14. Gupta, B.K.; Sahoo, K.K.; Anwar, K.; Nongpiur, R.C.; Deshmukh, R.; Pareek, A.; Singla-Pareek, S.L. Silicon Nutrition Stimulates Salt-Overly Sensitive (SOS) Pathway to Enhance Salinity Stress Tolerance and Yield in Rice. Plant Physiol. Biochem. 2021, 166, 593–604. [Google Scholar] [CrossRef] [PubMed]
  15. Joshi, R.; Sahoo, K.K.; Tripathi, A.K.; Kumar, R.; Gupta, B.K.; Pareek, A.; Singla-Pareek, S.L. Knockdown of an Inflorescence Meristem-Specific Cytokinin Oxidase—OsCKX2 in Rice Reduces Yield Penalty under Salinity Stress Condition. Plant Cell Environ. 2018, 41, 936–946. [Google Scholar] [CrossRef] [PubMed]
  16. Sehgal, A.; Sita, K.; Siddique, K.H.M.; Kumar, R.; Bhogireddy, S.; Varshney, R.K.; HanumanthaRao, B.; Nair, R.M.; Prasad, P.V.V.; Nayyar, H. Drought or/and Heat-Stress Effects on Seed Filling in Food Crops: Impacts on Functional Biochemistry, Seed Yields, and Nutritional Quality. Front. Plant Sci. 2018, 871, 1705. [Google Scholar] [CrossRef]
  17. Aghamolki, M.T.K.; Yusop, M.K.; Oad, F.C.; Zakikhani, H.; Jaafar, H.Z.; Kharidah, S.; Musa, M.H. Heat Stress Effects on Yield Parameters of Selected Rice Cultivars at Reproductive Growth Stages. J. Food Agric. Environ. 2014, 12, 741–746. [Google Scholar]
  18. Prasad, P.V.V.; Staggenborg, S.A.; Ristic, Z. Impacts of Drought and/or Heat Stress on Physiological, Developmental, Growth, and Yield Processes of Crop Plants. In Response of Crops to Limited Water: Understanding and Modeling Water Stress Effects on Plant Growth Processes; American Society of Agronomy: Madison, WI, USA, 2015. [Google Scholar] [CrossRef]
  19. Savvides, A.; Ali, S.; Tester, M.; Fotopoulos, V. Chemical Priming of Plants against Multiple Abiotic Stresses: Mission Possible? Trends Plant Sci. 2016, 21, 329–340. [Google Scholar] [CrossRef]
  20. Sewelam, N.; Oshima, Y.; Mitsuda, N.; Ohme-Takagi, M. A Step towards Understanding Plant Responses to Multiple Environmental Stresses: A Genome-Wide Study. Plant Cell Environ. 2014, 37, 20024–22035. [Google Scholar] [CrossRef]
  21. Rivero, R.M.; Mestre, T.C.; Mittler, R.; Rubio, F.; Garcia-Sanchez, F.; Martinez, V. The Combined Effect of Salinity and Heat Reveals a Specific Physiological, Biochemical and Molecular Response in Tomato Plants. Plant Cell Environ. 2014, 37, 1059–1073. [Google Scholar] [CrossRef]
  22. Blumwald, E. Sodium Transport and Salt Tolerance in Plants. Curr. Opin. Cell Biol. 2000, 12, 431–434. [Google Scholar] [CrossRef]
  23. Benlloch, R.; Lois, L.M. Sumoylation in Plants: Mechanistic Insights and Its Role in Drought Stress. J. Exp. Bot. 2018, 69, 4539–4554. [Google Scholar] [CrossRef]
  24. Fang, C.; Fernie, A.R.; Luo, J. Exploring the Diversity of Plant Metabolism. Trends Plant Sci. 2019, 24, 83–98. [Google Scholar] [CrossRef]
  25. Anjum, S.A.; Tanveer, M.; Ashraf, U.; Hussain, S.; Shahzad, B.; Khan, I.; Wang, L. Effect of Progressive Drought Stress on Growth, Leaf Gas Exchange, and Antioxidant Production in Two Maize Cultivars. Environ. Sci. Pollut. Res. 2016, 23, 17132–17141. [Google Scholar] [CrossRef]
  26. Hussain, H.A.; Hussain, S.; Khaliq, A.; Ashraf, U.; Anjum, S.A.; Men, S.; Wang, L. Chilling and Drought Stresses in Crop Plants: Implications, Cross Talk, and Potential Management Opportunities. Front. Plant Sci. 2018, 9, 393. [Google Scholar] [CrossRef]
  27. Hussain, S.; Khan, F.; Cao, W.; Wu, L.; Geng, M. Seed Priming Alters the Production and Detoxification of Reactive Oxygen Intermediates in Rice Seedlings Grown under Sub-Optimal Temperature and Nutrient Supply. Front. Plant Sci. 2016, 7, 439. [Google Scholar] [CrossRef] [PubMed]
  28. Zhu, B.; Ye, C.; Lü, H.; Chen, X.; Chai, G.; Chen, J.; Wang, C. Identification and Characterization of a Novel Heat Shock Transcription Factor Gene, GmHsfA1, in Soybeans (Glycine max). J. Plant Res. 2006, 119, 247–256. [Google Scholar] [CrossRef] [PubMed]
  29. Khan, M.I.R.; Chopra, P.; Chhillar, H.; Ahanger, M.A.; Hussain, S.J.; Maheshwari, C. Regulatory Hubs and Strategies for Improving Heavy Metal Tolerance in Plants: Chemical Messengers, Omics and Genetic Engineering. Plant Physiol. Biochem. 2021, 164, 260–278. [Google Scholar] [CrossRef] [PubMed]
  30. Khan, M.I.R.; Asgher, M.; Fatma, M.; Per, T.S.; Khan, N.A. Drought Stress Vis a Vis Plant Functions in the Era of Climate Change. Clim. Chang. Environ. Sustain. 2015, 3, 13–25. [Google Scholar] [CrossRef]
  31. Nahar, L.; Aycan, M.; Hanamata, S.; Baslam, M.; Mitsui, T. Impact of Single and Combined Salinity and High-Temperature Stresses on Agro-Physiological, Biochemical, and Transcriptional Responses in Rice and Stress-Release. Plants 2022, 11, 501. [Google Scholar] [CrossRef]
  32. Dos Santos, T.B.; Ribas, A.F.; de Souza, S.G.H.; Budzinski, I.G.F.; Domingues, D.S. Physiological Responses to Drought, Salinity, and Heat Stress in Plants: A Review. Stresses 2022, 2, 113–135. [Google Scholar] [CrossRef]
  33. Zhang, H.; Zhu, J.; Gong, Z.; Zhu, J.-K. Abiotic Stress Responses in Plants. Nat. Rev. Genet. 2022, 23, 104–119. [Google Scholar] [CrossRef]
  34. Tasaka, K. Raising and Transplanting Technology for Long Mat with Hydroponically Grown Rice Seedlings. Jpn. Agric. Res. Q. 1999, 33, 31–37. [Google Scholar]
  35. Grattan, S.R.; Zeng, L.; Shannon, M.C.; Roberts, S.R. Rice Is More Sensitive to Salinity than Previously Thought. Calif. Agric. 2002, 56, 189–198. [Google Scholar] [CrossRef]
  36. Hoang, T.M.L.; Tran, T.N.; Nguyen, T.K.T.; Williams, B.; Wurm, P.; Bellairs, S.; Mundree, S. Improvement of Salinity Stress Tolerance in Rice: Challenges and Opportunities. Agronomy 2016, 6, 54. [Google Scholar] [CrossRef]
  37. Umali, D.L. Irrigation-Induced Salinity: A Growing Problem for Development and the Environment; World Bank Technical Paper; World Bank Publications: Herndon, VA, USA, 1993; Volume 215. [Google Scholar]
  38. Allen, R.G.; Pereira, L.S.; Raes, D.; Smith, M. Crop Evapotranspiration—Guidelines for Computing Crop Water Requirements—FAO Irrigation and Drainage Paper 56; FAO: Rome, Italy, 1998. [Google Scholar] [CrossRef]
  39. Chagué-Goff, C.; Niedzielski, P.; Wong, H.K.Y.; Szczuciński, W.; Sugawara, D.; Goff, J. Environmental Impact Assessment of the 2011 Tohoku-Oki Tsunami on the Sendai Plain. Sediment. Geol. 2012, 282, 175–187. [Google Scholar] [CrossRef]
  40. Takagi, H.; Tamiru, M.; Abe, A.; Yoshida, K.; Uemura, A.; Yaegashi, H.; Obara, T.; Oikawa, K.; Utsushi, H.; Kanzaki, E.; et al. MutMap Accelerates Breeding of a Salt-Tolerant Rice Cultivar. Nat. Biotechnol. 2015, 33, 445–449. [Google Scholar] [CrossRef]
  41. Das, S.; Krishnan, P.; Nayak, M.; Ramakrishnan, B. High Temperature Stress Effects on Pollens of Rice (Oryza sativa L.) Genotypes. Environ. Exp. Bot. 2014, 101, 36–46. [Google Scholar] [CrossRef]
  42. Kilasi, N.L.; Singh, J.; Vallejos, C.E.; Ye, C.; Jagadish, S.V.K.; Kusolwa, P.; Rathinasabapathi, B. Heat Stress Tolerance in Rice (Oryza sativa L.): Identification of Quantitative Trait Loci and Candidate Genes for Seedling Growth under Heat Stress. Front. Plant Sci. 2018, 871, 1578. [Google Scholar] [CrossRef]
  43. IPCC. Summary for Policymakers of IPCC Special Report on Global Warming of 1.5 °C Approved by Governments. Available online: https://www.ipcc.ch/2018/10/08/summary-for-policymakers-of-ipcc-special-report-on-global-warming-of-1-5c-approved-by-governments/ (accessed on 12 February 2023).
  44. Xu, Y.; Chu, C.; Yao, S. The Impact of High-Temperature Stress on Rice: Challenges and Solutions. Crop J. 2021, 9, 963–976. [Google Scholar] [CrossRef]
  45. Zhu, J.K. Abiotic Stress Signaling and Responses in Plants. Cell 2016, 167, 313–324. [Google Scholar] [CrossRef]
  46. Blum, A. Osmotic Adjustment Is a Prime Drought Stress Adaptive Engine in Support of Plant Production. Plant Cell Environ. 2017, 40, 4–10. [Google Scholar] [CrossRef]
  47. Sperdouli, I.; Moustakas, M. Interaction of Proline, Sugars, and Anthocyanins during Photosynthetic Acclimation of Arabidopsis thaliana to Drought Stress. J. Plant Physiol. 2012, 169, 577–585. [Google Scholar] [CrossRef]
  48. Sultan, S.E. Plant Developmental Responses to the Environment: Eco-Devo Insights. Curr. Opin. Plant Biol. 2010, 13, 96–101. [Google Scholar] [CrossRef] [PubMed]
  49. Wei, Q.; Xu, J.; Sun, L.; Wang, H.; Lv, Y.; Li, Y.; Hameed, F. Effects of Straw Returning on Rice Growth and Yield under Water-Saving Irrigation. Chil. J. Agric. Res. 2019, 79, 66–74. [Google Scholar] [CrossRef]
  50. Ashraf, M.; Harris, P.J.C. Photosynthesis under Stressful Environments: An Overview. Photosynthetica 2013, 51, 163–190. [Google Scholar] [CrossRef]
  51. Saibo, N.J.M.; Lourenço, T.; Oliveira, M.M. Transcription Factors and Regulation of Photosynthetic and Related Metabolism under Environmental Stresses. Ann. Bot. 2009, 103, 609–623. [Google Scholar] [CrossRef] [PubMed]
  52. Rahnama, A.; Poustini, K.; Tavakkol-Afshari, R.; Tavakoli, A. Growth and Stomatal Responses of Bread Wheat Genotypes in Tolerance to Salt Stress. World Acad. Sci. Eng. Technol. 2010, 4, 787–792. [Google Scholar]
  53. Medrano, H.; Escalona, J.M.; Bota, J.; Gulías, J.; Flexas, J. Regulation of Photosynthesis of C3 Plants in Response to Progressive Drought: Stomatal Conductance as a Reference Parameter. Ann. Bot. 2002, 89, 895–905. [Google Scholar] [CrossRef]
  54. Medici, L.O.; Azevedo, R.A.; Canellas, L.P.; Machado, A.T.; Pimentel, C. Stomatal Conductance of Maize under Water and Nitrogen Deficits. Pesqui. Agropecuária Bras. 2007, 42, 599–601. [Google Scholar] [CrossRef]
  55. Dodd, I.C. Hormonal Interactions and Stomatal Responses. J. Plant Growth Regul. 2003, 22, 32–46. [Google Scholar] [CrossRef]
  56. Omoto, E.; Taniguchi, M.; Miyake, H. Effects of Salinity Stress on the Structure of Bundle Sheath and Mesophyll Chloroplasts in NAD-Malic Enzyme and PCK Type C4 Plants. Plant Prod. Sci. 2010, 13, 169–176. [Google Scholar] [CrossRef]
  57. Wu, Q.S.; Zou, Y.N. Adaptive Responses of Birch-Leaved Pear (Pyrus betulaefolia) Seedlings to Salinity Stress. Not. Bot. Horti Agrobot. Cluj-Napoca 2009, 37, 133–138. [Google Scholar] [CrossRef]
  58. Pinheiro, H.A.; Silva, J.V.; Endres, L.; Ferreira, V.M.; Câmara, C.d.A.; Cabral, F.F.; Oliveira, J.F.; de Carvalho, L.W.T.; dos Santos, J.M.; Filho, B.G.d.S. Leaf Gas Exchange, Chloroplastic Pigments and Dry Matter Accumulation in Castor Bean (Ricinus communis L.) Seedlings Subjected to Salt Stress Conditions. Ind. Crop. Prod. 2008, 27, 385–392. [Google Scholar] [CrossRef]
  59. Li, T.; Zhang, Y.; Liu, H.; Wu, Y.T.; Li, W.B.; Zhang, H.X. Stable Expression of Arabidopsis Vacuolar Na+/H+ Antiporter Gene AtNHX1, and Salt Tolerance in Transgenic Soybean for over Six Generations. Chin. Sci. Bull. 2010, 55, 1127–1134. [Google Scholar] [CrossRef]
  60. Yang, J.Y.; Zheng, W.; Tian, Y.; Wu, Y.; Zhou, D.W. Effects of Various Mixed Salt-Alkaline Stresses on Growth, Photosynthesis, and Photosynthetic Pigment Concentrations of Medicago ruthenica Seedlings. Photosynthetica 2011, 49, 275–284. [Google Scholar] [CrossRef]
  61. Aycan, M.; Erkilic, E.G.; Ozgen, Y.; Poyraz, I.; Yildiz, M. The Response of Sugar Beet (Beta vulgaris L.) Genotypes at Different Ploidy Levels to Salt (NaCl) Stress. Int. J. Plant Biol. 2023, 14, 199–217. [Google Scholar] [CrossRef]
  62. Akram, M.S.; Ashraf, M. Exogenous Application of Potassium Dihydrogen Phosphate Can Alleviate the Adverse Effects of Salt Stress on Sunflower. J. Plant Nutr. 2011, 34, 1041–1057. [Google Scholar] [CrossRef]
  63. Khan, M.A.; Shirazi, M.U.; Khan, M.A.; Mujtaba, S.M.; Islam, E.; Mumtaz, S.; Shereen, A.; Ansari, R.U.; Yasin Ashraf, M. Role of Proline, K/NA Ratio and Chlorophyll Content in Salt Tolerance of Wheat (Triticum aestivum L.). Pak. J. Bot. 2009, 41, 633–638. [Google Scholar]
  64. Aycan, M.; Baslam, M.; Asiloglu, R.; Mitsui, T.; Yildiz, M. Development of New High-Salt Tolerant Bread Wheat (Triticum aestivum L.) Genotypes and Insight into the Tolerance Mechanisms. Plant Physiol. Biochem. 2021, 166, 314–327. [Google Scholar] [CrossRef]
  65. Lam, H.-M.; Xu, X.; Liu, X.; Chen, W.; Yang, G.; Wong, F.-L.; Li, M.-W.; He, W.; Qin, N.; Wang, B.; et al. Resequencing of 31 Wild and Cultivated Soybean Genomes Identifies Patterns of Genetic Diversity and Selection. Nat. Genet. 2010, 42, 1053–1059. [Google Scholar] [CrossRef]
  66. Ambardekar, A.A.; Siebenmorgen, T.J.; Counce, P.A.; Lanning, S.B.; Mauromoustakos, A. Impact of Field-Scale Nighttime Air Temperatures during Kernel Development on Rice Milling Quality. Field Crop. Res. 2011, 122, 179–185. [Google Scholar] [CrossRef]
  67. Garg, A.K.; Kim, J.K.; Owens, T.G.; Ranwala, A.P.; Choi, Y.D.; Kochian, L.V.; Wu, R.J. Trehalose Accumulation in Rice Plants Confers High Tolerance Levels to Different Abiotic Stresses. Proc. Natl. Acad. Sci. USA 2002, 99, 15898–15903. [Google Scholar] [CrossRef]
  68. James, R.A.; Rivelli, A.R.; Munns, R.; von Caemmerer, S. Factors Affecting CO2 Assimilation, Leaf Injury and Growth in Salt-Stressed Durum Wheat. Funct. Plant Biol. 2002, 29, 1393–1403. [Google Scholar] [CrossRef] [PubMed]
  69. Hura, T.; Grzesiak, S.; Hura, K.; Grzesiak, M.; Rzepka, A. Differences in the Physiological State between Triticale and Maize Plants during Drought Stress and Followed Rehydration Expressed by the Leaf Gas Exchange and Spectrofluorimetric Methods. Acta Physiol. Plant 2006, 28, 433–443. [Google Scholar] [CrossRef]
  70. Mickelbart, M.V.; Hasegawa, P.M.; Bailey-Serres, J. Genetic Mechanisms of Abiotic Stress Tolerance That Translate to Crop Yield Stability. Nat. Rev. Genet. 2015, 16, 237–251. [Google Scholar] [CrossRef]
  71. Porch, T.G.; Jahn, M. Effects of High-Temperature Stress on Microsporogenesis in Heat-Sensitive and Heat-Tolerant Genotypes of Phaseolus Vulgaris. Plant Cell Environ. 2001, 24, 723–731. [Google Scholar] [CrossRef]
  72. Akbar, A.; Manohar, S.S.; Variath, M.T.; Kurapati, S.; Pasupuleti, J. Efficient Partitioning of Assimilates in Stress-Tolerant Groundnut Genotypes under High-Temperature Stress. Agronomy 2017, 7, 30. [Google Scholar] [CrossRef]
  73. Karkute, S.G.; Ansari, W.A.; Singh, A.K.; Singh, P.M.; Rai, N.; Bahadur, A.; Singh, J. Characterization of High-Temperature Stress-Tolerant Tomato (Solanum lycopersicum L.) Genotypes by Biochemical Analysis and Expression Profiling of Heat-Responsive Genes. 3 Biotech 2021, 11, 45. [Google Scholar] [CrossRef]
  74. Yogeesh, L.N.; Naryanareddy, A.B.; Nanjareddy, Y.A.; Channabyre Gowda, M.V. High Temperature Tolerant Genotypes of Finger Millet (Eleusine coracana L.). Nat. Environ. Pollut. Technol. 2016, 15, 1293–1296. [Google Scholar]
  75. Qureshi, A.S.; Daba, A.W. Evaluating Growth and Yield Parameters of Five Quinoa (Chenopodium quinoa W.) Genotypes under Different Salt Stress Conditions. J. Agric. Sci. 2020, 12, 128–140. [Google Scholar] [CrossRef]
  76. Razzaq, A.; Saleem, F.; Wani, S.H.; Abdelmohsen, S.A.M.; Alyousef, H.A.; Abdelbacki, A.M.M.; Alkallas, F.H.; Tamam, N.; Elansary, H.O. De-Novo Domestication for Improving Salt Tolerance in Crops. Front. Plant Sci. 2021, 12, 681367. [Google Scholar] [CrossRef]
  77. Quan, X.; Liang, X.; Li, H.; Xie, C.; He, W.; Qin, Y. Identification and Characterization of Wheat Germplasm for Salt Tolerance. Plants 2021, 10, 268. [Google Scholar] [CrossRef]
  78. Moustafa, E.S.A.; Ali, M.M.A.; Kamara, M.M.; Awad, M.F.; Hassanin, A.A.; Mansour, E. Field Screening of Wheat Advanced Lines for Salinity Tolerance. Agronomy 2021, 11, 281. [Google Scholar] [CrossRef]
  79. Aycan, M.; Nahar, L.; Baslam, M.; Mitsui, T. B-Type Response Regulator hst1 Controls Salinity Tolerance in Rice by Regulating Transcription Factors and Antioxidant Mechanisms. Plant Physiol. Biochem. 2023, 196, 542–555. [Google Scholar] [CrossRef] [PubMed]
  80. Rana, M.M.; Takamatsu, T.; Baslam, M.; Kaneko, K.; Itoh, K.; Harada, N.; Sugiyama, T.; Ohnishi, T.; Kinoshita, T.; Takagi, H.; et al. Salt Tolerance Improvement in Rice through Efficient SNP Marker-Assisted Selection Coupled with Speed-Breeding. Int. J. Mol. Sci. 2019, 20, 2585. [Google Scholar] [CrossRef]
  81. Sami, F.; Siddiqui, H.; Alam, P.; Hayat, S. Glucose-Induced Response on Photosynthetic Efficiency, ROS Homeostasis, and Antioxidative Defense System in Maintaining Carbohydrate and Ion Metabolism in Indian Mustard (Brassica juncea L.) under Salt-Mediated Oxidative Stress. Protoplasma 2021, 258, 601–620. [Google Scholar] [CrossRef] [PubMed]
  82. Aycan, M.; Baslam, M.; Ozdemir, B.; Asiloglu, R.; Mitsui, T.; Yildiz, M. Direct Contribution of the Maternal Genotype on the Transgenerational Salinity Tolerance in Wheat (Triticum aestivum L.). Environ. Exp. Bot. 2021, 192, 104648. [Google Scholar] [CrossRef]
  83. Aycan, M.; Baslam, M.; Mitsui, T.; Yildiz, M. The TaGSK1, TaSRG, TaPTF1, and TaP5CS Gene Transcripts Confirm Salinity Tolerance by Increasing Proline Production in Wheat (Triticum aestivum L.). Plants 2022, 11, 3401. [Google Scholar] [CrossRef] [PubMed]
  84. Ishizaki, K.; Matsui, T.; Kaneda, S.; Kobayashi, K.; Kasaneyama, H.; Abe, S.; Azuma, S.; Hoshi, T.; Sasaki, Y.; Hirao, K. A New Rice Cultivar “Yukinkomai”. J. Niigata Agric. Res. Inst. 2008, 9, 89–98. [Google Scholar]
  85. Horii, A.; McCue, P.; Shetty, K. Seed Vigour Studies in Corn, Soybean and Tomato in Response to Fish Protein Hydrolysates and Consequences on Phenolic-Linked Responses. Bioresour. Technol. 2007, 98, 2170–2177. [Google Scholar] [CrossRef]
  86. Bates, L.S.; Waldren, R.P.; Teare, I.D. Rapid Determination of Free Proline for Water-Stress Studies. Plant Soil 1973, 39, 205–207. [Google Scholar] [CrossRef]
  87. Dhindsa, R.S.; Matowe, W. Drought Tolerance in Two Mosses: Correlated with Enzymatic Defence against Lipid Peroxidation. J. Exp. Bot. 1981, 32, 79–91. [Google Scholar] [CrossRef]
  88. Tejera García, N.A.; Olivera, M.; Iribarne, C.; Lluch, C. Partial Purification and Characterization of a Non-Specific Acid Phosphatase in Leaves and Root Nodules of Phaseolus vulgaris. Plant Physiol. Biochem. 2004, 42, 585–591. [Google Scholar] [CrossRef] [PubMed]
  89. Aebi, H. Catalase in Vitro. In Methods in Enzymology; Academic Press: Cambridge, MA, USA, 1984; Volume 105, pp. 121–126. ISBN 0076-6879. [Google Scholar]
  90. Cakmak, I.; Marschner, H. Magnesium Deficiency and High Light Intensity Enhance Activities of Superoxide Dismutase, Ascorbate Peroxidase, and Glutathione Reductase in Bean Leaves. Plant Physiol. 1992, 98, 1222–1227. [Google Scholar] [CrossRef] [PubMed]
  91. Amako, K.; Chen, G.X.; Asada, K. Separate Assays Specific for Ascorbate Peroxidase and Guaiacol Peroxidase and for the Chloroplastic and Cytosolic Isozymes of Ascorbate Peroxidase in Plants. Plant Cell Physiol. 1994, 35, 497–504. [Google Scholar] [CrossRef]
  92. Pequerul, A.; Pérez, C.; Madero, P.; Val, J.; Monge, E. A Rapid Wet Digestion Method for Plant Analysis. Optim. Plant Nutr. 1993, 2, 3–6. [Google Scholar] [CrossRef]
  93. Kaneko, K.; Sasaki, M.; Kuribayashi, N.; Suzuki, H.; Sasuga, Y.; Shiraya, T.; Inomata, T.; Itoh, K.; Baslam, M.; Mitsui, T. Proteomic and Glycomic Characterization of Rice Chalky Grains Produced under Moderate and High-Temperature Conditions in Field System. Rice 2016, 9, 26. [Google Scholar] [CrossRef]
  94. Guglielminetti, M.; de Giuli Morghen, C.; Radaelli, A.; Bistoni, F.; Carruba, G.; Spera, G.; Caretta, G. Mycological and Ultrastructural Studies to Evaluate Biodeterioration of Mural Paintings. Detection of Fungi and Mites in Frescos of the Monastery of St Damian in Assisi. Int. Biodeterior. Biodegrad. 1994, 33, 269–283. [Google Scholar] [CrossRef]
  95. Hothorn, T.; Bretz, F.; Westfall, P. Simultaneous Inference in General Parametric Models. Biom. J. 2008, 50, 346–363. [Google Scholar] [CrossRef]
  96. Kassambara, A.; Mundt, F. Factoextra: Extract and Visualize the Results of Multivariate Data Analyses. R Package Version 1.0.7. Available online: https://CRAN.R-project.org/package=factoextra (accessed on 23 January 2023).
  97. Kolde, R. Pretty Heatmaps. R Package Version 1.0.10. Available online: https://CRAN.R-project.org/package=pheatmap (accessed on 20 January 2023).
Figure 1. Weekly plant growth performance of Yukinkomai, YNU31-2-4, and YNU SL rice genotypes from the vegetative stage. Forty-day-old uniform-looking rice plants subjected to (A) treatment 1, (B) treatment 2 (T2), (C) treatment 3 (T3), (D) treatment 4 (T4), (E) treatment 5 (T5), and (F) treatment 6 (T6). Week 1 represents plant growth differences after 7 days of stress treatment at the vegetative stage. Seedling stage (SS), vegetative stage (VS), and reproductive stage (RS). The Tukey HSD test from three independent biological replicates (n = 5) shows that means (±SD) in the same graph followed by letters are substantially different at p < 0.05.
Plants 12 01910 g001
Figure 2. The ratio of photosynthetic parameters (The net photosynthetic rate, An; stomatal conductance, gs; the intercellular CO2 concentration, Ci; transpiration rate, E; the ratio of intercellular to ambient CO2 concentration, Ci/Ca; water use efficiency, WUE (An/gs); chlorophyll a, Chla; chlorophyll b, Chlb; total chlorophyll, chlT content; and relative water content, RWC) of Yukinkomai, YNU31-2-4, and YNU SL rice genotypes under (A) treatment 2 (T2), (B) treatment 3 (T3), (C) treatment 4 (T4), (D) treatment 5 (T5), and (E) treatment 6 (T6). Ratio (Treatment/Control-T1). Seedling stage (SS), vegetative stage (VS), and reproductive stage (RS).
Plants 12 01910 g002
Figure 3. The ratio of harvesting parameters (plant height, plant biomass, root length, root biomass, panicle number, panicle length, flag leaf area, grain number per panicle, spikelet number, 1000-grain weight, and yield per plant) of Yukinkomai, YNU31-2-4, and YNU SL rice genotypes under (A) treatment 2 (T2), (B) treatment 3 (T3), (C) treatment 4 (T4), (D) treatment 5 (T5), and (E) treatment 6 (T6). Ratio (Treatment/Control-T1). Seedling stage (SS), vegetative stage (VS), and reproductive stage (RS).
Plants 12 01910 g003
Figure 4. The ratio of grain quality parameters (Grain length, grain width, grain thickness, perfect grain, and chalky grain) of Yukinkomai, YNU31-2-4, and YNU SL rice genotypes under (A) treatment 2 (T2), (B) treatment 3 (T3), (C) treatment 4 (T4), (D) treatment 5 (T5), and (E) treatment 6 (T6). Ratio (Treatment/Control-T1). Seedling stage (SS), vegetative stage (VS), and reproductive stage (RS).
Plants 12 01910 g004
Figure 5. The ratio of protein, malondialdehyde (MDA), proline (PRO) content, catalase (CAT), superoxide dismutase (SOD), and ascorbate peroxidase (APX) activity of Yukinkomai, YNU31-2-4, and YNU SL rice genotypes under (A) treatment 2 (T2), (B) treatment 3 (T3), (C) treatment 4 (T4), (D) treatment 5 (T5), and (E) treatment 6 (T6). Ratio (Treatment/Control-T1). Seedling stage (SS), vegetative stage (VS), and reproductive stage (RS).
Plants 12 01910 g005
Figure 6. The ratio of ion content (root and shoot) of Yukinkomai, YNU31-2-4, and YNU SL rice genotypes under (A) treatment 2 (T2), (B) treatment 3 (T3), (C) treatment 4 (T4), (D) treatment 5 (T5), and (E) treatment 6 (T6). Ratio (Treatment/Control-T1). Seedling stage (SS), vegetative stage (VS), and reproductive stage (RS).
Plants 12 01910 g006
Figure 7. The glucose content of dry seeds of Yukinkomai, YNU31-2-4, and YNU SL rice genotypes under Treatment 1 (T1), T2, T3, T4, T5, and T6. The Tukey HSD test from three independent biological replicates (n = 3) shows that means (±SD) in the same graph followed by letters are substantially different at p < 0.05.
Plants 12 01910 g007
Figure 8. Principle component and hierarchical clustering analyses of growth performance of Yukinkomai, YNU31-2-4, and YNU SL rice genotypes under different salt and heat stress combinations (T1, T2, T3, T4, T5, and T6) in different growth stages (SS: Seedling stage, VS: Vegetative stage, RS: Reproductive stage). (A) Principal component analysis (PCA) of the spatialization of genotypes and treatments (Colors green: control (C, 26 °C, 0 mM NaCl), blue: salinity (S, 26 °C, 75 mM NaCl), yellow: heat (H, 31 °C, 0 mM NaCl) and red: heat + salt (H + S, 31 °C, 75 mM NaCl) treatments), (B) PCA of the studied traits, and (C) hierarchical clustering analysis (HCA) of measured growth performance in Yukinkomai, YNU31-2-4, and YNU SL genotypes under treatment 1 (T1), T2, T3, T4, T5, and T6. Clusters represent genotypes (C1 to C7) and traits (I and II). Yukinkomai (Y), YNU31-2-4 (N), and YNU SL (S) genotypes. The net photosynthetic rate (An), stomatal conductance (Gs), the intercellular CO2 concentration (Ci), transpiration rate (E), the ratio of intercellular to ambient CO2 concentration (Ci/Ca), water use efficiency (WUE), chlorophyll a (Chla), chlorophyll b (Chlb), total chlorophyll (ChlT) content, and relative water content (RWC), plant height (PH), plant biomass (PB), root length (RL), root bimass (RB), panicle number (PN), panicle length (PL), flag leaf area (FLA), grain number perpanicle (GNPP), spiklet number (SN), 1000-grain weight (TGW), yield per plant (YPP), perfect grain (PG), chalky grain (CG), grain length (GL), grain width (GW), grain thickness (GT), protein (PROT), malondialdehyde (MDA), proline (PRO), catalase (CAT), superoxide dismutase (SOD), ascorbat peroxidase (APX), Na+ concentration in the shoot (NaS), Na+ concentration in the root (NaR), K+ concentration in the shoot (KR), K+ concentration in the root (KR), Na+/K+ ratio in the shoot (NaKS), and Na+/K+ ratio in the root (NaKR). The Tukey HSD test from three independent biological replicates (n = 3) shows that means (±SD) in the same graph followed by letters are substantially different at p < 0.05.
Plants 12 01910 g008
Table 1. A diagram illustrating of stress on rice crops at different stages of growth.
Treatment
(T)
Seedling Stage
(SS)
Vegetative Stage
(VS)
Reproductive Stage
(RS)
T1Control
(C; 26 ℃, 0 mM NaCl)
Control
(C; 26 °C, 0 mM NaCl)
Control
(C; 26 ℃, 0 mM NaCl)
T2Control
(C; 26 ℃, 0 mM NaCl)
Salinity
(S; 26 ℃, 75 mM NaCl)
Control
(C; 26 ℃, 0 mM NaCl)
T3Control
(C; 26 ℃, 0 mM NaCl)
Salinity
(S; 26 ℃, 75 mM NaCl)
Salinity
(S; 26 ℃, 75 mM NaCl)
T4Control
(C; 26 ℃, 0 mM NaCl)
Salinity
(S; 26 ℃, 75 mM NaCl)
Heat
(H; 31 ℃, 0 mM NaCl)
T5Control
(C; 26 ℃, 0 mM NaCl)
Control
(C; 26 ℃, 0 mM NaCl)
Heat
(H; 31 ℃, 0 mM NaCl)
T6Control
(C; 26 ℃, 0 mM NaCl)
Salinity
(S; 26 ℃, 75 mM NaCl)
Heat and Salinity
(H + S; 31 ℃, 75 mM NaCl)
Disclaimer/Publisher’s Note: The statements, opinions and data contained in all publications are solely those of the individual author(s) and contributor(s) and not of MDPI and/or the editor(s). MDPI and/or the editor(s) disclaim responsibility for any injury to people or property resulting from any ideas, methods, instructions or products referred to in the content.

