Article

Ecophysiological Differentiation among Two Resurrection Ferns and Their Allopolyploid Derivative

by
Luis G. Quintanilla
1,*,
Ismael Aranda
2,
María José Clemente-Moreno
3,
Joan Pons-Perpinyà
3 and
Jorge Gago
3,*
1
School of Environmental Sciences and Technology (ESCET), University Rey Juan Carlos, 28922 Móstoles, Spain
2
National Institute for Agricultural and Food Research and Technology (INIA), Spanish National Research Council, 28040 Madrid, Spain
3
Agro-Environmental and Water Economics Institute (INAGEA), University of the Balearic Islands, 07122 Palma de Mallorca, Spain
*
Authors to whom correspondence should be addressed.
Plants 2023, 12(7), 1529; https://doi.org/10.3390/plants12071529
Submission received: 7 March 2023 / Revised: 27 March 2023 / Accepted: 30 March 2023 / Published: 1 April 2023

Abstract

:
Theoretically, the coexistence of diploids and related polyploids is constrained by reproductive and competitive mechanisms. Although niche differentiation can explain the commonly observed co-occurrence of cytotypes, the underlying ecophysiological differentiation among cytotypes has hardly been studied. We compared the leaf functional traits of the allotetraploid resurrection fern Oeosporangium tinaei (HHPP) and its diploid parents, O. hispanicum (HH) and O. pteridioides (PP), coexisting in the same location. Our experimental results showed that all three species can recover physiological status after severe leaf dehydration, which confirms their ‘resurrection’ ability. However, compared with PP, HH had much higher investment per unit area of light-capturing surface, lower carbon assimilation rate per unit mass for the same midday water potential, higher non-enzymatic antioxidant capacity, higher carbon content, and lower contents of nitrogen, phosphorus, and other macronutrients. These traits allow HH to live in microhabitats with less availability of water and nutrients (rock crevices) and to have a greater capacity for resurrection. The higher assimilation capacity and lower antioxidant capacity of PP explain its more humid and nutrient-rich microhabitats (shallow soils). HHPP traits were mostly intermediate between those of HH and PP, and they allow the allotetraploid to occupy the free niche space left by the diploids.

1. Introduction

Polyploids originate in low numbers within populations of diploid parents [1]. In theory, the initial establishment of polyploids and their subsequent coexistence with parents is constrained by a frequency-dependent mating disadvantage, known as minority cytotype exclusion [1]. Individuals of the less frequent cytotype are more likely to be fertilized by gametes from the more common cytotype, causing them to have odd-ploidy offspring, which are mostly sterile. Thus, the rarer cytotype may be progressively eliminated from admixed populations. Despite this initial disadvantage, polyploidization is a very frequent speciation mechanism in plants [2], and polyploids often form populations mixed with their diploid parents [3]. Explanations for this paradox include higher competitive ability of polyploids [4] and niche differentiation between cytotypes [5,6], which can increase the likelihood of coexistence.
In allopolyploids, whole genome duplication occurs after an interspecific hybridization event. The coexistence of two divergent parental genomes in allopolyploid individuals results in profound genetic and epigenetic changes [7]. These, in turn, trigger shifts in responses to environmental factors, which may allow allopolyploids to diverge ecologically from parents [8] or outcompete them [9]. The phenotypic traits of allopolyploids, as in homoploid hybrids, can be intermediate between those of the parent species, biased toward or overlapping with one of the parents, or even be outside the variation range of parents (transgressive trait) [10,11]. This phenotypic diversity reflects the multiple expression patterns of duplicated (homoeologous) genes [12].
Despite great advances in the understanding of the genetic effects of allopolyploidization, its consequences on the expression of ecophysiological traits are still largely unknown [13,14]. Allopolyploids have long been viewed as ‘fill-in’ taxa that occupy geographic ranges and ecological niches intermediate to those of their diploid parents [15]. Some studies support that allopolyploids have intermediate abiotic niches that overlap those of their parents or maintain considerable niche conservatism [16,17]. However, two recent analyses indicate that niche divergence of allopolyploids from their parents is frequent [18,19]. Consistent with this, allopolyploids often have increased competitiveness in environments that are harsh or unsuitable for their parent diploids [20,21]. Fixed heterozygosity, intergenomic interactions, and gene expression dosage effects have been proposed to explain the better growth vigor [22,23] or better stress tolerance [24] observed in allopolyploids compared with their diploid ancestors [25].
Many allopolyploids display a better physiological capacity in dry environments than both diploid parents. These transgressive responses can be due not only to heterosis, but also to increase in cell size, or ‘gigas‘ effect, a nucleotypic consequence of duplicated genomes [26]. Cell enlargement in the xylem accompanied by smaller pit pore sizes could increase resistance to drought-induced hydraulic failure while maintaining significant hydraulic conductivity rates, which may explain why polyploids tend to occupy drier habitats that their parents [27]. In addition, compared with diploid parents, polyploids often have higher leaf thickness, higher leaf mass per area (LMA), and more pubescence [20,28], which are traits related to drought tolerance and efficient gas-exchange in arid and semi-arid environments [29]. Polyploids also tend to show larger guard cells with larger stomatal apertures, and lower stomatal density, which allow for greater water use efficiency (WUE) [21,24]. This maximizes carbon assimilation per water losses, a key factor for adaptation to xeric habitats [29].
Allopolyploidy also changes functional traits more closely linked to biochemistry. Compared to diploid parents, some polyploids show a delayed stomatal closure up to much lower water potentials, implying that photosynthesis can continue for a longer period driven by greater accumulation of osmolytes and osmoprotectors as proline and soluble sugars [20,28]. These processes are essential to finally obtain a net positive carbon balance at the end of the growing season, which ensures species viability in dry environments [30]. Research on the consequences of polyploidy on secondary metabolism has focused primarily on improving the production and chemical diversity of compounds in medicinal plants [31]. However, changes in the amount and, especially in allopolyploids, variety of compounds can affect both their competitive interactions with diploid parents and their tolerance to abiotic stress [23,32].
Interestingly, polyploidy is very common in vascular plants adapted to water scarcity by a ‘resurrection‘ strategy, such as many ferns [33,34]. Such resurrection plants are those that can tolerate dehydration in their vegetative tissues to almost complete depletion of water (<10% of the water content) for months [35,36]. As plants dry out, photosynthesis and all other metabolic activities slow until they cease or nearly so [35]. The mechanisms driving survival and preservation of functionality under these extreme desiccation events can basically be grouped into two different key-points: control of reactive oxygen species (ROS) levels by the antioxidant biochemistry, to avoid damage by oxidative stress during dehydration and rehydration, and structural rearrangements, which ensure cell integrity [34,37]. However, these structural features involved in survival to drastic dehydrations can constrain their photosynthetic capacity due to reduced mesophyll conductance (gm) associated with thicker cell walls [38,39], which implies longer optimal growing periods to fulfill a positive net carbon balance.
Here, we compared the ecophysiology of three resurrection ferns: the allotetraploid Oeosporangium tinaei (Tod.) Fraser-Jenk. and its diploid parents, O. hispanicum (Mett.) Fraser-Jenk. & Pariyar and O. pteridioides (Reichard) Fraser-Jenk. & Pariyar. Hereafter, they will be referred to by genome constitution of the sporophyte: HH = O. hispanicum, PP = O. pteidioides and HHPP = O. tinaei, where H = hispanicum genome and P = pteridioides genome. These species belong to cheilanthoid clade (Pteridaceae: Cheilanthoideae), which is adapted to arid and seasonally dry environments. The study species curl up their leaves by dehydration during summer drought and uncurl them (leaf ‘resurrection’) when rain returns in autumn (Figure 1). HHPP and HH are mainly located in the Iberian Peninsula (SW Europe), while PP has a wider distribution in S Europe, N Africa and W Asia. HHPP exhibits substantial sympatry with both progenitors, which suggests that its niche is intermediate to those of its parents in terms of breadth and abiotic tolerances [17]. Indeed, in the localities where the three cytotypes coexist, there is some spatial segregation between them, which tend to form unmixed aggregates [40]. All three species inhabit siliceous rocks that are highly exposed to the sun, but PP grows on shallow soils, HH occupies crevices and concavities with hardly any soil, and HHPP is in intermediate microhabitats and sometimes grows in close proximity to one of the parents.
Our main objective was to decipher the functional attributes responsible for this niche differentiation. For this, we studied co-occurring populations of the three species at the onset of summer drought, when they still had fully expanded leaves, but were beginning to undergo water stress. Specifically, we assessed the following leaf traits: leaf mass per area, maximum photosynthetic rate, midday water potential, desiccation tolerance, antioxidant capacity, and elemental composition. We hypothesize that HHPP traits respond to resource allocation trade-offs between carbon gains and stress tolerance in an intermediate manner relative to diploid progenitors, which drives niche intermediacy.

2. Materials and Methods

2.1. Plant Species and Study Populations

The three studied Oeosporangium species are hemicriptophytes, with short rhizomes that may branch but do not have extensive clonal growth. Leaves are arranged in apical crowns and are longer in HHPP (up to 30 cm) and HH (<26 cm) than in PP (<18 cm) [41]. Laminae arebi- or tripinnate, with the underside covered with dense reddish long hairs in HH (Figure 1), short sparse hairs in HHPP, or glabrous in PP. All three species have a wide geographic distribution in Spain and are not included in the national Red List of threatened plants [42]. The study was carried out on one population of each species in Picadas dam (central Spain, 40°20′ N, 4°15′ W, altitude 530 m). The climate is continental Mediterranean, characterized by an extended summer drought, which subjects the vegetation to severe water stress and cold winters. Total annual precipitation is 437 mm, and mean annual temperature is 16.9 °C (years 2004−2022, Picadas dam weather station, Tagus Hydrographic Confederation). The study populations were located on sunny, SW oriented, rocky slopes, which consisted of schist and gneiss, and they had a few other plants, e.g., Asplenium ceterach, Umbilicus rupestris, and Quercus ilex. Field measurements and sample collections were conducted from 9 to 15 May 2022, when the summer drought was just beginning, and a few days before the three species curled all their leaves due to dehydration (own observations). For all the variables studied, the sample sizes (n) correspond to biological samples, i.e., individuals which were randomly selected. Some individuals were sampled repeatedly for several variables, depending on their leaf abundance.

2.2. Leaf Structure and Water Content

One to two basal pinnae per plant (n = 15 individuals/species) were scanned and their area was measured with the program ImageJ [43]. Pinnae were then oven-dried for 48 h at 60 °C and weighed to determine their dry mass and then calculate LMA (g m−2). Relative water content (RWC; %) was used to determine the hydration status of leaves. One to two basal pinnae per plant (n = 7 individuals/species) were weighed to obtain the fresh weight (FW). Pinnae were subsequently hydrated in wet tissue paper for 24 h at 4 °C in darkness and weighed to obtain the turgid weight (TW). Finally, pinnae were dried (48 h, 60 °C) to obtain the dry weight (DW). RWC was calculated with the following equation: RWC = 100 × (FW − DW)/(TW − DW).

2.3. Gas Exchange and Water Potential

Leaf gas exchange and water potential were measured in 9, 10, and 14 individuals of HH, HHPP and PP, respectively. Gas exchange and chlorophyll fluorescence measurements were performed, employing the equipment Li-6400XT (Li-Cor Inc., Lincoln, USA) with a fluorescence chamber of 2 cm2 (Li-6400-40). Leaves were carefully placed in the measurement chamber to ensure that they covered the maximum area and contacted the leaf thermocouple. If the leaf did not completely cover the chamber measurement area, a picture of that leaf was taken to recalculate the leaf area and its gas exchange parameters using ImageJ. Instantaneous measurements of light-saturated net photosynthesis (Aarea; μmol CO2 m−2 s−1) and stomatal conductance to H2O (gs; μmol H2O m−2 s−1) were recorded 20−30 min after clamping once leaves reached the gas-exchange steady-state. The set-up in the leaf chamber was: 400 ppm of Ca (atmospheric CO2 concentration in the measurement chamber), 1200 μmol m−2 s−1 of photosynthetic photon flux density (PPFD) (90:10% red:blue light), determined previously as light saturating conditions, 50–70% relative humidity, flow 150–300 μmol air s−1 (flow was reduced to maximize ΔCO2 when leaf gas-exchange rates were extremely low), and 25 °C block temperature. Mass-based net photosynthesis (Amass; μmol CO2 g−1 s−1)was obtained by dividing Aarea (μmol CO2 m−2 s−1) by LMA (g m−2). Quantum yield of the photosystem II (ΦPSII; unitless) was calculated as described in [44]. Leaf water potential at mid-day (Ψmd; MPa) was measured with a Scholander chamber (PMS 1505D-EXP, PMS Instrument Company, Albany, USA) on the plants just after recording gas exchange. In addition, leaves were reserved in paper bags and oven-dried until reaching stable dry weight for subsequent analysis of elemental composition.

2.4. Desiccation Tolerance

To assess leaf desiccation tolerance, the so-called ‘Falcon test‘ [45] was performed. This test consists of four steps as follows. (i) Hydration: pinnae separated from the leaf were fully hydrated in wet tissue paper for 24 h to obtain TW and initial maximum photochemical efficiency of PSII (Fv/Fm; unitless), measured with a Junior-Pam (Walz, Germany). (ii) Desiccation: these pinnae were subsequently desiccated for 24 h in closed 50-mL Falcon tubes with a sponge soaked in three desiccants: NaCl, MgCl2, and silica gel, which promote atmospheres with relative humidities of 80, 50, and 10%, respectively. (iii) Recovery: pinnae were fully rehydrated as in (i). (iv) Complete drying: pinnae were oven-dried at 60 °C for 48 h to obtain their DW. After (ii) and (iii), pinnae were weighed to calculate RWC after desiccation (RWCdesic.) and recovery (RWCrecov.), respectively. Fv/Fm was also measured after (ii) and (iii). Fv/Fm(desic.) was the ratio between Fv/Fm after desiccation and initial Fv/Fm, whereas Fv/Fm(recov.) was the ratio between Fv/Fm after recovery and initial Fv/Fm. The variable Fv/Fm(recov.) is a proxy of desiccation tolerance [45]. For this Falcon test, n = 17 individuals/species, from each of which one to two pinnae were used.

2.5. Antioxidant Capacity and Elemental Composition

Total antioxidant capacity was measured in 11, 16, and 16 individuals of HH, HHPP, and PP, respectively. One to two basal pinnae per individual were harvested and immediately frozen in liquid nitrogen. Frozen samples were lyophilized and subsequently ground and homogenized with acidified methanol (7% acetic in 80% methanol) buffer. Trolox Equivalent Antioxidant capacity (TEAC) was calculated by ABTS radical scavenging capacity assay employing a Trolox standard curve [46]. Results are expressed as mM Trolox equivalent (TE) per g of DW.
To study foliar elemental composition, two to three basal pinnae per plant (n = 7 individuals/species) were harvested and separated in two subsamples. One subsample was subsequently oven-dried at 80 °C and ground to obtain a dry powder for quantifying total carbon (Ctotal; g/100 g DW), nitrogen (Ntotal; g/100 g DW), and other elements. The second subsample was used to obtain cell wall (CW) fraction (as AIR: alcohol insoluble residue) as follow: samples were boiled in absolute ethanol until they were bleached. Subsequently, samples were cleaned in acetone by shaking for 30 min twice, further air-dried overnight, and homogenized by dry milling. These CW samples were used to determine C and N content specifically in cell walls (CCW and NCW, respectively; g/100 g of AIR). These two variables could finally be determined in six of the seven sampled individuals of each species. C and N determinations (Ctotal, Ntotal, CCW and NCW) were obtained by combustion at 950 °C and analyzed by individual infrared detection and thermal conductivity. Total content of other elements was determined in an ICP THERMO ICAP 6500 DUO spectrometer (Thermo Scientific, Rockford, USA). Both analyses were performed by the CEBAS-CSIC Ionomic Service in Murcia, Spain.

2.6. Statistical Analyses

LMA, RWC, Aarea, TEAC, Ctotal, Ntotal, C/Ntotal, CCW, NCW, C/NCW, and 13 additional foliar elements were analyzed by one-way ANOVA, with species as the fixed factor. RWCdesic., Fv/Fm(desic.), RWCrecov., and Fv/Fm(recov.) were analyzed by a two-way ANOVA, with species and desiccation level as fixed factors. For improving normality, these four dependent variables and RWC were arcsine-transformed before the analyses. Subsequent pairwise comparisons were made using Tukey tests (p < 0.05). One-way ANCOVAs were conducted to compare Amass among the three species (species = categorical predictor variable). Three models were performed, each including the following covariates: Ψmd, gs, and ΦPSII. The models were first run with the interaction categorical variable × covariate, and then the non-significant interactions were excluded. Post hoc comparison of adjusted least square means of species were performed with Bonferroni multiple testing procedure. Principal component analysis (PCA) was carried out to compare the foliar elemental composition among species. This PCA included Ctotal, Ntotal and the 13 additional elements with more variability explained by the first two principal components, based on vector length. All statistical analyses were conducted in R software [47]. Results are given as means ± standard error unless otherwise indicated. The complete dataset is available in the Supplementary Material (Data S1).

3. Results

3.1. Leaf Structure and Water Content

LMA of the three species were significantly different (F2, 42 = 25.00, p < 0.0001, ANOVA; p < 0.05, all Tukey tests). LMA of HH (186 ± 10 g m−2) was almost twice that of PP (97 ± 3 g m−2), and HHPP showed an intermediate LMA (140 ± 11 g m−2). RWC showed no difference among PP (88.3 ± 1.5%), HHPP (88.3 ± 1.6%), and HH (82.0 ± 2.8%) (F2, 18 = 2.93, p = 0.0793, ANOVA). The range for RWC of these species were 82−93%, 82−94%, and 68−92%, respectively.

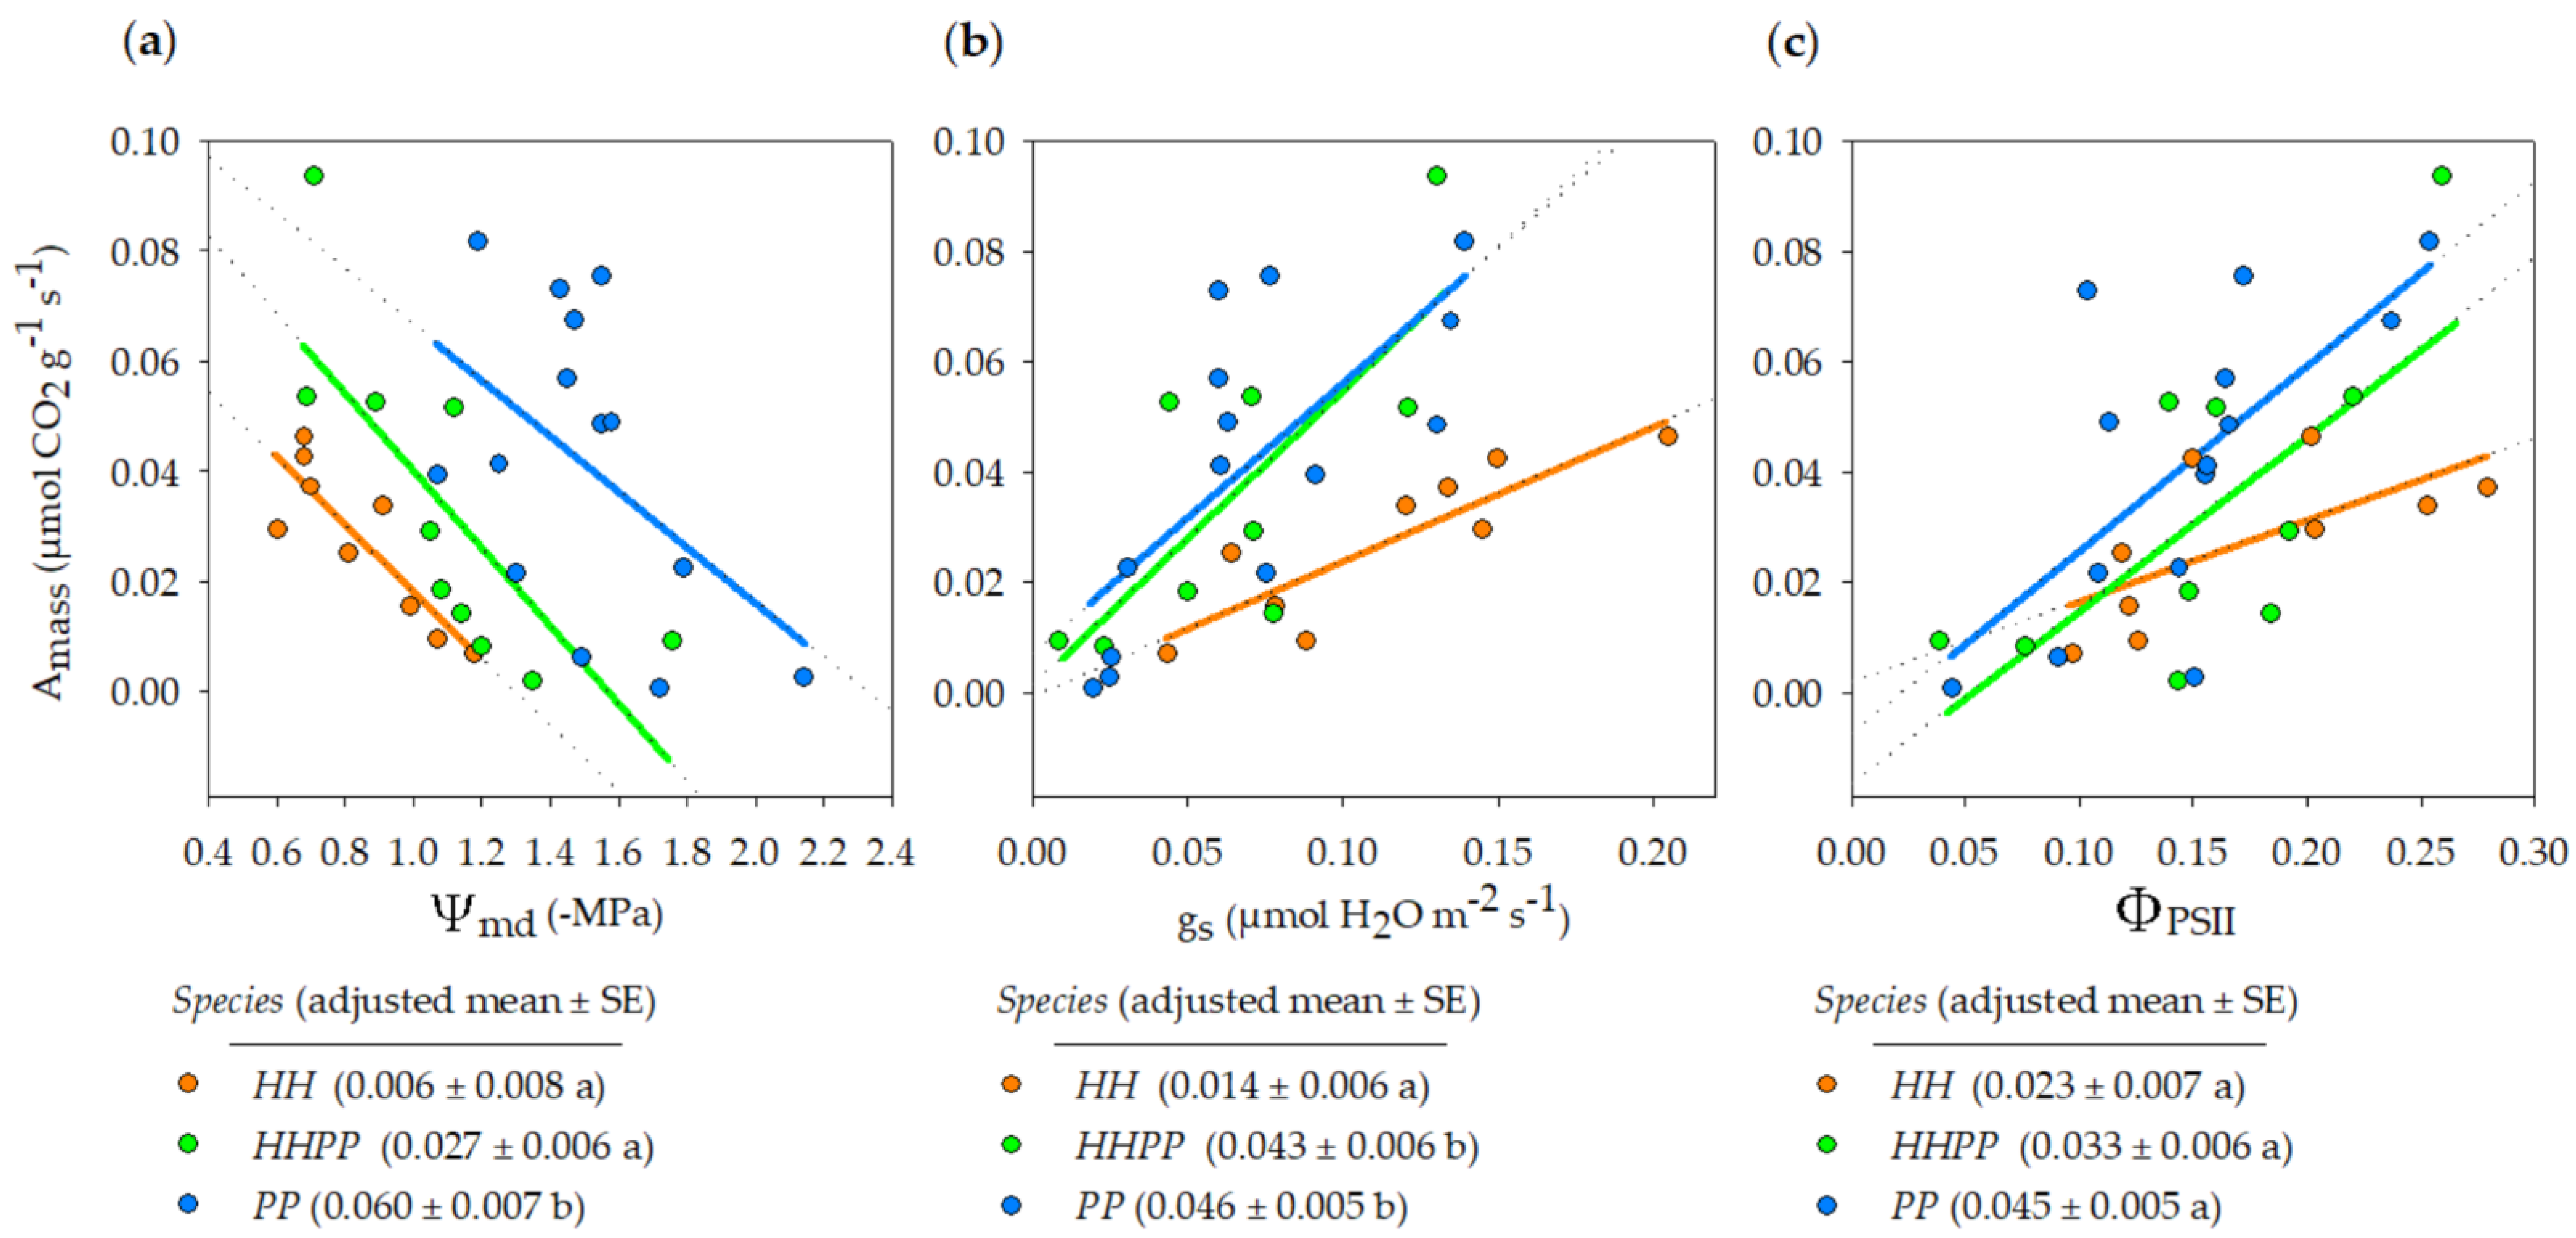
3.2. Gas Exchange and Water Potential

Aarea of HH, HHPP, and PP were 4.88 ± 0.82, 4.26 ± 1.01, and 4.02 ± 0.73 μmol CO2 m−2 s−1, respectively, with no significant differences among them (F2, 30 = 0.26, p = 0.77, ANOVA). As expected, Amass related positively with Ψmd, gs, and ΦPSII (Table 1, Figure 2). The dependence of Amass on these three covariates was parallel for all species (i.e., the species × covariate interaction was not significant). Moreover, the Y intercepts of the regression lines were significantly different among species for both Ψmd and gs, i.e., the species means while controlling for these covariates were different. It should be noted that the operating range of Ψmd was lower (more negative) in PP than in HH (Figure 2a). When adjusting for this covariate, PP had ten times higher Amass than HH (0.060 vs. 0.006 μmol CO2 g−1 s−1), whereas, when adjusting for gs (Figure 2b), PP showed three times higher Amass than HH (0.046 vs. 0.014 μmol CO2 g−1 s−1). HHPP had intermediate means, more similar to that of HH after adjusting for Ψmd, or closer to that of PP after adjusting for gs (p < 0.05, Bonferroni test). After controlling for ΦPSII, differences in Amass among species were marginally significant in ANOVA (p = 0.053; Table 1) or not significant in the post hoc Bonferroni test (p > 0.05 for all species pairs; Figure 2c).

3.3. Desiccation Tolerance

RWCdesic. did not differ significantly among species but did differ among desiccation levels (Table S1). RWCdesic. at 80% and 50% RH desiccations were similar (means ~18%, data of the three species pooled; Figure S1), and significantly higher than that at 10% desiccation (3.5 ± 1.0%). Fv/Fm(desic.) showed significant differences both among species and among desiccation levels (Table S1, Figure S1). Fv/Fm(desic.) for the species decreased in the order: PP (49.3 ± 4.0%) > HHPP (36.8 ± 4.0%) > HH (33.1 ± 3.2%), and means for the desiccations decreased: 50% RH (49.0 ± 4.0%) > 10% RH (40.2 ± 3.7%) > 80% RH (32.1 ± 3.7%). By contrast, RWCrecov. did not differ significantly among desiccations (Table 2, Figure 3). RWCrecov. was significantly higher in PP (77.5 ± 2.9%) than in HHPP and HH (means ~63%). Fv/Fm(recov.) did not show significant differences among species or among desiccation levels (Table 2, Figure 3). The overall mean of this variable for all species−desiccation combinations (n = 48) was 75.8 ± 1.8%.

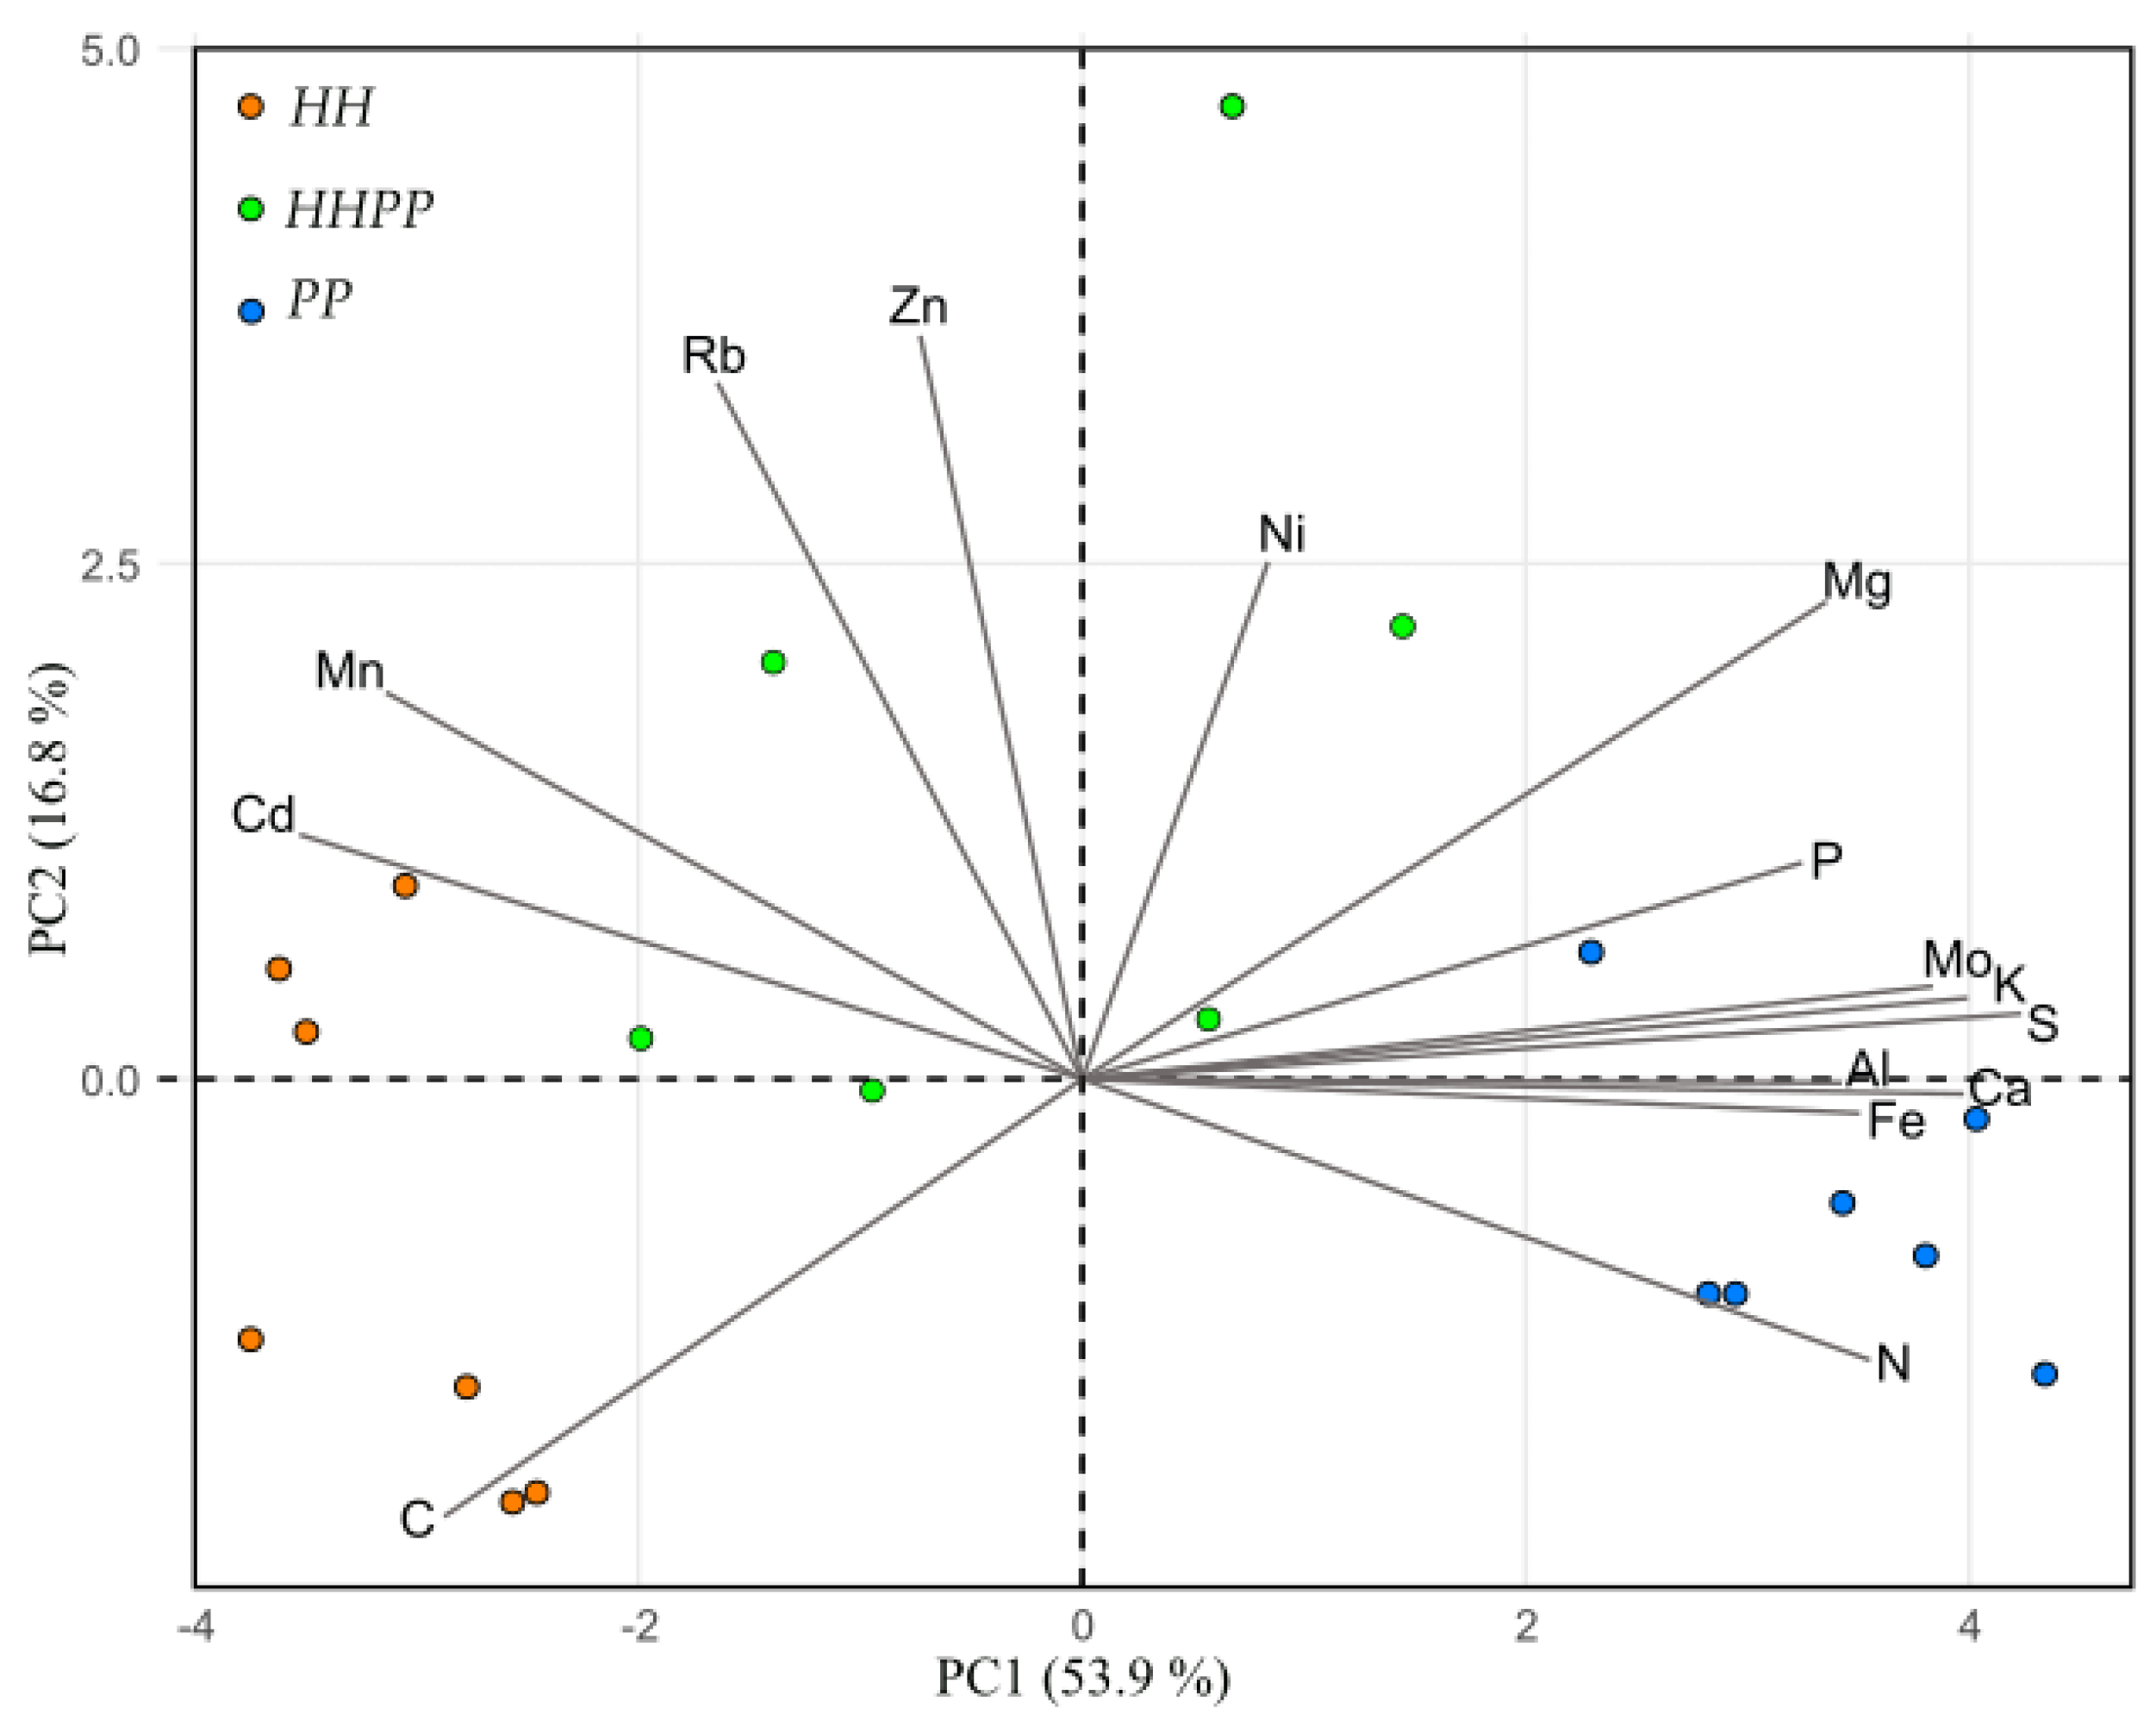
3.4. Antioxidant Capacity and Elemental Composition

Leaf TEAC differed significantly among species (F2, 40 = 7.09, p = 0.0023, ANOVA). Specifically, HHPP (94.7 ± 6.3 mM TE/g DW) and HH (92.6 ± 8.6 mM TE/g DW) showed similar antioxidant activities (p > 0.05, Tukey test), which were significantly higher than that of PP (66.2 ± 4.1 mM TE/g DW) (p < 0.05, Tukey test).
Species also differed significantly in the leaf variables Ctotal (F2, 17 = 48.9, p < 0.0001, ANOVA), Ntotal (F2, 17 = 11.49, p = 0.0007) and C/Ntotal (F2, 17 = 15.45, p = 0.0002). HH had more Ctotal and less Ntotal than PP, and, thus, C/Ntotal was higher in HH (Table 3). Ntotal and C/Ntotal of HHPP were more similar to those of HH, whereas Ctotal of HHPP was similar to that of PP. In the cell wall, C and N contents were much more similar among species, which did not show significant differences in NCW (F2, 15 = 0.62, p = 0.55) or C/NCW (F2, 15 = 0.64, p = 0.54). In the three species, C/NCW had much lower values than C/Ntotal. CCW did have significant differences among species (F2, 15 = 7.10, p = 0.0068) and, similar to Ctotal, it was higher in HH than in PP (Table 3). CCW of HHPP was intermediate relative to diploids.
Most of the 13 additional leaf elements analyzed differed significantly among species (Table S2). Al, Ca, Fe, K, Mg, Mo, P, and S were more abundant in PP than in HH, while Cd and Mn were more abundant in HH. HHPP had intermediate contents compared with diploids for many elements. In the PCA (Figure 4), the first principal component (PC1) explained 54% of the data variance and PC2 accounted for 17% of variance. HH and PP were located in the negative and positive values of PC1, respectively, while HHPP again showed an intermediate position between diploids. The highest negative loading of PC1 was related to C, Mn, and Cd, whereas the positive side was mainly driven by macronutrients as N, P, K, and S (Figure 4).

4. Discussion

Our comparison of leaf functional traits between the allotetraploid resurrection fern HHPP and its diploid parents, HH and PP, yields two key findings. First, HH and PP have diverged for most of the traits assessed, despite phylogenic proximity, as they are congeneric, and despite living sympatrically in the same rocky environment. Specifically, HH showed leaf traits linked to drier conditions than those of PP, such as much higher LMA, lower Amass, higher TEAC, higher Ctotal, C/Ntotal and CCW, and lower Ntotal. Second, we found no evidence of transgressive trait expression in the allotetraploid, as its traits fell within the variation range of parents and were intermediate in most cases. These results support our hypothesis that HHPP expresses mainly intermediate traits, which can favor this polyploid to successfully fill an intermediate niche between those of diploids.
LMA of HH, HHPP, and PP (186, 140 and 97 g m−2, respectively) are in the range of other rupicolous resurrection ferns, which show larger LMA, leaf thickness and Aarea values [39] than desiccation sensitive ferns [48]. For example, sun-exposed individuals of Asplenium ceterach have LMA = 123 g m−2, while shade individuals show much lower LMA due to both lower leaf thickness and lower leaf density [49]. This species is a good reference for comparison, as it is present in the vicinity of the populations we studied. Anemia caffrorum, another resurrection rupicolous fern, produces desiccation-tolerant leaves in the dry season, with the same LMA as PP, and desiccation-sensitive leaves in the wet season, with half the LMA [50]. Aarea of HH, HHPP, and PP (4.9, 4.3 and 4.0 μmol CO2 m−2 s−1, respectively) were lower than those of other rupicolous resurrection ferns [39,49,50,51]. However, direct comparisons should be made with caution, as the individuals in our study were beginning to suffer from summer water deficiency. This is evidenced by the variation in Ψmd and gs (Figure 2), which strongly affect CO2 assimilation rates [52,53]. This variation in water status provided an exceptional opportunity to compare the dehydration responses of the three species. After considering the impact of those covariates on carbon uptake (Figure 2), adjusted mean Amass of PP was similar to those other rupicolous resurrection ferns, such as A. ceterach [49]. Interestingly, PP was able to maintain a positive net carbon gain at much more negative Ψmd (−2.2 MPa) than HH (−1.2 MPa), whereas HHPP showed an intermediate capacity. Moreover, at any gs, HH had lower carbon assimilation than HHPP and especially PP, which indicates that HH has stronger diffusive mesophyll limitations, i.e., lower gm, probably driven by leaf anatomy combined with higher biochemical limitations [38]. In general, assimilation capacity (Amass) is not only negatively associated with investment per unit area of light-capturing surface (i.e., LMA), but also negatively correlated with both leaf longevity [54] and stress tolerance [55]. Thus, higher LMA and lower Amass of HH compared with HHPP, and especially with PP, indicate that the leaves of the former are more durable and more stress tolerant. These results fit well with the leaf resurrection capacity of these species, which is higher in HH than in PP and intermediate in HHPP (own unpublished data).
We also experimentally compared the leaf dehydration tolerance among species. In the desiccation stage, all three species underwent dramatic water losses, especially at 10% RH desiccation (RWCdesic. = 3.5%, Figure S1b). The same stress tolerance test has been carried out on seven other resurrection ferns and seven resurrection angiosperms [45]. After identical desiccation treatments, their water content declines were less severe than those of our study species. In the recovery stage (24-h rehydration) of our experiment, the three species achieved good rehydration, although it was higher in PP than in HHPP and HH, regardless of the level of previous desiccation (Figure 3a). This result could indicate that leaves of HHPP and HH need more time to regain their turgor, which may be due to denser tissues and/or thicker cell walls [37]. We found no significant differences in the recovery of photosynthetic status among species or among desiccation levels, with an overall 76% Fv/Fm(recov.) for all species–desiccation combinations (Figure 3c). This high physiological recovery is similar to those of other resurrection ferns, which in turn are better than those of resurrection angiosperms [45]. High Fv/Fm(recov.) thus confirms the outstanding adaptation of the three species to tolerate extreme tissue dehydrations. These results and carbon assimilation rates in response to leaf water potentials (see above) indicate that, over a wide range of water statuses, the allopolyploid does not have a better photosynthetic performance than both diploid parents. In other words, HHPP showed no transgressive assimilation capacity. Similarly, leaf functional traits of several allopolyploid wood ferns (Dryopteris) were mostly intermediate between those of diploid parents [11]; however, these ferns are desiccation sensitive. A well studied model of plant resurrection is the hexaploid angiosperm Ramonda serbica and the related diploid R. nathaliae. As our study species, they both coexist and hybridize [56], and thus there may be competitive or reproductive exclusions [1] among them. Their recovery of Fv/Fm during leaf rehydration is high and similar between species, as in our desiccation experiment [36]. In addition, the diploid shows higher net carbon uptake, less sensitive to high temperatures, and other xeromorphic traits allowing it to occupy drier habitats compared to the hexaploid [36]. Thus, this polyploid did not display a better photosynthetic capacity in dry conditions, as HHPP compared with PP.
Leaf TEAC was very high in the three ferns studied compared to the few values available for other plant species, e.g., [57,58]. As with other resurrections plants, the three ferns are homoiochlorophyllous (own observations), i.e., retain chlorophylls and thylakoidal organization during the dry stage [59]. These chlorophylls will continue to absorb light after dehydration, and the energy not transferred to the electron transport chain will trigger the overproduction of ROS [60]. Consequently, these ferns were expected to have such a strong antioxidative response, which is an important photoprotection strategy in desiccation-tolerant plants [34,59]. Consistent with this, PP, which has a lower resurrection capacity than HHPP and HH, also showed a lower TEAC. Reduced investment in secondary metabolites with antioxidant capacity allows more resources to be devoted to photobiochemistry (Rubisco and electron transport chain) [55,61], which can contribute to the higher photosynthetic performance of PP.
Foliar elemental composition was also very different between the diploids and again intermediate in HHPP for most of the elements. The higher Ntotal in PP may also explain its higher photosynthetic capacity, since most of the nitrogen is accumulated in the chloroplast (up to 75%), with Rubisco accounting for ca. 50% of the photosynthetic N [61,62]. Contents of other macronutrients (Ca, K, Mg, P, and S) were also higher in PP than in HH, which is explained by the fact that PP grows on soils with presumably higher nutrient availability than the rock crevices where HH settles. According to the biochemical niche hypothesis, the elementome of a species defines its biochemical niche [63], which is expected to be more different between phylogenetically distant species and between sympatric species to reduce competitive pressure [64]. Our results indicate that the three species studied, despite their phylogenetic proximity, occupy distinct biogeochemical niches, intermediate in HHPP, which allows them to coexist. Higher C and lower N and P concentrations, together with slower growth rate, again indicate that HH has a more stress-tolerant strategy than HHPP and PP [63].
CW compounds are major components of leaf dry mass, especially in plants with high LMA [55]. The study species, in addition to high LMA, are expected to have very thick CW, as this is common in other cheilanthoid resurrection ferns [39]. Compared with PP, HH had more CCW, which may be due to a higher investment in hemicelluloses and pectins, rich in C, and lacking in N. Both compounds lead to elastic and flexible CW to sustain cell integrity under extreme tissue desiccation events [37]. Other protective mechanisms, related to the higher resurrection capacity and tolerance to stress of HH, such as the accumulation of sugars and the production of antioxidant metabolites and protective pigments, may explain its higher C/Ntotal [65]. Related to this, the abundant reddish hairs of HH lamina protect the homoiochlorophyllous chloroplasts from excess light during dehydration [36,59], as leaves expose their underside when curling (Figure 1).

5. Conclusions

The current study found that sympatric populations of two diploid resurrection ferns, and their allotetraploid derivative have great ecophysiological differentiation, which promotes their coexistence by niche divergence. All three species can recover photosynthetic function (Fv/Fm(recov.)) after extreme desiccation events. However, one of the diploids (HH) has more ‘conservative’ leaves [66], with much higher investment per unit area of light-capturing surface (LMA), lower carbon assimilation rate per unit mass (Amass), higher antioxidant capacity (TEAC), higher C content (Ctotal and CCW), and lower contents of N, P, and other macronutrients. This combination of leaf traits allows it to live in microhabitats with less availability of water and nutrients (rock crevices) and to have a greater capacity for resurrection. The other diploid (PP) shows more ‘acquisitive’ leaves [66], with enhanced assimilation capacity and lower ability to cope with oxidative stress. These leaf traits allow it to occupy more humid and nutrient-rich microhabitats (shallow soils). Trait divergence and the resulting niche segregation between both diploid parents leave a large free adaptive space that has been filled by the allotetraploid (HHPP). Its intermediate abiotic niche is well explained by a combination of leaf traits driving Amass and dehydration tolerance in an intermediate manner between those of the parent diploids. Our findings suggest that these different ecophysiological traits drive niche differences, reducing interspecific competition and thus increase the capacity of each species to recover from low density, which is critical for stable coexistence [67]. Our study also shows how useful diploid–polyploid contact zones are for understanding the evolutionary success of whole genome duplication.

Supplementary Materials

The following supporting information can be downloaded at: https://www.mdpi.com/article/10.3390/plants12071529/s1, Data S1: Raw data in xlsx format; Table S1: ANOVAs for testing differences in relative water content (RWC) and maximum photochemical efficiency of PSII (Fv/Fm) among the three Oesporangium species after three desiccation levels (80%, 50%, and 10% relative humidities); Figure S1: Mean values (±SE) of RWCdesic. and Fv/Fm(desic.) for the three Oesporangium species after three desiccation levels (80%, 50%, and 10% relative humidities); Table S2: Mean values (±SE) of foliar elemental contents for the three Oesporangium species.

Author Contributions

Conceptualization, methodology and investigation, L.G.Q., I.A., M.J.C.-M. and J.G.; data curation, L.G.Q., J.P.-P., M.J.C.-M. and J.G.; writing—original draft preparation, L.G.Q. and J.G.; writing—review and editing, I.A., M.J.C.-M. and J.P.-P.; visualization, L.G.Q. and J.P.-P.; supervision and project administration, J.G.; funding acquisition, L.G.Q., I.A. and J.G. All authors have read and agreed to the published version of the manuscript.

Funding

This research was funded by MCIN/AEI/10.13039/501100011033, national call ‘Generación de Conocimiento’ 2019–2020, project number PID2019-107434GA-I00, and by European Union ‘NextGenerationEU/PRTR’.

Data Availability Statement

The raw data are included in the Supplementary Materials.

Acknowledgments

The authors wish to publicly thank MCIN/AEI for the research project PID2019-107434GA-I00, and Dirección General de Biodiversidad y Recursos Naturales de Madrid and Confederación Hidrográfica del Tajo for the permits and facilities for the field work. The latter entity provided the climatic data from the Picadas dam weather station. The authors are also grateful to Carlos Díaz and Sara San José for technical assistance. M.J.C-M acknowledges her postdoctoral contract RYC2020-029602-I, funded by MCIN/AEI/10.13039/501100011033 and by “ESF Investing in your future” and UIB. Two anonymous reviewers provided useful suggestions.

Conflicts of Interest

The authors declare no conflict of interest. The funders had no role in the design of the study, in the collection, analyses, or interpretation of data, in the writing of the manuscript, or in the decision to publish the results.

References

  1. Levin, D.A. Minority cytotype exclusion in local plant populations. Taxon 1975, 24, 35–43. [Google Scholar] [CrossRef]
  2. Wood, T.E.; Takebayashi, N.; Barker, M.S.; Mayrose, I.; Greenspoon, P.B.; Rieseberg, L. The frequency of polyploid speciation in vascular plants. Proc. Natl. Acad. Sci. USA 2009, 106, 13875–13979. [Google Scholar] [CrossRef] [PubMed] [Green Version]
  3. Husband, B.C.; Baldwin, S.J.; Suda, J. The incidence of polyploidy in natural plant populations: Major patterns and evolutionary processes. In Plant Genome Diversity; Greilhuber, J., Dolezel, J., Wendel, J.F., Eds.; Springer: Vienna, Austria, 2013; Volume 2, pp. 255–276. [Google Scholar] [CrossRef]
  4. Felber, F. Establishment of a tetraploid cytotype in a diploid population: Effect of relative fitness of the cytotypes. J. Evol. Biol. 1991, 4, 195–207. [Google Scholar] [CrossRef] [Green Version]
  5. Fowler, N.L.; Levin, D.A. Critical factors in the establishment of allopolyploids. Am. J. Bot. 2016, 103, 1236–1251. [Google Scholar] [CrossRef] [PubMed] [Green Version]
  6. Rodríguez, D.J. A model for the establishment of polyploidy in plants. Am. Nat. 1996, 147, 33–46. [Google Scholar] [CrossRef]
  7. Ding, M.; Chen, Z.J. Epigenetic perspectives on the evolution and domestication of polyploid plant and crops. Curr. Opin. Plant Biol. 2018, 42, 37–48. [Google Scholar] [CrossRef]
  8. Akiyama, R.; Sun, J.; Hatakeyama, M.; Lischer, H.E.L.; Briskine, R.; Hay, A.; Shimizu Inatsugi, R. Fine-scale empirical data on niche divergence and homeolog expression patterns in an allopolyploid and its diploid progenitor species. New Phytol. 2021, 229, 3587–3601. [Google Scholar] [CrossRef]
  9. Rünk, K.; Moora, M.; Zobel, M. Do different competitive abilities of three fern species explain their different regional abundances? J. Veg. Sci. 2004, 15, 351–356. [Google Scholar] [CrossRef]
  10. Rieseberg, L.H.; Ellstrand, N.C. What can molecular and morphological markers tell us about plant hybridization? Crit. Rev. Pl. Sci. 1993, 12, 213–241. [Google Scholar] [CrossRef]
  11. Sessa, E.B.; Givnish, T.J. Leaf form and photosynthetic physiology of Dryopteris species distributed along light gradients in eastern North America. Funct. Ecol. 2014, 28, 108–123. [Google Scholar] [CrossRef]
  12. Buggs, R.J.A.; Wendel, J.F.; Doyle, J.J.; Soltis, D.E.; Soltis, P.S.; Coate, J.E. The legacy of diploid progenitors in allopolyploid gene expression patterns. Philos. Trans. R. Soc. B 2014, 369, 20130354. [Google Scholar] [CrossRef] [PubMed] [Green Version]
  13. Madlung, A. Polyploidy and its effect on evolutionary success: Old questions revisited with new tools. Heredity 2013, 110, 99–104. [Google Scholar] [CrossRef] [PubMed] [Green Version]
  14. Martínez, L.M.; Fernández-Ocaña, A.; Rey, P.J.; Salido, T.; Amil-Ruiz, F.; Manzaneda, A.J. Variation in functional responses to water stress and differentiation between natural allopolyploid populations in the Brachypodium distachyon species complex. Ann. Bot. 2018, 121, 1369–1382. [Google Scholar] [CrossRef] [Green Version]
  15. Ehrendorfer, F. Polyploidy and distribution. In Polyploidy; Lewis, L.H., Ed.; Plenum Press: New York, NY, USA, 1980; Volume 13, pp. 45–60. [Google Scholar] [CrossRef]
  16. Glennon, K.L.; Ritchie, M.E.; Segraves, K.A. Evidence for shared broad-scale climatic niches of diploid and polyploid plants. Ecol. Lett. 2014, 17, 574–582. [Google Scholar] [CrossRef]
  17. Marchant, B.D.; Soltis, D.E.; Soltis, P.S. Patterns of abiotic niche shifts in allopolyploids relative to their progenitors. New Phytol. 2016, 212, 708–718. [Google Scholar] [CrossRef] [PubMed] [Green Version]
  18. Baniaga, A.E.; Marx, H.E.; Arrigo, N.; Barker, M.S. Polyploid plants have faster rates of multivariate niche differentiation than their diploid relatives. Ecol. Lett. 2020, 23, 68–78. [Google Scholar] [CrossRef]
  19. Wang, D.; Xu, X.; Zhang, H.; Xi, Z.; Abbott, R.J.; Fu, J.; Liu, J. Abiotic niche divergence of hybrid species from their progenitors. Am. Nat. 2022, 200, 635–645. [Google Scholar] [CrossRef]
  20. Li, W.L.; Berlyn, G.P.; Ashton, P.M.S. Polyploids and their structural and physiological characteristics relative to water deficit in Betula papyrifera (Betulaceae). Am. J. Bot. 1996, 83, 15–20. [Google Scholar] [CrossRef]
  21. Manzaneda, A.J.; Rey, P.J.; Anderson, J.T.; Raskin, E.; Weiss-Lehman, C.; Mitchell-Olds, T. Natural variation, differentiation, and genetic trade-offs of ecophysiological traits in response to water limitation in Brachypodium distachyon and its descendent allotetraploid B. hybridum (Poaceae). Evolution 2015, 69, 2689–2704. [Google Scholar] [CrossRef] [Green Version]
  22. Bretagnolle, F.; Thompson, J.; Lumaret, R. The influence of seed size variation on seed germination and seedling vigour in diploid and tetraploid Dactylis glomerata L. Ann. Bot. 1995, 76, 607–615. [Google Scholar] [CrossRef]
  23. Te Beest, M.; Le Roux, J.J.; Richardson, D.M.; Brysting, A.K.; Suda, J.; Kubesová, M.; Pysek, P. The more the better? The role of polyploidy in facilitating plant invasions. Ann. Bot. 2012, 109, 19–45. [Google Scholar] [CrossRef] [PubMed] [Green Version]
  24. Tossi, V.E.; Martínez Tosar, L.J.; Laino, L.E.; Iannicelli, J.; Regalado, J.J.; Escandón, A.S.; Baroli, I.; Causin, H.F.; Pitta-Álvarez, S.I. Impact of polyploidy on plant tolerance to abiotic and biotic stresses. Front. Plant Sci. 2022, 13, 869423. [Google Scholar] [CrossRef] [PubMed]
  25. Solhaug, E.M.; Ihinger, J.; Jost, M.; Gamboa, V.; Marchant, B.; Bradford, D.; Doerge, R.W.; Tyagi, A.; Replogle, A.; Madlung, A. Environmental regulation of heterosis in the allopolyploid. Arab. Suec. Plant Physiol. 2016, 170, 2251–2263. [Google Scholar] [CrossRef] [PubMed] [Green Version]
  26. Soltis, P.S.; Liu, X.; Marchant, D.B.; Visger, C.J.; Soltis, D.E. Polyploidy and novelty: Gottlieb’s legacy. Phil. Trans. R. Soc. B 2014, 369, 20130351. [Google Scholar] [CrossRef] [Green Version]
  27. Hao, G.Y.; Lucero, M.E.; Sanderson, S.C.; Zacharias, E.H.; Holbrook, N.M. Polyploidy enhances the occupation of heterogeneous environments through hydraulic related trade-offs in Atriplex canescens (Chenopodiaceae). New Phytol. 2013, 197, 970–978. [Google Scholar] [CrossRef]
  28. Li, W.D.; Biswas, D.K.; Xu, H.; Xu, C.Q.; Wang, X.Z.; Liu, J.K.; Jiang, G.M. Photosynthetic responses to chromosome doubling in relation to leaf anatomy in Lonicera japonica subjected to water stress. Funct. Plant Biol. 2009, 36, 783–792. [Google Scholar] [CrossRef]
  29. Gago, J.; Douthe, C.; Florez-Sarasa, I.; Escalona, J.M.; Galmes, J.; Fernie, A.R.; Flexas, J.; Medrano, H. Opportunities for improving leaf water use efficiency under climate change conditions. Plant Sci. 2014, 226, 108–119. [Google Scholar] [CrossRef]
  30. Flexas, J.; Barbour, M.M.; Brendel, O.; Cabrera, H.M.; Carriquí, M.; Díaz-Espejo, A.; Drouthe, C.; Dreyerc, E.; Ferrio, J.P.; Gago, J.; et al. Mesophyll diffusion conductance to CO2: An unappreciated central player in photosynthesis. Plant Sci. 2012, 193, 70–84. [Google Scholar] [CrossRef] [PubMed]
  31. Madani, H.; Escrich, A.; Hosseini, B.; Sanchez-Muñoz, R.; Khojasteh, A.; Palazon, J. Effect of polyploidy induction on natural metabolite production in medicinal plants. Biomolecules 2021, 11, 899. [Google Scholar] [CrossRef]
  32. Lavania, U.C.; Srivastava, S.; Lavania, S.; Basu, S.; Misra, N.K.; Mukai, Y. Autopolyploidy differentially influences body size in plants, but facilitates enhanced accumulation of secondary metabolites, causing increased cytosine methylation. Plant J. 2012, 71, 539–549. [Google Scholar] [CrossRef]
  33. Rodríguez, M.C.S.; Edsgärd, D.; Sarfraz, H.S.; Alquezar, D.; Rasmussen, M.; Gilbert, T.; Nielsen, B.H.; Bartels, D.; Mundy, J. Transcriptomes of the desiccation tolerant resurrection plant Craterostigma plantagineum. Plant J. 2010, 63, 212–228. [Google Scholar] [CrossRef] [PubMed]
  34. Gechev, T.; Lyall, R.; Petrov, V.; Bartels, D. Systems biology of resurrection plants. Cell. Mol. Life Sci. 2021, 78, 6365–6394. [Google Scholar] [CrossRef]
  35. Gaff, D.F.; Oliver, M. The evolution of desiccation tolerance in angiosperm plants: A rare yet common phenomenon. Funct. Plant Biol. 2013, 40, 315–328. [Google Scholar] [CrossRef] [PubMed]
  36. Rakić, T.; Gajić, G.; Lazarević, M.; Stevanović, B. Effects of different light intensities, CO2 concentrations, temperatures and drought stress on photosynthetic activity in two paleoendemic resurrection plant species Ramonda serbica and R. nathaliae. Environ. Exp. Bot. 2015, 109, 63–72. [Google Scholar] [CrossRef]
  37. Chen, P.; Jung, N.U.; Giarola, V.; Bartels, D. The dynamic responses of cell walls in resurrection plants during dehydration and rehydration. Front. Plant Sci. 2020, 10, 1698. [Google Scholar] [CrossRef] [PubMed] [Green Version]
  38. Gago, J.; Carriquí, M.; Nadal, M.; Clemente-Moreno, M.J.; Coopman, R.E.; Fernie, A.R.; Flexas, J. Photosynthesis optimized across land plant phylogeny. Trends Plant Sci. 2019, 24, 947–958. [Google Scholar] [CrossRef]
  39. Nadal, M.; Perera-Castro, A.V.; Gulias, J.; Farrant, J.M.; Flexas, J. Resurrection plants optimize photosynthesis despite very thick cell walls by means of chloroplast distribution. J. Exp. Bot. 2021, 72, 2600–2610. [Google Scholar] [CrossRef]
  40. Pangua, E.; Pajarón, S.; Quintanilla, L.G. Fitness of an allopolyploid rupicolous fern compared with its diploid progenitors: From sporogenesis to sporophyte formation. Amer. J. Bot. 2019, 106, 984–995. [Google Scholar] [CrossRef]
  41. Jermy, A.C.; Paul, A.M. Cheilanthes Swartz. In Flora Europaea, 2nd ed.; Tutin, T.G., Burges, N.A., Chater, A.O., Eds.; University Press: Cambridge, UK, 1993; Volume 1, p. 12. [Google Scholar]
  42. Bañares, Á.; Blanca, G.; Güemes, J.; Moreno, J.C.; Ortiz, S. Atlas y Libro Rojo de la Flora Vascular Amenazada de España; Dirección General de Conservación de la Naturaleza: Madrid, Spain, 2008; 1069p. [Google Scholar]
  43. Abramoff, M.D.; Magelhaes, P.J.; Ram, S.J. 2004. Image processing with ImageJ. Biophotonics Int. 2004, 11, 36–42. [Google Scholar]
  44. Maxwell, K.; Johnson, G.N. Chlorophyll fluorescence—A practical guide. J. Exp. Bot. 2000, 51, 659–668. [Google Scholar] [CrossRef]
  45. López-Pozo, M.; Flexas, J.; Gulías, J.; Carriquí, M.; Nadal, M.; Perera-Castro, A.V.; Clemente-Moreno, M.J.; Gago, J.; Núñez-Olivera, E.; Martínez-Abaigar, J.; et al. A field portable method for the semi-quantitative estimation of dehydration tolerance of photosynthetic tissues across distantly related land plants. Physiol. Plant. 2019, 167, 540–555. [Google Scholar] [CrossRef] [PubMed] [Green Version]
  46. Teow, C.C.; Truong, V.-D.; McFeeters, R.F.; Thompson, R.L.; Pecota, K.V.; Yencho, G.C. Antioxidant activities, phenolic and β-carotene contents of sweet potato genotypes with varying flesh colours. Food Chem. 2007, 103, 829–838. [Google Scholar] [CrossRef]
  47. R Core Team. R: A Language and Environment for Statistical Computing; R Foundation for Statistical Computing: Vienna, Austria, 2022; Available online: https://www.R-project.org/ (accessed on 2 November 2022).
  48. Tosens, T.; Nishida, K.; Gago, J.; Coopman, R.E.; Cabrera, H.M.; Carriquí, M.; Laanisto, L.; Morales, L.; Nadal, M.; Rojas, R.; et al. The photosynthetic capacity in 35 ferns and fern allies: Mesophyll CO2 diffusion as a key trait. New Phytol. 2016, 209, 1576–1590. [Google Scholar] [CrossRef] [PubMed]
  49. Vasheka, O.; Gratani, L.; Puglielli, G. Frond physiological and structural plasticity of two Asplenium (Aspleniaceae) species coexisting in sun and shade conditions. Plant Ecol. Evol. 2019, 152, 426–436. [Google Scholar] [CrossRef]
  50. Nadal, M.; Brodribb, T.J.; Fernández-Marín, B.; García-Plazaola, J.I.; Arzac, M.I.; López-Pozo, M.; Perera-Castro, A.; Gulías, J.; Flexas, J.; Farrant, J.M. Differences in biochemical, gas exchange and hydraulic response to water stress in desiccation tolerant and sensitive fronds of the fern Anemia Caffrorum. New Phytol. 2021, 231, 1415–1430. [Google Scholar] [CrossRef]
  51. Gratani, L.; Crescente, M.F.; Rossi, G. Photosynthetic performance and water use efficiency of the fern Cheilanthes persica. Photosynthetica 1998, 35, 507–516. [Google Scholar] [CrossRef]
  52. Brodribb, T.J.; McAdam, S.A. Passive origins of stomatal control in vascular plants. Science 2011, 331, 582–585. [Google Scholar] [CrossRef]
  53. Baer, A.; Wheeler, J.K.; Pittermann, J. Not dead yet: The seasonal water relations of two perennial ferns during California’s exceptional drought. New Phytol. 2016, 210, 122–132. [Google Scholar] [CrossRef] [Green Version]
  54. Wright, I.J.; Reich, P.B.; Westoby, M.; Ackerly, D.D.; Baruch, Z.; Bongers, F.; Cavender-Bares, J.; Chapin, T.; Cornelissen, J.H.C.; Diemer, M.; et al. The worldwide leaf economics spectrum. Nature 2004, 428, 821–827. [Google Scholar] [CrossRef]
  55. Onoda, Y.; Wright, I.; Evans, J.; Hikosaka, K.; Kitajima, K.; Niinemets, Ü.; Poorter, H.; Tosens, T.; Westoby, M. Physiological and structural tradeoffs underlying the leaf economics spectrum. New Phytol. 2017, 214, 1447–1463. [Google Scholar] [CrossRef] [Green Version]
  56. Siljak-Yakovlev, S.; Stevanovic, V.; Tomasevic, M.; Brown, S.C.; Stevanovic, B. Genome size variation and polyploidy in the resurrection plant genus Ramonda: Cytogeography of living fossils. Environ. Exp. Bot. 2008, 62, 101–112. [Google Scholar] [CrossRef]
  57. Clemente-Moreno, M.J.; Omranian, N.; Sáez, P.; Figueroa, C.M.; Del-Saz, N.; Elso, M.; Poblete, L.; Orf, I.; Cuadros-Inostroza, A.; Cavieres, L.; et al. Low temperature tolerance of the Antarctic species Deschampsia antarctica: A complex metabolic response associated to nutrient remobilization. Plant Cell Environ. 2020, 43, 1376–1393. [Google Scholar] [CrossRef] [PubMed]
  58. Clemente-Moreno, M.J.; Omranian, N.; Sáez, P.; Figueroa, C.M.; Del-Saz, N.; Elso, M.; Poblete, L.; Orf, I.; Cuadros-Inostroza, A.; Cavieres, L.; et al. Cytochrome respiration pathway and sulphur metabolism sustain stress tolerance to low temperature in the Antarctic species Colobanthus quitensis. New Phytol. 2020, 225, 754–768. [Google Scholar] [CrossRef] [PubMed]
  59. Fernández-Marín, B.; Holzinger, A.; García-Plazaola, J.I. Photosynthetic strategies of desiccation-tolerant organisms. In Handbook of photosynthesis, 3rd ed.; Pessarakli, M., Ed.; CRC Press: Boca Raton, FL, USA, 2016; pp. 663–681. [Google Scholar]
  60. Farrant, J. Mechanisms of desiccation tolerance in angiosperm resurrection plants. In Plant Desiccation Tolerance; Jenks, M.A., Wood, A.J., Eds.; Blackwell Publishing: Oxford, UK, 2007; pp. 51–90. [Google Scholar]
  61. Onoda, Y.; Hikosaka, K.; Hirose, T. Allocation of nitrogen to cell walls decreases photosynthetic nitrogen-use efficiency. Funct. Ecol. 2004, 18, 419–425. [Google Scholar] [CrossRef]
  62. Feng, Y.-L.; Lei, Y.-B.; Wang, R.-F.; Callaway, R.M.; Valiente-Banuet, A.; Inderjit; Li, Y.-P.; Zheng, Y.-L. Evolutionary tradeoffs for nitrogen allocation to photosynthesis versus cell walls in an invasive plant. Proc. Natl. Acad. Sci. USA. 2009, 106, 1853–1856. [Google Scholar] [CrossRef] [PubMed] [Green Version]
  63. Peñuelas, J.; Sardans, J.; Ogaya, R.; Estiarte, M. Nutrient stoichiometric relations and biogeochemical niche in coexisting plant species: Effect of simulated climate change. Pol. J. Ecol. 2008, 56, 613–622. [Google Scholar]
  64. Sardans, J.; Vallicrosa, H.; Zuccarini, P.; Farré-Armengol, G.; Fernández-Martínez, M.; Peguero, G.; Gargallo-Garriga, A.; Ciais, P.; Janssens, I.A.; Obersteiner, M.; et al. Empirical support for the biogeochemical niche hypothesis in forest trees. Nat. Ecol. Evol. 2021, 5, 184–194. [Google Scholar] [CrossRef]
  65. Oliver, J.M.; Farrant, M.J.; Hilhorst, W.M.H.; Mundree, S.; Williams, B.; Bewley, D.J. Desiccation tolerance: Avoiding cellular damage during drying and rehydration. Annu. Rev. Plant Biol. 2020, 71, 435–460. [Google Scholar] [CrossRef] [PubMed] [Green Version]
  66. Díaz, S.; Kattge, J.; Cornelissen, J.H.C.; Wright, I.J.; Lavorel, S.; Dray, S.; Reu, B.; Kleyer, M.; Wirth, C.; Prentice, I.C.; et al. The global spectrum of plant form and function. Nature 2016, 529, 167–171. [Google Scholar] [CrossRef]
  67. Van Dyke, M.N.; Levine, J.M.; Kraft, N.J.B. Small rainfall changes drive substantial changes in plant coexistence. Nature 2022, 611, 507–511. [Google Scholar] [CrossRef]
Figure 1. Leaves of the studied Oesporangium species: (a) O. hispanicum (HH), well hydrated; (b) HH, completely dry; (c) O. tinaei (HHPP), well hydrated; (d) O. pteridioides (PP), well hydrated.
Plants 12 01529 g001
Figure 2. Variation of Amass among the three Oesporangium species while controlling for three covariates: (a) Ψmd; (b) gs; (c) ΦPSII. In the tables below each figure, different letters indicate significantly different means (p < 0.05, Bonferroni tests). n = 9−14 individuals per species. See Table 1 for ANCOVA results.
Plants 12 01529 g002
Figure 3. Mean values (± SE) of RWCrecov. and Fv/Fm(recov.) for the three Oesporangium species after three desiccation levels (80%, 50%, and 10% relative humidities) followed by rehydration (recovery): (a) RWCrecov., comparison of species; (b) RWCrecov., comparison of desiccation levels; (c) Fv/Fm(recov.), comparison of species; (d) Fv/Fm(recov.), comparison of desiccation levels. Different letters indicate significantly different means (p < 0.05, Tukey tests). n = 17 individuals per species. See Table 2 for ANOVA results.
Plants 12 01529 g003
Figure 4. Principal component analysis (PCA) biplot of the foliar elemental contents (variables) in the individuals (samples) of the three Oeosporangium species. PC = principal component. n = 6−7 individuals per species.
Plants 12 01529 g004
Table 1. ANCOVAs for testing differences in mass-based net photosynthesis (Amass) among the three Oesporangium species. Three covariates were included in separate models: leaf water potential at mid-day (Ψmd), stomatal conductance (gs), and quantum yield of the photosystem II (ΦPSII). The species × covariate interaction was not significant (p > 0.05) in any of the models, so they were repeated without this interaction. Significant effects (p < 0.05) are indicated in bold. Sample size (n) was 9, 10, and 14 individuals of HH, HHPP, and PP, respectively.
Source of Variationdf 1SSFp
Species20.0089.910.0005
Ψmd10.00819.800.0001
Residual290.011
Species20.0058.100.0020
gs10.00929.5<0.0001
Residual280.009
Species20.0023.260.0530
ΦPSII10.00821.44<0.0001
Residual290.011
1 df = degrees of freedom; SS = sum of squares.
Table 2. ANOVAs for testing differences in relative water content (RWC) and maximum photochemical efficiency of PSII (Fv/Fm) among the three Oesporangium species after three desiccation levels (80%, 50%, and 10% relative humidities) followed by rehydration (recovery). Fv/Fm(recov.) is the ratio (Fv/Fm after recovery): (initial Fv/Fm). Significant differences (p < 0.05) are indicated in bold. n = 17 individuals per species.
Variable Source of Variation df 1 SS Fp
RWCrecov.Species21289.78.130.0011
Desiccation216.80.110.8997
Sp. × Desic.489.00.280.8889
Residual413252.8
Fv/Fm(recov.)Species2228.31.640.2075
Desiccation2175.41.260.2956
Sp. × Desic. 4307.91.100.3683
Residual392718.5
1 df = degrees of freedom; SS = sum of squares.
Table 3. Mean values (±SE) of total and cell wall (CW) carbon, nitrogen, and carbon/nitrogen ratio in leaves of the three Oesporangium species. Units of Ctotal and Ntotal are g/100g of dry weight (DW), whereas CCW and NCW are in g/100g of alcohol insoluble residue (AIR). Different letters indicate significantly different means (p < 0.05, Tukey tests). n = 6−7 individuals per species.
Species
Variable HHHHPPPP
Ctotal 51.4 ± 0.3 a 47.9 ± 0.2 b 48.7 ± 0.2 b
Ntotal 1.77 ± 0.06 a 1.86 ± 0.07 a 2.27 ± 0.10 b
C/Ntotal 29.2 ± 1.0 a 26.0 ± 1.1 a 21.7 ± 0.9 b
CCW 45.6 ± 0.2 a 44.6 ± 0.6 a,b 43.3 ± 0.4 b
NCW 2.83 ± 0.16 a 3.12 ± 0.22 a 2.80 ± 0.28 a
C/NCW 16.4 ± 1.1 a 14.7 ± 1.0 a 16.2 ± 1.4 a
Disclaimer/Publisher’s Note: The statements, opinions and data contained in all publications are solely those of the individual author(s) and contributor(s) and not of MDPI and/or the editor(s). MDPI and/or the editor(s) disclaim responsibility for any injury to people or property resulting from any ideas, methods, instructions or products referred to in the content.

