Article

Effects of Different Water and Nitrogen Supply Modes on Peanut Growth and Water and Nitrogen Use Efficiency under Mulched Drip Irrigation in Xinjiang

1
College of Water Conservancy Engineering, Tianjin Agricultural University, Tianjin 300392, China
2
Institute of Economic Crops, Xinjiang Academy of Agricultural Sciences, Urumqi 830091, China
*
Authors to whom correspondence should be addressed.
Plants 2023, 12(19), 3368; https://doi.org/10.3390/plants12193368
Submission received: 24 August 2023 / Revised: 18 September 2023 / Accepted: 21 September 2023 / Published: 24 September 2023
(This article belongs to the Special Issue Strategies to Improve Water-Use Efficiency in Plant Production)

Abstract

:
The optimization of irrigation and fertilization indexes for peanuts with drip irrigation is urgently needed in Xinjiang. A field experiment was conducted during the 2021 peanut growing season at Urumqi, Xinjiang, in Northwestern China, to evaluate the effects of different water and nitrogen treatments on the growth, yield, and water and nitrogen utilization of peanuts. In field experiments, we set up three irrigation levels (irrigation water quotas of 22.5, 30, and 37.5 mm, respectively, for W1, W2, and W3), two nitrogen application levels (77.5 and 110 kg·ha−1, recorded as N1 and N2), and a control treatment (W2N0) that did not include the application of nitrogen. The results showed that nitrogen application enhanced the growth, physiological indexes, yield, and water use efficiency of the W1, W2, and W3 treatments when the irrigation volume remained the same. In comparison with no nitrogen application (W2N0), the peanut growth, physiological indexes, yield, and water use efficiency improved with increasing irrigation amounts in the N1 and N2 treatments. With an increase in the irrigation volume, the water use efficiency grew; the W3N2 treatment had the highest water use efficiency, which was 1.32 kg·m−3. The total water consumption and reproductive-stage water consumption of the peanuts in all treatments increased with the irrigation volume, and a high yield was achieved at 402.57 mm, which was 5.2974 Mg·ha−1. In the W1, W2, and W3 treatments, the nitrogen partial factor productivity significantly decreased as the nitrogen application increased, with the nitrogen partial factor productivity in the W3N1 treatment being the highest, at 60.61 kg·kg−1. A comprehensive evaluation based on principal component analysis assigned W3N2 the higher score. These findings suggest that irrigation water quotas of 37.5 mm should be coupled with 110 kg·ha−1 nitrogen applications for peanuts using drip irrigation in mulch film in Xinjiang.

1. Introduction

In China, peanuts (Arachis hypogaea L.) represent an important cash crop that occupies a key position in the country’s economy, and the development of peanut production contributes to reducing insufficient edible oils and fats [1]. In 2021, the national peanut planting area was 4,805,300 hectares, and the total peanut output was 18,307,800 tons. This was with an average yield of 3809.93 kg per hectare, with Xinjiang ranking second in the country with 4886.38 kg per hectare [2]. Xinjiang has abundant light and heat resources, significant temperature differences between day and night, and a dry climate, providing a better natural ecological environment for high-quality and high-yield peanuts. Regarding pests and diseases, Aspergillus flavus is the least common example that threatens the quality of peanut products [3]. As a result of its arid climate and limited irrigation resources, Xinjiang is an atypical irrigation area with significant supply–demand contradictions, and the lack of irrigation resources has restricted local agriculture development [4]. An adequate fertilizer dosage can contribute to high yields, promote the accumulation of dry matter and nutrients in crops, and affect the accumulation and translocation of dry matter. Water and fertilizer are indispensable factors in crop growth [5]. Drip irrigation and water–fertilizer integration technology represent one of the most efficient water-saving measures currently available [6]. Drip irrigation–fertilization technology under membrane conditions can provide precision irrigation and fertilization, significantly increasing the efficiency of water and fertilizer utilization and improving crop yields and quality by leveraging the synergistic interaction between them. To achieve sustainable agriculture goals, it is important to optimize the synergistic effects of irrigation and nitrogen fertilization.
Since 1980, the application of nitrogen fertilizer in China has increased dramatically, and the proportion of nitrogen input has reached a level that reduces crop yield returns [7]. Excessive N applications tend to lead to an imbalance in the root–crown ratio of the crop and a significant reduction in indicators such as the yield and nitrogen fertilizer use efficiency [8]. Previous studies have shown that appropriate nitrogen applications can significantly improve photosynthesis, water and nitrogen use efficiency, and crop yields [9]. Peanuts are usually grown in the arid and semi-arid regions of Xinjiang. Despite peanuts being drought-resistant, the water demand during their growth and development stages limits peanut yields in this region. Severe drought stress slows crop growth, reduces dry matter accumulation, leads to leaf stomata closure, increases resistance to CO2 diffusion within the mesophyll cell, inactivates enzyme activities, reduces photosynthesis and, ultimately, decreases yields [10,11]. However, a proper water supply not only enhances photosynthesis but also promotes the conversion of “sources” to “sinks” and improves nitrogen fertilizer efficiency [12]. Water and fertilizer have a synergistic effect, and appropriate irrigation and fertilization patterns can improve crop yields [13,14]. It was found that the highest yield and water use efficiency in tomatoes can be obtained through saving 25% water and 25% fertilizer via the regulation effect of drip fertigation [15]. Another study found that the synergistic effect of water and nitrogen positively impacts winter wheat growth, water use efficiency (WUE), and yield [16]. Using water and nitrogen two-factor split-plot experiments, previous studies have shown that water and nitrogen have significant interactions with peanut yield, water consumption, and water and nitrogen use efficiency (WUE and NUE) [17]. Scholars have reached similar conclusions about crops such as maize [18], tomatoes [19], and rice [20]. Therefore, understanding the water–nitrogen coupling relationship is the key to producing high-yield and high-quality peanuts, while maintaining an efficient use of water and fertilizer resources. The research on water and nitrogen regulation regarding peanuts is concentrated in Northeastern and North China. The peanut industry in the Xinjiang region is just getting started, with poor soil and the demand for water and nitrogen fertilizer exceeding the actual production. There are few reports on water and nitrogen regulation in peanuts under drip irrigation in Xinjiang. Further research is needed to elucidate the response mechanisms of peanuts to water and nitrogen regulation. Through field experiments combined with theoretical analysis, the authors of this paper focused on the effects of different water and nitrogen regulation values on the growth, yield, and water and nitrogen use efficiency of peanuts under drip irrigation grown in a membrane in Xinjiang. We describe and quantify their responses to these different factors. Based on a comprehensive evaluation, the optimal water and nitrogen regulation indexes were determined to provide a theoretical basis and technical support for local, high-quality peanut production under drip irrigation under membrane conditions.

2. Results

2.1. Effects of Water and Nitrogen Regulation on Growth and Physiological Indexes of Peanuts under Mulched Drip Irrigation

Table 1 shows the effects of different water and nitrogen treatments on peanut growth indexes in the experiment (the main stem height, first branch length, branch number, shoot dry mass, and leaf area index (LAI)). The results show that the effect of the irrigation volume (W) on the growth index factor alone at the flowering–pegging, pod-setting, and pod-filling stages was extremely significant (p ≤ 0.01). The nitrogen (N) applications had highly significant (p ≤ 0.01) one-way effects on the main stem height, first branch length, shoot dry mass, and LAI at the flowering–pegging, pod-setting, and pod-filling stages, and had a one-way effect (p ≤ 0.05) on the number of branches at the needle stage of flowering–pegging. The interaction between the two (W × N) had a very significant effect on the main stem height at the pod-setting and pod-filling stages and on the shoot dry mass at the flowering–pegging, pod-setting, and pod-filling stages (p ≤ 0.01). It also had a significant effect on the branch number at the pod-filling stage, the first branch length at the pod-setting stage, and the LAI at the flowering–pegging, pod-setting, and pod-filling stages (p ≤ 0.05).
The peanut growth indexes under different water and nitrogen treatments showed different growth magnitudes with the advancement in fertility. This rapidly accelerated from the seedling stage to the flowering–pegging stage and then slowed down gradually from the flowering–pegging stage to the pod-filling stage. According to the analysis, the peanut main stem height increased with better irrigation water. Compared with other water treatments, the peanut stem height in the W3 treatment (irrigation water quota of 37.5 mm) was substantially higher. Compared with W1N1 (irrigation water quota of 22.5 mm, nitrogen application rate of 77.5 kg·ha−1) and W2N1 (irrigation water quota of 30 mm, nitrogen application rate of 77.5 kg·ha−1), the main stem height in the W3N1 treatment (irrigation water quota of 37.5 mm, nitrogen application rate of 77.5 kg·ha−1) increased by 51.02% and 11.28%, respectively. Compared with W1N2 (irrigation water quota of 22.5 mm, nitrogen application rate of 110 kg·ha−1) and W2N2 (irrigation water quota of 30 mm, nitrogen application rate of 110 kg·ha−1), the W3N2 treatment (irrigation water quota of 37.5 mm, nitrogen application rate of 11 kg·ha−1) increased growth by 26.58% and 3.49%, respectively. Increasing the irrigation volume significantly boosted the main stem height. The peanut main stem height also increased with better N applications. Both the N1 (irrigation water quota of 22.5 mm) and N2 (irrigation water quota of 30 mm) treatments significantly increased the main stem height compared with the N0 treatment (which did not involve the application of nitrogen). With the N2 treatment, the main stem was higher. At the W1 level, the W1N2 treatment had a 29.01 percent higher main stem height than W1N1; at the W2 level, the W2N2 treatment plants grew by 16.27% percent and 34.86% percent compared with the W2N1 and W2N0 plants (irrigation water quota of 30 mm, without the application of nitrogen), respectively; and, at the W3 level, the W3N2 treatment plants grew 8.13 percent over the W3N1 plants. The peanut main stem height increased significantly with high nitrogen treatment. Different water and nitrogen treatments had the same effect on the peanut’s lateral branch length as they did on its main stem height. Water and nitrogen applications increased the number of branches, but the treatments’ differences were insignificant. At the same irrigation level, the surface dry matter weight and leaf area index had the following order: N2 > N1 > N0. The near-surface dry matter weight and leaf area index both showed W2 > W3 > W1 at the N2 level and W3 > W2 > W1 at the N1 level; this indicates that nitrogen fertilization can promote aboveground biomass growth. Within a specific range of N applications, deficit regulation and excessive irrigation can reduce crop transpiration by inhibiting the redundant growth of aboveground biomass. Within a specific range of N applications, deficit regulation and excessive irrigation can reduce crop transpiration by inhibiting the redundant growth of aboveground biomass. Despite the cumulative effect of the seedling stage on the pod-setting stage and, thus, on leaf growth, the difference in water content in the pod-filling stage was still apparent in the leaf areas of peanuts during the pod-filling stage.
Table 2 shows the effects of different water and nitrogen treatments on physiological indexes (the SPAD (Soil and Plant Analyzer Development, chlorophyll), net photosynthetic rate, transpiration rate, and stomatal conductance) in peanuts. The results show that the effect of the irrigation volume (W) on just the physiological index factors at the flowering–pegging, pod-setting, and pod-filling stages was extremely significant (p ≤ 0.01). Nitrogen (N) applications had highly significant (p ≤ 0.01) one-way effects on the SPAD, the net photosynthesis rate, and the transpiration rate at the flowering–pegging, pod-setting, and pod-filling stages and on the stomatal conductance at the pod-setting and pod-filling stages. The effect of this factor alone on the stomatal conductance at the flowering–pegging stage was significant (p ≤ 0.05). The interaction between the two (W × N) had highly significant effects on the SPAD, net photosynthetic rate, and stomatal conductance at the pod-setting and pod-filling stages (p ≤ 0.01) and on the transpiration rate at the pod-filling stage (p ≤ 0.01). There was a significant effect on the SPAD at the flowering–pegging stage and on the transpiration rate at the pod-setting stage (p ≤ 0.05).
As fertility progressed, the SPAD increased and then decreased. Its performance pattern was consistent with the LAI, indicating that excessive irrigation would reduce SPAD within a specific N application range. At the flowering–pegging stage, the net photosynthetic rate, transpiration rate, and stomatal conductance were highest, followed by at the pod-setting stage, and at the pod-filling stage, they were the lowest. When the irrigation volume increased at the N3 level, the peanut leaf photosynthetic rate, transpiration rate, and stomatal conductance increased, and the physiological indexes reached their maximum values. As a result of low nitrogen, the peanut leaf photosynthetic rate, transpiration rate, and stomatal conductance showed W3 > W2 > W1, and the physiological indexes reached their maximum value under W3N1. Peanut photosynthesis is inhibited via excessive irrigation and nitrogen fertilization. Appropriate irrigation and nitrogen application improve the peanut leaf net photosynthetic rate, transpiration rate, and stomatal conductance.

2.2. Effects of Water and Nitrogen Regulation on Peanut Yield under Mulched Drip Irrigation

Table 3 shows the effects of different water and nitrogen treatments on the peanut yield and yield components in the experiment. The one-way effects of water irrigation (W) on both the peanut yield and yield components were highly significant (p ≤ 0.01). The one-way effect of nitrogen (N) application was highly significant (p ≤ 0.01) on the pod yield, 100-pod weight, number of 500 g pods, and 100-kernel weight. The two interactions (W × N) had a highly significant effect (p ≤ 0.01) on the pod yield and a significant effect (p ≤ 0.05) on the 100-kernel weight.
A drip irrigation system under membrane conditions can directly impact the peanut root zone’s soil-wetting range and soil water content in the wet body, which impact the peanuts’ distribution and growth. Moreover, the development of the peanut root system affects the absorption and utilization of water and nutrients by the peanut plant. The peanut growth aboveground, and the distribution of photosynthetic products to various organs, are affected by this factor. This ultimately impacts peanuts’ economic yield. Table 3 shows that the irrigation water and nitrogen applications increased the peanut pod yield. W3 yielded substantially higher yields than W2 and W1. Furthermore, the N2 treatment yielded substantially superior results compared to the N0 and N1 treatments. The performance was consistent with the 100-pod weight, kernel rate, 100-kernel weight, pods per plant, and pod-weight-per-plant values and was negatively correlated with the 500 g pod number. The W3N2 treatment significantly increased the peanut pod yield by 92.73% and 17.13% compared with the W1N2 and W2N2 treatments under the same nitrogen application conditions. The W2N2 treatment had a 64.55% higher mortality rate than the W1N2 treatment. The W3N1 treatment significantly increased the peanut pod yield by 108.89% and 27.03% compared with the W1N1 and W2N1 treatments, and the W2N1 treatment was higher than the W1N1 treatment by 64.44%. This indicates that under drought stress, a peanut plant’s nutrient uptake capacity is severely limited. Water-deficit irrigation may lead to impaired photosynthesis in peanuts, resulting in a reduction in growth indexes, such as the main stem height and shoot dry mass, which may affect the peanut yield. Reasonable irrigation increases the soil aeration of peanut roots, promotes the respiratory function of the root layer, facilitates the absorption of soil nutrients by roots, and promotes the progression of growth indicators such as the main stem height and shoot dry mass. Therefore, reasonable irrigation is critical to peanut yield formation. The peanut pod yields under the same irrigation conditions were significantly higher in the W3N2 treatment than in the W3N1 treatment, by 12.77%; they were 22.30% and 33.09% higher in the W2N2 treatment than in the W2N1 and W2N0 treatments; 8.82% higher in the W2N1 treatment compared with the W2N0 treatment; and 22.22% higher in the W1N2 treatment compared with the W1N1. No nitrogen applications and too few nitrogen applications result in insufficient nutrients and destroy soil microecosystems. This affects crop growth indicators and yield reductions. Through applying nitrogen properly, it is possible to maintain good nutrient transport from sources (stems and leaves) to sinks (pods) and increase yields.
The relationship between peanut growth indicators and pod yield and yield components (Table 4) showed that growth indicators were closely related to the pod yield. The growth indexes were positively correlated with the pod yield, 100-pod weight, kernel rate, 100-kernel weight, pods per plant, and pod weight per plant, and were negatively correlated with the number of 500 g pods. The correlation coefficients of the growth indexes with the pod yield reached highly significant levels. Therefore, a high peanut yield was favored via increasing the main stem height, the first branch length, the branch number, the shoot dry mass, and the LAI in this experiment.

2.3. Effects of Water and Nitrogen Regulation on Water Consumption of Peanuts under Mulched Drip Irrigation

Table 5 shows the effects of different water and nitrogen treatments on the peanut water consumption. Peanut plants under drip irrigation with different water and nitrogen treatments consumed more water as the irrigation increased. As nitrogen applications increased, the irrigation decreased slightly. In all treatments, peanuts consumed more water during their reproductive period than during irrigation. The difference in water consumption was mainly due to irrigation. The peanuts’ water consumption was not significantly affected by nitrogen applications. As the W3N2 and W3N1 treatments had sufficient water supplies, their water consumption was the highest. Under the same nitrogen application level, the total water consumption of the W3N2 treatment during the reproductive period was 25.28% and 11.71% higher than that of W1N2 and W2N2, respectively. The W2N2 treatment consumed 12.15% more water than W1N2, the W3N1 treatment used 23.59% and 11.09% more than W1N1 and W2N1, and the W2N1 treatment used 11.25 percent more than W1N1. As a result of the differences in soil water content and irrigation water, the W1N2 and W1N1 treatments supplied less water and had the lowest soil water content control. The two treatments consumed the least amount of water, while the other treatments fluctuated between these treatments. The total water consumption in the W3N1 treatment at the same irrigation level and under different N application conditions was 1.25% higher than in W3N2; the total water consumption in the W2N2 treatment was 1.78 and 3.26% lower than that in W2N1 and W2N0; the total water consumption in W2N1 was 1.50% lower than that in W2N0; and the total water consumption in W1N1 was 2.64% greater than that in W1N2. During peanut fertility, the water consumption was significantly higher than the irrigation. Increasing the nitrogen application had little effect on the peanut water consumption, which suggests that irrigation caused most of the water consumption differences.
In drip-irrigated peanuts under different water and nitrogen treatments, the stage-wise water consumption increased with irrigation, and the differences were significant at the flowering–pegging, pod-setting, and pod-filling stages. In the sowing–emergence stage, peanuts consume the least water because of the evaporation from the bare land between films. Because peanut seedlings are short plants, with few leaves and little transpiration, the peanut water consumption is low at this stage. The peanut growth transitions from vegetative to reproductive after entering the flowering–pegging stage. In our study, the peanut plants grew rapidly, transpiration increased rapidly, and water consumption grew significantly. In the pod-setting stage of reproductive and vegetative growth, the peanut water consumption peaked. Subsequently, because of peanut maturity and temperature fall, the peanut water consumption gradually decreased.
The water consumption modulus of the seedling stage was 11.88~15.02%, that of the flowering–pegging stage was 30.20~32.99%, that of the pod-setting stage was 40.99~43.81%, and that of the pod-filling stage was 11.69~13.49%. Given the daily water consumption intensity of the peanuts in each treatment, the daily water consumption intensity was lower at the seedling stage because of the smaller plants and lower temperature, and the value was 1.68~1.85 mm·d−1; the growth began to transition from vegetative growth to reproductive growth at the flowering–pegging stage, with an increase in temperature; the transpiration of leaves and plants increased rapidly; and the daily water consumption intensity increased, which was between 3.53 and 4.37 mm·d−1. In the pod-setting stage, the plant entered the peak period, and the daily water consumption intensity reached a high value, between 3.56 and 4.82 mm·d−1. In the pod-filling stage, the water consumption intensity was lowest, between 0.87 and 1.21 mm·d−1.

2.4. Effects of Water and Nitrogen Regulation on Water and Nitrogen Use Efficiency of Peanuts under Mulched Drip Irrigation

Table 3 shows that the WUE (water use efficiency) was significantly higher (p ≤ 0.05) in the N2 treatment than in the N1 treatment at the W1 and W3 irrigation levels. The WUE was significantly higher in the N2 treatment than in the N0 and N1 treatments at the W2 irrigation level (there was no significant difference between the WUE in the N0 treatment and that in the N1 treatment). Overall, it appeared that irrigation and fertilizer application had a highly significant (p ≤ 0.01) effect, either singly or interactively, on both the WUE and IWUE (irrigation water use efficiency).
The NPP (nitrogen partial factor productivity) is an index reflecting the comprehensive effect of local soil basic nutrient levels and the chemical fertilizer application rate. The NPP was inversely proportional to the amount of fertilizer applied at the same irrigation level. As the N applications grew, the NPP decreased significantly. The NPP gradually increased as the irrigation water became plentiful. The NPP in the W3N2 treatment was substantially higher than those in the W1N2 and W2N2 treatments at the N2 level (p ≤ 0.05), and the W3N1 and W2N1 treatments were considerably better than the W1N1 treatment at the N1 level (p ≤ 0.05). Overall, it appeared that both the irrigation and fertilization rates had highly significant (p ≤ 0.01) effects on the NPP, either singly or interactively (p ≤ 0.01). Therefore, increasing the irrigation volume simultaneously with the N applications could ensure a higher NPP. In this experiment, the NPP was highest in the W3N1 treatment at 60.61 kg·kg−1, followed by in the W3N2 treatment at 48.16 kg·kg−1, which differed significantly from the other treatments.

2.5. Based on a Comprehensive Evaluation, the Most Appropriate Irrigation and Nitrogen Application Indexes Were Selected

The pod yield (x1), the 100-pod weight (x2), the 500 g pod numbers (x3), the kernel rate (x4), the 100-kernel weight (x5), the pod per plant (x6), the pod weight per plant (x7), the WUE (x8), the IWUE (x9), and the NPP (x10) of peanuts under different water and nitrogen treatments were analyzed via correlation, principal component, and membership function analyses (Table 6, Table 7, Table 8 and Table 9). The results showed (Table 6) that the correlation coefficients between the indicators of peanuts reached highly significant levels (p ≤ 0.01). This shows that it is crucial to coordinate source–sink translocation to obtain optimal peanut yields, and that all high-yielding peanuts are characterized by a high water and nitrogen use efficiency.
The membership function method can comprehensively evaluate the peanut indicator stability. The larger the positive value of an indicator (or the smaller the negative value), the smaller the range, the larger the membership function value R, and the more stable the indicators. The results show that (Table 7) the membership function values of different treatments were the highest in the W3N2 treatment, and the indicators were stable.
Principal component analysis was conducted on the 10 peanut indexes, and the initial characteristics of each extracted component were determined (Table 8). The results showed that the cumulative contribution rate of 10 peanut components reached 100%, indicating that 10 factors contributed to the comprehensive peanut evaluation. The cumulative contribution rate of the first two principal components reached 89.733%, which contained all the variation information from the original variables. Choosing the first two principal components as the main principal components allowed us to reduce the number of variables and retain most of the original information.
The principal component matrix reflects the direction of the relative magnitude and the effect of the main index on the principal component load, that is, the degree to which the index influences the principal component, also referred to as the index load on the principal component (Table 9). Based on the matrix coefficients and normalized data, the score function expressions for the two principal components can be obtained:
Z1 = 0.341x1 + 0.329x2 − 0.334x3 + 0.298x4 + 0.333x5 + 0.300x6 + 0.296x7 + 0.332x8 + 0.316x9 + 0.278x10;
Z2 = −0.050x1 − 0.1093x2 + 0.144x3 − 0.506x4 − 0.061x5 + 0.417x6 + 0.366x7 + 0.198x8 + 0.341x9 − 0.495x10.
Based on the variance contribution ratio of each principal component, the comprehensive evaluation function can be derived: F = 0.8399Z1 + 0.5744Z2.
According to the comprehensive evaluation score (Table 10), the highest comprehensive score treatment was W3N2, and the lowest treatment was W1N1. Therefore, the water and nitrogen regulation treatment with the highest yield was W3N2.

3. Discussion

3.1. Effects of Water and Nitrogen Regulation on Growth and Physiological Indexes of Peanuts under Mulched Drip Irrigation

In Xinjiang, peanuts now have better development prospects and can be developed into a new, advantageous oilseed resource. However, they require water and fertilizers to grow. Water [21] and nitrogen [22,23] are key factors affecting peanut growth and development. Appropriate water and nitrogen regulation can promote peanut nutritional and reproductive efficiency. According to Longnecker [24], Rodriguez [25], and other researchers’ studies, nitrogen fertilization benefits crop nutrient organs and the development of plant population indexes, resulting in improved plant growth. At the same time, it can improve the unfavorable effects of water stress conditions, such as slow leaf extension and a reduced leaf area; increase crop dry matter accumulation; and reduce yield losses. Qi et al. [26] showed that nitrogen fertilizer application under water adversity conditions had a significant regulatory effect on winter wheat plant growth and dry matter accumulation. In addition, water deficits during reproductive periods affected the plant height, leaf area, and dry matter accumulation. A study by Liu et al. [27] indicated that, with an increase in irrigation and fertilizer application, the seedling height, leaf area, and dry matter mass increase in small-grain coffee, a finding that seems to align with this paper’s results. This study showed that increasing irrigation at N0, N1, and N2 benefits the development of growth indicators. This indicates that water positively affects peanut growth, adequate water supply, crop absorption, and utilization. A significant increase in the main stem height reveals this. We also concluded that the peanuts’ vegetative growth was inhibited by low nitrogen (N1) levels and the absence of nitrogen fertilizer (N0). Peanuts treated with N2 experienced significant growth, improved quality, and yield increases.
Plant growth is governed by the physiological indicators of leaves, which determine how much dry matter accumulates and how high a yield is produced [28,29]. Photosynthetic products account for 90~95% of dry matter accumulation. At different fertility stages, nitrogen and water regulation will differentially affect crop-leaf SPAD values, net photosynthetic rates, transpiration rates, and stomatal conductance. According to Li et al. [30], cotton leaves’ relative SPAD, net photosynthetic rate, and maximum photochemical efficiency decrease under drought stress. Su et al. [31] concluded that regulated deficit irrigation decreases alfalfa’s photosynthetic rate and reduces light energy utilization. Stomatal closure affects photosynthetic product accumulation in the plant. Shen et al. [32] found that water stress decreases the net photosynthetic rate of crop leaves, the production of photosynthetic products, and the physiological activity of various organs, thereby limiting the plant’s ability to absorb nutrients and accumulate them and affecting its economic yield. During the reproductive period of the study, the physiological indexes (the SPAD value, net photosynthetic rate, transpiration rate, and stomatal conductance) in the low-water treatment were significantly lower than those in the high-water treatment; i.e., because of the water deficit, the peanuts’ photosynthesis was suppressed, resulting in lower physiological index values, and the values of physiological indexes increased as irrigation increased, indicating that irrigation had a stronger compensatory effect on the plants. Consequently, water control is the key to crop photosynthesis, and moderate water treatment can significantly improve peanut physiological indexes. Li et al. [33] found that a moderate increase in nitrogen fertilization during drought stress increases the chlorophyll content of cotton’s primary stem leaves and net photosynthetic rate, and it mitigated the drought stress inhibition of photosynthesis. According to that study, peanuts benefit from nitrogen fertilizer through maintaining high physiological indexes. Plants allocate nutrient resources to the organs or parts of their bodies that need that nutrient most, which means that their photosynthesis characteristics are affected when nitrogen is reduced, so they can satisfy their growth, development, and physiological metabolism. If nitrogen fertilizer is applied too much, the leaves will shade one another, and the light conditions will become worse in the lower part of the plant, accelerating the senescence process of the lower leaves and decreasing the nitrogen content of the lower part of the plant, and thereby adversely affecting photosynthetic production. All the physiological indexes of the peanuts increased with an increase in nitrogen application over their entire life span. However, the maximum index under N2 treatment did not appear to decline, which indicates that the nitrogen application in the N2 treatment did not reach its maximum value, and a higher-gradient nitrogen application should be used in future studies. In summary, irrigation and nitrogen applications can facilitate peanut photosynthesis and dry matter conversion.

3.2. Effects of Water and Nitrogen Regulation on Peanut Yield under Mulched Drip Irrigation

Crop yields are heavily influenced by moisture and nitrogen [34]. By transporting nutrients and promoting nitrogen conversion, moisture can regulate soil moisture and promote water absorption in plants [35]. According to an in-depth study of the effects of water and fertilizer on plants, “fertilizer regulates water, water enhances fertilizer” [36]. In this study, nitrogen fertilizer increased the peanut yield and yield components compared with the non-application of nitrogen fertilizer. Cong et al. [37] demonstrated that moderate irrigation can improve yield factors, excessive irrigation plays an inhibitory role, yield and nitrogen applications are not always correlated positively, excessive nitrogen applications will reduce yield, and only appropriate irrigation and nitrogen applications can improve wheat yield. The results of this study show that, at the same irrigation level, increasing nitrogen fertilizer can increase peanut pod yields, 100-pod weights, the number of 500 g fruits, kernel rates, 100-kernel weights, pods per plant, and pod weights per plant. All of these reached their maximum in the W2 treatment; under the same level of nitrogen application, increasing the amount of irrigation can increase the indexes, which is inconsistent with the results of the above study and may be due to the maximum amount of irrigation being not enough; thus, the results of the current experiment will be supplemented to verify the results of subsequent experiments. In this study, a continuous upward trend in peanut yield was observed with an increase in nitrogen applications. An in-depth study of the proportion of water and nitrogen inputs and peanut production is indispensable in achieving high-yield and water- and fertilizer-saving peanut cultivation.

3.3. Effects of Water and Nitrogen Regulation on the Water Consumption of Peanuts under Mulched Drip Irrigation

In northern Xinjiang, the peanuts under membrane drip irrigation experienced an increase in temperature over the entire growth period. With a temperature increase, the peanuts’ water consumption increased gradually, and they required about 402.57 mm of water to reach a high yield. In this study, peanut pods consumed the most water during the pod-setting stage. This is when the embryonic and nutrient bodies grew simultaneously, and is a critical period for peanut pods to fill up and become complete. The water requirements of peanut plants vary from reproductive stage to reproductive stage. Feng et al. [38] showed that, with sprinkler irrigation, the peanuts in their study consumed the most water during the flowering–pegging and pod-setting stages, and the average daily water consumption decreased as the sprinkler irrigation was reduced. In contrast, the opposite was confirmed for whole fruit. In their study of peanut plant water consumption, Xia et al. [39] found that water consumption increased with irrigation quotas during a peanut’s development. The peanuts’ water consumption pattern showed a lesser consumption at the end. As with the study in this paper, an extensive irrigation quota resulted in a relatively high water consumption and intensity. According to Ren et al. [40], peanut yield is closely related to water consumption, the peanut yield improved as the irrigation water increased, the water consumption grew to about 650 mm, the yield declined, and the overall trend was parabolic. This experiment is a preliminary study of under-membrane drip irrigation peanuts. Our water consumption values did not reach the threshold value, but we will increase it in next year’s trial.

3.4. Effects of Water and Nitrogen Regulation on Water and Nitrogen Use Efficiency of Peanuts under Mulched Drip Irrigation

Sustainable agricultural development requires the improvement of water and fertilizer efficiency and the enhancement of crop yields. According to Li et al. [41], enhancing nitrogen application improves crops’ water use efficiency under the same irrigation conditions. The WUE is significantly affected by irrigation and nitrogen applications, as reported by Kaisi et al. [42]. In our study, the WUE and IWUE showed increasing trends with increasing N applications and reached their maxima at N2. When comparing each irrigation level under this N application condition, we can see that the WUE and IWUE were at their maxima in W3N2. The yield decreases the water consumption and efficiency, according to Huang et al. [43]. With a 5.2974 Mg·ha−1 yield, the W3N2 treatment showed the highest water use efficiency. Given the water–nitrogen coupling effect in this experiment, irrigation increased the nitrogen fertilizer efficacy. However, the increased application of nitrogen fertilizer contributed to a higher pod yield, resulting in a higher water use efficiency.
The nitrogen fertilizer bias productivity decreases and improves with increasing nitrogen applications and irrigation, respectively, according to Aujla et al. [44]. As in the previous study, the NPP decreased with increasing N applications under the same irrigation conditions. In low-nitrogen conditions, the nitrogen bias productivity was highest with the high-water treatment. Irrigation has a significant nitrogen-promoting effect in arid regions, and the nitrogen fertilizer’s water-promoting effect is more apparent only when the soil is moist, so moisture is the decisive factor for boosting peanut yields during under-membrane drip irrigation.
Under-membrane drip irrigation was evaluated using principal component analysis to comprehensively evaluate the peanut yield, yield components, and water and nitrogen utilization efficiency. According to the principal component analysis, the W3N2 treatment had the highest comprehensive score, and the yield was significantly higher than that in the other treatments. Overall, the W3N2 treatment significantly increased the yield and proved to be a better water–nitrogen combination. Furthermore, the irrigation volume in this trial was low overall, and the optimal nitrogen application level was lower than that in other studies. In subsequent experiments, the irrigation volume should be increased to allow us to study water–nitrogen interactions.

4. Materials and Methods

4.1. Overview of the Test Area

We experimented at the Xinjiang Academy of Agricultural Sciences, Anning Canal (87°30′ E, 43°58′ N, 590 m above sea level) from May to October 2022. The experimental base is located in Urumqi City, Xinjiang Uygur Autonomous Region, in the middle of the northern foothills of the Tianshan Mountains and the northern outskirts of Urumqi City on the alluvial plains. The area has a gentle terrain, which is typical of the economic belt on the northern slopes of the Tianshan Mountains. The average annual sunshine hours in the test area are 2700–2800 h, the effective accumulated temperature greater than 10 °C is 3000–3500 °C [1], the frost-free period is 170~179 d, the annual average precipitation is 200 mm, the maximum evapotranspiration is 1750 mm, the groundwater depth is 7.5 m, and it is located in the arid and semi-arid desert climatic zone agricultural area. In the experimental area, the pH of the tillage soil ranged from 7.8 to 8. The physical and chemical properties of the 0–60 cm soil layer are presented in Table 11. Figure 1 shows the precipitation and ETo (reference evapotranspiration) values for the experimental period. The reference crop evapotranspiration (ETo) was calculated using the Penman–Monteith formula [45].

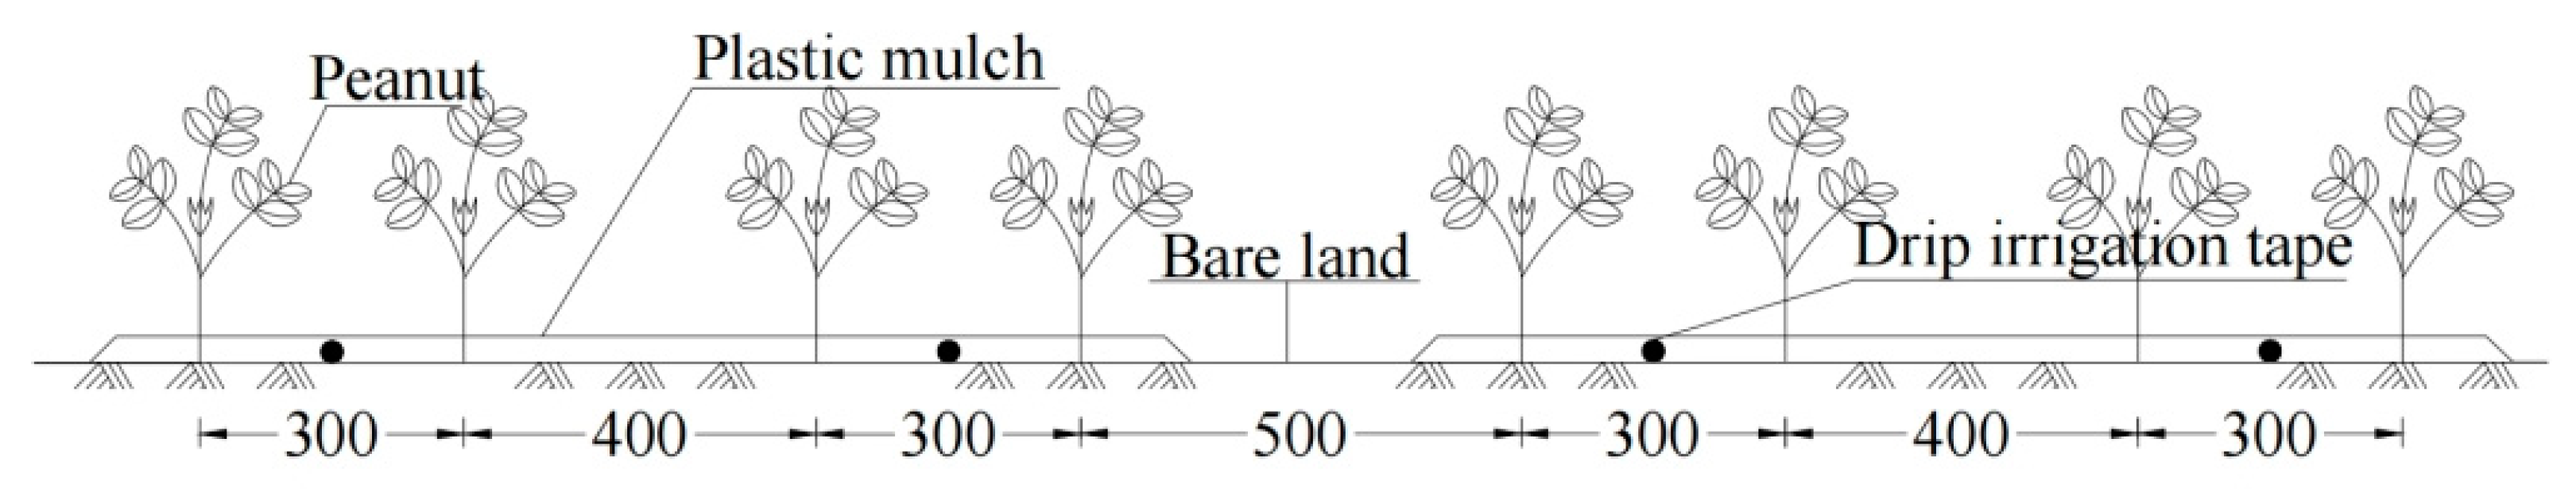
4.2. Peanut Cultivation Patterns

In a membrane drip irrigation peanut planting mode, with one membrane and four rows (Figure 2), the average hole spacing was 15 cm, and the planting density was 166,000 holes per hectare. Sowing began on 7 May (dry sowing and wetting out); harvesting began on September 27 from whole seedlings. Before sowing, the basal compound fertilizer (N: P2O5:K2O = 15%:15%:15%) was 300 kg·ha−1, and nitrogen fertilizer (urea (CO(NH2)2, nitrogen content ≥ 46%)) was applied four times during the reproductive period via fertilizing with water. Table 12 shows the amount of nitrogen fertilizer (pure nitrogen) for each treatment. The chemical control, spraying, and other agronomic measures were the same as in the high-yield farmland management model. The irrigation system used a sub-film drip irrigation system with labyrinth drip tape for the capillary, a 3.2 L·h−1 drip head flow rate, and 30 cm drip-head spacing. There were five plots for each treatment (the length and width of each plot were 54 m and 1.5 m, respectively) on a 1620 m2 experimental area controlled by a branch pipe. This branch pipe irrigation system had gate valves and water meters at its entrance. Groundwater provided irrigation water, and the meters controlled how much irrigation water was applied.

4.3. Experimental Design

Peanuts (Huayu 9610, registration number: GPD Peanuts (2018) 370377 [46]) were tested. The peanut growth was divided into five stages based on growth stages: the seedling stage (from the emergence of the first true leaves on 50% of seedlings in the peanut field to the opening of the first flowers on 50% of the plants in the peanut field), the flowering–pegging stage (from the opening of the first flowers on 50% of the plants in the peanut field to the emergence of the first chicken-headed young pods on 50% of the plants in the peanut field), the pod-setting stage (from the emergence of the first chicken-headed young pods on 50% of the plants in the peanut field to the emergence of whole pods on 50% of the plants in the peanut field), the pod-filling stage (from 50% of the plants in the peanut field to 100% of the plants, the pods are whole and mature), and the harvest stage. This was a split-area trial with two factors: water and nitrogen. The nitrogen fertilizer dosage was set at two levels: 77.5 and 110 kg·ha−1. With a total of seven treatments (Table 12), the irrigation quota was set at three levels of 22.5, 30, and 37.5 mm, and there was a complete combination of two factors, six treatments, and a control treatment without nitrogen applications (W2N0). Each treatment was replicated five times. Peanuts are not irrigated during seedling and harvesting, according to local production practices. During the 2022 peanut growing season, 45 mm was used for irrigation to ensure peanut emergence after sowing. The actual irrigation and fertilization times, irrigation volumes, and nitrogen application rates during the peanut growth period are shown in Table 13.

4.4. Observation Items and Methods

4.4.1. Soil Moisture Content

Before sowing, irrigation, and harvest, the soil gravimetric method was used to measure the moisture within the layers (0–20, 20–40, 40–60, 60–80, 80–100 cm) and, after irrigating within the layers (0–10, 10–20, 20–30, 30–40, 40–50, 50–60 cm), we took into account the cultivation characteristics of the wide and narrow rows of peanuts and the drip irrigation line infiltration characteristics. Each treatment was sampled four times at 0 cm (in the film), 20 cm (in the inner row), 35 cm (under the drip irrigation belt), and 70 cm (between the films); in each treatment, a sample point was selected directly below the drip irrigation belt before sowing, before irrigation, and after harvest, and the average soil water content was determined using the Shen method [47] to represent the average soil water content in the peanut fields.

4.4.2. Measurement of Crop Growth and Physiological Indexes

A straightedge was used to measure the height of the main stem and first branch length during the reproductive period and to investigate the number of branches.
For the shoot dry matter, destructive sampling was carried out at the main fertility stage of the peanuts, with three randomly collected plant samples from each plot placed in an oven at 105 °C for half an hour for the killing process, followed by the peanut samples being dried to a constant weight at a constant temperature of 85 °C.
The leaf area index (LAI) was measured using the specific leaf weight method during the main fertility period.
The chlorophyll content of the leaves was measured using a SPAD-502Plus Chlorophyll Meter.
Regarding the net photosynthetic rate, the transpiration rate and stomatal conductance of the peanut plants were measured using Li-6800 portable photosynthesis systems (Li-COR Inc., Lincoln, NW, USA) on three randomly selected peanut plants in each plot between 9:00 and 13:00 on a clear day.

4.4.3. Calculation of Field Yield and Water Consumption

We evaluated the pod yield, the 100-pod weight, the 100-kernel weight, the 500 g pod count, and the kernel rate at the ripe harvest stage using 6.67 m2 per treatment as the unit yield.
Equation (1) was used to calculate the water consumption in each treatment using the water balance equation [45]. As the buried depth of groundwater in the test area was greater than 7.5 m, the effect of groundwater recharge could be ignored. K = 0 as there was no adequate precipitation of over 10 mm during the whole peanut growth stage, and P0 = 0. In the test field [48], irrigation water impacted the surface by 60 mm when the irrigation quota was less than 37.5 mm. D = 0 if the irrigation rate was less than 37.5 mm in the drip-irrigated peanut fields. Equation (1) can be simplified into Equation (2):
ET = P 0 + K + M D + ( W 0 W t )
ET = M + ( W 0 W t )
where ET is the peanut water consumption (mm); P0 is adequate precipitation (mm); K is the groundwater recharge (mm); M is the irrigation water (mm); D is the deep seepage (mm); and W0 and Wt denote the soil water storage at the beginning and the end of the period.

4.4.4. Water Use Efficiency

The water use efficiency of a crop refers to its level of photosynthesis or growth per unit of evapotranspiration, that is, the amount of financial product produced per unit of water. A crop’s water use efficiency is evaluated using this indicator. Under drip irrigation conditions, Equations (3) and (4) can be used to calculate the irrigation water use efficiency (IWUE) of different water treatments:
WUE = Y / E T a
IWUE = Y / E T a
where WUE and IWUE denote the water use efficiency and irrigation water use efficiency (kg·m−3), respectively; Y is the pod yield of peanuts (kg·ha−1); ETa is the actual water consumption of peanuts during the whole growth stage (m3·ha−1); and I is the total amount of irrigation during the whole growth stage of peanuts during under-membrane drip irrigation, i.e., the irrigation quota (m3·ha−1).

4.4.5. Nitrogen Partial Factor Productivity

NPP = Y / N
Here, NPP represents the nitrogen partial factor productivity (kg·kg−1); and N is the total amount of nitrogen applied to peanuts during under-membrane drip irrigation throughout the growth stage (kg·ha−1).

4.5. Comprehensive Evaluation

4.5.1. Membership Function Method

The pod yield, 100-pod weight, number of 500 g fruits, kernel rate, 100-kernel weight, WUE, and NPP were comprehensively evaluated using membership function analysis. The subordination function value of each indicator was calculated as follows:
R μ 1 = x - x min x max - x min
R μ 2 = 1 x - x min x max - x min
where R is the measured value of the measured index of a certain treatment, μ1 indicates the forward index, and μ2 indicates the reverse indicator. xmin and xmax denote the minimum and maximum values of the measured indexes in all treatments, respectively. If the measured indicator is a positive indicator, Formula (6) is used to calculate the membership function value of the indicator; otherwise, Formula (7) is used.

4.5.2. Principal Component Analysis

Principal component analysis is based on data dimension reduction. It involves using lossless information to multiply indicators in linear combinations into a few related comprehensive indicators using a multivariate statistical analysis method; its main purpose is to reduce the data dimension to eliminate overlapping and coexisting information. The index should be simplified as much as possible to reflect the main information of the original index.
Let the original matrix observation data be set as follows:
X   = x 11 x 12 x 1 p x 21 x 22 x 2 p x n 1 x n 2 x np
The normalized matrix was obtained via the original matrix normalization process:
x i j * = x i j x ¯ j S j   i = 1 , 2 , , n ; j = 1 , 2 , , p
x ¯ j = 1 n i = 1 n x ij
S j 2 = 1 n   1 i = 1 n ( x ij x ¯ j ) 2
X * = x 11 * x 12 * x 1 p * x 21 * x 22 * x 2 p * x n 1 * x n 2 * x np *
The correlation coefficient matrix is calculated as follows:
R x = r 11 r 12 r 1 p r 21 r 22 r 2 p r n 1 r n 2 r np
r ij = 1 n   1 i = 1 n x ti x tj   i = 1 , 2 , , p ;   j = 1 , 2 , , p
We calculated the eigenvalues of the correlation coefficient matrix (λ1, λ2, λ) and the corresponding eigenvectors (ai1, ai2, …, aip).
We calculated the contribution rate of each principal component:
C r = λ i i = 1 n λ i   i = 1 , 2 , , p
According to the normalized matrix data, the principal component expression is the final score of the principal component.

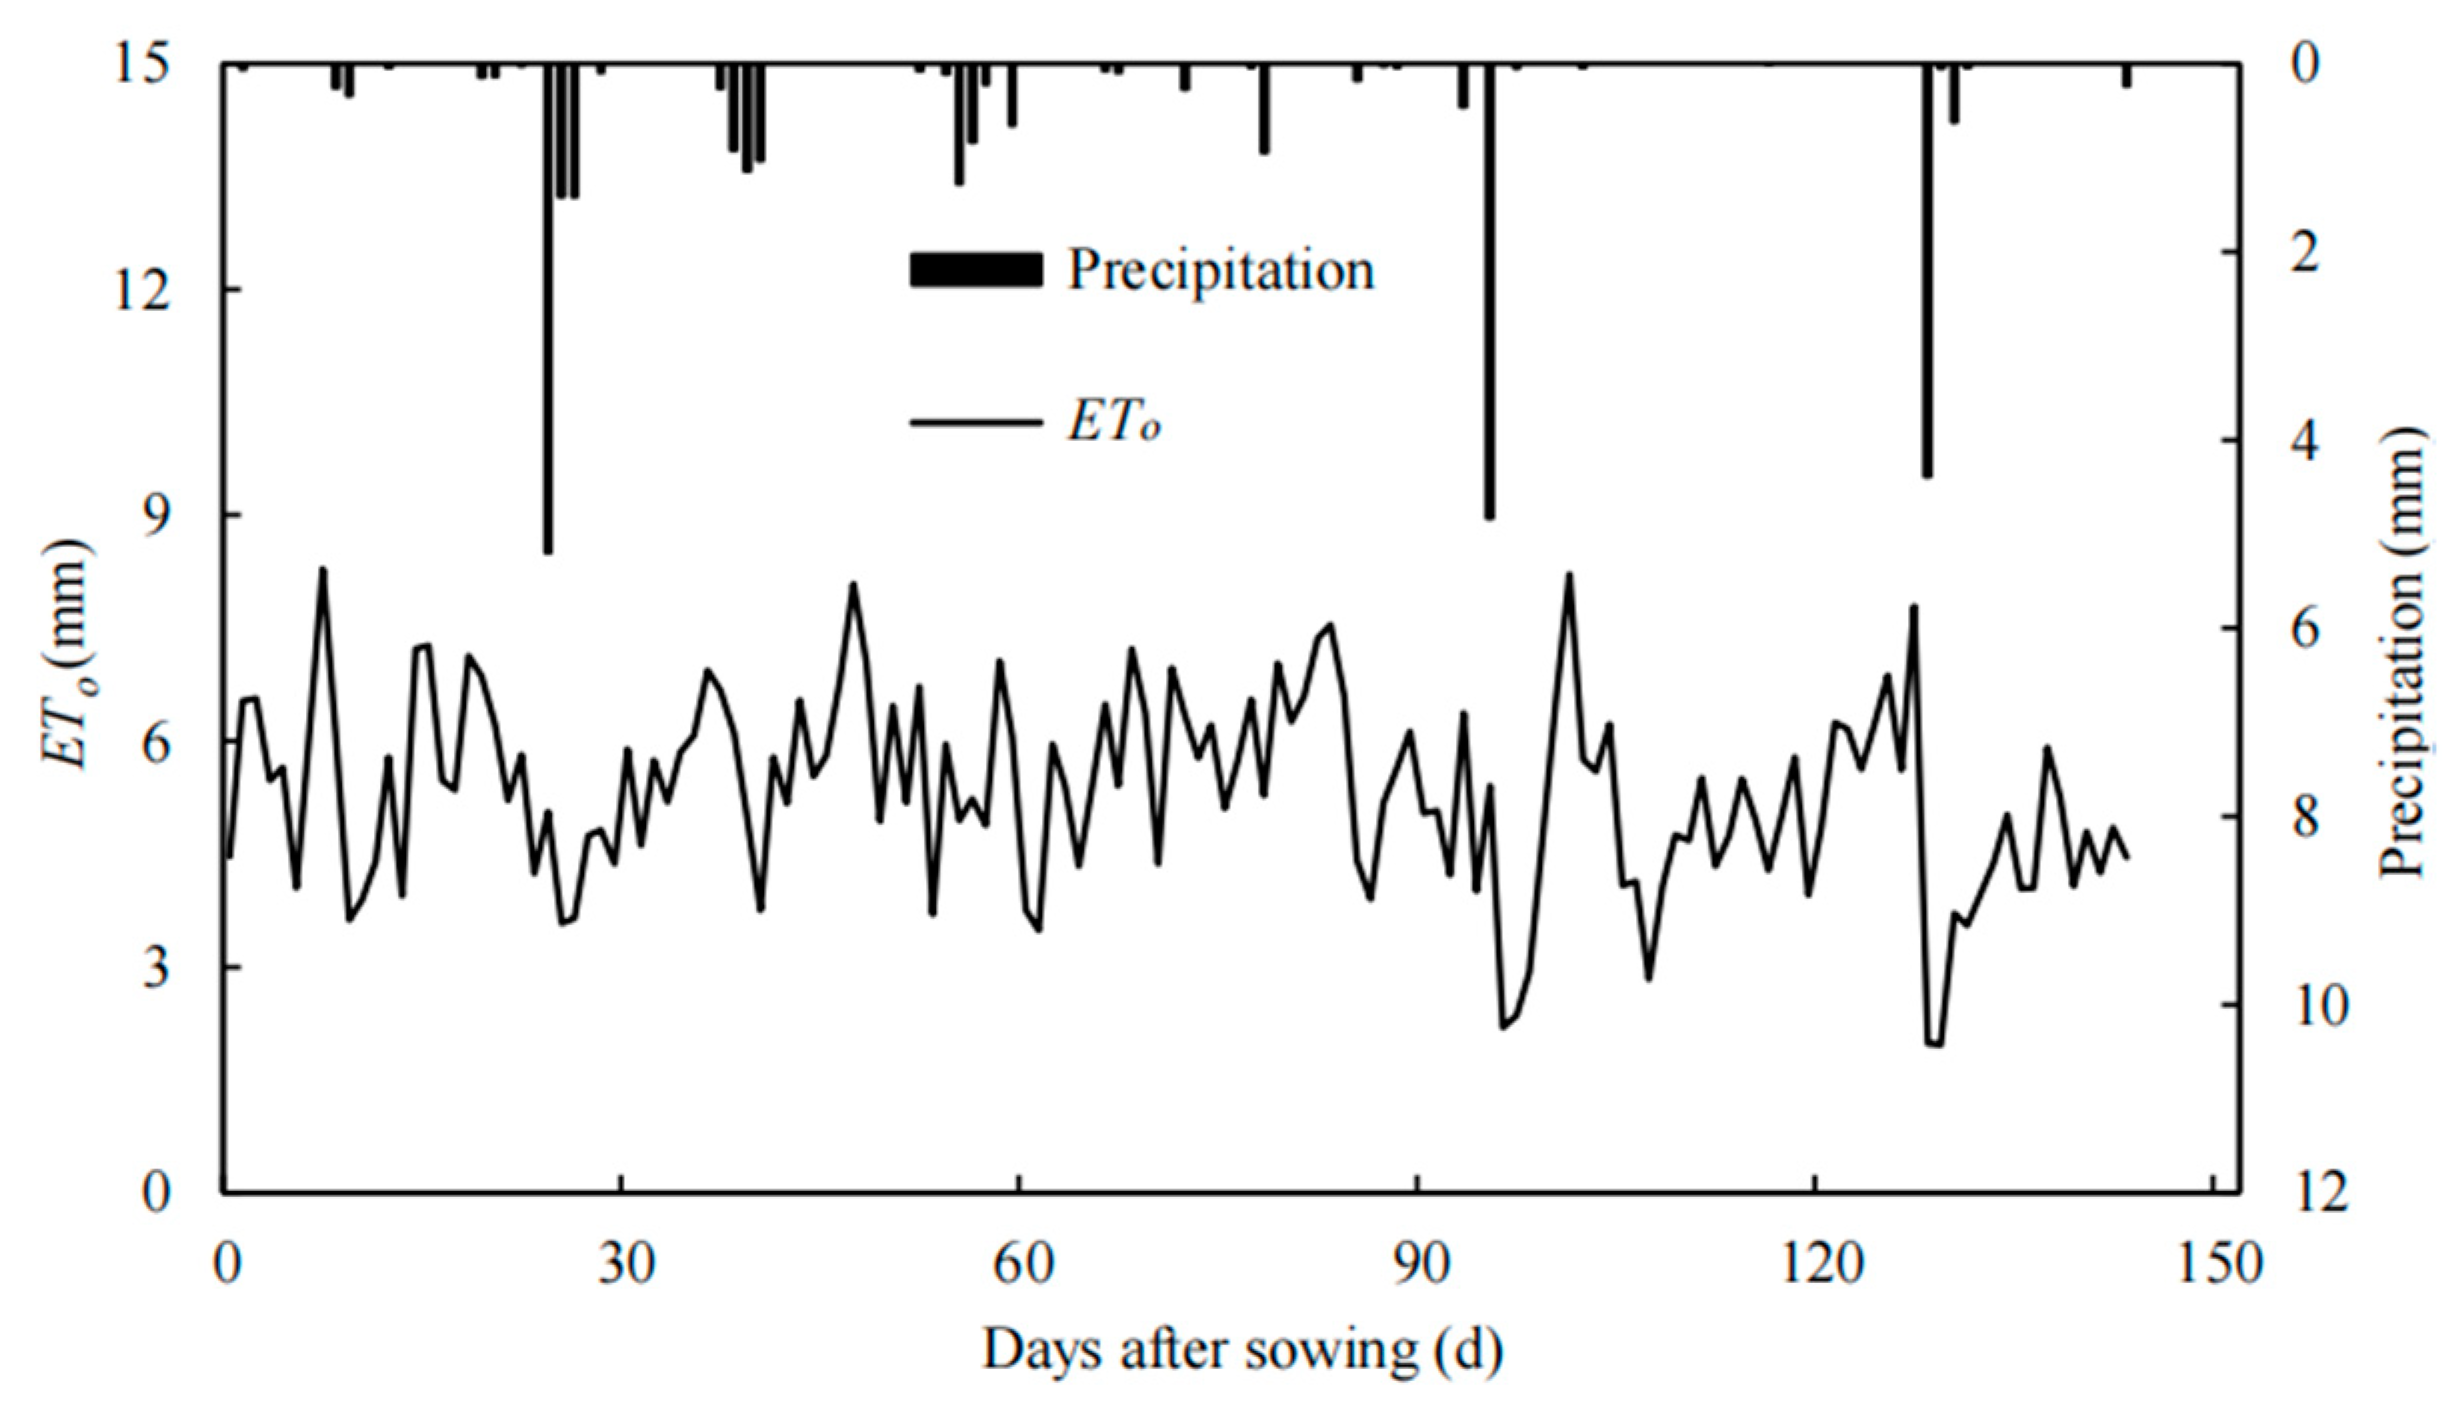
4.6. Meteorological Indicators

The Chinese Meteorological Data Service Center (http://data.cma.cn/, format: accessed on 21 March 2023) provided selected meteorological data on the temperature, solar radiation, wind speed, relative humidity, and precipitation during the peanut growth stages.

4.7. Data Analysis

The experimental data were collected and analyzed, and graphs were plotted, using Excel 2016. In this study, multiple comparisons were performed using the Duncan new compound difference method analysis. Significant differences between the detected parameters were compared using Tukey’s honest significant difference (HSD) test at the 95% confidence level (p ≤ 0.05).

5. Conclusions

(1) The daily water consumption intensity of peanuts ranged from 1.68 to 1.85 mm·d−1 at the seedling stage and from 3.53 to 4.37 mm·d−1 at the flowering–pegging stage. It reached a maximum of 3.56–4.82 mm·d−1 at the pod-setting stage and decreased from 0.87 to 1.21 mm·d−1 at the pod-filling stage.
(2) Compared with no N application (N0), an increased N application significantly improved physiological indices, promoted peanut growth indices and, therefore, increased yield. The NPP decreased with increased N application.
(3) Based on the comprehensive evaluation, under the conditions of this experiment, a higher peanut yield of 5.2974 Mg·ha−1; a higher WUE of 1.32 kg·m−3 at an irrigation quota of W3 (37.5 mm); an application rate of N2 (110 kg·ha−1); and a watering cycle of 10–15 d are the appropriate water and nitrogen regulation values for peanut production during drip irrigation under membrane conditions in Xinjiang.

Author Contributions

Conceptualization, X.S.; methodology, X.S., J.D. and Q.L.; investigation, J.D., R.Y. and J.C.; data curation, Z.X., J.D. and R.Y.; formal analysis, J.D., X.S. and Q.L.; writing—original draft preparation, J.D., X.S. and Z.X.; writing—editing, J.D., Q.L., X.H. and H.M.; supervision, X.H. and Z.X.; project administration, Q.L. and H.M.; funding acquisition, X.S. and Q.L. All authors have read and agreed to the published version of the manuscript.

Funding

This work was supported by the National Natural Science Foundation of China (52179052), the China Agriculture Research System of MOF and MARA (CARS-13), and the National Key Research and Development Program of China (2022YFD1000105).

Data Availability Statement

The data are contained within the article.

Conflicts of Interest

The authors declare no conflict of interest.

References

  1. Shen, X.J.; Zhang, X.P.; Yao, B.L.; Li, Q.; Xue, Z.; Dong, J.S.; Yi, R.C. Effects of climate change on the suitable sowing dates for peanut under mulched drip irrigation in Xinjiang. J. Agric. Eng. 2023, 39, 107–115. [Google Scholar]
  2. National Bureau of Statistics of China. China Statistical Yearbook; China Statistics Press: Beijing, China, 2022. [Google Scholar]
  3. Wan, S.B.; Zhang, J.L. Strategies and countermeasures for the development of peanut industry in Xinjiang. J. Peanut 2019, 48, 66–68. [Google Scholar]
  4. Li, Q.; Jia, D.H.; Gu, Y.G.; Wang, J.; Su, J.H.; Wang, Z.M. Analysis of root growth and yield traits of spring rape in Xinjiang under different drip irrigation frequencies. Agric. Res. Arid Reg. 2018, 36, 23–30. [Google Scholar]
  5. Li, Y.; Wang, F.; Sun, J.S.; Liu, H.; Yang, J.Q.; Xian, F.; Su, H. Water and nitrogen coupling effects of under-membrane drip irrigation for machine harvested cotton in the dry zone of western Inner Mongolia. J. Appl. Ecol. 2016, 27, 845–854. [Google Scholar]
  6. Yi, R.C.; Shen, X.J.; Li, S.M.; Xue, Z.; Dong, J.S.; Yang, L.X.; Gao, Y. Study on the technical parameters of drip irrigation for winter wheat in northern Henan Province. J. Soil Water Conserv. 2023, 37, 208–216. [Google Scholar]
  7. Yang, Y.P.; Yin, J.; Ma, Z.H.; Wei, X.D.; Sun, F.B.; Yang, Z. Water and Nitrogen Regulation Effects and System Optimization for Potato (Solanum tuberosum L.) under Film Drip Irrigation in the Dry Zone of Ningxia China. Agronomy 2023, 13, 308. [Google Scholar] [CrossRef]
  8. Xia, G.M.; Wang, Y.J.; Hu, J.Q.; Wang, S.J.; Zhang, Y.; Wu, Q.; Chi, D.C. Effects of supplemental irrigation on water and nitrogen use, yield, and kernel quality of peanut under nitrogen-supplied conditions. Agric. Water Manag. 2021, 243, 106518. [Google Scholar] [CrossRef]
  9. Si, Z.Y.; Gao, Y.; Shen, X.J.; Liu, H.; Duan, A.W. Effects of water and nitrogen availability on summer cotton yield, water and nitrogen use and soil nitrate nitrogen accumulation. J. Appl. Ecol. 2017, 28, 3945–3954. [Google Scholar]
  10. Wagg, C.; Hann, S.; Kupriyanovich, Y.; Li, S. Timing of short period water stress determines potato plant growth, yield and tuber quality. Agric. Water Manag. 2021, 247, 106731. [Google Scholar] [CrossRef]
  11. Kaur, H.; Kohli, S.K.; Khanna, K.; Bhardwaj, R. Scrutinizing the impact of water deficit in plants: Transcriptional regulation, signaling, photosynthetic efficacy, and management. Physiol. Plant. 2021, 172, 935–962. [Google Scholar] [CrossRef]
  12. Plaut, Z.; Butow, B.J.; Blumenthal, C.S.; Wrigley, C.W. Transport of dry matter into developing wheat kernels and its contribution to grain yield under post-anthesis water deficit and elevated temperature. Field Crops Res. 2004, 86, 185–198. [Google Scholar] [CrossRef]
  13. Hu, S.J.; Tian, C.Y.; Wang, F.; Song, Y.D.; Zhong, X.C.; Liang, Z.; Ma, X.W.; Feng, Y.Z. Preliminary study on the coupling effect of water and fertilizer on cotton under drip irrigation. Arid. Zone Resour. Environ. 2005, 02, 192–195. [Google Scholar]
  14. Yan, F.L.; Zhang, F.C.; Fan, X.K.; Fan, J.L.; Wang, Y.; Zou, H.Y.; Wang, H.D.; Li, G.D. Determining irrigation amount and fertilization rate to simultaneously optimize grain yield, grain nitrogen accumulation and economic benefit of drip-fertigated spring maize in northwest China. Agric. Water Manag. 2021, 243, 106440. [Google Scholar] [CrossRef]
  15. Zhang, Y.; Zhang, F.C.; Yuan, Y.X.; Qiang, S.C.; Fang, D.P. The effect of irrigation and fertilization on growth and quality of tomato under fertigation in greenhouse. Agric. Res. Arid Areas 2014, 32, 206–212. [Google Scholar]
  16. Wang, X.; Xiang, Y.Z.; Guo, J.J.; Tang, Z.J.; Zhao, S.T.; Wang, H.; Li, Z.J.; Zhang, F.C. Coupling effect analysis of drip irrigation and mixed slow-release nitrogen fertilizer on yield and physiological characteristics of winter wheat in Guanzhong area. Field Crops Res. 2023, 302, 109103. [Google Scholar] [CrossRef]
  17. Xia, G.M.; Chen, J.X.; Chi, D.C. Effect of water and nitrogen coupling effect of under-membrane drip irrigation on the yield of black peanut. China Rural. Water Conserv. Hydropower 2016, 401, 1–6. [Google Scholar]
  18. Zou, H.Y.; Fan, J.L.; Zhang, F.C.; Xiang, Y.Z.; Wu, L.F.; Yan, S.C. Optimization of drip irrigation and fertilization regimes for high grain yield, crop water productivity and economic benefits of spring maize in Northwest China. Agric. Water Manag. 2020, 230, 105986. [Google Scholar] [CrossRef]
  19. Xing, Y.Y.; Zhang, F.C.; Zhang, Y.; Li, J.; Qiang, S.C.; Wu, L.F. Effect of Irrigation and Fertilizer Coupling on Greenhouse Tomato Yield, Quality, Water and Nitrogen Utilization Under Fertigation. Sci. Agric. Sin. 2015, 48, 713–726. [Google Scholar]
  20. Qiu, H.N.; Yang, S.H.; Jiang, Z.W.; Xu, Y.; Jiao, X.Y. Effect of irrigation and fertilizer management on rice yield and nitrogen loss: A meta-analysis. Plants 2022, 11, 1690. [Google Scholar] [CrossRef] [PubMed]
  21. Zhang, J.X.; Wang, Q.Q.; Xia, G.M.; Wu, Q.; Chi, D.C. Continuous regulated deficit irrigation enhances peanut water use efficiency and drought resistance. Agric. Water Manag. 2021, 255, 106997. [Google Scholar] [CrossRef]
  22. Srivastava, R.K.; Panda, R.K.; Chakraborty, A.; Halder, D. Enhancing grain yield, biomass and nitrogen use efficiency of maize by varying sowing dates and nitrogen rate under rainfed and irrigated conditions. Field Crops Res. 2018, 221, 339–349. [Google Scholar] [CrossRef]
  23. Plaza-Bonilla, D.; Nolot, J.M.; Raffaillac, D.; Justes, E. Innovative cropping systems to reduce N inputs and maintain wheat yields by inserting grain legumes and cover crops in southwestern France. Eur. J. Agron. 2017, 82, 331–341. [Google Scholar] [CrossRef]
  24. Longnecker, N.; Kirby, E.J.M.; Robson, A. Leaf Emergence, Tiller Growth, and Apical Development of Nitrogen-Dificient Spring Wheat. Crop Sci. 1993, 33, 154–160. [Google Scholar] [CrossRef]
  25. Rodriguez, D.; Goudriaan, J. Effects of phosphorus and drought stresses on dry matter and phosphorus allocation in wheat. J. Plant Nutr. 1995, 18, 2501–2517. [Google Scholar] [CrossRef]
  26. Qi, Y.L.; Zhang, F.C.; Li, K.F. Effects of water deficit and nitrogen application on the growth and nitrogen uptake of winter wheat. J. Appl. Ecol. 2009, 20, 2399–2405. [Google Scholar]
  27. Liu, X.G.; Xu, H.; Cheng, J.H.; Jin, L.J.; Yang, Q.L.; Huang, Z.M. Effect of water-fertilizer coupling on the growth and water use of small-grain coffee seedlings. J. Zhejiang Univ. (Agric. Life Sci. Ed.) 2014, 40, 33–40. [Google Scholar]
  28. Fang, X.M.; Li, Y.S.; Nie, J.; Wang, C.; Huang, K.H.; Zhang, Y.K.; Zhang, Y.L.; She, H.Z.; Liu, X.B.; Ruan, R.W.; et al. Effects of nitrogen fertilizer and planting density on the leaf photosynthetic characteristics, agronomic traits and grain yield in common buckwheat (Fagopyrum esculentum M.). Field Crops Res. 2018, 219, 160–168. [Google Scholar] [CrossRef]
  29. Edmeades, G.O.; Daynard, T.B. The relationship between final yield and photosynthesis at flowering in individual maize plants. Can. J. Plant Sci. 1979, 59, 585–601. [Google Scholar] [CrossRef]
  30. Li, C.Y.; Kong, X.Q.; Luo, Z.; Li, W.J.; Tang, W.; Zhang, D.M.; Ma, C.L.; Dong, H.Z. Exogenous application of acetic acid improves the survival rate of cotton by increasing abscisic acid and jasmonic acid contents under drought stress. Acta Physiol. Plant. 2021, 43, 32. [Google Scholar] [CrossRef]
  31. Su, P.H.; Qi, G.P.; Kang, Y.X.; Wang, J.H.; Zhang, Z.P.; Li, X.M.; Cai, L.H.; Zhao, M. Effects of loss-regulating irrigation on photosynthetic characteristics and biomass of alfalfa under intercropping pattern of Chinese wolfberry and alfalfa. China Rural Water Conserv. Hydropower 2019, 442, 71–75+82. [Google Scholar]
  32. Shen, X.J.; Sun, J.S.; Zhang, J.Y.; Gao, Y.; Wang, J.L.; Liu, H. Effect of water regulation on yield and water use efficiency of wheat stubble cotton. J. Agric. Mach. 2014, 45, 150–160. [Google Scholar]
  33. Li, P.C.; Dong, H.L.; Liu, A.Z.; Liu, J.R.; Li, R.Y.; Sun, M.; Li, Y.B.; Mao, S.C. Effect of nitrogen application on physiological characteristics, nitrogen use efficiency and yield of functional leaves in cotton. J. Plant Nutr. Fertil. 2015, 21, 81–91. [Google Scholar]
  34. Ye, T.Y.; Ma, J.F.; Zhang, P.; Shan, S.; Liu, L.L.; Tang, L.; Cao, W.X.; Liu, B.; Zhu, Y. Interaction effects of irrigation and nitrogen on the coordination between crop water productivity and nitrogen use efficiency in wheat production on the North China Plain. Agric. Water Manag. 2022, 271, 107787. [Google Scholar] [CrossRef]
  35. He, P.Y.; Zhang, Y.; Zhou, L.; Zhou, L.; Huang, K.F.; Huang, X.Y. Effects of drought stress and nitrogen fertilizer regulation on morphology, physiological characteristics and yield of buckwheat plants. J. Appl. Environ. Biol. 2022, 28, 128–134. [Google Scholar]
  36. Wang, X.B.; Shangguan, Z.P. Regulation of nitrogen on root vigor and growth of different genotypes of wheat under drought stress. J. Wheat Crops 2017, 37, 820–827. [Google Scholar]
  37. Cong, X.; Zhang, L.Z.; Xu, Z.H.; Pang, G.B.; Feng, Y.M.; Zhao, D.L. Effects of water and nitrogen intercropping on water and fertilizer use efficiency and economic benefits of winter wheat. J. Agric. Mach. 2021, 52, 315–324. [Google Scholar]
  38. Feng, S.Y.; Wang, F.X.; Huang, G.H. Field experimental study on the coupling effect of water and fertilizer on peanut under sprinkler irrigation. J. Agric. Eng. 1998, 4, 98–102. [Google Scholar]
  39. Xia, G.M.; Chu, F.Y.; Chen, J.X.; Chen, G.M.; Yao, Z.Z. Effects of different irrigation amounts on yield and water use efficiency of black peanut based on sub-membrane drip irrigation. J. Shenyang Agric. Univ. 2015, 46, 119–123. [Google Scholar]
  40. Ren, G.; Wu, Z.B.; Zhang, H.Q. Experimental study on water consumption pattern of peanut and its water-saving irrigation system. Shanxi Water Conserv. Sci. Technol. 2009, 84–86. [Google Scholar]
  41. Li, J.P.; Wang, Z.M.; Song, Y.H.; Li, J.C.; Zhang, Y.H. Effects of reducing nitrogen application rate under different irrigation methods on grain yield, water and nitrogen utilization in winter wheat. Agronomy 2022, 12, 1835. [Google Scholar] [CrossRef]
  42. Al-Kaisi, M.M.; Yin, X. Effects of nitrogen rate, irrigation rate, and plant population on corn yield and water use efficiency. Agron. J. 2003, 95, 1475–1482. [Google Scholar] [CrossRef]
  43. Huang, C.; Liu, Z.D.; Zhao, B.; Zhang, K.; Ning, D.F.; Qin, A.Z.; Li, S. Research on photosynthetic and water consumption characteristics of summer maize at different yield levels. J. Irrig. Drain. 2019, 38, 19–28. [Google Scholar]
  44. Aujla, M.S.; Thind, H.S.; Buttar, G.S. Cotton yield and water use efficiency at various levels of water and N through drip irrigation under two methods of planting. Agric. Water Manag. 2005, 71, 167–179. [Google Scholar] [CrossRef]
  45. Allen, R.G.; Pereira, L.S.; Raes, D.; Smith, M. Crop evapotranspiration-Guidelines for computing crop water requirements-FAO Irrigation and drainage paper 56. Fao Rome 1998, 300, D05109. [Google Scholar]
  46. Announcement No. 133 of the Ministry of Agriculture and Rural Affairs of the People’s Republic of China. Gazette of the Ministry of Agriculture and Rural Affairs of the People’s Republic of China, 29 January 2019; p. 62.
  47. Shen, X.J.; Sun, J.S.; Zhang, J.Y.; Song, N.; Liu, X.F.; Yang, L. Research on the calculation of average soil water content under drip irrigation conditions. J. Soil Water Conserv. 2011, 25, 241–244+253. [Google Scholar]
  48. Shen, X.J. Real-Time Irrigation Forecasting Technology for Cotton with under-Membrane Drip Irrigation; Shihezi University: Shihezi, China, 2008. [Google Scholar]
Figure 1. Precipitation and ETo in the peanut growth period under mulched drip irrigation in Xinjiang.
Plants 12 03368 g001
Figure 2. Layout of drip irrigation in the peanut field under film mulching (mm).
Plants 12 03368 g002
Table 1. Effects of water and nitrogen regulation on the growth traits of peanuts under mulched drip irrigation in Xinjiang.
TreatmentMain Stem Height (cm)First Branch Length (cm)Branch Number (pcs·plant−1)Shoot Dry Mass (kg·ha−1)LAI
Seedling StageFlowering–Pegging StagePod-Setting StagePod-Filling StageSeedling StageFlowering–Pegging StagePod-Setting StagePod-Filling StageSeedling stageFlowering–Pegging StagePod-Setting StagePod-Filling StageSeedling StageFlowering–Pegging StagePod-Setting StagePod-Filling StageSeedling StageFlowering–Pegging StagePod-Setting StagePod-Filling Stage
W1N23.23 bc11.60 abc16.47 c19.53 d3.20 b12.03 ab17.37 bc23.50 c8.67 a12.67 ab13.67 ab14.67 b752.59 a3937.19 c6848.20 cd8712.30 cd0.53 a0.91 bc3.85 b4.47 cd
W2N23.97 ab12.30 ab19.17 ab26.73 b3.97 ab13.13 a18.33 b33.10 a7.67 a12.67 ab16.00 a17.00 a760.89 a4778.07 a11,231.80 a18,409.09 a0.51 a1.66 a4.73 a8.56 a
W3N22.77 bc13.67 a19.77 a28.13 a3.40 ab13.73 a23.67 a33.40 a8.67 a13.33 a16.00 a16.67 a789.93 a4659.56 ab8225.98 bc11,868.84 b0.51 a1.14 b4.64 a7.34 b
W1N14.57 a8.93 d10.40 e15.50 e4.33 a9.20 c9.83 d18.47 e7.67 a10.00 c12.33 b12.67 c719.41 a1598.81 e4520.69 e6709.33 d0.51 a0.74 c1.96 d2.88 e
W2N13.20 bc10.07 bcd16.07 c24.13 c4.07 ab11.53 ab14.93 c26.97 b8.00 a12.33 ab14.33 ab14.67 b685.04 a4118.52 bc7689.28 bc9256.69 bcd0.5 a0.93 bc4.06 ab4.78 c
W3N13.50 abc11.50 abc18.40 b26.10 b4.03 ab12.23 ab19.93 b27.40 b7.33 a12.00 b15.00 a15.67 ab744.30 a4699.85 ab8727.51 b10,353.78 bc0.52 a1.14 b4.25 ab5.4 c
W2N02.60 c9.43 cd15.00 d19.07 c3.60 ab10.80 bc14.77 b20.23 d8.00 a11.67 b14.00 ab15.00 b764.44 a2680.89 d6123.85 d8255.21 cd0.49 a0.43 d2.75 c3.63 cd
Wns******ns******ns******ns******ns******
Nns******ns******ns****ns******ns******
W × Nnsns****nsnsns *ns*nsnsns******ns***
Note: Different lowercase letters show that mean values are significantly different from one another at p ≤ 0.05. “ns” means not significant (p > 0.05); “*” means significant (p ≤ 0.05); “**” means extremely significant (p ≤ 0.01); the same is the case in the tables below.
Table 2. Effects of water and nitrogen regulation on the physiological indexes of peanuts under mulched drip irrigation in Xinjiang.
TreatmentSPADNet Photosynthetic Rate (µmol m−2 s−1)Transpiration Rate (mmol m−2 s−1)Stomatal Conductance (mol m−2 s−1)
Seedling StageFlowering–Pegging StagePod-Setting StagePod-Filling StageFlowering–Pegging StagePod-Setting StagePod-Filling StageFlowering–Pegging StagePod-Setting StagePod-Filling StageFlowering–Pegging StagePod-Setting StagePod-Filling Stage
W1N249.70 a50.37 de54.50 d44.90 c13.79 de9.50 d5.26 c3.36 bc2.02 d1.73 a0.14 b0.07 c0.04 b
W2N250.30 a53.90 a58.90 a54.23 a17.49 a14.30 a7.03 a6.43 a2.88 a1.95 a0.31 a0.12 a0.05 a
W3N250.77 a52.43 b58.03 b47.80 b15.47 b10.91 c6.75 ab4.18 b2.77 a1.73 a0.18 b0.08 b0.05 ab
W1N149.80 a50.27 de50.30 f41.73 d14.31 cd7.81 e1.41 d2.16 d1.61 e0.37 c0.08 b0.04 d0.01 d
W2N150.63 a51.17 cd55.23 c45.30 c14.53 bcd9.67 d1.86 d5.95 a2.31 c0.94 b0.28 a0.07 c0.02 c
W3N149.80 a52.13 bc57.83 b47.37 b15.08 bc12.14 b4.46 c3.34 bc2.41 b1.81 a0.14 b0.08 c0.05 ab
W2N049.37 a50.00 e51.67 e44.07 c13.05 e7.05 e5.64 bc2.59 cd2.14 d1.59 a0.13 b0.06 c0.05 ab
Wns************************
Nns***********************
W × Nns*****ns****ns***ns****
Note: Different lowercase letters show that mean values are significantly different from one another at p ≤ 0.05. “ns” means not significant (p > 0.05); “*” means significant (p ≤ 0.05); “**” means extremely significant (p ≤ 0.01).
Table 3. Effects of water and nitrogen regulation on the yield index and water use efficiency of peanuts under mulched drip irrigation in Xinjiang.
TreatmentPod Yield (Mg·ha−1)100-Pod Weight(g)500 g Pod Number (pcs)Kernel Rate (%)100-Kernel Weight (g)Pod per Plant (pcs)Pod Weight per Plant (g)WUE
(kg·m−3)
IWUE
(kg·m−3)
NPP
(kg·kg−1)
W1N22.7486 d140.82 d373.00 b61.76 e63.24 de15.67 bc17.75 cd0.86 d1.06 d24.99 e
W2N24.5227 b179.42 b301.00 cd68.29 abc77.44 c19.00 b22.84 bc1.25 ab1.38 a41.12 c
W3N25.2974 a208.54 a257.67 e70.83 a95.42 a24.00 a31.14 a1.32 a1.41 a48.16 b
W1N12.2489 d136.58 d407.00 a62.93 de58.64 e13.00 c14.82 d0.68 e0.86 e29.02 d
W2N13.6982 c165.26 c314.33 c66.47 bc72.86 c18.00 b21.11 abc1.01 cd1.12 c47.72 b
W3N14.6977 b180.81 b281.67 de69.13 ab85.29 b19.67 b25.67 ab1.15 bc1.24 b60.61 a
W2N03.3983 c156.48 c350.00 b65.61 cd70.33 cd17.67 b20.43 abc0.91 d1.08 d-
W********************
N******ns**nsns******
W × N***nsnsnsnsns******
Note: Different lowercase letters show that mean values are significantly different from one another at p ≤ 0.05. “ns” means not significant (p > 0.05); “*” means significant (p ≤ 0.05); “**” means extremely significant (p ≤ 0.01).
Table 4. The correlation coefficients of the growth index, with the yield and yield components.
IndexPod Yield100-Pod Weight500 g Pod NumberKernel Rate100-Kernel WeightPod per PlantPod Weight per Plant
Main stem height0.928 **0.902 **−0.950 **0.791 **0.870 **0.769 **0.759 **
First branch Length0.873 **0.843 **−0.842 **0.694 **0.785 **0.700 **0.691 **
Branch number0.803 **0.730 **−0.712 **0.555 **0.695 **0.713 **0.598 **
Shoot dry mass0.613 **0.561 **−0.538 *0.519 *0.4270.4260.336
LAI0.735 **0.715 **−0.706 **0.603 **0.652 **0.616 **0.654 **
Note: “*” means significant (p ≤ 0.05); “**” means extremely significant (p ≤ 0.01).
Table 5. Effects of different treatments on the water consumption of peanuts under mulched drip irrigation in Xinjiang.
TreatmentSeedling StageFlowering–Pegging StagePod-Setting StagePod-Filling StageTotal Growth
Stage
Water Consumption(mm)Water Consumption Intensity
(mm·d−1)
Water Consumption Percentage
(%)
Water Consumption(mm)Water Consumption Intensity
(mm·d−1)
Water Consumption Percentage
(%)
Water Consumption(mm)Water Consumption Intensity
(mm·d−1)
Water Consumption Percentage
(%)
Water Consumption(mm)Water Consumption Intensity
(mm·d−1)
Water Consumption Percentage
(%)
Water Consumption(mm)
W1N248.261.7215.02102.433.5331.88131.703.5640.9938.950.8712.12321.33
W2N251.661.8514.33114.983.9631.91151.614.1042.0742.130.9411.69360.38
W3N250.341.8012.50121.564.1930.20176.374.7743.8154.301.2113.49402.57
W1N147.091.6814.28104.863.6231.79137.813.7241.7840.050.8912.14329.81
W2N150.431.8013.74120.084.1432.73153.474.1541.8342.930.9511.70366.91
W3N148.441.7311.88126.704.3731.08178.164.8243.7154.301.2113.32407.60
W2N049.521.7713.29122.904.2432.99155.604.2141.7744.490.9911.94372.51
Table 6. The correlation coefficients.
Indexx1x2x3x4x5x6x7x8x9x10
x1-
x20.935 **-
x3−0.942 **−0.938 **-
x40.853 **0.862 **−0.845 **-
x50.932 **0.952 **−0.947 **0.830 **-
x60.784 **0.761 **−0.770 **0.613 **0.797 **-
x70.784 **0.786 **−0.783 **0.615 **0.826 **0.784 **-
x80.947 **0.876 **−0.908 **0.765 **0.877 **0.776 **0.803 **-
x90.896 **0.806 **−0.842 **0.689 **0.818 **0.729 **0.761 **0.985 **-
x100.798 **0.710 **−0.808 **0.731 **0.760 **0.634 **0.664 **0.707 **0.608 **-
Note: “**” means extremely significant (p ≤ 0.01).
Table 7. The membership function method.
TreatmentMembership Function Value
R(x1)R(x2)R(x3)R(x4)R(x5)R(x6)R(x7)R(x8)R(x9)R(x10)
W1N20.1450.1600.3070.1910.2340.2620.1290.2370.3070.046
W2N20.6590.6000.7160.6350.5590.5000.3180.7820.8030.452
W3N20.8840.9310.9620.8080.9710.8570.6240.8650.8360.629
W1N10.0000.1120.1140.2700.1290.0710.0210.0000.0000.147
W2N10.4200.4390.6400.5110.4540.4290.2530.4450.3900.618
W3N10.7100.6160.8260.6920.7390.5480.4220.6420.5810.943
W2N00.3330.3380.4380.4530.3970.4050.2280.3140.337-
Table 8. Principal component analysis.
ComponentEigenvalueVariance (%)Contribution Rate (%)
18.39983.98983.989
20.5745.74489.733
30.3873.87193.604
40.2422.41996.023
50.2042.03598.059
60.1131.13499.193
70.0470.46699.659
80.0270.26899.927
90.0060.06299.989
100.0010.011100.000
Table 9. Principal component matrix.
IndexPrincipal Component
12
x10.987−0.038
x20.953−0.078
x3−0.9670.109
x40.863−0.383
x50.964−0.046
x60.8690.316
x70.8590.277
x80.9620.15
x90.9150.258
x100.807−0.375
Table 10. The comprehensive scores of different treatments.
TreatmentPrincipal Component AnalysisMembership Function Method
Comprehensive ScoreComprehensive RankingComprehensive ScoreComprehensive Ranking
W1N2−2.03560.2026
W2N21.48630.6023
W3N24.00410.8371
W1N1−3.85170.0867
W2N1−0.28740.4604
W3N11.53820.6722
W2N0−0.85650.3245
Table 11. Physical and chemical soil indexes.
Soil Layer (cm)Available p (mg·kg−1)Available K (mg·kg−1)Alkaline
Hydrolysis N (mg·kg−1)
Organic Matter (g·kg−1)Bulk Density (g·cm−3)
0–2023.77199.0642.9814.861.35
20–4022.17169.3332.0414.281.43
40–6022.86114.4643.419.731.44
Table 12. Experimental design.
TreatmentIrrigation Quota (mm)Irrigation Cycle (d)Fertilizer-N Application Rate (kg·ha−1)
Sowing–Emergence StageSeedling StageFlowering–Pegging StagePod-Setting StagePod-Filling StageSeedling StageFlowering–Pegging StagePod-Setting StagePod-Filling Stage
W1N245-22.522.522.5-101015110
W2N245-303030-101015110
W3N245-37.537.537.5-101015110
W1N145-22.522.522.5-10101577.5
W2N145-303030-10101577.5
W3N145-37.537.537.5-10101577.5
W2N045-303030-1010150
Table 13. The actual irrigation and fertilization times, irrigation volumes, and nitrogen application rates during the peanut growth period.
Day after Sowing (d)Irrigation Quota (mm)Fertilizer–N Application Rate (kg·ha−1)
W1N2W2N2W3N2W1N1W2N1W3N1W2N0W1N2W2N2W3N2W1N1W2N1W3N1W2N0
145.00 45.00 45.00 45.00 45.0045.00 45.00 454545454545-
3225.34 30.93 23.02 24.91 27.5328.36 19.57 16.2516.2516.258.1258.1258.125-
4223.27 30.00 42.28 22.90 31.1137.50 30.00 16.2516.2516.258.1258.1258.125-
5322.50 30.00 37.50 22.50 30.0037.50 30.00 16.2516.2516.258.1258.1258.125-
6222.50 30.00 37.50 22.02 30.0037.50 30.00 16.2516.2516.258.1258.1258.125-
7422.50 33.15 37.50 22.50 30.0038.67 30.00 -------
8422.50 37.53 46.90 24.00 37.5345.09 37.53 -------
10130.00 37.53 45.00 30.49 37.5346.57 39.26 -------
11822.50 30.00 37.50 23.49 30.0037.99 30.00 -------
13022.50 22.53 24.50 22.53 30.5322.53 22.53 -------
Disclaimer/Publisher’s Note: The statements, opinions and data contained in all publications are solely those of the individual author(s) and contributor(s) and not of MDPI and/or the editor(s). MDPI and/or the editor(s) disclaim responsibility for any injury to people or property resulting from any ideas, methods, instructions or products referred to in the content.

