Article

Identification and Expression Analysis of EPSPS and BAR Families in Cotton

State Key Laboratory of North China Crop Improvement and Regulation, Key Laboratory for Crop Germplasm Resources of Hebei, College of Agronomy, Hebei Agricultural University, Baoding 071000, China
*
Authors to whom correspondence should be addressed.
These authors contributed equally to this work.
Plants 2023, 12(19), 3366; https://doi.org/10.3390/plants12193366
Submission received: 16 June 2023 / Revised: 18 September 2023 / Accepted: 19 September 2023 / Published: 23 September 2023

Abstract

:
Weeds seriously affect the yield and quality of crops. Because manual weeding is time-consuming and laborious, the use of herbicides becomes an effective way to solve the harm caused by weeds in fields. Both 5-enolpyruvyl shikimate-3-phosphate synthetase (EPSPS) and acetyltransferase genes (bialaphos resistance, BAR) are widely used to improve crop resistance to herbicides. However, cotton, as the most important natural fiber crop, is not tolerant to herbicides in China, and the EPSPS and BAR family genes have not yet been characterized in cotton. Therefore, we explore the genes of these two families to provide candidate genes for the study of herbicide resistance mechanisms. In this study, 8, 8, 4, and 5 EPSPS genes and 6, 6, 5, and 5 BAR genes were identified in allotetraploid Gossypium hirsutum and Gossypium barbadense, diploid Gossypium arboreum and Gossypium raimondii, respectively. Members of the EPSPS and BAR families were classified into three subgroups based on the distribution of phylogenetic trees, conserved motifs, and gene structures. In addition, the promoter sequences of EPSPS and BAR family members included growth and development, stress, and hormone-related cis-elements. Based on the expression analysis, the family members showed tissue-specific expression and differed significantly in response to abiotic stresses. Finally, qRT-PCR analysis revealed that the expression levels of GhEPSPS3, GhEPSPS4, and GhBAR1 were significantly upregulated after exogenous spraying of herbicides. Overall, we characterized the EPSPS and BAR gene families of cotton at the genome-wide level, which will provide a basis for further studying the functions of EPSPS and BAR genes during growth and development and herbicide stress.

1. Introduction

With the global climate and environmental change, the growth and development of crops are affected by various stresses, such as drought, salt, low temperatures, and weeds [1]. These stresses affect plants by changing plant physiological and metabolic reactions, causing irreversible damage or even death, and ultimately affecting crop yield [2]. Among them, weeds are an obstacle in the agricultural production process, which not only competes with crops for sunlight, water, and nutrients but also spreads some diseases and pests, which greatly threaten the growth of crops [3,4]. Therefore, weed control is a problem that cannot be ignored in agricultural production; it will affect the yield and quality of crops [5]. At present, the main method used to control weeds is to spray chemical herbicides. However, herbicides are limited because of their broad spectrum of extinction in agriculture, which also causes crops to be damaged while weeds are controlled in the field [6,7].
Currently, the most widely used herbicides are glyphosate and glufosinate [8]. For each of these herbicides, there are specific genes that can inhibit it. Firstly, 5-enolpyruvyl shikimate-3-phosphate synthetase (EPSPS) is the only enzyme that targets glyphosate, the most widely used broad-spectrum herbicide today [9]. The inhibition of glyphosate on EPSPS enzyme will increase the content of shikimic acid and hinder the synthesis of phenylalanine, tryptophan, and tyrosine of aromatic amino acids, thus causing the plant to wither and die [10,11]. Therefore, the expression level of EPSPS can directly affect the resistance of plants to glyphosate. Phenylalanine, tyrosine, and tryptophan are the essential amino acids of the three aromatic groups in plants, which need to be synthesized by the shikimic acid pathway [12]. However, EPSPS is a key enzyme in the shikimic acid pathway, which is widely found in higher plants and microorganisms. It can catalyze the production of EPSP synthetase from shikimic acid 3-phosphate (S3P) and phosphopyruvate (PEP) in chloroplasts, and eventually produce hormones and other important plant metabolites through this step, including growth kinins, aromatic amino acids, lignin, flavonoids, phenols, salicylic acid, and other secondary metabolites involved in plant defense [13,14]. As an important component of plant and microbial survival, the biosynthesis of aromatic amino acids and aromatic compounds through the shikimic acid pathway is essential for their continued existence [15]. The second is the acetyltransferase BAR gene cloned from the soil bacteria Streptomyces absorbentus, which is resistant to phosphinothricin (PPT), the active component of the herbicide PPT [16]. PPT is a potent inhibitor of glutamine synthase (GS), a key enzyme in the nitrogen assimilation pathway. When glutamine synthase is inhibited, NH3 accumulates, resulting in plant toxicity and death [16]. The herbicides with PPT activity have a conductive type of extermination, a wide range of herbicides, and can kill both above-ground and underground parts of plants [17]. BAR gene encodes phosphinothricin acetyltransferase (PAT), and PAT protein can free aminoacetylation of the active ingredient of herbicide PPT, thus detoxifying it so that it cannot inhibit the activity of GS [16,17]. The mechanism of resistance is the production of enzymes or enzyme systems that modify herbicides and degrade or detoxify them before they can act [18].
EPSPS has multiple homologous genes in plants and may play a key role in plant growth and development. Two EPSPS genes have been found in Arabidopsis thaliana and Arabidopsis lyrata, respectively [19], and three EPSPS homologous genes were found in wheat and rice, respectively [20,21]. Two EPSPS genes were found in tobacco and petunia, respectively [22]. In addition, glyphosate-resistant and glufosinate-resistant crops have been widely developed through transgenic. Transgenic CP4 EPSPS corn NK603 has a high tolerance to glyphosate [23]. Transgenic rice with the CP4 EPSPS gene can tolerate up to 1% of the commercial herbicide Roundup, which has a significant effect on overcoming the weed threat [24]. Transgenic tobacco with the EPSPS gene had a higher tolerance to herbicide stress [25]. In soybeans, co-expression of G2-EPSPS and GAT genes confers a high tolerance to the soybean herbicide glyphosate [26]. The BAR gene is widely used as herbicide-resistant gene in genetic engineering breeding, and it is also a marker gene in genetic transformation [27]. Transgenic BAR sweet potato can normally grow and develop under the stress of glufosinate basta [28]. Transgenic BAR wheat can tolerate very high concentrations of glufosinate and has no effect on yield [29]. The expression of the BAR gene was the highest in leaves of herbicide-tolerant maize with the BAR gene, which showed a high tolerance to glufosinate [30]. In addition, EPSPS and BAR have also been applied in cotton. Glyphosate-resistant cotton strain pGR79 EPSPS-pGAT showed a five-fold increase in resistance to glyphosate [31]. Transgenic EPSPS, Cry1Ac, and Cry2Ab three-gene cotton line NIBGE-E2 can tolerate herbicide at 1100 mL/Acre [32]. Transgenic G2-aroA cotton K312 has high resistance to glyphosate [33]. BAR-transgenic cotton BR001 is resistant to 20 mL·L−1 glufosinate herbicide [34,35].
Cotton is an important cash crop and is also the main natural fiber raw material of the textile industry [36]. With the completion of cotton genomes, diploid and tetraploid cotton genomes have been sequenced. Two highly homologous EPSPS genes were identified in G. hirsutum ‘Y18′ [37], and four EPSPS genes were found based on G. hirsutum ‘TM-1′ genome [38]. In addition, two EPSPS genes were discovered in G. raimondii [19], which are also highly homologous. However, there is no comprehensive identification among diploid and tetraploid cotton genomes. For the BAR genes, there is no report on the genome-level analysis of the BAR family gene in cotton. In recent years, the emergence of higher quality heterotetraploid genome sequences of G. hirsutum NDM8 and G. barbadense Pima90 has facilitated the systematic identification of this family of genes [39].
In this study, we will identify and analyze the EPSPS and BAR families of four cotton genomes through bioinformatics methods and tools and reveal the evolutionary mechanism of EPSPS and BAR genes. Further, the expression pattern of these genes was investigated under herbicide stress. The results will provide insights into the EPSPS and BAR gene families during growth and development and candidate genes for further study on the mechanism of herbicide resistance in cotton.

2. Results

2.1. Identification of EPSPS and BAR Family Gene Members

Based on the genomes of G. hirsutum NDM8, G. barbadense Pima90, G. arboreum, and G. raimondii, a total of 25 EPSPS gene sequences were detected in the four cotton species. In total, 8, 8, 4, and 5 EPSPS genes were identified, respectively (Table 1). They were named GhEPSPS1~GhEPSPS8, GbEPSPS1~GbEPSPS8, GaEPSPS1~GaEPSPS4, and GrEPSPS1~GrEPSPS5 in order according to their distribution characteristics on the chromosomes (Figure 1A). The EPSPS family members identified in G. hirsutum and G. barbadense were distributed on chromosomes A07, A12, A13, D07, D12, and D13, with two EPSPS family members on both A12 and D12, which in G. arboreum were distributed on Chr07, Chr12 and Chr13, with two genes on Chr12. In G. raimondii, they were distributed on Chr01, Chr08, and Chr13, with three genes on Chr08. We found that GhEPSPS and GbEPSPS genes not only share the same number but also have similar gene structures, indicating that EPSPS genes are highly conserved between G. hirsutum and G. barbadense.
Similarly, a total of 22 BAR genes were detected in four cotton genomes. In all, 6, 6, 5, and 5 BAR family members were identified (Table 2). They were named GhBAR1~GhBAR6, GbBAR1~GbBAR6, GaBAR1~GaBAR5, and GrBAR1~GrBAR5 in order according to their distribution characteristics on the chromosomes (Figure 1B). The BAR family members identified in both G. hirsutum and G. barbadense were distributed on chromosomes A02, A08, D03, and D08, with 2 BAR family members on both A08 and D08, which in G. arboreum were distributed on Chr03, Chr05 and Chr08, with 2 genes on Chr05 and Chr08. In G. raimondii, BAR genes were found on Chr04, Chr05, Chr06 and Chr13, with 2 genes on Chr04. Interestingly, the number of BAR family members, chromosome distribution, and structural similarities between the two tetraploid cotton species are also consistent, suggesting that BAR genes are highly conserved between G. hirsutum and G. barbadense.

2.2. Sequence Characterization and Protein Properties of EPSPS and BAR Family Members

Analysis of the properties of the four cotton EPSPS genes revealed that the full length of all family members was between 1797 and 4159 bp, except for the GbEPSPS3 and GaEPSPS3 (915 bp). The number of exons of EPSPS family members ranged from four to nine, with GaEPSPS1 and GrEPSPS2 having the most exons (nine) and GbEPSPS3 and GaEPSPS3 having only four exons. Analysis of the physicochemical properties of the proteins showed that the number of amino acids ranged from 185~521 aa, the molecular masses ranged from 20.56~55.54 kDa, and the theoretical isoelectric points ranged from 5.67~8.73 (Table 1).
Among the four cotton BAR family members, the full length of all family members ranged from 1627~5007 bp, except for the GbBAR4 (14,746 bp) gene, which was the longest, and GaBAR1 (561 bp), GrBAR3 (957 bp), GrBAR4 (508 bp) and GrBAR5 (992 bp), which were shortest. The number of exons for the BAR family members ranged from one to six, with GhBAR1, GhBAR6, GbBAR3, GbBAR6, and GrBAR2 having the most exons (6), while GhBAR1, GaBAR1 and GrBAR3 had only one exon (Table 2). The physicochemical properties of the proteins were analyzed, with amino acid numbers ranging from 89~277 aa, molecular masses between 10.23~31.75 kDa, and theoretical isoelectric points between 6.47~9.64 (Table 2).

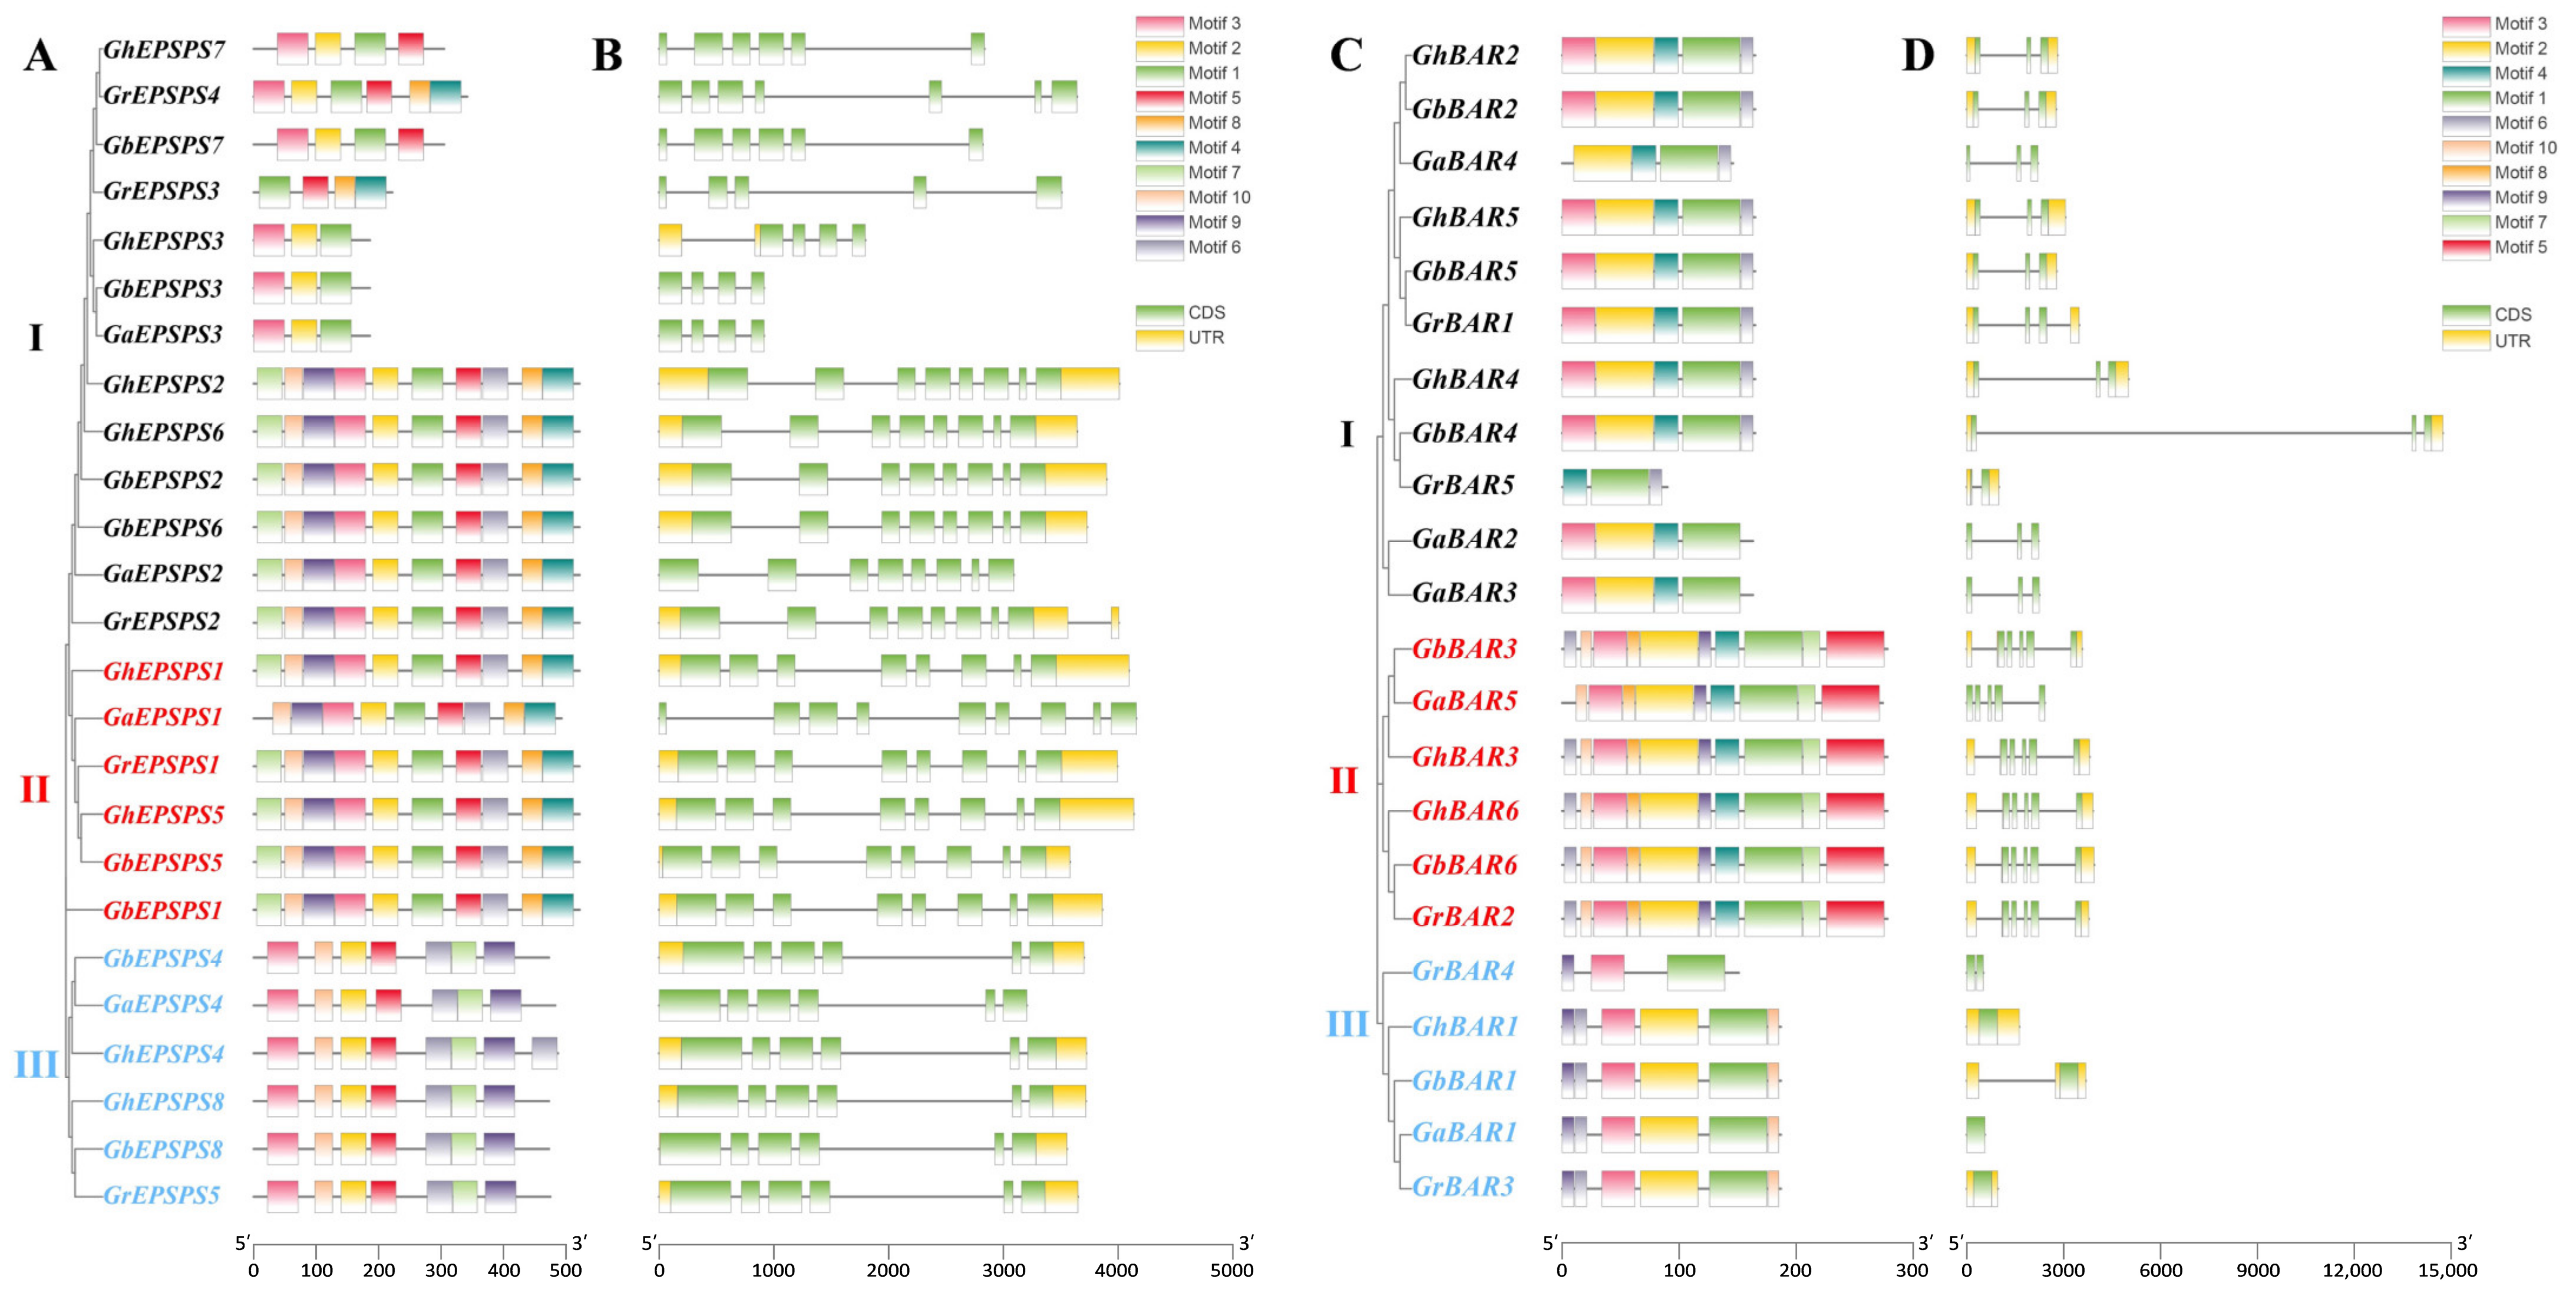
2.3. Analyses of Gene Structures and Protein Motifs of EPSPS and BAR Genes

The conserved motifs and gene structures of the 25 EPSPS family members were analyzed (Figure 2A,B), and the EPSPS family was divided into three subgroups (I, II, and III) based on Motif characteristics and gene structure. In subgroup I, most genes contained eight exons, and all but six genes had ten Motifs, while the rest had three to six Motifs. The majority of genes contained eight exons, with GaEPSPS1 having the highest number of introns (nine) and the gene not having a Motif7, while the rest had ten Motifs in subgroup II. All genes had six exons and had seven identical Motifs in subgroup III.
The 22 BAR family members are divided into three subgroups (I, II, and III) (Figure 2C,D). Subgroup I has all genes with three exons except for GrBAR5, which contains only one exon, and the number of Motifs ranges from three to five; subgroup II family members all have five exons, except for GaBAR5, which does not have Motif6, and the rest of the genes have ten Motifs; subgroup III has the majority of genes containing two exons, four genes have six Motifs, and the number of Motifs ranges from three to six.
These results suggest that the cotton EPSPS and BAR gene families are evolutionarily well conserved, and some EPSPS and BAR members in the same subgroup have similar gene structures.

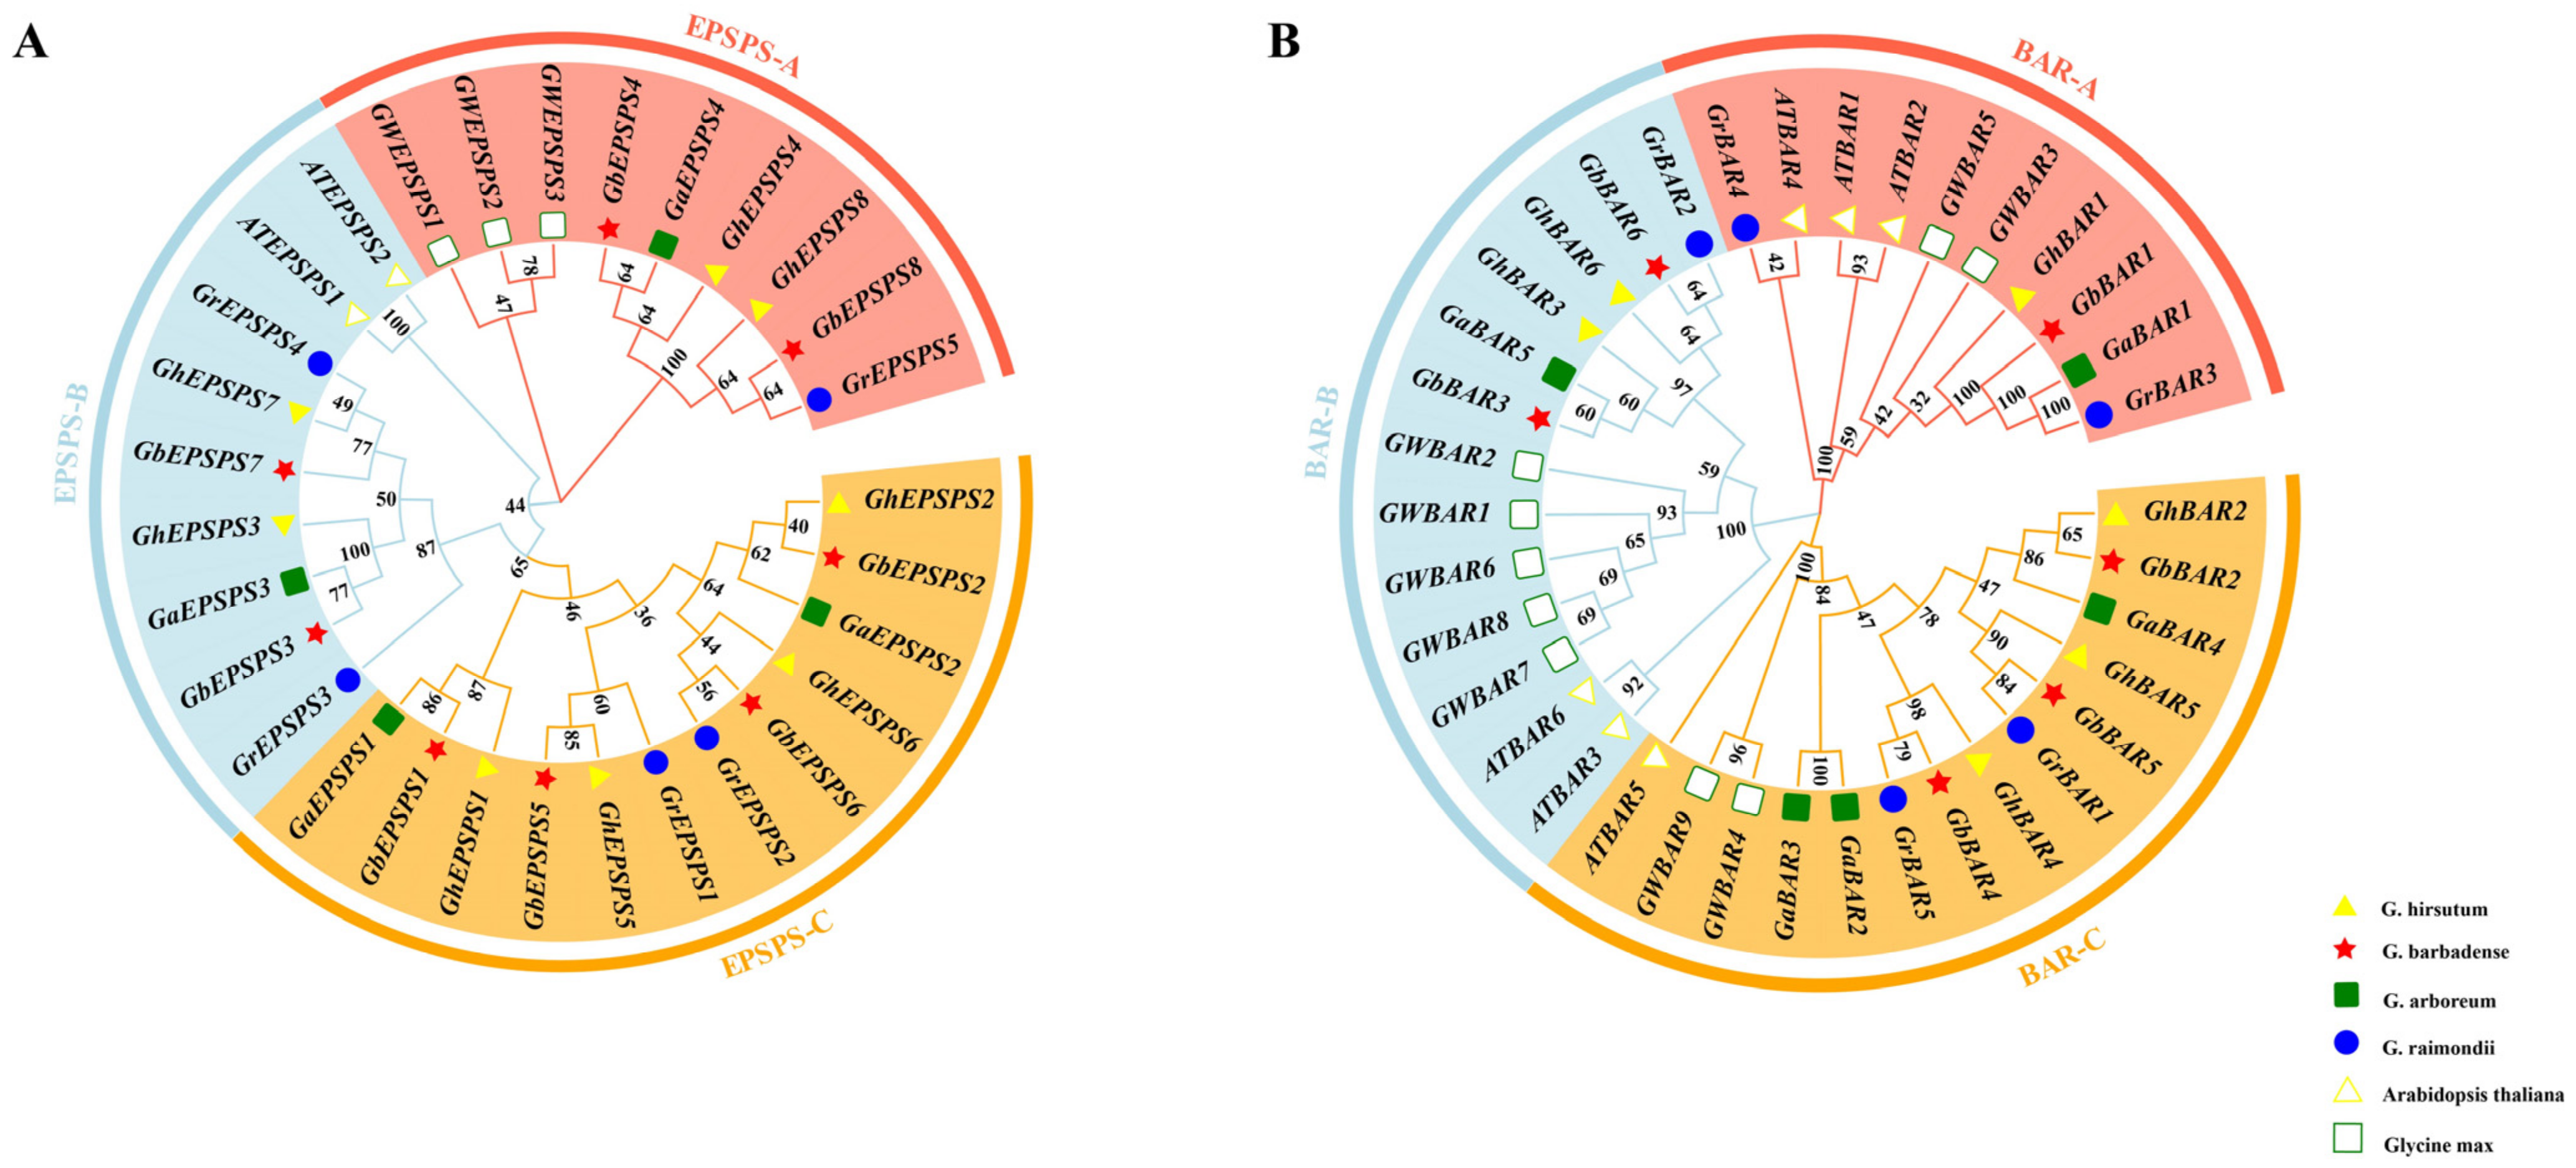
2.4. Phylogenetic Analysis of the EPSPS and BAR Gene Family

To reveal the evolutionary relationships of the EPSPS gene family, a phylogenetic tree was constructed using multiple sequence alignment analysis of the protein sequences of twenty-five cotton, two Arabidopsis, and three soybean EPSPS genes (Figure 3A). The results showed that the EPSPS gene family was divided into three subgroups (A, B, and C). Subgroup A includes two branches, with six cotton EPSPS family members as one branch and three soybean family members as one branch, indicating the relative evolutionary independence of EPSPS genes in plants. Subgroup B contains two Arabidopsis and seven cotton EPSPS family members, indicating that EPSPS is evolutionarily conserved and homologous. Subgroup C includes twelve members of the cotton EPSPS family. It was further found that only cotton EPSPS genes are found inside subgroup C, indicating that subgroup C is a unique EPSPS gene formed during the evolutionary history of cotton, suggesting that cotton EPSPS genes may have generated functional differentiation during evolution.
The phylogenetic tree showed the twenty-two BAR family members were divided into three subgroups (A, B, and C) along with six Arabidopsis and nine soybean BAR family members (Figure 3B). Among these subgroups, subgroup C contains the most members with eleven cotton BAR family members, subgroup B contains six cotton BAR family members, and subgroup A contains five cotton BAR family members. Subgroup A contains two Arabidopsis and three soybean genes, subgroup B contains two Arabidopsis and five soybean genes, and subgroup C has one Arabidopsis and two soybean genes, indicating that the cotton BAR family members are closely related to the Arabidopsis and soybean family members, and they may have conserved physiological and biochemical functions.

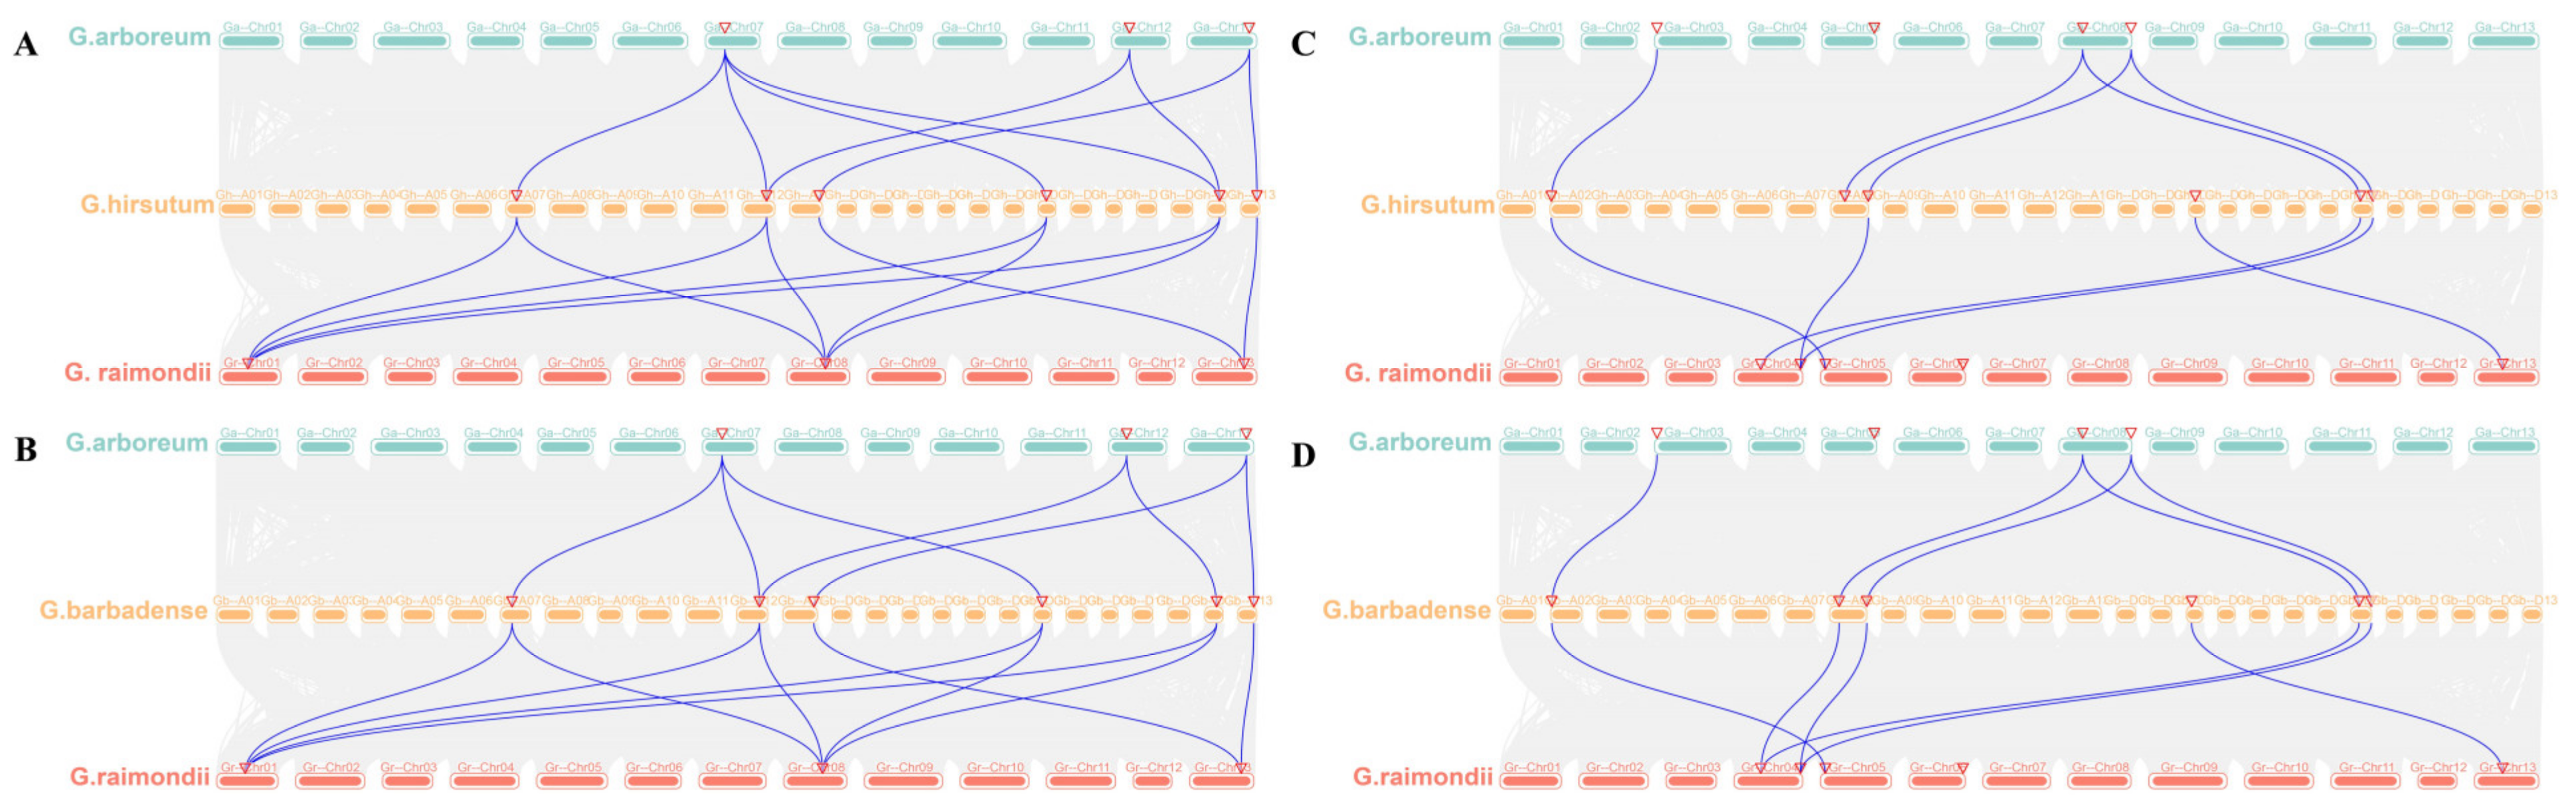
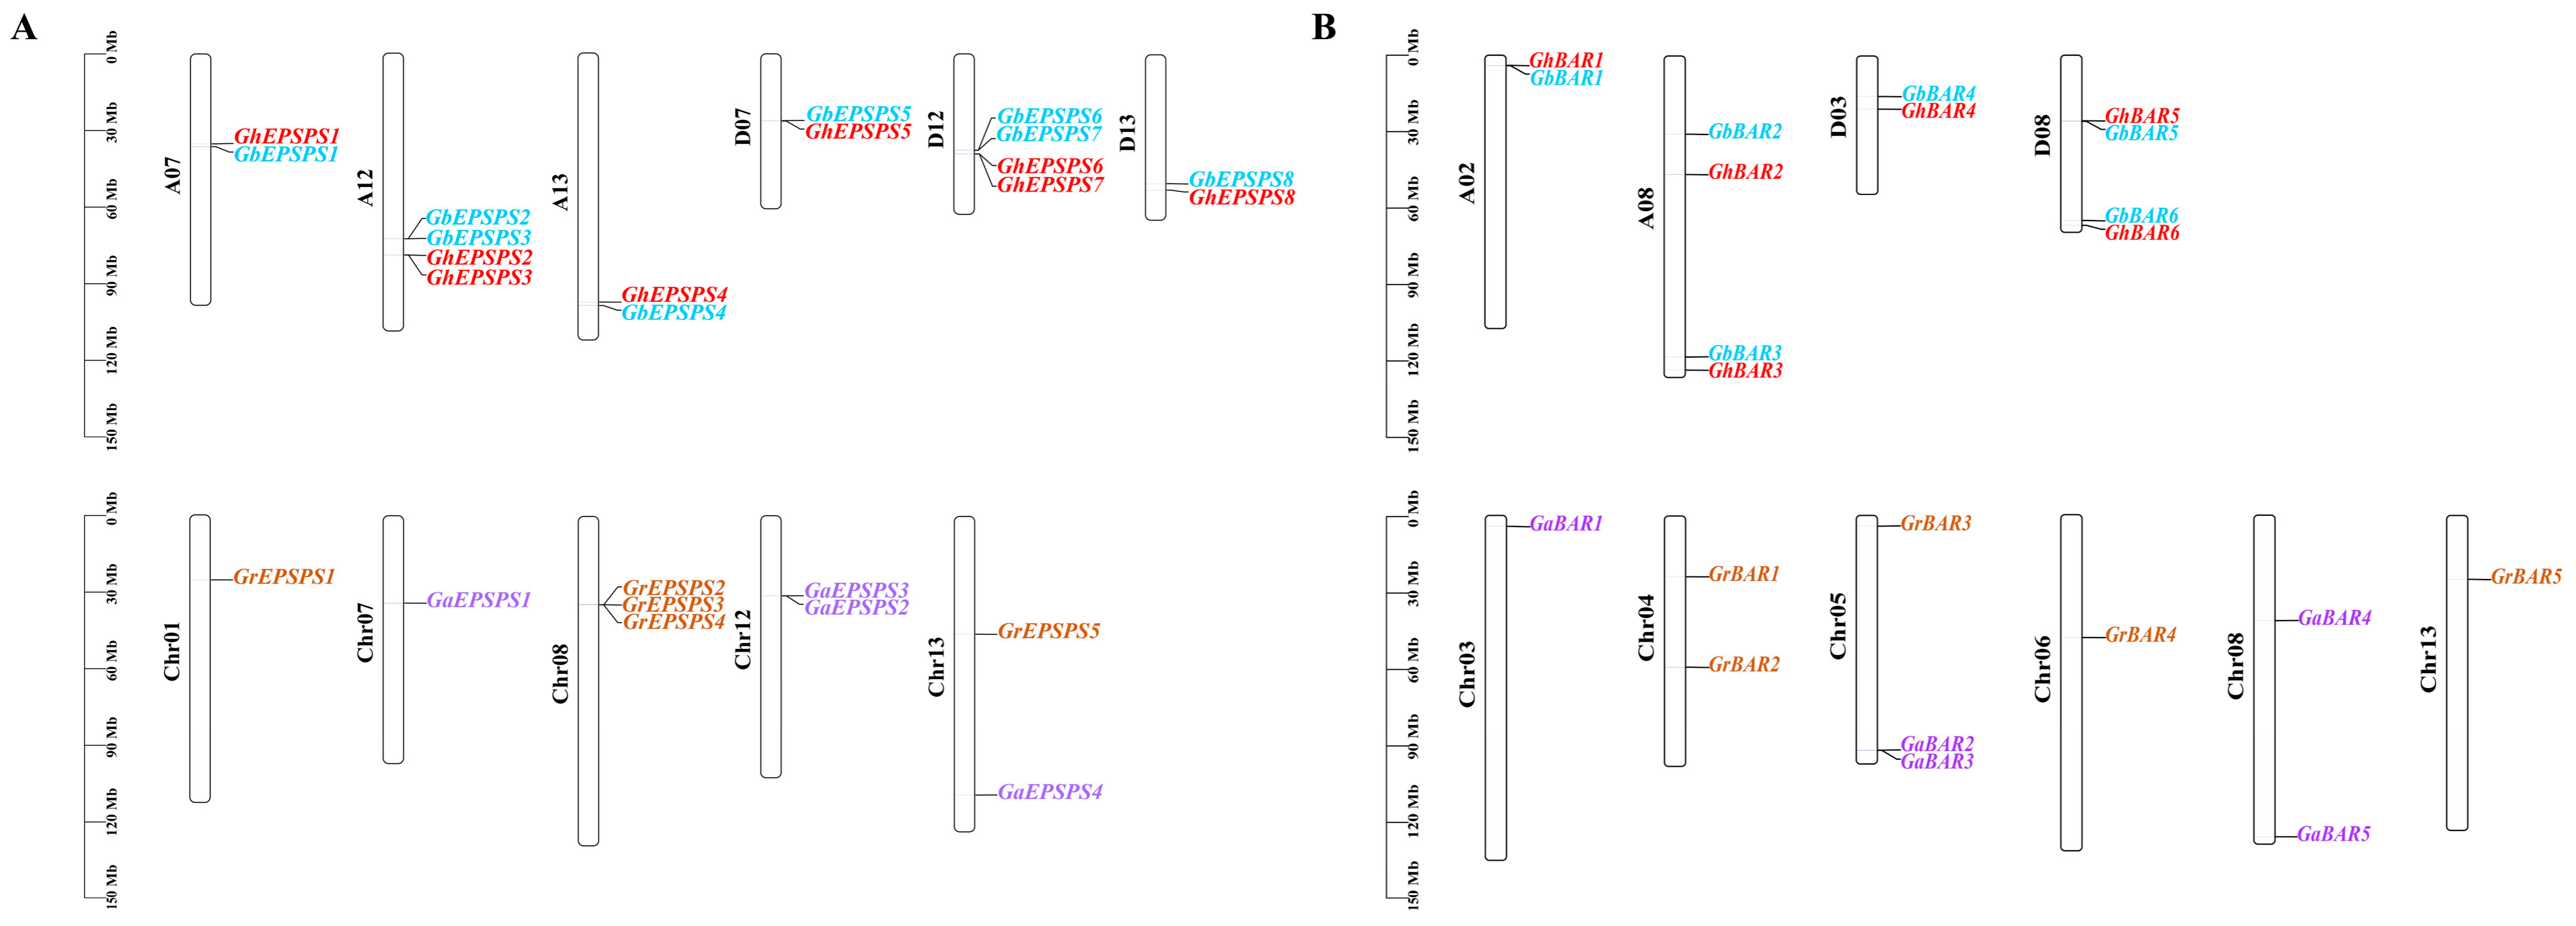
2.5. Collinearity Analysis of EPSPS and BAR Family Members

Analysis of collinearity between tetraploid and diploid cotton showed that six of the EPSPS genes in each of G. hirsutum and G. barbadense were colinear with three GaEPSPS genes and equally colinear with three GrEPSPS genes (Figure 4A,B). In contrast, GhEPSPS3 and GhEPSPS7, GbEPSPS3 and GbEPSPS7 have no co-linear genes with diploids, GaEPSPS2, GrSEPSPS3, and GrSEPSPS4 have no co-linear relationships with tetraploid genes. Overall, there was a more conservative co-linearity between the cotton EPSPS family genes.
In G. hirsutum, 5 GhBAR genes were colinear with three GaBAR genes, and four GhBAR genes were colinear with six GrBAR genes (Figure 4C). In G. barbadense, five GbBAR genes were colinear with three GaBAR genes, and six GbBAR genes were colinear with four GrBAR genes (Figure 4D). While GhBAR4 had no co-linearity with GaBAR, GhBAR2 had no co-linearity with GrBAR, and GaBAR2, GaBAR3, and GrBAR4 had no co-linearity with the tetraploid genome; the results indicated that BAR genes were more divergent between diploid and tetraploid cotton.

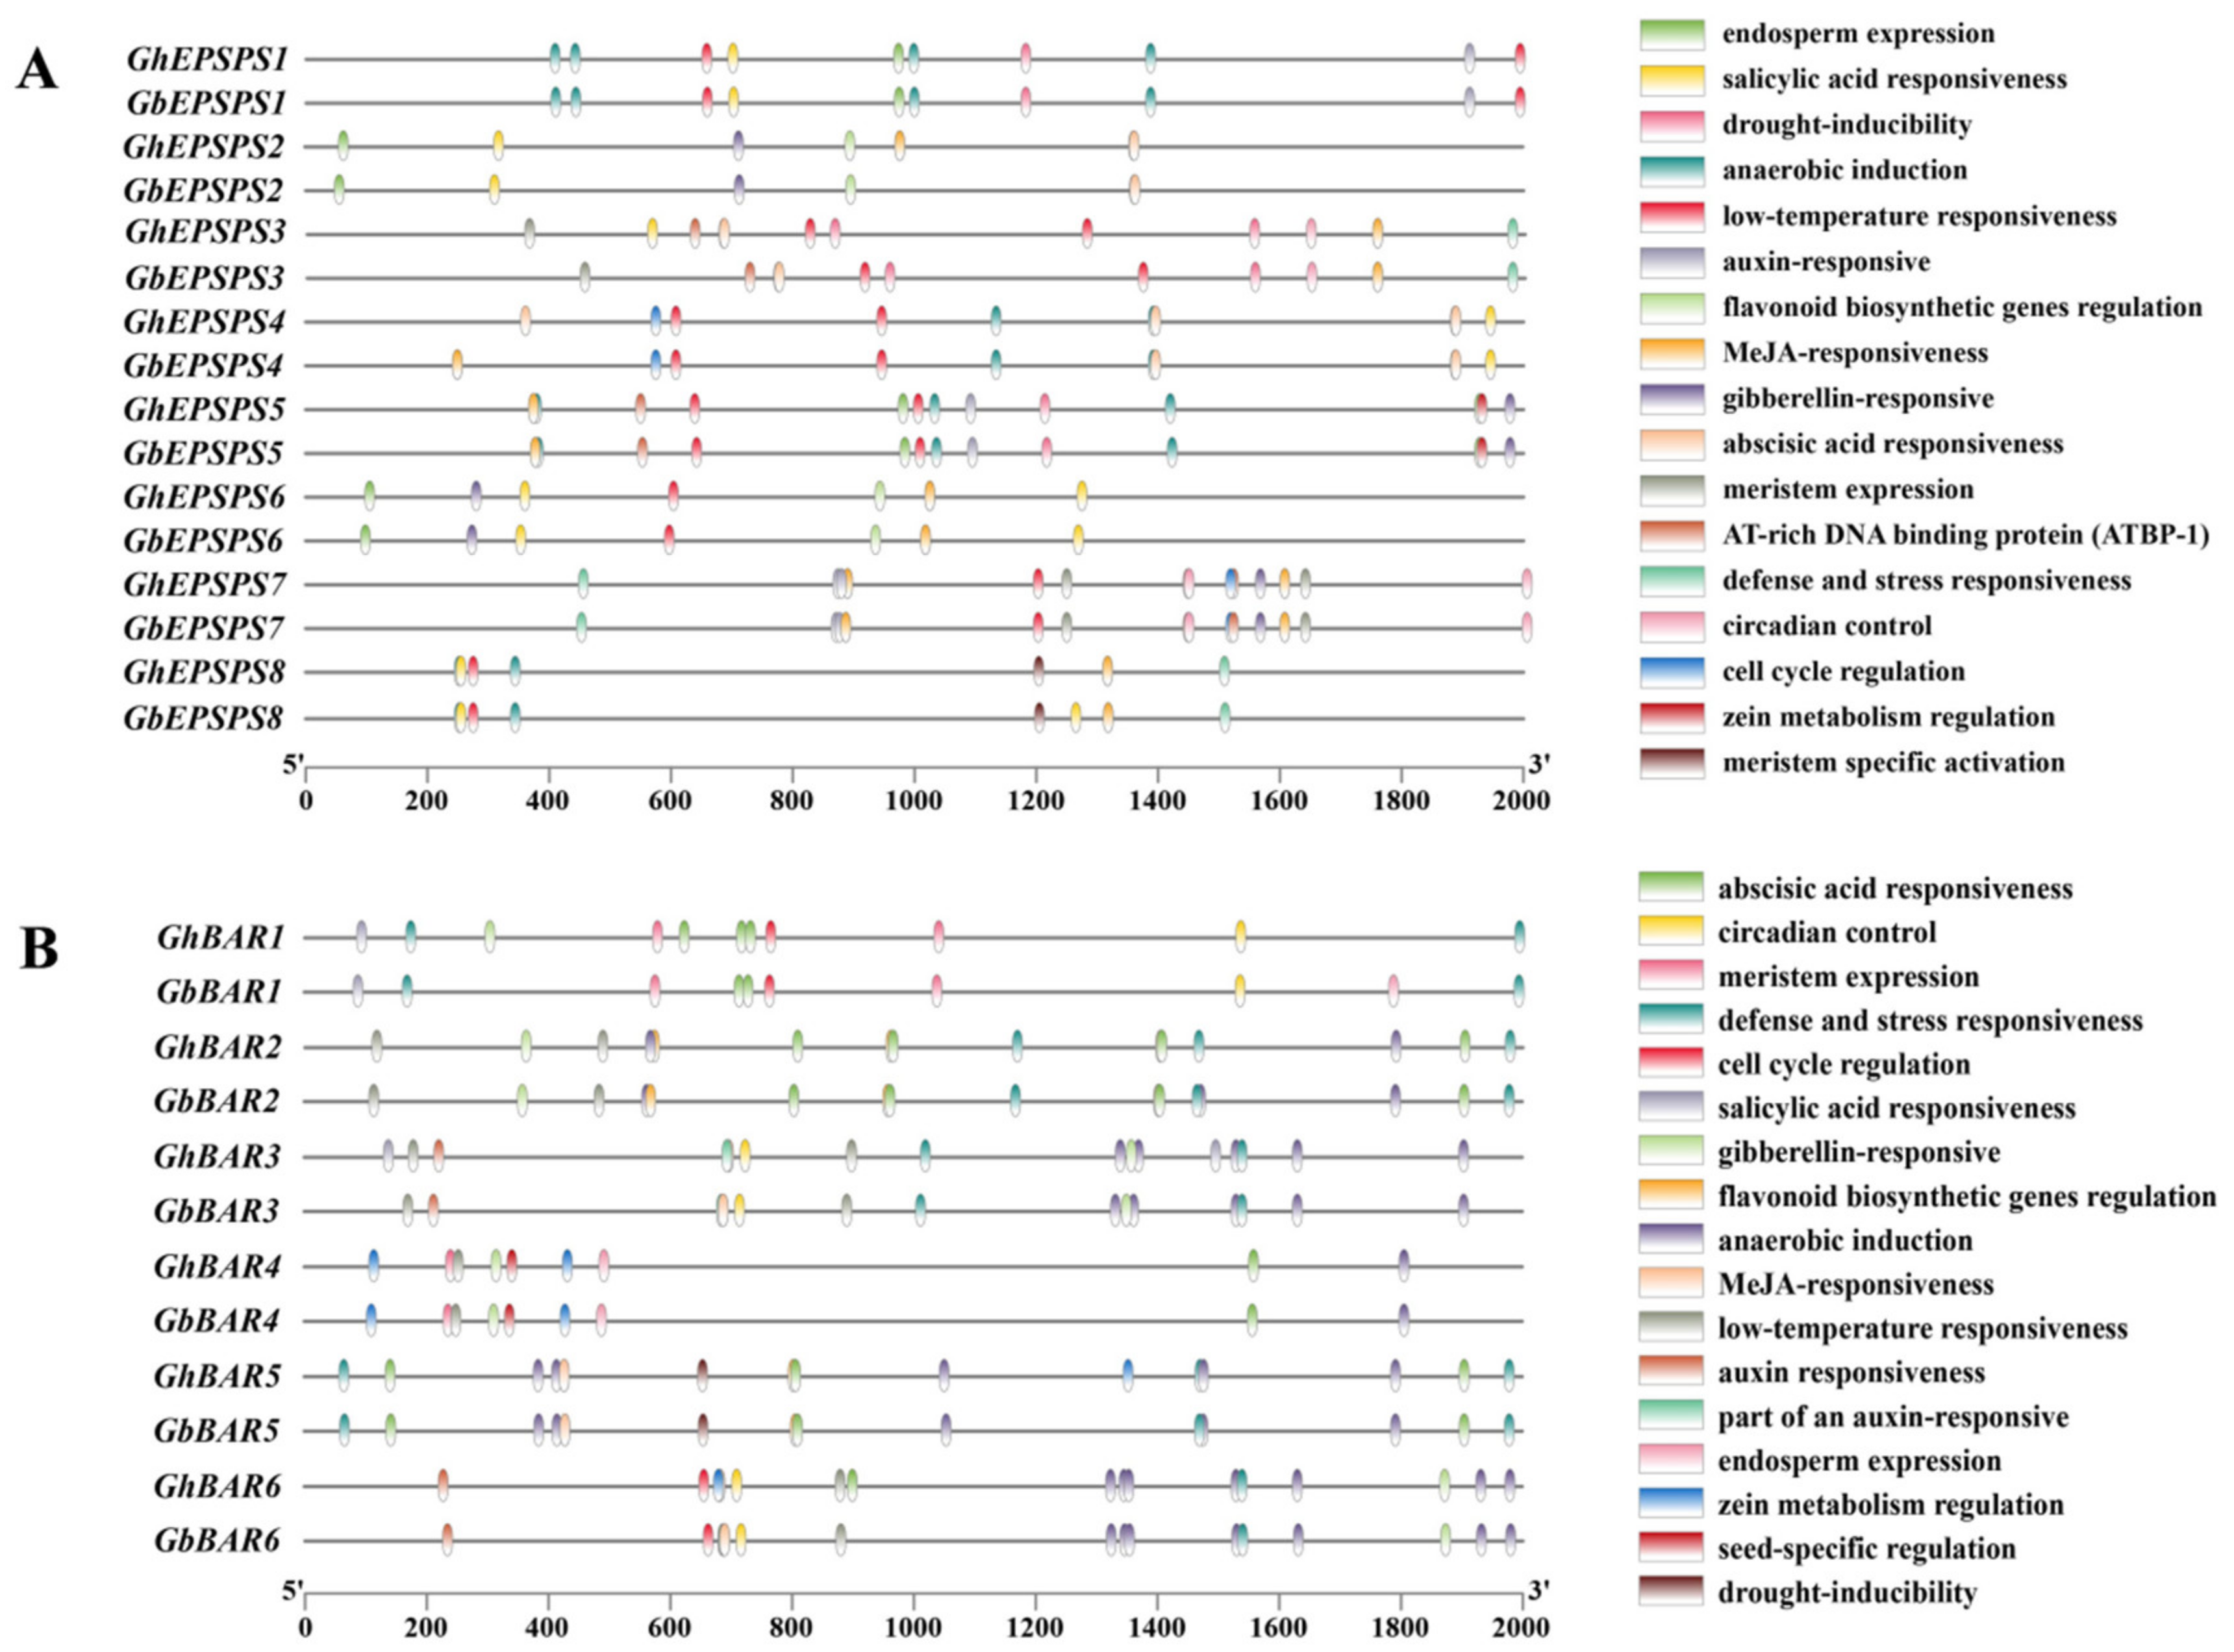
2.6. Analysis of cis-Elements in the Promoter of EPSPS, BAR Family Members

To preliminarily elucidate the possible regulatory mechanisms of the EPSPS family of genes in G. hirsutum and G. barbadense, the promoter (a 2000 bp DNA sequence upstream of ATG) was analyzed using the PlantCARE database (Figure 5A). The results show that each member of the EPSPS family contains a variable number of cis-elements. In addition to the conventional cis-elements, they can be divided into three categories: growth and development-related, stress-related, and hormone-related. Among them, endosperm expression (8), anaerobic induction and low-temperature response (22 each), and abscisic acid response (15) accounted for the largest number in each. Comparison of the cis-elements of G. hirsutum with those of G. barbadense revealed an increase in the cis-element of the MeJA reaction in GhEPSPS2 compared with GbEPSPS2 and in GhEPSPS4 compared with GbEPSPS4. GhEPSPS3 and GhEPSPS8 have an additional cis-element for the salicylic acid reaction compared to GbEPSPS3 and GbEPSPS8. The remaining homologous genes in both G. hirsutum and G. barbadense have the same types. The enrichment of the above response elements suggests that the cotton EPSPS genes may be involved in plant growth and development and in response to environmental stress.
The cis-elements of the BAR family gene promoters were analyzed between G. hirsutum and G. barbadense (Figure 5B). They were also divided into three categories: growth and development-related, stress-related, and hormone-related. Among them, anaerobic induction (41) and abscisic acid reaction (23) accounted for the largest number of each. Comparing the cis-elements of G. hirsutum with those of G. barbadense, we found that GhBAR1 increased endosperm expression and gibberellin-related cis-elements compared to GbBAR1, GhBAR3 increased low temperature and growth hormone partially related cis-elements compared to GbBAR3, GhBAR5 increased maize alcoholic protein metabolism cis-elements compared to GbBAR5, and GhBAR6 increased the cis-elements of maize alcoholic protein metabolism and abscisic acid compared to GbBAR6. This suggests that members of the BAR family have the potential to play important roles in the above pathways.

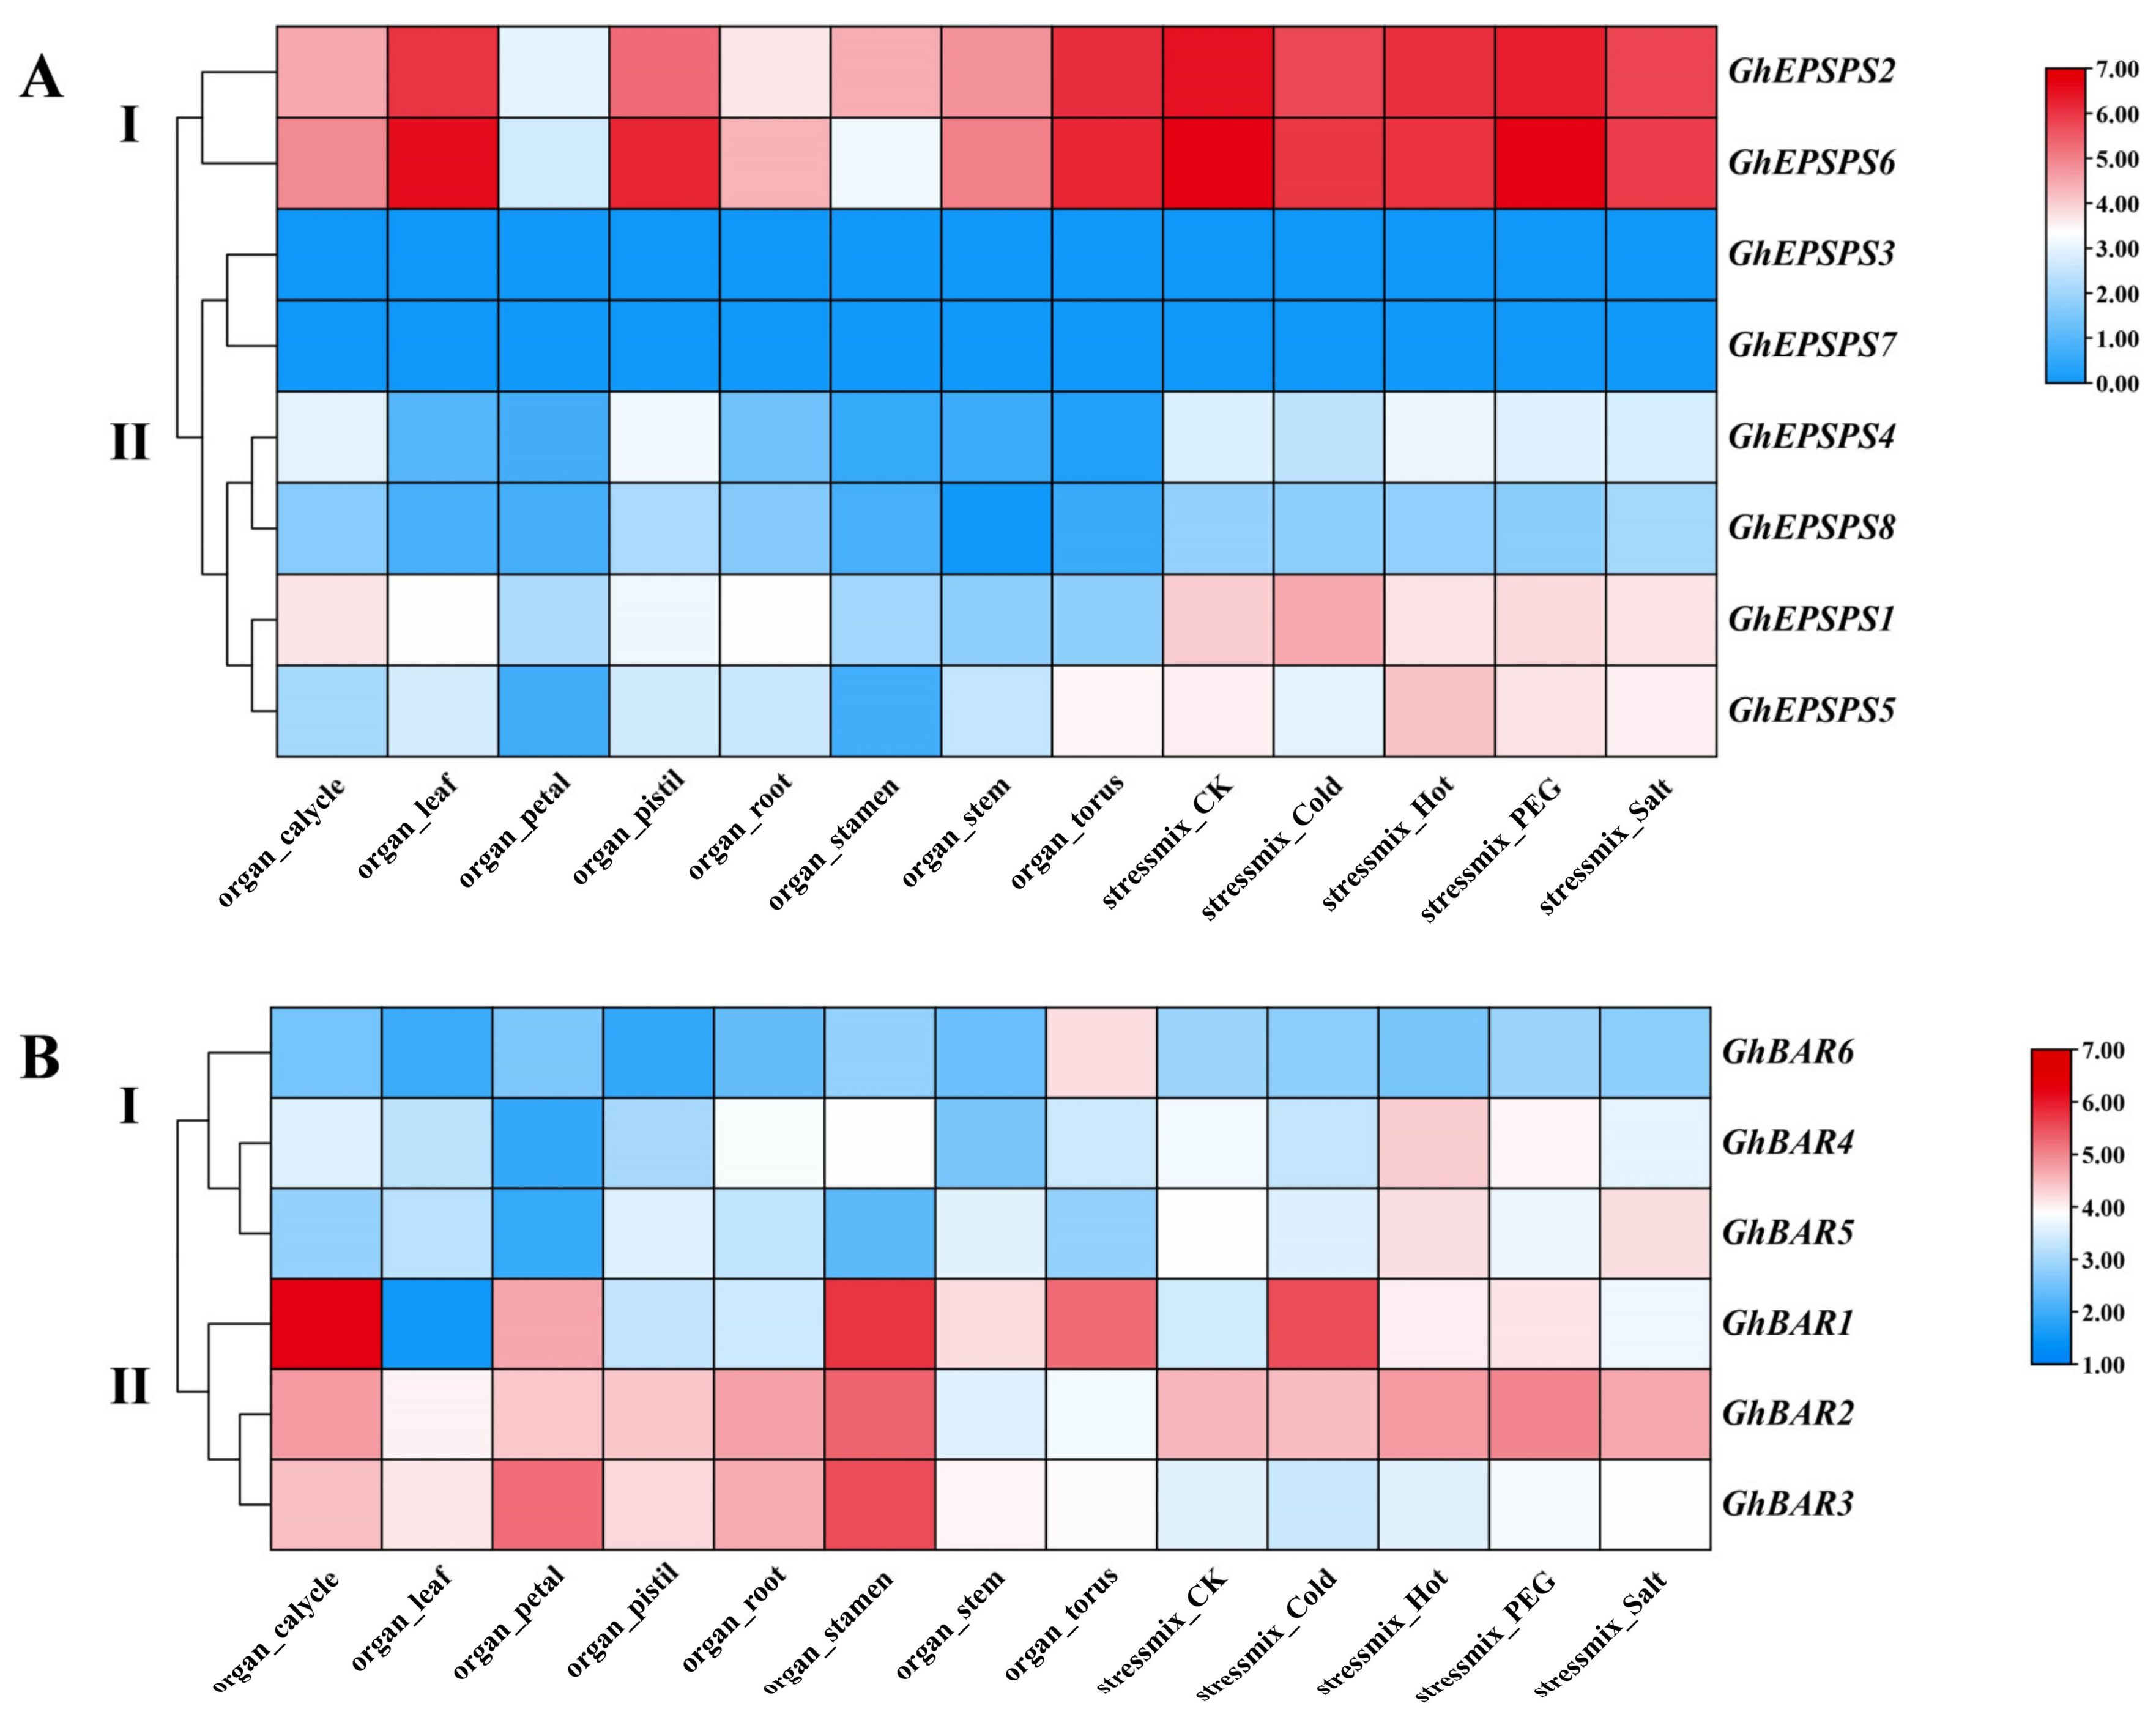
2.7. Expression Analysis of GhEPSPS, GhBAR Family Members

The expression patterns of GhEPSPS and GhBAR family members were analyzed in eight tissues of cotton (root, stem, leaf, pistil, stamen, calyx, petal, and receptacle) and four types of stresses (low temperature, high temperature, salt, and drought) based on published transcriptome data of G. hirsutum TM-1 genome.
The members of the GhEPSPS family were divided into two expression patterns (Figure 6A). Pattern I contained two GhEPSPS members, which were expressed in various tissues and were highly expressed in leaves, pistils, and receptacles. Pattern II included six GhEPSPS members, with GhEPSPS1 being moderately highly expressed in the calyx and the remaining GhEPSPS genes being lowly expressed in all tissues. These results indicated that GhEPSPS genes play a role in different tissues of cotton, with GhEPSPS2 and GhEPSPS6 exhibiting significant tissue-specific expression. Most GhEPSPS genes showed no significant change in expression levels after abiotic stress treatment. Only a portion of GhEPSPS gene expression was induced by low-temperature treatment, such as the upregulation of GhEPSPS1 and GhEPSPS4 expression, indicating that these genes are involved in response to low-temperature stress.
GhBAR family members are also divided into two expression patterns (Figure 6B). In pattern I, GhBAR6 was highly expressed in the flower receptacle, while the remaining GhBAR genes were less expressed in various tissues. In pattern II, the GhBAR1 gene was more expressed in the calyx, stamens, and receptacle, while the other two genes were highly expressed in tissues other than the stem and receptacle. Therefore, the GhBAR family exhibits tissue-specific expression. Under different stress, GhBAR1 was highly expressed under low temperature and drought stress, GhBAR4 responded to high-temperature stress, and GhBAR5 responded to both high temperature and drought stress.

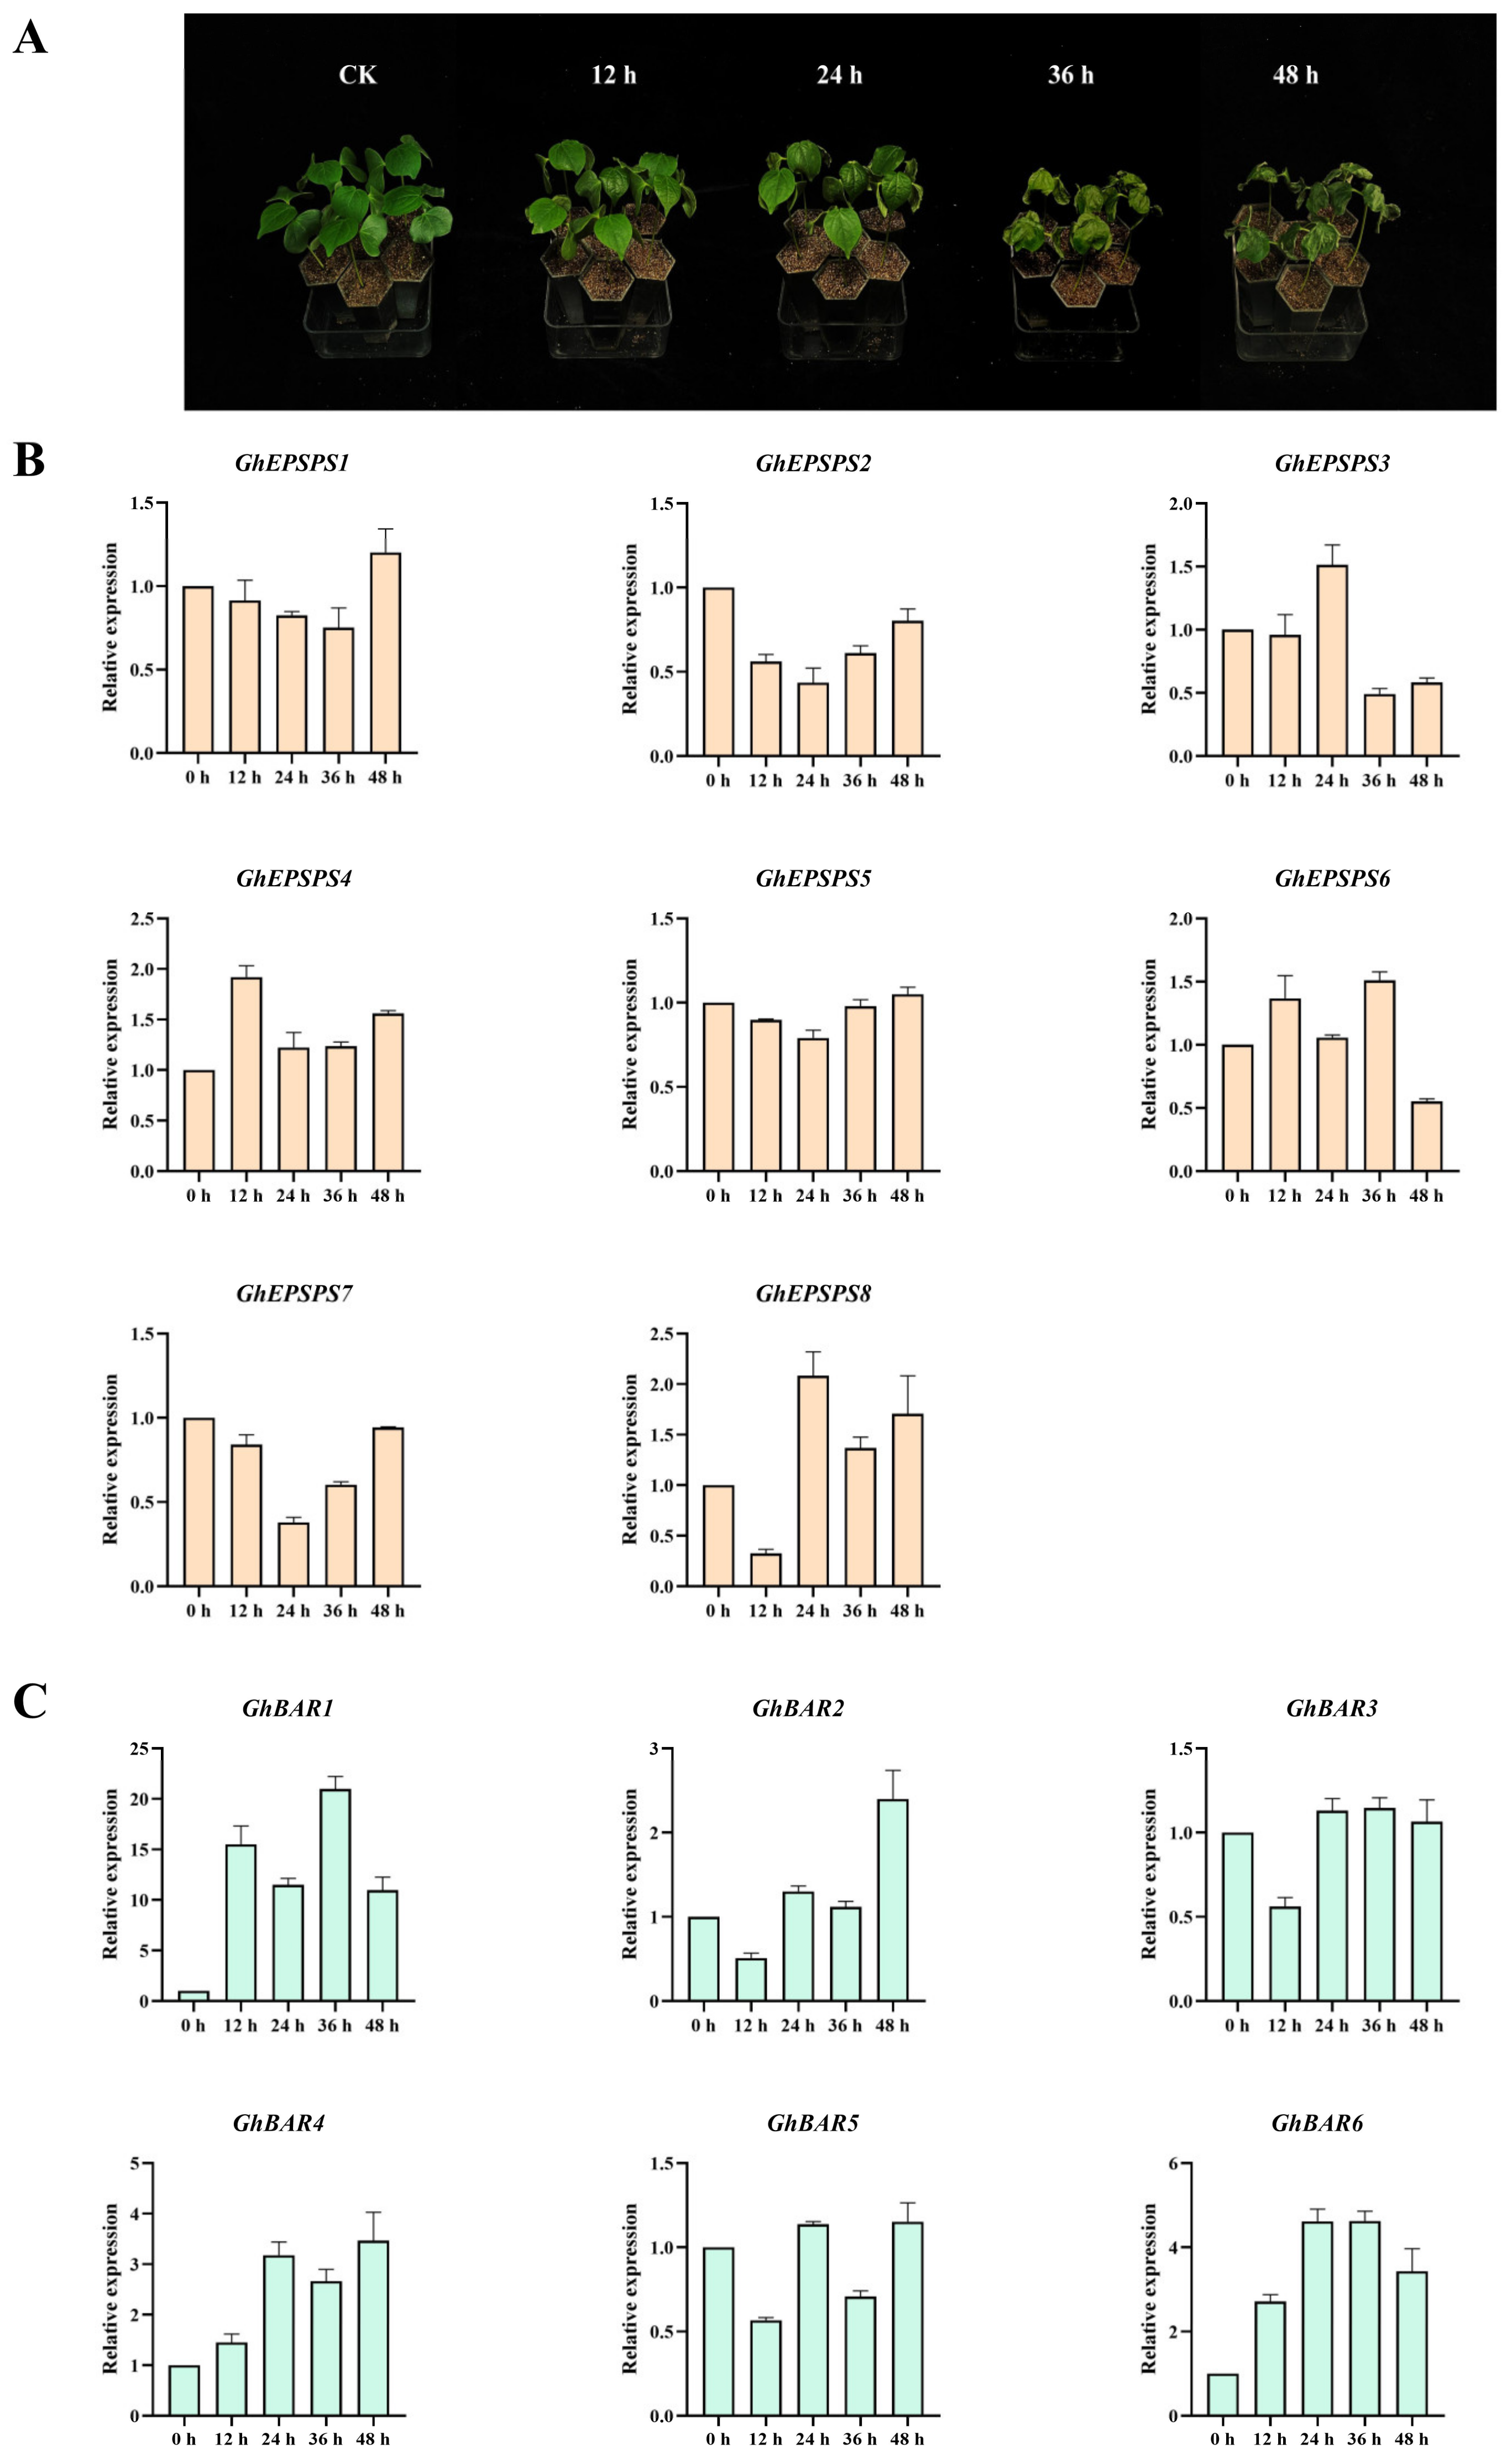
2.8. Expression Levels of EPSPS and BAR Family Members after Herbicide Spraying by qRT-PCR

To investigate whether the EPSPS and BAR families respond to herbicide stress, cotton leaves were treated with herbicide spraying. It was found that the cotyledons of cotton began to show mild wilting at 24 h after herbicide treatment. At 36 h, the cotyledons and true leaves showed a wilting and shrinking state, and the leaf shrinkage became more pronounced at 48 h (Figure 7A). We further detected the expression levels of 14 genes in the GhEPSPS and GhBAR families at different stages after herbicide treatment by qRT-PCR. The results showed that genes were generally upregulated. GhEPSPS3 was upregulated by about 10 times at 24 h, while GhEPSPS4 and GhEPSPS5 showed an upregulation trend with about 0.5 times compared to that of the control. GhEPSPS1 and GhEPSPS8 showed a significant upregulation trend at 36 h, while GhEPSPS2 showed an upregulation trend at 48 h, which was about twice as high as before. GhEPSPS3 had the highest expression level after herbicide stress (Figure 7B). Most of the GhBAR genes are upregulated, with GhBAR1, GhBAR4, and GhBAR6 showing the most significant upregulation at 36 h. Among them, GhBAR1 is particularly upregulated, with an expression level of about 12 times that of untreated at 12 h and over 18 times that of untreated at 36 h. In addition, GhBAR1 has the highest expression level in the BAR family under herbicide stress. GhBAR4 and GhBAR5 showed a significant upregulation trend at 48 h (Figure 7C). This indicated that GhEPSPS and GhBAR families were induced to express by herbicides and may play an important role in the resistance to herbicides.

3. Discussion

Allotetraploid cotton (AADD) originated from the hybridization of A genome species as the maternal parent and D genome species as the pollen donor. The A genome species originated from G. arboreum and G. herbaceum (A2), while the D genome species originated from G. raimondii [40,41]. Two diploid ancestral species have undergone over a period of one to two million years of heteropolyploidization to form tetraploid cultivated species [42]. The number of genes in tetraploid G. hirsutum and G. barbadense should be twice or more than that in diploid G. arboreum and G. raimondii [43]. We identified eight EPSPS genes in G. hirsutum and G. barbadense, with consistent distribution on chromosomes, with four genes in the A subgenome and four genes in the D subgenome. It was quantitatively similar to the EPSPS genes identified in two diploid cotton varieties, indicating that the EPSPS genes of allotetraploid cotton have not undergone separate replication or significant gene loss events during evolution [44]. However, for the BAR gene family, there are five genes in diploid and six genes in tetraploid cotton. It is speculated that it may be the result of the elimination of some genes in the BAR family during the formation of the tetraploid genome.
The expression of the EPSPS gene may be different in tissues and organs [45]. Under the stresses, plants regulate the expression of genes in order to resist the harm of adversity and ensure the normal physiological function of plant cells and the growth and development of plants [46]. In rice, LOCOs06g04280 is dominantly expressed in the root. In Arabidopsis, the expression of AT1G48860 in leaves was extremely significant. In tobacco, the accumulation of EPSPS transcripts was highest in mature leaves. After 14 days of herbicide stress, the expression of NtEPSPS was significantly upregulated, which was more than twice that of the control [21]. The expression of the IbEPSPS gene cloned from sweet potato was the highest in the stem. After spraying herbicide on isolated shoots, IbEPSPS gene expression decreased and then increased [47]. The EPSPS gene of G. hirsutum (Coker312) is predominantly expressed in the true leaves [48]. The expression level of EPSPS increased after glyphosate stress in cotton strain Y18 [37]. The expression of the CaEPSPS gene in field bindweed significantly increased under glyphosate treatment. Introducing the CaEPSPS gene into Arabidopsis revealed stronger glyphosate tolerance [49]. In this study, we found that GhEPSPS2 and GhEPSPS6 were also predominantly expressed in leaves, and herbicide treatment could increase the expression of EPSPS, indicating that EPSPS family genes could respond to herbicide stress. EPSPS is the only glyphosate target enzyme in plants, and its expression level can directly affect the resistance of plants to glyphosate. Plants improve their tolerance to glyphosate by increasing EPSPS gene expression to ensure normal plant life activities, which is a common glyphosate resistance mechanism at present, but the specific response mechanism still needs to be further explored.
EPSP synthases can be divided into two types, EPSPS I and EPSPS II, according to the principle of whether antigen and antibody cross-react and whether amino acid sequence homology is less than 50% [50]. The natural EPSPS gene of plants is EPSPS I and is not resistant to herbicides. This type of EPSPS gene is sensitive to glyphosate, and after gene mutation, it is possible for organisms to acquire tolerance to glyphosate [51]. In addition, Monsanto transferred EPSP synthase derived from Agrobacterium sp. CP4 into plants to develop genetically modified crops resistant to glyphosate [23]. This EPSPS genes isolated from Agrobacterium tumefaciens are EPSPS II, which tend to show higher catalytic efficiency and are not inhibited by glyphosate in the presence of glyphosate [52]. At present, most of the transgenic crops resistant to glyphosate are created using EPSPS II [53]. Arabidopsis has two natural EPSPS loci, AtEPSPS1(AT1G48860) and AtEPSPS2(AT2G45300), which are highly expressed throughout development [54]. It was found that overexpression of the natural gene encoding 5-enolpyruvate oxalate synthase (EPSP) may increase the fertility of Arabidopsis [22]. Therefore, we speculated that the natural EPSPS genes may have the same regulatory mechanism in cotton, and overexpression of EPSPS genes may improve the reproductive ability of cotton, laying a foundation for further improving cotton. Among them, AtEPSPS2(AT2G45300) is the upregulated expression gene of Ca2+ response, and Ca2+ transient mediates the response to environmental stresses, including salt, drought, cold, heat, ultraviolet, etc., which is the key to plant resistance to biological and abiotic stresses [55]. This gene is homologous to the cotton EPSPS gene and may play a role in ion regulation. In cotton, GhEPSPS1 and GhEPSPS4 are upregulated under low-temperature treatment, which may be attributed to Ca2+ involvement in the response process of cotton to low-temperature stress. In plants, cis-regulatory elements are associated with ABA in Ca2+ response gene promoters. Among the hormone-related cis-acting elements in the EPSPS promoter response of tetraploid cotton, the homeopathic elements of abscisic acid reaction accounted for the largest number. Therefore, we hypothesized that EPSPS genes in cotton activate in vivo gene expression through Ca2+ response to abscisic acid cis-acting elements.
The BAR gene has been introduced into many plant species as an optional marker during transformation and provides tolerance to glufosinate [56]. Plants with the BAR gene can survive under glufosinate treatment, providing an excellent system for screening transgenic plants through a single treatment [27]. At present, the BAR gene was isolated from Streptomyces hygroscopicus in existing transgenic crops resistant to phosphine glufosinate, and it was transferred into the crops to make them resistant to phosphine glufosinate. At present, researchers have studied different crops with BAR gene transfer [30,57,58,59,60]. BAR gene not only can improve resistance to the herbicide glufosinate but also play a role in the salt stress and flowering of plants. In Arabidopsis thaliana, AtBAR1 (AT2G32020) was upregulated under salt stress [61]. In order to adapt to the salt-stressed environment, plants achieve salt tolerance by activating the SOS signaling pathway [62], which requires the combined activity of three proteins to prevent the accumulation of Na+ so as to achieve plant salt tolerance [63]. AtBAR1 is also involved in the regulation of aging, oxidative stress, defense, and plant hormones [64]. In this study, the up-regulation trend of GhBAR1 was the largest after herbicide treatment, and the expression level was about 6~18 times that in the untreated condition, which was much higher than that of other family members. Phylogenetic analysis showed that AtBAR1 and GhBAR1 belong to the same clade, indicating that they are closely related and may have similar functions. Promoter cis-elements analysis showed that GhBAR1 responded to cell cycle regulation, defense and stress response, salicylic acid, and abscisic acid. Transcriptome data also showed that GhBAR1 was upregulated under salt stress. At the same time, GhBAR1 had a broad response under cold stress, which could be a potential gene for the study of herbicide resistance mechanisms and their function under abiotic stress. AtBAR3(AT3G02980) is involved in the development of leaves and flowers as well as male and female gametes. Overexpression results in narrower, longer rosette leaves, faster stem elongation, and earlier flowering [65]. GhBAR1 is highly expressed in stamens, and GhBAR2 and GhBAR3 are moderately and highly expressed in the leaves of stamens and pistils. These genes may play a role in the reproductive organs and fiber of cotton.

4. Materials and Methods

4.1. Identification of EPSPS and BAR Family Members

The genome sequence and annotation data of Gossypium hirsutum (HEBAU), G. barbadense (HEBAU), G. arboreum (CRI), and G. raimondii (JGI) [39,66,67] were downloaded from CottonFGD (http://www.cottonfgd.org/, accessed on 27 November 2022). The Hidden Markov Model (HMM) database (Protein families database of alignments and HMM, Pfam database) website (http://pfam.xfam.org/, accessed on 27 November 2022) was used to download the conserved structural domains EPSP synthase (3-phosphoshikimate 1-carboxyvinyltransferase) (EPSP_synthase, PF00275) for the EPSPS gene and Acetyltransferase (GNAT) domain (Acetyltransf_4, PF13420) for the BAR gene. The EPSPS and BAR genes of four cotton species were obtained using the Simple HMM search function in TBtools software [68], and then the EPSPS and BAR family member sequences were obtained by using the NCBI CD-Search website (https://www.ncbi.nlm.nih.gov/Structure/cdd/wrpsb.cgi, accessed on 27 November 2022) to remove incomplete sequences of conserved structural domains.

4.2. Characterization of EPSPS and BAR Family Members

The protein and transcriptional features of the obtained EPSPS and BAR family members were extracted and summarized by the Date Fetch and Enrichment function of CottonFGD (https://cottonfgd.net/analyze/, accessed on 27 November 2022). The chromosomal location information of the resulting family members was visualized and constructed using the Gene Location Visualize from GTF/GFF function in TBtools software (V2.001), respectively.

4.3. Conserved Domain and Gene Structure Analysis of EPSPS and BAR Family Members

The amino acid sequences of the identified family members were extracted by TBtools software, and the motifs of the EPSPS and BAR family members were further analyzed using MEME (http://meme-suite.org/tools/meme, accessed on 17 December 2022), where the number of motifs was set to a value of 10 and the rest by default. The structure of the family members was analyzed using the Visualize Gene Structure function in the TBtools software.

4.4. Phylogenetic Relationship of EPSPS and BAR Family Members

Family member gene sequences for four cotton species were obtained from CottonFGD (https://cottonfgd.net/, accessed on 27 November 2022), Arabidopsis family member gene sequences from TAIR (https://www.arabidopsis.org/, accessed on 10 December 2022), and soybean family member sequence genes from MBKBASE (http://www.mbkbase.org/, accessed on 10 December 2022). The obtained EPSPS and BAR family member sequences were compared using MEGA-X software [69], and the phylogenetic tree was constructed using Neighbor-Joining (NJ), with the Bootstrap value set to 1000 and the rest as default values.

4.5. Analysis of cis-Elements of Promoters of EPSPS and BAR Family Members

DNA sequence information of 2000 bp upstream of the two tetraploid cotton family members was extracted by the Date Fetch and Enrichment function of CottonFGD (https://cottonfgd.net/analyze/, accessed on 22 December 2022). Possible cis-elements were analyzed and collated using the PlantCARE (http://bioinformatics.psb.ugent.be/webtools/plantcare/html/, accessed on 22 December 2022) website. Visualization was achieved through the Simple BioSequence Viewer function in TBtools.

4.6. Collinearity Analysis of EPSPS and BAR Family Members

The genomes of diploid and tetraploid cotton were analyzed by the One Step MCScanX—Super Fast function in TBtools software, followed by extraction and visualization of the covariance of EPSPS and BAR members.

4.7. Expression Analysis of GhEPSPS and GhBAR Family Members in Different Tissues and under Biotic and Abiotic Stresses

Download transcriptome data from the NCBI Sequence Read Archive database for eight tissues (root, stem, leaf, pistil, stamen, calyx, petal, and receptacle) and four stresses (cold, heat, drought, and salt stress) of G. hirsutum ‘TM-1′(PRJNA490626) [70]. The transcriptomic data were log2 (1+FPKM) normalized. HeatMap functional software in TBtools was used to map the expression of EPSPS and BAR family members.

4.8. Gene Expression Analysis of EPSPS and BAR Family Genes in Different Periods after Herbicide Stress

The G. hirsutum variety Nongda 601 was grown in a greenhouse culture, and the leaves were uniformly sprayed with 8 mL/L−1 of herbicide for up to 30 days. RNA was extracted from the leaves before (0 h) and 12, 24, 36, and 48 h after spraying using FastPureRPlant Total RNA Isolation Kit (purchased from Vazyme, Nanjing, China), respectively. The obtained RNA was reverse transcribed into cDNA using the HiScript III RT SuperMix For qPCR (+gDNA wiper) reverse transcription kit (purchased from Vazyme), and RT-PCR reaction was performed using Taq Pro Universal SYBR qPCR Master Mix (purchased from Vazyme) on Roche LightCycler 96 (Roche, Basel, Switzerland). The program settings refer to the instructions. The used primers were shown in Table 3, and the expression of GhUBQ14 was used as an internal reference. Relative expression was calculated using 2−△△CT and three biological replicates were set.

5. Conclusions

In summary, this study is the first report on the genome-wide characteristics of EPSPS and BAR gene families in diploid and tetraploid cotton. We identified 25 EPSPS genes and 22 BAR genes in the cotton genomes. The number of EPSPS genes in tetraploid cotton is twice that in diploid cotton, while the number of BAR genes in tetraploid and diploid cotton is almost the same. The expression levels of GhEPSPS are significantly higher in leaves and pistils, while most GhBAR genes are highly expressed in calycle and stamen. Among the EPSPS and BAR genes, the expression levels of GhEPSPS3, GhEPSPS4, and GhBAR1 were significantly upregulated under herbicide treatment. This study provides a systematic and profound understanding of the EPSPS and BAR families and contributes to further study on the function of EPSPS and BAR families under herbicide stress in cotton.

Author Contributions

Z.S. and X.W. designed the research; Z.L. and Z.Z. wrote the manuscript; Z.L. and Z.S. revised the manuscript; Z.L., Z.Z, Y.M., X.L., D.Z. and Q.G. analyzed the data. Z.L., Z.Z. and Y.M. performed the experiments. Y.L., X.L., H.K., L.W., G.Z. and Z.M. prepared experiment materials. All authors have read and agreed to the published version of the manuscript.

Funding

This research was funded by the Natural Science Foundation of Hebei (C2022204205), the Key Research and Development Program of Hebei province (21326314D) and the China Agricultural Research System (CARS-15-03).

Data Availability Statement

The data presented in this study are available within the article.

Conflicts of Interest

The authors declare no conflict of interest.

References

  1. Shahzad, A.; Ullah, S.; Dar, A.A.; Sardar, M.F.; Mehmood, T.; Tufail, M.A.; Shakoor, A.; Haris, M. Nexus on climate change: Agriculture and possible solution to cope future climate change stresses. Environ. Sci. Pollut. Res. 2021, 28, 14211–14232. [Google Scholar] [CrossRef] [PubMed]
  2. Aslam, S.; Khan, S.H.; Ahmed, A.; Dandekar, A.M. The Tale of Cotton Plant: From Wild Type to Domestication, Leading to Its Improvement by Genetic Transformation. Am. J. Mol. Biol. 2020, 10, 91–127. [Google Scholar] [CrossRef]
  3. Dong, H.; Huang, Y.; Wang, K. The Development of Herbicide Resistance Crop Plants Using CRISPR/Cas9-Mediated Gene Editing. Genes 2021, 12, 912. [Google Scholar] [CrossRef] [PubMed]
  4. Kremer, R.J.; Means, N.E. Glyphosate and glyphosate-resistant crop interactions with rhizosphere microorganisms. Eur. J. Agron. 2009, 31, 153–161. [Google Scholar] [CrossRef]
  5. Duke, S.O. The history and current status of glyphosate. Pest Manag. Sci. 2018, 74, 1027–1034. [Google Scholar] [CrossRef] [PubMed]
  6. Duke, S.O.; Powles, S.B. Glyphosate: A once-in-a-century herbicide. Pest Manag. Sci. 2008, 64, 319–325. [Google Scholar] [CrossRef]
  7. Dill, G.M.; CaJacob, C.A.; Padgette, S.R. Glyphosate-resistant crops: Adoption, use and future considerations. Pest Manag. Sci. 2008, 64, 326–331. [Google Scholar] [CrossRef]
  8. Green, J.M.; Owen, M.D.K. Herbicide-Resistant Crops: Utilities and Limitations for Herbicide-Resistant Weed Management. J. Agric. Food Chem. 2011, 59, 5819–5829. [Google Scholar] [CrossRef]
  9. Zhao, H.; Zhao, Y.; Luo, R.; Yang, L.; Li, G.; Di, J.; Peng, M.; Li, L.; Wen, Q.; Liang, X. Production of EPSPS and bar gene double-herbicide resistant castor (Ricinus communis L.). Biotechnol. Biotechnol. Equip. 2020, 34, 825–840. [Google Scholar] [CrossRef]
  10. Schütte, G.; Eckerstorfer, M.; Rastelli, V.; Reichenbecher, W.; Restrepo-Vassalli, S.; Ruohonen-Lehto, M.; Saucy, A.-G.W.; Mertens, M. Herbicide resistance and biodiversity: Agronomic and environmental aspects of genetically modified herbicide-resistant plants. Environ. Sci. Eur. 2017, 29, 5. [Google Scholar] [CrossRef]
  11. Geiger, D.R.; Fuchs, M.A. Inhibitors of Aromatic Amino Acid Biosynthesis (Glyphosate). In Herbicide Classes in Development: Mode of Action, Targets, Genetic Engineering, Chemistry; Böger, P., Wakabayashi, K., Hirai, K., Eds.; Springer: Berlin/Heidelberg, Germany, 2002; pp. 59–85. [Google Scholar] [CrossRef]
  12. Santos-Sánchez, N.F.; Salas-Coronado, R.; Hernández-Carlos, B.; Villanueva-Cañongo, C. Shikimic acid pathway in biosynthesis of phenolic compounds. Plant Physiol. Asp. Phenolic Compd. 2019, 1, 1–15. [Google Scholar] [CrossRef]
  13. Achary, V.M.M.; Sheri, V.; Manna, M.; Panditi, V.; Borphukan, B.; Ram, B.; Agarwal, A.; Fartyal, D.; Teotia, D.; Masakapalli, S.K.; et al. Overexpression of improved EPSPS gene results in field level glyphosate tolerance and higher grain yield in rice. Plant Biotechnol. J. 2020, 18, 2504–2519. [Google Scholar] [CrossRef] [PubMed]
  14. Priestman, M.A.; Healy, M.L.; Funke, T.; Becker, A.; Schönbrunn, E. Molecular basis for the glyphosate-insensitivity of the reaction of 5-enolpyruvylshikimate 3-phosphate synthase with shikimate. FEBS Lett. 2005, 579, 5773–5780. [Google Scholar] [CrossRef] [PubMed]
  15. Parthasarathy, A.; Cross, P.J.; Dobson, R.C.; Adams, L.E.; Savka, M.A.; Hudson, A.O. A three-ring circus: Metabolism of the three proteogenic aromatic amino acids and their role in the health of plants and animals. Front. Mol. Biosci. 2018, 5, 29. [Google Scholar] [CrossRef] [PubMed]
  16. Li, S.; Zha, W.; Liu, K.; Li, C.; Zhou, L.; He, G.; Xu, H.; Li, P.; Chen, J.; Chen, Z.; et al. Molecular identification and efficacy assessment of a glufosinate-tolerant and brown planthopper-resistant transgenic rice line. J. Plant Physiol. 2022, 273, 153688. [Google Scholar] [CrossRef] [PubMed]
  17. Ren, B.; Kuang, Y.; Xu, Z.; Wu, X.; Zhang, D.; Yan, F.; Li, X.; Zhou, X.; Wang, G.; Zhou, H. Three novel alleles of OsGS1 developed by base-editing-mediated artificial evolution confer glufosinate tolerance in rice. Crop J. 2023, 11, 661–665. [Google Scholar] [CrossRef]
  18. Thompson, C.J.; Movva, N.R.; Tizard, R.; Crameri, R.; Davies, J.E.; Lauwereys, M.; Botterman, J. Characterization of the herbicide-resistance gene bar from Streptomyces hygroscopicus. EMBO J. 1987, 6, 2519–2523. [Google Scholar] [CrossRef]
  19. Gong, Y.; Guo, S.; Shu, H.; Ni, W.; Maimaiti, P.; Shen, X.; Xu, P.; Zhang, X.; Guo, Q. Analysis of Molecular Evolution and Gene Structure of EPSPS Protein in Plant Shikimate Pathway. Chin. Bull. Bot. 2015, 50, 295–309. [Google Scholar] [CrossRef]
  20. Aramrak, A.; Kidwell, K.K.; Steber, C.M.; Burke, I.C. Molecular and phylogenetic characterization of the homoeologous EPSP Synthase genes of allohexaploid wheat, Triticum aestivum (L.). BMC Genom. 2015, 16, 844. [Google Scholar] [CrossRef]
  21. Garg, B.; Vaid, N.; Tuteja, N. In-Silico analysis and expression profiling implicate diverse role of EPSPS family genes in regulating developmental and metabolic processes. BMC Res. Notes 2014, 7, 58. [Google Scholar] [CrossRef]
  22. Xie, Z.; Sundström, J.F.; Jin, Y.; Liu, C.; Jansson, C.; Sun, C. A selection strategy in plant transformation based on antisense oligodeoxynucleotide inhibition. Plant J. 2014, 77, 954–961. [Google Scholar] [CrossRef] [PubMed]
  23. Heck, G.R.; Armstrong, C.L.; Astwood, J.D.; Behr, C.F.; Bookout, J.T.; Brown, S.M.; Cavato, T.A.; DeBoer, D.L.; Deng, M.Y.; George, C.; et al. Development and Characterization of a CP4 EPSPS-Based, Glyphosate-Tolerant Corn Event. Crop Sci. 2005, 45, 329–339. [Google Scholar] [CrossRef]
  24. Chhapekar, S.; Raghavendrarao, S.; Pavan, G.; Ramakrishna, C.; Singh, V.K.; Phanindra, M.L.V.; Dhandapani, G.; Sreevathsa, R.; Ananda Kumar, P. Transgenic rice expressing a codon-modified synthetic CP4-EPSPS confers tolerance to broad-spectrum herbicide, glyphosate. Plant Cell Rep. 2015, 34, 721–731. [Google Scholar] [CrossRef] [PubMed]
  25. Garg, B.; Gill, S.S.; Biswas, D.K.; Sahoo, R.K.; Kunchge, N.S.; Tuteja, R.; Tuteja, N. Simultaneous Expression of PDH45 with EPSPS Gene Improves Salinity and Herbicide Tolerance in Transgenic Tobacco Plants. Front. Plant Sci. 2017, 8, 364. [Google Scholar] [CrossRef]
  26. Guo, B.; Guo, Y.; Hong, H.; Jin, L.; Zhang, L.; Chang, R.-Z.; Lu, W.; Lin, M.; Qiu, L.-J. Co-expression of G2-EPSPS and glyphosate acetyltransferase GAT genes conferring high tolerance to glyphosate in soybean. Front. Plant Sci. 2015, 6, 847. [Google Scholar] [CrossRef]
  27. Takano, H.K.; Dayan, F.E. Glufosinate-ammonium: A review of the current state of knowledge. Pest Manag. Sci. 2020, 76, 3911–3925. [Google Scholar] [CrossRef] [PubMed]
  28. Zang, N.; Zhai, H.; Gao, S.; Chen, W.; He, S.; Liu, Q. Efficient production of transgenic plants using the bar gene for herbicide resistance in sweetpotato. Sci. Hortic. 2009, 122, 649–653. [Google Scholar] [CrossRef]
  29. Áy, Z.; Mihály, R.; Cserháti, M.; Kótai, É.; Pauk, J. The Effect of High Concentrations of Glufosinate Ammonium on the Yield Components of Transgenic Spring Wheat (Triticum aestivum L.) Constitutively Expressing the bar Gene. Sci. World J. 2012, 2012, 657945. [Google Scholar] [CrossRef]
  30. Yu, X.; Sun, Y.; Lin, C.; Wang, P.; Shen, Z.; Zhao, Y. Development of Transgenic Maize Tolerant to Both Glyphosate and Glufosinate. Agronomy 2023, 13, 226. [Google Scholar] [CrossRef]
  31. Liang, C.; Sun, B.; Meng, Z.; Meng, Z.; Wang, Y.; Sun, G.; Zhu, T.; Lu, W.; Zhang, W.; Malik, W.; et al. Co-expression of GR79 EPSPS and GAT yields herbicide-resistant cotton with low glyphosate residues. Plant Biotechnol. J. 2017, 15, 1622–1629. [Google Scholar] [CrossRef]
  32. Siddiqui, H.A.; Asad, S.; Naqvi, R.Z.; Asif, M.; Liu, C.; Liu, X.; Farooq, M.; Abro, S.; Rizwan, M.; Arshad, M.; et al. Development and evaluation of triple gene transgenic cotton lines expressing three genes (Cry1Ac-Cry2Ab-EPSPS) for lepidopteran insect pests and herbicide tolerance. Sci. Rep. 2022, 12, 18422. [Google Scholar] [CrossRef]
  33. Zhang, X.-B.; Tang, Q.-L.; Wang, X.-J.; Wang, Z.-X. Development of glyphosate-tolerant transgenic cotton plants harboring the G2-aroA gene. J. Integr. Agric. 2017, 16, 551–558. [Google Scholar] [CrossRef]
  34. Keller, G.; Spatola, L.; McCabe, D.; Martinell, B.; Swain, W.; John, M.E. Transgenic cotton resistant to herbicide bialaphos. Transgenic Res. 1997, 6, 385–392. [Google Scholar] [CrossRef]
  35. Daud, M.; Variath, M.; Ali, S.; Jamil, M.; Khan, M.T.; Shafi, M.; Shuijin, Z. Genetic transformation of bar gene and its inheritance and segregation behavior in the resultant transgenic cotton germplasm (BR001). Pak. J. Bot. 2009, 41, 2167–2178. [Google Scholar] [CrossRef]
  36. Campbell, B.; Hinze, L. Cotton Production, Processing and Uses of Cotton Raw Material; CABI International: Oxon, UK, 2010; pp. 259–276. [Google Scholar] [CrossRef]
  37. Dongjun, L.; Rui, Z.; Sandui, G.; Zhigang, M.; Guoqing, S.; Chengshe, W.; Hongji, Z. Research on Expression of epsps Gene in Cotton Cell Line Y18 under Glyphosate Stress. China Biotechnol. 2008, 10, 55–59. [Google Scholar] [CrossRef]
  38. Yuanyong, G.; Zhenzhen, X.; Shuqiao, G.; Hongmei, S.; Lu, J.; Wanchao, N. Genome-wide Analysis of the EPSPS Genes in Upland Cotton. Acta Agric. Boreali-Sin. 2016, 31, 15–21. [Google Scholar] [CrossRef]
  39. Ma, Z.; Zhang, Y.; Wu, L.; Zhang, G.; Sun, Z.; Li, Z.; Jiang, Y.; Ke, H.; Chen, B.; Liu, Z.; et al. High-quality genome assembly and resequencing of modern cotton cultivars provide resources for crop improvement. Nat. Genet. 2021, 53, 1385–1391. [Google Scholar] [CrossRef]
  40. Khan, M.A.; Wahid, A.; Ahmad, M.; Tahir, M.T.; Ahmed, M.; Ahmad, S.; Hasanuzzaman, M. World Cotton Production and Consumption: An Overview. In Cotton Production and Uses: Agronomy, Crop Protection, and Postharvest Technologies; Ahmad, S., Hasanuzzaman, M., Eds.; Springer: Singapore, 2020; pp. 1–7. [Google Scholar] [CrossRef]
  41. Wendel, J.F.; Cronn, R.C. Polyploidy and the evolutionary history of cotton. Adv. Agron. 2003, 78, 139–186. [Google Scholar] [CrossRef]
  42. Fan, K.; Mao, Z.; Ye, F.; Pan, X.; Li, Z.; Lin, W.; Zhang, Y.; Huang, J.; Lin, W. Genome-wide identification and molecular evolution analysis of the heat shock transcription factor (HSF) gene family in four diploid and two allopolyploid Gossypium species. Genomics 2021, 113, 3112–3127. [Google Scholar] [CrossRef] [PubMed]
  43. Zhu, Y.Q.; Qiu, L.; Liu, L.L.; Luo, L.; Han, X.P.; Zhai, Y.H.; Wang, W.J.; Ren, M.Z.; Xing, Y.D. Identification and Comprehensive Structural and Functional Analyses of the EXO70 Gene Family in Cotton. Genes 2021, 12, 1594. [Google Scholar] [CrossRef]
  44. Wang, S.; Chen, J.; Zhang, W.; Hu, Y.; Chang, L.; Fang, L.; Wang, Q.; Lv, F.; Wu, H.; Si, Z.; et al. Sequence-based ultra-dense genetic and physical maps reveal structural variations of allopolyploid cotton genomes. Genome Biol. 2015, 16, 108. [Google Scholar] [CrossRef] [PubMed]
  45. Pline, W.A.; Wilcut, J.W.; Duke, S.O.; Edmisten, K.L.; Wells, R. Tolerance and Accumulation of Shikimic Acid in Response to Glyphosate Applications in Glyphosate-Resistant and Nonglyphosate-Resistant Cotton (Gossypium hirsutum L.). J. Agric. Food Chem. 2002, 50, 506–512. [Google Scholar] [CrossRef] [PubMed]
  46. Huang, G.-T.; Ma, S.-L.; Bai, L.-P.; Zhang, L.; Ma, H.; Jia, P.; Liu, J.; Zhong, M.; Guo, Z.-F. Signal transduction during cold, salt, and drought stresses in plants. Mol. Biol. Rep. 2012, 39, 969–987. [Google Scholar] [CrossRef] [PubMed]
  47. Chen, Y.; Zhu, A.; Zhou, H. Cloning and Expression Analysis of Glyphosate Resistance Gene EPSPS in Sweet Potato. Acta Bot. Boreali-Occident. Sin. 2020, 40, 0035–3342. [Google Scholar] [CrossRef]
  48. Xuhong, T.; Yuxiang, W.; Shuijins, Z. Cloning of 5-enolpyruvylshikimate-3-phosphate Synthase Genes EPSPS from the Upland Cotton and lts Expression in Different Cotton Tissues. Cotton Sci. 2009, 21, 259–264. [Google Scholar] [CrossRef]
  49. Huang, Z.F.; Zhang, C.X.; Huang, H.J.; Wei, S.H.; Liu, Y.; Cui, H.L.; Chen, J.C.; Yang, L.; Chen, J.Y. Molecular cloning and characterization of 5-enolpyruvylshikimate-3-phosphate synthase gene from Convolvulus arvensis L. Mol. Biol. Rep. 2014, 41, 2077–2084. [Google Scholar] [CrossRef]
  50. Barry, G.; Kishore, G.; Padgette, S.; Taylor, M.; Kolacz, K.; Weldon, M.; Re, D.; Eichholtz, D.; Fincher, K.; Hallas, L. Inhibitors of amino acid biosynthesis: Strategies for imparting glyphosate tolerance to crop plants. In Biosynthesis and Molecular Regulation of Amino Acids in Plants; American Society of Plant Physiologists: Rockville, MD, USA, 1992. [Google Scholar]
  51. He, M.; Yang, Z.-Y.; Nie, Y.-F.; Wang, J.; Xu, P. A new type of class I bacterial 5-enopyruvylshikimate-3-phosphate synthase mutants with enhanced tolerance to glyphosate. Biochim. Biophys. Acta BBA Gen. Subj. 2001, 1568, 1–6. [Google Scholar] [CrossRef]
  52. Hussain, A.; Ding, X.; Alariqi, M.; Manghwar, H.; Hui, F.; Li, Y.; Cheng, J.; Wu, C.; Cao, J.; Jin, S. Herbicide Resistance: Another Hot Agronomic Trait for Plant Genome Editing. Plants 2021, 10, 621. [Google Scholar] [CrossRef]
  53. Sun, Y.-C.; Chen, Y.-C.; Tian, Z.-X.; Li, F.-M.; Wang, X.-Y.; Zhang, J.; Xiao, Z.-L.; Lin, M.; Gilmartin, N.; Dowling, D.N.; et al. Novel AroA with High Tolerance to Glyphosate, Encoded by a Gene of Pseudomonas putida 4G-1 Isolated from an Extremely Polluted Environment in China. Appl. Environ. Microbiol. 2005, 71, 4771–4776. [Google Scholar] [CrossRef]
  54. Gaines, T.A.; Zhang, W.; Wang, D.; Bukun, B.; Chisholm, S.T.; Shaner, D.L.; Nissen, S.J.; Patzoldt, W.L.; Tranel, P.J.; Culpepper, A.S.; et al. Gene amplification confers glyphosate resistance in Amaranthus palmeri. Proc. Natl. Acad. Sci. USA 2010, 107, 1029–1034. [Google Scholar] [CrossRef]
  55. Kaplan, B.; Davydov, O.; Knight, H.; Galon, Y.; Knight, M.R.; Fluhr, R.; Fromm, H. Rapid Transcriptome Changes Induced by Cytosolic Ca2+ Transients Reveal ABRE-Related Sequences as Ca2+-Responsive cis Elements in Arabidopsis. Plant Cell 2006, 18, 2733–2748. [Google Scholar] [CrossRef] [PubMed]
  56. Oberdoerfer, R.B.; Shillito, R.D.; De Beuckeleer, M.; Mitten, D.H. Rice (Oryza sativa L.) containing the bar gene is compositionally equivalent to the nontransgenic counterpart. J. Agric. Food Chem. 2005, 53, 1457–1465. [Google Scholar] [CrossRef]
  57. Xu, C.; Wang, X.; Ma, Z.; Kuai, B. Regulation of bar Gene Expression in the Transgenic Oat T3 Progeny. Physiol. Mol. Biol. Plants 2000, 26, 393–396. [Google Scholar] [CrossRef]
  58. Wu, C.; Wan, Y.; Xu, J.; Su, J.; Fang, X. Expression Analysis of Rice bar Gene Mediated Matrix Attachment Region(MAR) Sequence Transformed by a Gene Bombardment. J. Agric. Biotechnol. 2002, 10, 5. [Google Scholar] [CrossRef]
  59. Carbonari, C.A.; Latorre, D.O.; Gomes, G.L.; Velini, E.D.; Owens, D.K.; Pan, Z.; Dayan, F.E. Resistance to glufosinate is proportional to phosphinothricin acetyltransferase expression and activity in LibertyLink® and WideStrike® cotton. Planta 2016, 243, 925–933. [Google Scholar] [CrossRef]
  60. Taak, P.; Tiwari, S.; Koul, B. Optimization of regeneration and Agrobacterium-mediated transformation of Stevia (Stevia rebaudiana Bertoni): A commercially important natural sweetener plant. Sci. Rep. 2020, 10, 16224. [Google Scholar] [CrossRef]
  61. Ma, S.; Gong, Q.; Bohnert, H.J. Dissecting salt stress pathways. J. Exp. Bot. 2006, 57, 1097–1107. [Google Scholar] [CrossRef]
  62. Zhu, J.-K. Regulation of ion homeostasis under salt stress. Curr. Opin. Plant Biol. 2003, 6, 441–445. [Google Scholar] [CrossRef] [PubMed]
  63. Ali, A.; Petrov, V.; Yun, D.-J.; Gechev, T. Revisiting plant salt tolerance: Novel components of the SOS pathway. Trends Plant Sci. 2023, 28, 1060–1069. [Google Scholar] [CrossRef]
  64. Ding, S.; Wang, L.; Yang, Z.; Lu, Q.; Wen, X.; Lu, C. Decreased glutathione reductase2 leads to early leaf senescence in Arabidopsis. J. Integr. Plant Biol. 2016, 58, 29–47. [Google Scholar] [CrossRef]
  65. Wang, Z.; Cao, H.; Chen, F.; Liu, Y. The roles of histone acetylation in seed performance and plant development. Plant Physiol. Biochem. 2014, 84, 125–133. [Google Scholar] [CrossRef]
  66. Li, F.; Fan, G.; Wang, K.; Sun, F.; Yuan, Y.; Song, G.; Li, Q.; Ma, Z.; Lu, C.; Zou, C.; et al. Genome sequence of the cultivated cotton Gossypium arboreum. Nat. Genet. 2014, 46, 567–572. [Google Scholar] [CrossRef]
  67. Wang, K.; Wang, Z.; Li, F.; Ye, W.; Wang, J.; Song, G.; Yue, Z.; Cong, L.; Shang, H.; Zhu, S.; et al. The draft genome of a diploid cotton Gossypium raimondii. Nat. Genet. 2012, 44, 1098–1103. [Google Scholar] [CrossRef] [PubMed]
  68. Chen, C.; Chen, H.; Zhang, Y.; Thomas, H.R.; Frank, M.H.; He, Y.; Xia, R. TBtools: An Integrative Toolkit Developed for Interactive Analyses of Big Biological Data. Mol. Plant 2020, 13, 1194–1202. [Google Scholar] [CrossRef] [PubMed]
  69. Tamura, K.; Stecher, G.; Kumar, S. MEGA11: Molecular Evolutionary Genetics Analysis Version 11. Mol. Biol. Evol. 2021, 38, 3022–3027. [Google Scholar] [CrossRef]
  70. Zhang, T.; Hu, Y.; Jiang, W.; Fang, L.; Guan, X.; Chen, J.; Zhang, J.; Saski, C.A.; Scheffler, B.E.; Stelly, D.M.; et al. Sequencing of allotetraploid cotton (Gossypium hirsutum L. acc. TM-1) provides a resource for fiber improvement. Nat. Biotechnol. 2015, 33, 531–537. [Google Scholar] [CrossRef] [PubMed]
Figure 1. Chromosome distribution of EPSPS (A) and BAR (B) family members identified from four cotton species. Gh is red, Gb is blue, Ga is purple, and Gr is brown.
Plants 12 03366 g001
Figure 2. Conserved motif and gene structure analysis and phylogenetic tree construction of EPSPS and BAR family members. Conserved protein motifs of the EPSPS (A) and BAR (C) gene. Gene structure of the EPSPS (B) and BAR (D) gene. The conserved motifs in the EPSPS and BAR gene proteins are indicated by colored boxes. The green and yellow boxes represent CDS and UTR, respectively. The length of the boxes and lines are scaled according to the length of the gene.
Plants 12 03366 g002
Figure 3. Phylogenic tree of the EPSPS and BAR family members. Phylogenetic tree of the EPSPS (A) and BAR (B) gene family of six species. By multiple sequence alignment of 30 EPSPS proteins and 37 BAR proteins from each of the six species, the EPSPS gene family was divided into three subgroups, EPSPS-A (9 proteins), EPSPS-B (9 proteins) and EPSPS-C (12 proteins); the BAR gene family was divided into three subgroups, BAR-A (10 proteins), BAR-B (13 proteins) and BAR-C (14 proteins) subgroups.
Plants 12 03366 g003
Figure 4. Collinearity analysis of EPSPS and BAR genes. (A) Collinearity analysis of EPSPS genes among G. hirsutum, G. arboreum, and G. raimondii. (B) Collinearity analysis of EPSPS genes among G. barbadense, G. arboreum, and G. raimondii. (C) Collinearity analysis of BAR genes among G. hirsutum, G. arboreum, and G. raimondii. (D) Collinearity analysis of BAR genes among G. barbadense, G. arboreum, and G. raimondii. The grey lines indicate colinear blocks, and the blue lines indicate the homozygous pairs of common G. hirsutum or G. barbadense with G. arboreum and G. raimondii, respectively. The red inverted triangle represents the location of the EPSPS and BAR genes.
Plants 12 03366 g004
Figure 5. cis-element analysis of family members in tetraploid cotton. Members of the EPSPS (A) and BAR (B) gene family. Colored boxes indicate the different cis-elements in the promoters.
Plants 12 03366 g005
Figure 6. Expression levels of GhEPSPS and GhBAR in cotton under different tissues and stresses. (A) Expression levels of GhEPSPS genes. (B) Expression levels of GhBAR genes. Colors indicate gene expression levels. Red and blue colors indicate high and low expression levels, respectively.
Plants 12 03366 g006
Figure 7. Expression patterns of EPSPS and BAR genes in true leaves under herbicide stress. (A) Nongda 601 seedlings at 0 h, 12 h, 24 h, 36 h, and 48 h. The expression levels of EPSPS (B) and BAR (C) genes at 0 h, 12 h, 24 h, 36 h, and 48 h after herbicide treatment, respectively. The data were shown as mean ± standard error for three biological replicates.
Plants 12 03366 g007
Table 1. EPSPS family member information.
GeneGene IDChromosomeAll Length (bp)CDS Length (bp)Number of ExonsProtein Length (aa)Molecular Weight (kDa)Isoelectric Point
GhEPSPS1GhM_A07G1799A0740951566852155.498.08
GhEPSPS2GhM_A12G1349A1240111566852155.597.83
GhEPSPS3GhM_A12G1350A121797558518520.566.49
GhEPSPS4GhM_A13G2002A1337231461648651.938.43
GhEPSPS5GhM_D07G1761D0741371566852155.377.92
GhEPSPS6GhM_D12G1287D1236431566852155.68.38
GhEPSPS7GhM_D12G1288D122836915630432.766.24
GhEPSPS8GhM_D13G1901D1337191419647250.458.56
GbEPSPS1GbM_A07G1760A0738631566852155.488.26
GbEPSPS2GbM_A12G1269A1239001566852155.67.83
GbEPSPS3GbM_A12G1270A12915558418520.565.67
GbEPSPS4GbM_A13G1999A1337031419647250.238.14
GbEPSPS5GbM_D07G1761D0735801566852155.457.92
GbEPSPS6GbM_D12G1236D1237301566852155.68.38
GbEPSPS7GbM_D12G1237D122820915630432.765.96
GbEPSPS8GbM_D13G1869D1335541419647250.398.56
GaEPSPS1Ga07G1630Chr0741591479949252.687.2
GaEPSPS2Ga12G1903Chr1230911566852155.547.72
GaEPSPS3Ga12G1902Chr12915558418520.625.68
GaEPSPS4Ga13G1869Chr1332051449648251.468.3
GrEPSPS1Gorai.001G174400Chr0139941566852155.327.85
GrEPSPS2Gorai.008G113600Chr0840531566952155.528.73
GrEPSPS3Gorai.008G113700Chr083508666522124.126.87
GrEPSPS4Gorai.008G113800Chr0836421026734137.527.73
GrEPSPS5Gorai.013G173300Chr1337311425647450.698.62
Table 2. BAR family member information.
GeneGene IDChromosomeAll Length (bp)CDS Length (bp)Number of ExonsProtein Length (aa)Molecular Weight (kDa)Isoelectric Point
GhBAR1GhM_A02G0363A021627561118621.236.47
GhBAR2GhM_A08G1199A082810495316418.48.43
GhBAR3GhM_A08G2862A083804834627731.759.03
GhBAR4GhM_D03G0774D035007495316418.518.43
GhBAR5GhM_D08G1150D083053495316418.438.99
GhBAR6GhM_D08G2805D083909834627731.729.04
GbBAR1GbM_A02G0373A023684561218621.236.47
GbBAR2GbM_A08G1080A082763495316418.48.43
GbBAR3GbM_A08G2815A083570834627731.739.18
GbBAR4GbM_D03G0750D0314,746495316418.518.43
GbBAR5GbM_D08G1153D082778495316418.438.99
GbBAR6GbM_D08G2789D083941834627731.729.04
GaBAR1Ga03G0387Chr03561561118621.236.52
GaBAR2Ga05G4007Chr052224489316218.379.51
GaBAR3Ga05G4011Chr052250489316218.359.37
GaBAR4Ga08G1028Chr082202438314516.438.82
GaBAR5Ga08G2611Chr082415822527331.018.77
GrBAR1Gorai.004G110900Chr043619495416418.439.05
GrBAR2Gorai.004G256900Chr043777834627731.759.08
GrBAR3Gorai.005G044300Chr05957561118621.175.85
GrBAR4Gorai.006G233400Chr06508453215017.239.64
GrBAR5Gorai.013G110600Chr1399227028910.238.22
Table 3. Primer information for qRT-PCR.
PrimersSequence (5′–3′)PrimersSequence (5′–3′)
GhEPSPS1-qFGAAATCCCTCTGGAAGGAAACAGhBAR1-qFGAACAAGGTTGTGCCTCACCCT
GhEPSPS1-qRGCAGTAGGACCATCAGCAGhBAR1-qRTGCCTGAATTTGCACTCACCGA
GhEPSPS2-qFTGATGGGTGCCAAAGTCACCTGGhBAR2-qFAAGATGCCATCAACTTCTATC
GhEPSPS2-qRAAGAGTCATAGCAACGTCCGGCGhBAR2-qRGTAAGAACAAAGCAGTCGGGAG
GhEPSPS3-qFACGAGCCGTCCTCAAAGGTTACGhBAR3-qFCAAAGATGTCGTTCAATTGCG
GhEPSPS3-qRCATATTGCGGTTCCAACATTCCGhBAR3-qRGACCCCGGGTTTCGTTACC
GhEPSPS4-qFAGGAGTCCGTGTTTGACAACCGGhBAR4-qFCGGGTTTGAAATCACCGAGACA
GhEPSPS4-qRTAGTGCATTGCTCCCGCTAACCGhBAR4-qRTTTGTTCGCTTGAGATGTAGTG
GhEPSPS5-qFCCGGACCACCAAGAAATCCCTCGhBAR5-qFCCATCCGTGTGTACATCATGACA
GhEPSPS5-qRCTGCTGTCACATTTGGTTCGCCGhBAR5-qRTAGAAGTTGATGGCATCTTCA
GhEPSPS6-qFATCACGGGTGGGACTGTCACGGhBAR6-qFGCTTACGCGTTCGATGCAGGTA
GhEPSPS6-qRCCGCATCCTTCTACCGTGACAGGhBAR6-qRATCGAGTTCGGATCGAGGCAAG
GhEPSPS7-qFATAAACGGAAAGGGTGGTCTTCUBQ14-FCAACGCTCCATCTTGTCCTT
GhEPSPS7-qRAGCTAAATGAGCTGCCATGAGTUBQ14-RTGATCGTCTTTCCCGTAAGC
GhEPSPS8-qFCTTCTCCACAACCTTCCCAATG
GhEPSPS8-qRAATCAACCTCCACTTTGCCAACC
Disclaimer/Publisher’s Note: The statements, opinions and data contained in all publications are solely those of the individual author(s) and contributor(s) and not of MDPI and/or the editor(s). MDPI and/or the editor(s) disclaim responsibility for any injury to people or property resulting from any ideas, methods, instructions or products referred to in the content.

