Article

Identification of QTLs for Grain Protein Content in Russian Spring Wheat Varieties

by
Irina N. Leonova
1,*,
Antonina A. Kiseleva
1,
Alina A. Berezhnaya
1,
Anatoly I. Stasyuk
1,
Ivan E. Likhenko
2 and
Elena A. Salina
1
1
The Federal Research Center Institute of Cytology and Genetics, Siberian Branch of the Russian Academy of Sciences (ICG SB RAS), Prospekt Lavrentyeva 10, 630090 Novosibirsk, Russia
2
Siberian Research Institute of Plant Production and Breeding—Branch of the Institute of Cytology and Genetics, Siberian Branch of the Russian Academy of Sciences, 630501 Krasnoobsk, Russia
*
Author to whom correspondence should be addressed.
Plants 2022, 11(3), 437; https://doi.org/10.3390/plants11030437
Submission received: 28 December 2021 / Revised: 31 January 2022 / Accepted: 1 February 2022 / Published: 5 February 2022

Abstract

:
Most modern breeding programs aim to develop wheat (T. aestivum L.) varieties with a high grain protein content (GPC) due to its greater milling and cooking quality, and improved grain price. Here, we used a genome-wide association study (GWAS) to map single nucleotide polymorphisms (SNPs) associated with GPC in 93 spring bread wheat varieties developed by eight Russian Breeding Centers. The varieties were evaluated for GPC, grain weight per spike (GWS), and thousand-kernel weight (TKW) at six environments, and genotyped with 9351 polymorphic SNPs and two SNPs associated with the NAM-A1 gene. GPC varied from 9.8 to 20.0%, depending on the genotype and environment. Nearly 52% of the genotypes had a GPC > 14.5%, which is the threshold value for entry into high-class wheat varieties. Broad-sense heritability for GPC was moderate (0.42), which is due to the significant effect of environment and genotype × environment interactions. GWAS performed on mean GPC evaluated across six environments identified eleven significant marker-trait associations, of which nine were physically mapped on chromosome 6A. Screening of wheat varieties for allelic variants of the NAM-A1 gene indicated that 60% of the varieties contained the NAM-A1c allele, followed by 33% for NAM-A1d, and 5% for NAM-A1a alleles. Varieties with the NAM-A1d allele showed significantly (p < 0.01) smaller GPC than those with NAM-A1c and NAM-A1a. However, no significant differences between NAM-A1 alleles were observed for both GWS and TKW.

1. Introduction

Wheat (Triticum aestivum L.) plays a key role in most countries worldwide, as a major source of plant protein. According to the FAO data, the area of the worldwide arable land occupied by wheat varieties in recent years is 219 million hectares, of which five major producers and exporters of wheat (China, India, Russia, USA, and Canada) account for 50% of the total area (https://www.fao.org/faostat/ (accessed on 28 December 2021)). Although worldwide annual wheat production has increased over the years, reaching 761 million tons in 2021, the demand for wheat has also constantly increased [1]. The Russian Federation is one of the largest producers and exporters of common wheat. The sown area occupied by winter and spring wheat is constantly increasing, and amounts to about 29 million hectares [2]. Over the past two decades, there has been a significant increase in the yield of winter and spring wheat varieties due to the development and introduction of new high-yielding wheat cultivars [3]. In addition to grain yield, however, modern wheat varieties are expected to consist of desirable allele combinations for multiple traits, including high grain protein content (GPC), early maturity, short plant height, user-specific end-use quality traits, and resistance to major diseases. GPC is important due to its direct effect on milling and baking quality, nutritional value, and grain price. Wheat varieties with a high GPC and good baking qualities have a higher market value.
Bread-making qualities are complex traits that depend on the total GPC, the composition of storage proteins, and on endosperm structure or grain hardness [4,5,6]. Wheat quality is conditioned by a large number of genes and quantitative trait loci (QTLs), which are significantly influenced by environmental factors [7,8]. Various investigations have demonstrated that the heritability of GPC is moderate, and the environment is a key factor determining the phenotypic expression of the trait [9,10,11]. Genetic mapping studies performed using different types of populations identified QTLs associated with GPC in almost all chromosomes of tetra- and hexaploid wheat [12,13,14]. Prasad et al. [9], for example, reported 13 QTLs on chromosomes 2A, 2B, 2D, 3D, 4A, 6B, 7A, and 7D that individually explained phenotypic variance from 3 to 32%. In another study, nine QTLs on chromosomes 1B, 3B, 4A, 5A, 5B, 6B, 7A, 7B, and 7D were identified in a recombinant inbred line (RIL) population, derived from a cross between a winter wheat variety T. aestivum L. var. ‘Forno’ and T. spelta L. variety ‘Oberkulmer’ [15]. Using an association mapping panel of 196 common wheat varieties of various geographic origins, another study reported 15 genomic regions associated with GPC across nine chromosomes [16].
Of the numerous QTLs associated with GPC, Gpc-B1 (NAM-B1) is the most important gene that is located on the short arm of chromosome 6B [17,18,19,20]. The wild-type allele confers high levels of GPC and micronutrients (e.g., iron, zinc) but it reduces grain yield. Although the effect of the wild-type Gpc-B1 allele on GPC in common wheat is much less than in tetraploid wheat, this gene is characterized by a stable contribution to the phenotypic variation of the trait under various environments [21]. However, the wild-type allele has had a negative effect on other traits, including kernel size, thousand-kernel weight, and grain yield [17,22,23]. Grain weight per spike and 1000-kernel weight have been frequently used as indicators of grain yield.
The NAM-B1 gene has been reported in a few commercial wheat cultivars. For example, screening of 196 common wheat varieties from the INRA core collection showed that only five of them carry the wild-type allele of NAM-B1 [18]. Another study by Chen et al. [24] screened 365 winter bread wheat varieties and advanced lines cultivated in China, but the authors did not find any variety that contained a functional NAM-B1 allele. Other NAM genes have been identified in hexaploid wheat, which includes NAM-A1 and NAM-D1 that are located on chromosomes 6A and 6D, respectively. It is assumed that NAM-A1 performs a similar function as NAM-B1 [25,26,27,28]. There is no information on chromosomal localization and allelic composition of loci associated with GPC in wheat varieties developed or grown in Russia. The objectives of this study were, therefore, to identify SNPs associated with GPC in Russian spring wheat varieties, and compare the phenotypic effects of NAM-A1 gene-specific markers.

2. Results

2.1. Phenotypic Variation

Figure 1 summarizes the three traits recorded in individual environments. GPC, GWS, and TKW across the six environments ranged from 9.7 to 20.0%, from 0.8 g to 1.4 g, and 28.1 and 42.2 g, respectively (Figure 1a, Table S1). Most varieties (68.8%) had GPC that varied between 14% and 16%, compared with 12.9% and 18.3% that possessed a GPC greater than 16% and smaller than 14%, respectively. GPC recorded in Field-2 was significantly (p < 0.001) greater (15.2 ± 0.09) than in Field-1 (14.3 ± 0.1), but both TKW and GWS in Field-2 were significantly smaller than in Field-1 (Figure 1b,c).
Analysis of variance (ANOVA) showed significant differences among the 93 genotypes, six environments, and genotype × environment (G×E) interaction for GPC (Table S2). ANOVA performed on GWS and TKW data indicated significant differences among genotypes and environments, but not for G×E interactions. Broad sense heritability estimated from the data of six environments was 0.42 for GPC, 0.57 for GWS, and 0.62 for TKW. There were highly significant positive correlations between TKW and GWS (r = 0.71). GPC was negatively correlated with both GWS and TKW, but the correlation coefficients were low (r = 0.296 and 0.199, respectively).

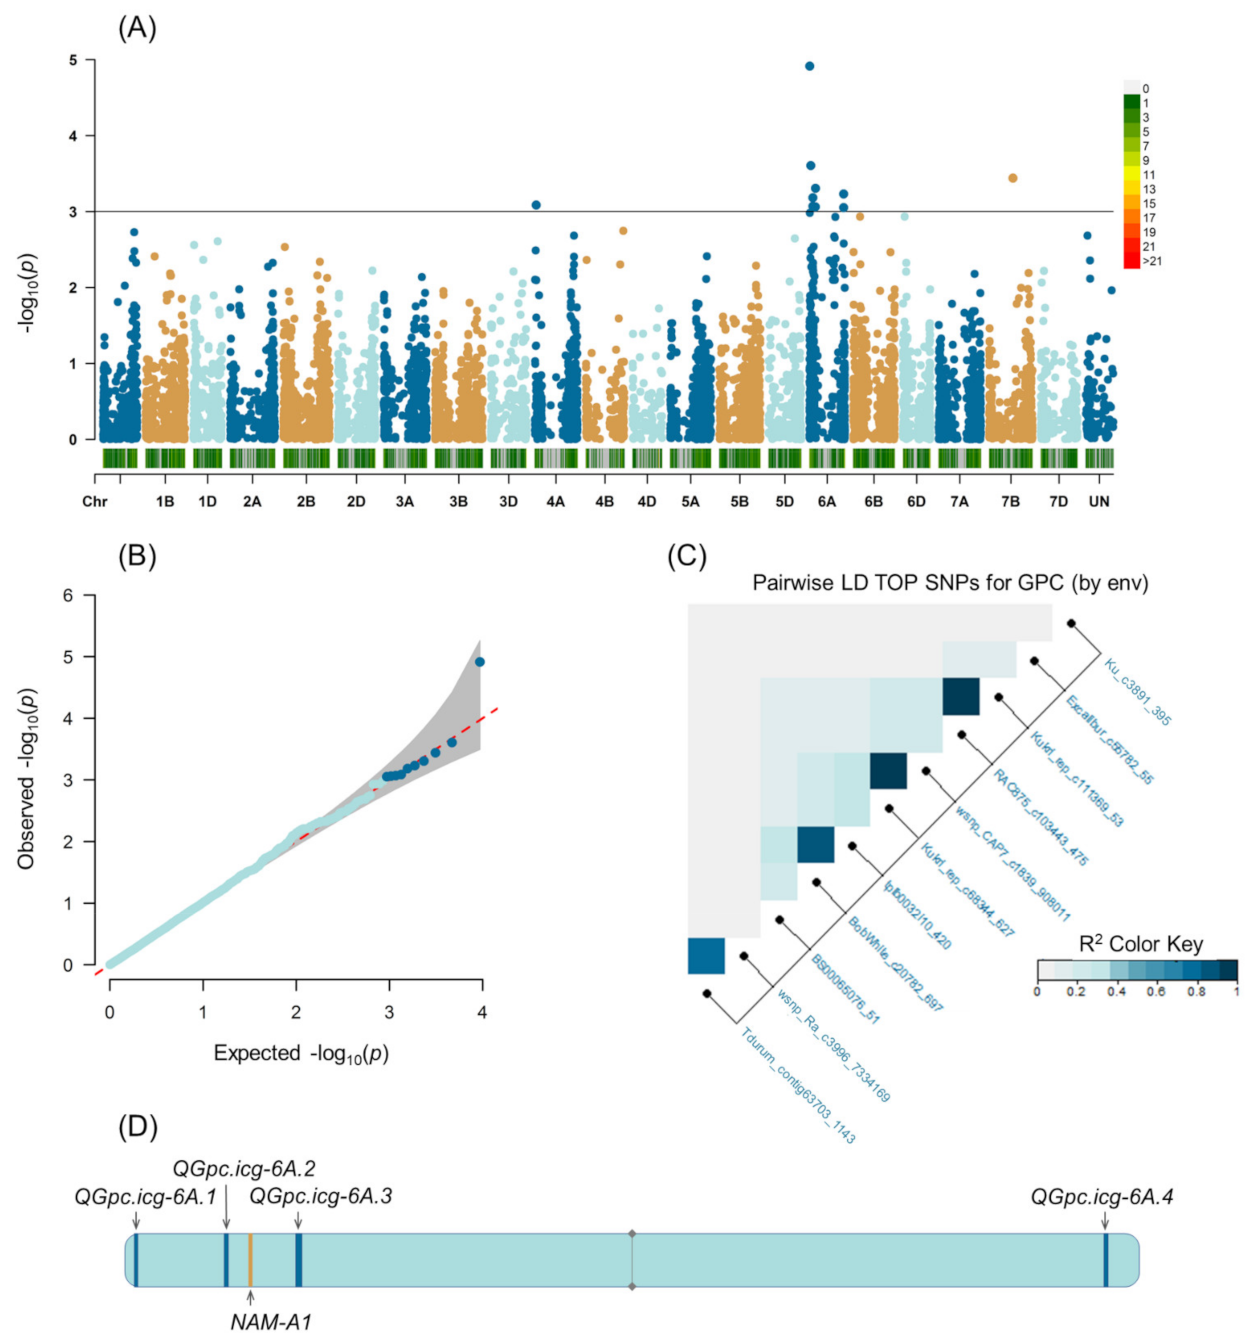
2.2. Population Structure and Genome-Wide Association Study

The 93 spring wheat varieties were genotyped with the Illumina Infinium 15K array and two functional SNPs associated with the NAM-A1 gene of which 9351 SNPs, plus the two functional SNPs, were polymorphic in the germplasm. The number of polymorphic SNPs per chromosome varied from 96 on chromosome 4D to 747 on 2B chromosome (Table 1). One hundred and thirteen of the polymorphic SNPs were not assigned into any of the chromosomes. A plot of the first three principal components (PCs) that accounted for 27.2% of the genetic variation demonstrates the existence of three groups (Figure S1a). PC analysis applied in our study is consistent with the clustering performed by Kiseleva et al. [29] using the STRUCTURE-like algorithm LEA (Figure S1b).
GWAS performed using the mixed linear model (MLM) and GPC data of individual environments showed significant (p-value < 0.001) marker-trait associations (MTAs) for 50 SNPs (Table S3, Figure S2). Using the IWGSC RefSeq v1.0 physical information [30,31], forty-nine of the significant SNPs were distributed across ten chromosomes (1B, 2B, 3A, 3B, 4A, 5B, 5D, 6A, 6B, and 6D). It should be noted that three SNPs were significantly associated with the GPC recorded in three environments: wsnp_Ra_c3996_7334169 in Field-2-2017, Field-2-2018, and Field-1-2019; Tdurum_contig63703_1143 in Field-2-2017 and Field-1-2019, and BS00065076 in Field-2-2018 and Field-1-2019 (Table S3). Twenty-one of the significant SNPs (42%), however, were located on chromosome 6A. GWAS, performed on the best linear unbiased estimations (BLUEs) across six environments, identified eleven SNPs associated with GPC, of which nine were localized physically [30] and genetically [32] on chromosome 6A (Table 2, Figure 2A). One of the significant SNPs (Ku_c3891_395) was localized on chromosome 4A, and another SNP (Excalibur_c55782_55) was not mapped (Table 2). Each significant SNP explained between 19.3% and 27.7% with an overall average of 24.7%. The significant SNPs identified on chromosome 6A were located at 6.7 Mb (QGpc.icg-6A.1), 23.4 Mb, 61.0–61.2 Mb (QGpc.icg-6A.2), 103.7–107.1 Mb (QGpc.icg-6A.3), and 569.9–597.0 Mb (QGpc.icg-6A.4). Candidate gene search using the physical interval of the four QTLs summarized in Table 2 identified a total of 1 gene for QGpc.icg-6A.1, 5 genes for QGpc.icg-6A.2, 38 genes for QGpc.icg-6A.3, and 2 genes for QGpc.icg-6A.4 (Table S4).
An analysis of linkage disequilibrium (LD) (Figure 2C) of markers significantly associated with GPC grouped the SNPs on chromosome 6A into four regions that correspond to QGpc.icg-6A.1 (wsnp_Ra_c3996_7334169, Tdurum_contig63703_1143), QGpc.icg-6A.2 (Kukri_rep_c68344_627, wsnp_CAP7_c1839_908011), QGpc.icg-6A.3 (BobWhite_c20782_697, tplb0032i10_420), and QGpc.icg-6A.4 (RAC875_c103443_475, Kukri_rep_c111369_53) (Table 2, Figure 2D). A positive additive phenotypic effect (1.7–3.8%) was shown for the markers Kukri_rep_c68344_627, wsnp_CAP7_c1839_908011, tplb0032i10_420, and BobWhite_c20782_697 that were physically located on the short arm of chromosome 6A. Localization of these SNPs coincides with the position of the NAM-A1 locus, according to the physical [30] map of chromosome 6A (Table 2, Figure 2D).

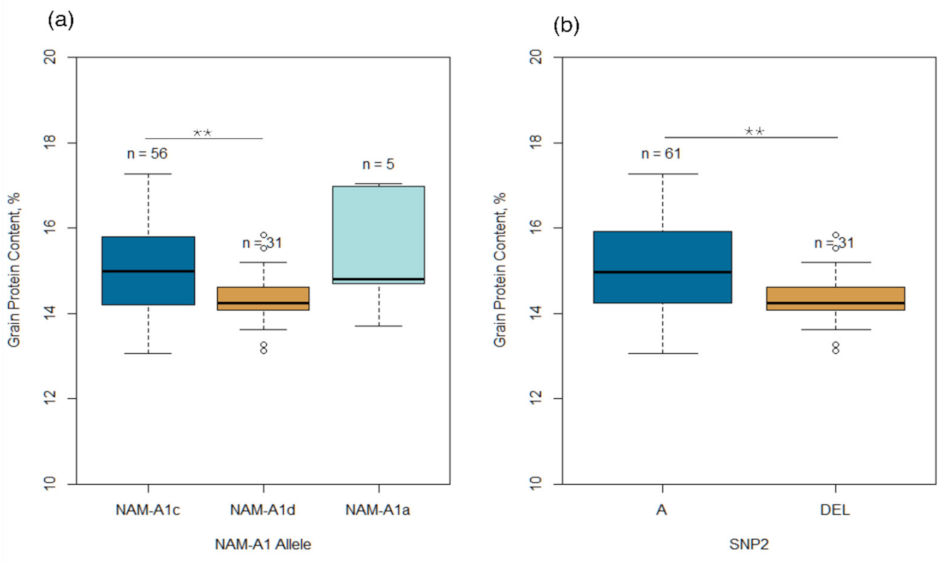
2.3. Allelic Polymorphism of NAM-A1 Gene

Since most MTAs were found on chromosome 6A, we screened the 93 wheat genotypes using two SNPs (SNP1 and SNP2) that were previously reported to detect the allelic composition of the NAM-A1 gene [33]. SNP1 is located in the second exon (6AS: 4397602_16233) and carries the C/T polymorphism followed by the substitution of alanine for valine in the protein sequence. SNP2 is located at the end of the coding sequence (exon 3, 6AS: 4397602_17020) and corresponds to the A/deletion polymorphism leading to a shift in the reading frame. Both types of polymorphism were found in the present study (Figure 3, Table S5). Under the nomenclature proposed by Cormier et al. [33], the alleles amplified by both SNP1 and SNP2 were designated as NAM-A1a, NAM-A1c, and NAM-A1d, which were observed in 5.3%, 60.2%, and 33.3% of the 93 varieties, respectively (Table S5). The NAM-A1a allele was rare, while NAM-A1c was the most abundant. The NAM-A1 allelic composition showed any pattern that was neither on the clustering of the collection into separate groups nor the breeding programs that developed the varieties.
For SNP2, a deletion was detected in 33.3% of the varieties, while nucleotide “A” was identified in 65.6% of the varieties (Table S5). The NAM-A1b allele was not found. Based on the comparative analysis of GPC in varieties containing different allelic variants of the NAM-A1 gene, genotypes with the NAM-A1d allele showed a significantly (p < 0.01) smaller GPC than those with NAM-A1a and NAM-A1c (Figure 3). On the other hand, no significant differences in GWS and TKW were observed among the three NAM-A1 alleles.

3. Discussion

3.1. Phenotypic Variation and MTAs

This study evaluated diverse Russian spring wheat varieties under six environments. According to the standards that determine the commodity classification of wheat in the Russian Federation, GPC for high-class wheat varieties should be at least 14.5%, which was observed in about 52% of the varieties used in the current study (Figure 1A, Table S1). A moderate broad-sense heritability for GPC was observed (0.42) due to the significant effect of environments and G×E interactions, which agrees with several previous studies conducted on tetraploid and hexaploid wheat [34,35,36,37].
Using GWAS, we identified 50 SNPs across ten chromosomes (1B, 2B, 3A, 3B, 4A, 5B, 5D, 6A, 6B, 6D) that were significantly associated with the GPC recorded in each environment (Table S3). Each significant SNP explained between 6.1–41.7% of the phenotypic variation. Several previous studies reported multiple QTLs for GPC on chromosomes 1A, 1B, 2A, 2B, 3A, 4A, 5B, 6A, 7A, and 7B [17,37,38,39,40]. Our GWAS performed on the GPC data averaged across all six environments; however, we identified only eleven significant SNPs, nine of which were located on chromosome 6A (Table 2), which agrees with several previous studies. Using 486 modern wheat cultivars, landraces, and breeding lines from China, America, and Europe, Lou et al. [41] reported 10 QTLs associated with GPC. One of the QTLs for GPC (QNGpc.cau-6A) consisted of a cluster of 30 SNPs between 63 and 83 Mb on chromosome 6A that explained 2.7–4.8% of phenotypic variation. In the present study, two of the eleven SNPs associated with GPC fell within this range QGpc.icg-6A.2 (Table 2). It should also be noted that: (1) QGpc.icg-6A.2 accounted for 24.6–26.8% of the phenotypic variance for GPC, which is over five-fold greater than the effect reported by Lou et al. [41]; and (2) the NAM-A1 gene has been physically located at ~77.1 Mb on chromosome 6A [30]. In another study, Muqaddasi et al. [37] reported SNPs significantly associated with GPC on chromosome 6A in a panel of winter bread wheat varieties of European origin. However, one of the SNPs (Tdurum_contig46828_730) is located at ~643.2 Mb on the IWGSC RefSeq v1.0 map, which is about 46 Mb away from one of the QTLs (QGpc.icg-6A.4) identified in the present study (Table 2). Our results, together with others, suggest the presence of two or more genomic regions associated with GPC on chromosome 6A.
Candidate gene search using the physical interval of the four QTLs summarized in Table 2 identified a total of forty-six T. aestivum genes (Table S4). TraesCS6A02G132700 (6A:104531253-104533070) is one of the candidate genes that encodes a CBS-containing protein, which is expressed predominantly in the developing grain; this gene is slightly or not at all expressed in the other plant tissues [42]. Since proteins with a CBS domain can have a regulatory function, the TraesCS6A02G132700 gene most likely plays a role in grain protein content. In addition to chromosome 6A, we also detected a significant SNP on the short arm of 4A (Ku_c3891_395). According to several studies, chromosome 4A may contain GPC-associated loci, although most QTLs were reported on the long arm of this chromosome [9,21,39].
The power of QTL detection depends on several factors, including population size, marker density, population structure, the genetic architecture of the trait, and trait heritability [43,44]. Our population size was 93 spring wheat varieties and advanced breeding lines, which is comparable to some previous studies [45,46,47]. However, the small size may have restricted our ability in detecting more significant MTAs and/or biased the effect of each identified SNP, which varied between 18.7% and 27.7% (Table 2).

3.2. Effect of NAM-A1 Gene on GPC and Yield Components

The proportion of NAM-A1a, NAM-A1c, and NAM-A1d haplotypes in the Russian spring wheat was 5.3%, 60.2%, and 33.3%, respectively (Table S5). It should be noted that the allelic diversity of the NAM-A1 gene in Russian varieties was correlated neither with the breeding programs that developed the varieties nor with the heading date [48,49]. Cormier et al. [33] studied the allelic variation of the NAM-A1 gene in 367 wheat varieties of different geographical origins, and reported the predominant presence of the NAM-A1c (T/A) allele. At the same time, 72% of the elite European varieties had a NAM-A1d (T/Del) allele as compared with just 0.3% for the NAM-A1b. Among 51 wheat varieties of the Australian selection, NAM-A1a was most common, but NAM-A1b was detected only in one variety [27]. The data of Alhabbar et al. [50,51] confirmed the results of a previous study on the predominant presence of the NAM-A1a allele in the genome of early maturing Australian varieties. On the contrary, the NAM-A1d and NAM-A1b were common in the Pakistan wheat varieties [52].
Orlovskaya et al. [53] studied introgression lines derived from crosses involving wheat varieties Saratovskaya 29, Rassvet, Festivalnaya, Chinese Spring, Belorusskaya 80, and Pitic S62 with wild relatives (T. durum, T. dicoccum, T. dicoccoides, T. timopheevii). Four out of six wheat varieties contained NAM-A1d. Among the wild relatives, the most common haplotype was NAM-A1c; NAM-A1b was not identified among the studied genotypes. Combined across all six environments, we found higher mean GPC among varieties with the NAM-A1a than both NAM-A1c and NAM-A1d, which was consistent with the data of Cormier et al. [33]. Studies by Alhabbar et al. [50,51], on the contrary, reported lower GPC in NAM-A1a haplotypes and higher GPC for non-NAM-A1a haplotypes.

4. Materials and Methods

4.1. Plant Materials and Phenotyping

Plant material included 93 spring wheat varieties and advanced breeding lines (hereafter referred to as varieties) developed by eight Russian Breeding Centers and adapted for cultivation in the Siberian region of the Russian Federation. The list of varieties and their origin is presented in Table S1. More detailed information about the pedigree of the varieties can be found in GRIS Internet resources [54]. Seeds were maintained and multiplied in the Federal Research Center Institute of Cytology and Genetics SB RAS (ICG SB RAS, Novosibirsk). The wheat varieties were grown in six environments on two localities of the Western Siberian region of Russia designated as Field-1 (54.9191° N, 82.9903° E) in 2016, 2018, and 2019, and Field-2 (54.8475° N, 83.1095° E) in 2016, 2017, and 2018. Varieties were sown in mid-May and harvested in September of every year in two replicates on a plot of 1 m wide, with 60 grains per row, at a spacing of 25 cm between rows. The soils at Field-1 and Field-2 were leached chernozem and gray forest, respectively.
Grain protein content was determined using infrared express analyzer OmegAnalyzer G (Bruins Instruments, Munich, Germany) using 10 g seeds in triplicate according to the manufacturer’s instructions. The mean grain weight per spike and the 1000-kernel weight were calculated from 25 plants of each variety.
In 2016, the weather was dry with monthly temperatures in May, June, and July, on average, 4 °C higher than the long-term values. The total precipitation (140 mm) that fell during the heading and grain-filling period in 2016 was almost 40% smaller than the long-term average values (220.0 mm). Total precipitation during the growing season of 2017 was 271.0 mm, which is 10% more than long-term average values (220.0 mm). In 2019, the amount of precipitation (205.0 mm) was comparable to the long-term. The average monthly air temperature in 2017 and 2019 did not differ from the average long-term values. The growing season of 2018 was characterized by low temperatures in May (on average, 5 °C below normal) and high waterlogging in May–June, compared with other seasons. Therefore, the most favorable weather for yield was in 2017 and 2019.

4.2. Statistical Analysis of Phenotype Data

The phenotype data analyses were performed using R. The two-way ANOVA was performed to determine the significance of differences among the genotypes and the environments using genotypes as a fixed effect, and environments and replications as random effects. Pearson’s correlation coefficients (r) were calculated to explore the association among GPC, grain weight per spike, and thousand-kernel weight. The significance of differences between the mean values of the two sample sets was determined using the Student’s t-test. The broad-sense heritability (H2) across all environments was calculated as:
H 2 = σ G 2 σ G 2 + σ G × E 2 E n v + σ e 2 E n v × R e p
where σ G 2 , σ G × E 2 , and σ e 2 are the genotypic variance, G×E interaction, and residual (error) variance, respectively, while Env and Rep are the number of environments and the number of replicates within each environment, respectively.

4.3. DNA Isolation, Genotyping, and Genome-Wide Association Study

Genomic DNA was isolated from 5–7-day-old seedlings using a modified sodium bisulfite protocol, as described by Kiseleva et al. [55]. DNA purification for SNP genotyping was performed using the “Bio-Silica” kit according to the manufacturer’s protocol. The DNA concentration was measured with a NanoDrop M2000 (Thermo Scientific, Waltham, MA, USA). Genotyping was carried out with the Illumina Infinium 15K array at TraitGenetics company (Gatersleben, Germany, www.traitgenetics.com (accessed on 28 December 2021)) that consisted of 13,006 SNP markers that were mapped in the wheat genome [30,32]. SNP markers with a minor allele frequency (MAF) less than 5% and missing data > 5% were excluded from the genotype data set. The International Wheat Genome Sequencing Consortium (IWGSC) RefSeq v. 1.0 chromosome location and position of each SNP was obtained from the Triticeae Toolbox [30], while the consensus genetic map was obtained from Wang et al. [32]. A genome-wide association study (GWAS) was performed using the mixed linear model (MLM) method implemented in the TASSEL v. 5.2.50 software [56] on the following data: (a) the 9351 polymorphic SNPs, (b) the first three principal components to account for population structure (Q-matrix), (c) kinship (K-matrix), and (d) the best linear unbiased estimations (BLUEs) computed within each environment and combined across six environments. Both the principal component (PC) and kinship matrix were computed from the 9351 polymorphic SNPs using TASSEL v5.2.50 [56].
Quantile–quantile and Manhattan plots were generated using the R package “GWASTools” [57]. Significant marker-trait associations were declared at p-values < 0.001 after adjustment for multiple testing using the Benjamini–Hochberg method [58]. Linkage disequilibrium (LD) between SNP markers was calculated using the R package “genetics” [59]. LD decay plots were generated using the R package “LDheatmap” [60]. Chromosome positions of SNP markers were established according to the IWGSC 1.0 annotation [30] and consensus genetic maps [32]. The start and end physical positions of each QTL were used to search for candidate genes at the Ensemble Plants using Triticum aestivum genome (https://plants.ensembl.org/index.html (accessed on 28 December 2021)).

4.4. Genotyping with NAM-A1 Specific SNPs

A pair of previously reported primers, NAMA1F (5′-TAGCTAGCTTGCTAGGGGGAAC-3′) and NAMA1R (5′-CAACTACTGGCTACACTTGCAAA-3′) [27], were used for amplification of the full-length NAM-A1 gene sequences. The PCR products were separated on 2.0% agarose gel, the target bands were excised from the gel and purified using QIAquick® Gel Extraction Kit (QIAGEN, Germantown, MD, USA). SNP detection was performed by the Sanger sequencing method. PCR products were directly sequenced using a BigDye Terminator v. 3.1 kit (Applied Biosystems, Waltham, MA, USA) with primers 512-R (5′-TGCTAGCTATACCGTGCGAT-3′) and 1191-F (5′-GGACGTACCATCAACACCAT-3′) reported by Orlovskaya et al. [53] to detect SNP1 and SNP2 polymorphisms in NAM-A1 gene, respectively. Sequencing products were analyzed at the Collective Use Center “Genomika” of the SB RAS.

5. Conclusions

Most of the Russian spring wheat varieties had a grain protein content greater than the 14.5% for entry into high-class wheat varieties (also “strong” or “valuable” class). Genome-wide association analysis conducted on the mean GPC of the six environments identified significant MTAs on chromosomes 4A and 6A, but most SNPs were mapped at five regions on 6A. Each significant SNP explained between 18.7% and 27.7% of the GPC averaged across the six environments, which may have been upward biased to the relatively small population size. Haplotype screening of the NAM-A1 gene using two SNPs showed that 95% of varieties contained either the NAM-A1c (60%) or NAM-A1d (33%) alleles, with the NAM-A1a allele accounting for the remaining 5%. The results presented here provide researchers with valuable data for selecting parental lines for new breeding starts, and understanding the SNPs that map close to the NAM-A1 gene. However, the physical information (chromosomes and their positions) presented in this paper is based on IWGSC RefSeq v1.0, which may be different from the latest version (IWGSC RefSeq v2.1).

Supplementary Materials

The following supporting information can be downloaded at: https://www.mdpi.com/article/10.3390/plants11030437/s1, Figure S1: Population structure among 93 spring wheat varieties. Figure S2: Manhattan and QQ plots o based on genome-wide association mapping of grain protein content recorded in 93 spring wheat varieties at six location x year combinations (environments). Table S1: Summary of the grain protein content (%) data recorded in 93 spring wheat varieties evaluated between 2016 and 2019 at Field-1 and Field-2 (six environments in total). Table S2: Analysis of variance for grain protein content (GPC), grain weight per spike (GWS) and thousand kernel weight (TKW) in the 93 spring wheat genotypes. Table S3: List of SNP markers associated with grain protein content in six environments. Table S4: Candidate gene list. Table S5: Allelic polymorphism of NAM-A1 gene in spring wheat varieties.

Author Contributions

Conceptualization, I.N.L.; methodology, I.N.L. and A.A.K.; formal analysis, I.N.L. and A.A.K.; investigation, A.A.B. and A.I.S.; resources, I.E.L.; funding acquisition, E.A.S.; supervision, E.A.S.; writing—original draft preparation, I.N.L. and A.A.K.; writing—review and editing, I.N.L. and A.A.K. All authors have read and agreed to the published version of the manuscript.

Funding

The study was carried out with financial support by the Russian Science Foundation (RSF project No. 21-76-30003).

Institutional Review Board Statement

Not applicable.

Informed Consent Statement

Not applicable.

Data Availability Statement

The data presented in this study are available in Supplementary Materials.

Acknowledgments

Multiplication of the plant material was conducted in the Laboratory of Artificial Plant Growth of ICG SB RAS within the budgetary project FWNR-2022-0017.

Conflicts of Interest

The authors declare no conflict of interest. The funders had no role in the design of the study; in the collection, analyses, or interpretation of data; in the writing of the manuscript, or in the decision to publish the results.

References

  1. FAO. Cereal Supply and Demand Brief. Available online: https://www.fao.org/worldfoodsituation/csdb/en/ (accessed on 12 January 2021).
  2. Federal State Statistics Service. Available online: https://rosstat.gov.ru/compendium/document/13276 (accessed on 1 October 2021).
  3. Silaeva, L.P.; Barinova, E.V. Modern condition and conditions of rational placement of wheat production. Econ. J. 2019, 53, 33–42. [Google Scholar] [CrossRef]
  4. Pomeranz, Y.; Bolling, H.; Zwingelberg, H. Wheat hardness and baking properties of wheat flours. J. Cereal Sci. 1984, 2, 137–143. [Google Scholar] [CrossRef]
  5. MacRitchie, F. Evaluations of contributions from wheat protein fractions to dough mixing and bread making. J. Cereal Sci. 1987, 6, 259–268. [Google Scholar] [CrossRef]
  6. Huebner, F.R.; Bietz, J.A.; Nelson, T.; Bains, S.G.; Finney, P.L. Soft wheat quality as related to protein composition. Cereal Chem. 1999, 76, 650–655. [Google Scholar] [CrossRef]
  7. Kulwal, P.; Kumar, N.; Kumar, A.; Gupta, R.K.; Balyan, H.S.; Gupta, P.K. Gene networks in hexaploid wheat: Interacting quantitative trait loci for grain protein content. Funct. Integr. Genom. 2005, 5, 254–259. [Google Scholar] [CrossRef] [PubMed]
  8. Kumar, A.; Mantovani, E.E.; Simsek, S.; Jain, S.; Elias, E.M.; Mergoum, M. Genome wide genetic dissection of wheat quality and yield related traits and their relationship with grain shape and size traits in an elite × non-adapted bread wheat cross. PLoS ONE 2019, 14, e0221826. [Google Scholar] [CrossRef] [PubMed]
  9. Prasad, M.; Kumar, N.; Kulwal, P.L.; Röder, M.S.; Balyan, H.S.; Dhaliwal, H.S.; Gupta, P.K. QTL analysis for grain protein content using SSR markers and validation studies using NILs in bread wheat. Theor. Appl. Genet. 2003, 106, 659–667. [Google Scholar] [CrossRef]
  10. Balyan, H.S.; Gupta, P.K.; Kumar, S.; Dhariwal, R.; Jaiswal, V.; Tyagi, S.; Agarwal, P.; Gahlaut, V.; Kumari, S. Genetic improvement of grain protein content and other health-related constituents of wheat grain. Plant Breed. 2013, 132, 446–457. [Google Scholar] [CrossRef]
  11. Ahmed, H.G.M.; Sajjad, M.; Zeng, Y.; Iqbal, M.; Khan, S.H.; Ullah, A.; Akhtar, M.N. Genome-wide association mapping through 90K SNP array for quality and yield attributes in bread wheat against water-deficit conditions. Agriculture 2020, 10, 392. [Google Scholar] [CrossRef]
  12. Blanco, A.; de Giovanni, C.; Laddomada, B.; Sciancalepore, A.; Simeone, R.; Devos, K.M.; Gale, M.D. Quantitative trait loci influencing grain protein content in tetraploid wheats. Plant Breed. 1996, 115, 310–316. [Google Scholar] [CrossRef]
  13. Bogard, M.; Allard, V.; Martre, P.; Heumez, E.; Snape, J.W.; Orford, S.; Griffiths, S.; Gaju, O.; Foulkes, J.; Le Gouis, J. Identifying wheat genomic regions for improving grain protein concentration independently of grain yield using multiple inter-related populations. Mol. Breed. 2013, 31, 587–599. [Google Scholar] [CrossRef]
  14. Kumar, A.; Jain, S.; Elias, E.M.; Ibrahim, M.; Sharma, L.K. An overview of QTL identification and marker-assisted selection for grain protein content in wheat. In Eco-friendly Agro-biological Techniques for Enhancing Crop Productivity; Sengar, R., Singh, A., Eds.; Springer Nature: Singapore, 2018; pp. 245–273. [Google Scholar] [CrossRef]
  15. Zanetti, S.; Winzeler, M.; Feuillet, C.; Keller, B.; Messmer, M. Genetic analysis of bread-making quality in wheat and spelt. Plant Breed. 2001, 120, 13–19. [Google Scholar] [CrossRef]
  16. Bordes, J.; Ravel, C.; Jaubertie, J.P.; Duperrier, B.; Gardet, O.; Heumez, E.; Pissavy, A.L.; Charmet, G.; Le Gouis, J.; Balfourier, F. Genomic regions associated with the nitrogen limitation response revealed in a global wheat core collection. Theor. Appl. Genet. 2013, 126, 805–822. [Google Scholar] [CrossRef] [PubMed]
  17. Joppa, L.R.; Du, C.; Hart, G.E.; Hareland, G.A. Mapping a QTL for grain protein in tetraploid wheat (Triticum turgidum L.) using a population of recombinant inbred chromosome lines. Crop Sci. 1997, 37, 1586–1589. [Google Scholar] [CrossRef]
  18. Hagenblad, J.; Asplund, L.; Balfourier, F.; Ravel, K.; Leino, M.W. Strong presence of the high grain protein content allele of NAM-B1 in Fennoscandian wheat. Theor. Appl. Genet. 2012, 125, 1677–1686. [Google Scholar] [CrossRef]
  19. Uauy, C.; Brevis, J.C.; Dubcovsky, J. The high grain protein content gene Gpc-B1 accelerates senescence and has pleiotropic effects on protein content in wheat. J. Exp. Bot. 2006, 57, 2785–2794. [Google Scholar] [CrossRef]
  20. Uauy, C.; Distelfeld, A.; Fahima, T.; Blechl, A.; Dubkovsky, J.A. NAC gene regulating senescence improves grain protein, zink, and iron content in wheat. Science 2006, 314, 1298–1301. [Google Scholar] [CrossRef] [PubMed] [Green Version]
  21. Kumar, J.; Saripalli, G.; Gahlaut, V.; Goel, N.; Meher, P.K.; Mishra, K.K.; Mishra, P.C.; Sehgal, D.; Vikram, P.; Sansaloni, C.; et al. Genetics of Fe, Zn, b-carotene, GPC and yield traits in bread wheat (Triticum aestivum L.) using multi-locus and multitraits GWAS. Euphytica 2018, 214, 219. [Google Scholar] [CrossRef]
  22. Carter, A.H.; Santra, D.K.; Kidwell, K.K. Assessment of the effects of the Gpc-B1 allele on senescence rate, grain protein concentration and mineral content in hard red spring wheat (Triticum aestivum L.) from the Pacific Northwest Region of the USA. Plant Breed. 2012, 131, 62–68. [Google Scholar] [CrossRef]
  23. Lundström, M.; Leino, M.W.; Hagenblad, J. Evolutionary history of the NAM-B1 gene in wild and domesticated tetraploid wheat. BMC Genet. 2017, 18, 118. [Google Scholar] [CrossRef]
  24. Chen, X.; Song, G.; Zhang, S.; Li, Y.; Gao, J.; Islam, S.; Ma, W.; Li, G.; Ji, W. The allelic distribution and variation analysis of the NAM-B1 gene in Chinese wheat cultivars. J. Integr. Agric. 2017, 16, 1294–1303. [Google Scholar] [CrossRef] [Green Version]
  25. Distelfeld, A.; Pearce, S.P.; Avni, R.; Scherer, B.; Uauy, C.; Piston, F.; Slade, A.; Zhao, R.; Dubcovsky, J. Divergent functions of orthologous NAC transcription factors in wheat and rice. Plant Mol. Biol. 2012, 78, 515–524. [Google Scholar] [CrossRef] [Green Version]
  26. Avni, R.; Zhao, R.; Pearce, S.; Jun, Y.; Uauy, C.; Tabbita, F.; Fahima, T.; Slade, A.; Dubcovsky, J.; Distelfeld, A. Functional characterization of GPC-1 genes in hexaploid wheat. Planta 2014, 239, 313–324. [Google Scholar] [CrossRef] [Green Version]
  27. Yang, R.; Juhasz, A.; Zhang, Y.; Chen, X.; Zhang, Y.; She, M.; Zhang, J.; Maddern, R.; Edwards, I.; Diepeveen, D.; et al. Molecular characterization of the NAM-1 genes in bread wheat in Australia. Crop Pasture Sci. 2018, 69, 1173. [Google Scholar] [CrossRef]
  28. Harrington, S.A.; Overend, L.E.; Cobo, N.; Borrill, P.; Uauy, C. Conserved residues in the wheat (Triticum aestivum) NAM-A1 NAC domain are required for protein binding and when mutated lead to delayed peduncle and flag leaf senescence. BMC Plant Biol. 2019, 19, 407. [Google Scholar] [CrossRef] [Green Version]
  29. Kiseleva, A.A.; Leonova, I.N.; Pshenichnikova, T.A.; Salina, E.A. Dissection of novel candidate genes for grain texture in Russian wheat varieties. Plant Mol. Biol. 2020, 104, 219–233. [Google Scholar] [CrossRef] [PubMed]
  30. Blake, V.; Birkett, C.L.; Matthews, D.E.; Hane, D.; Bradbury, P.; Jannink, J. The Triticeae Toolbox: Combining phenotype and genotype data to advance small-grains breeding. Plant Genome 2016, 9, 1–10. [Google Scholar] [CrossRef] [Green Version]
  31. Appels, R.; Eversole, K.; Feuillet, K.; Keller, B.; Rogers, J.; Stein, N. Shifting the limits in wheat research and breeding using a fully annotated reference genome International Wheat Genome Sequencing Consortium (IWGSC). Science 2018, 361, eaar7191. [Google Scholar] [CrossRef] [Green Version]
  32. Wang, S.; Wong, D.; Forrest, K.; Allen, A.; Chao, S.; Huang, B.E.; Maccaferri, M.; Salvi, S.; Milner, S.G.; Cattivelli, L.; et al. Characterization of polyploid wheat genomic diversity using a high-density 90,000 single nucleotide polymorphism array. Plant Biotechnol. J. 2014, 12, 787–796. [Google Scholar] [CrossRef] [PubMed] [Green Version]
  33. Cormier, F.; Throude, M.; Ravel, C.; Gouis, J.L.; Leveugle, M.; Lafarge, S.; Exbrayat, F.; Duranton, N.; Praud, S. Detection of NAM-A1 natural variants in bread wheat reveals differences in haplotype distribution between a worldwide core collection and European elite germplasm. Agronomy 2015, 5, 143–151. [Google Scholar] [CrossRef]
  34. Blanco, A.; Pasqualone, A.; Troccoli, A.; Di Fonzo, N.; Simeone, R. Detection of grain protein content QTLs across environments in tetraploid wheats. Plant Mol. Biol. 2002, 48, 615–623. [Google Scholar] [CrossRef] [PubMed]
  35. Kaya, Y.; Sahin, M. Non-parametric stability analysis of protein content in multi-environment trialsof wheat (T. aestivum L.). Genetica 2015, 47, 795–810. [Google Scholar] [CrossRef]
  36. Kondić-Špika, A.; Mladenov, N.; Grahovac, N.; Zorić, M.; Mikić, S.; Trkulja, D.; Marjanović-Jeromela, A.; Miladinović, D.; Hristov, N. Biometric analyses of yield, oil and protein contents of wheat (Triticum aestivum L.) genotypes in different environments. Agronomy 2019, 9, 270. [Google Scholar] [CrossRef] [Green Version]
  37. Muqaddasi, Q.H.; Brassac, J.; Ebmeyer, E.; Kollers, S.; Korzun, V.; Argillier, O.; Stiewe, G.; Plieske, J.; Ganal, M.W.; Röder, M.S. Prospects of GWAS and predictive breeding for European winter wheat’s grain protein content, grain starch content, and grain hardness. Sci. Rep. 2020, 10, 12541. [Google Scholar] [CrossRef] [PubMed]
  38. Liu, J.; Huang, L.; Wang, C.; Liu, Y.; Yan, Z.; Wang, Z.; Xiang, L.; Zhong, X.; Gong, F.; Zheng, Y.; et al. Genome-wide association study reveals novel genomic regions associated with high grain protein content in wheat lines derived from wild emmer wheat. Front. Plant Sci. 2019, 10, 464. [Google Scholar] [CrossRef] [PubMed]
  39. Sallam, A.H.; Fazal, M.; Bajgain, P.; Matthew, M.; Szinyei, T.; Conley, E.; Brown-Guedira, G.; Muehlbauer, G.J.; Anderson, J.A.; Steffenson, B.J. Genetic architecture of agronomic and quality traits in a nested association mapping population of spring wheat. Plant Genome 2020, 13, e20051. [Google Scholar] [CrossRef] [PubMed]
  40. Alemu, A.; Baouchi, A.E.; Hanafi, S.E.; Kehel, Z.; Eddakhir, K.; Tadesse, W. Genetic analysis of grain protein content and dough quality traits in elite spring bread wheat (Triticum aestivum) lines through association study. J. Cereal Sci. 2021, 100, 103214. [Google Scholar] [CrossRef]
  41. Lou, H.Y.; Zhang, R.Q.; Liu, Y.T.; Guo, D.D.; Zhai, S.S.; Chen, A.Y.; Zhang, Y.F.; Xie, C.J.; You, M.S.; Peng, H.R.; et al. Genome-wide association study of six quality-related traits in common wheat (Triticum aestivum L.) under two sowing conditions. Theor. Appl. Genet 2021, 134, 399–418. [Google Scholar] [CrossRef]
  42. Krzywinski, M.; Schein, J.; Birol, I.; Connors, J.; Gascoyne, R.; Horsman, D.; Jones, S.J.; Marra, M.A. The transcriptional landscape of polyploid wheat. Science 2018, 361, eaar6089. [Google Scholar] [CrossRef] [Green Version]
  43. Korte, A.; Farlow, A. The advantages and limitations of trait analysis with GWAS: A review. Plant Methods 2013, 9, 29. [Google Scholar] [CrossRef] [Green Version]
  44. Tam, V.; Patel, N.; Turcotte, M.; Bossé, Y.; Paré, G.; Meyre, D. Benefits and limitations of genome-wide association studies. Nat. Rev. Genet. 2019, 20, 467–484. [Google Scholar] [CrossRef] [PubMed]
  45. Chen, H.; Semagn, K.; Iqbal, M.; Moakhar, N.P.; Haile, T.; N’Diaye, A.; Yang, R.C.; Hucl, P.; Pozniak, C.; Spaner, D. Genome-wide association mapping of genomic regions associated with phenotypic traits in Canadian western spring wheat. Mol. Breed. 2017, 37, 141. [Google Scholar] [CrossRef]
  46. Zeng, B.; Yan, H.; Liu, X.; Zang, W.; Zhang, A.; Zhou, S.; Huang, L.; Liuet, J. Research open access genome-wide association study of rust traits in orchardgrass using SLAF-seq technology. Hereditas 2017, 154, 5. [Google Scholar] [CrossRef] [Green Version]
  47. Mwadzingeni, L.; Shimelis, H.; Rees, D.J.G.; Tsilo, T.J. Genome-wide association analysis of agronomic traits in wheat under drought-stressed and non-stressed conditions. PLoS ONE 2017, 12, e0171692. [Google Scholar] [CrossRef] [Green Version]
  48. Leonova, I.N.; Skolotneva, E.S.; Salina, E.A. Genome-wide association study of leaf rust resistance in Russian spring wheat varieties. BMC Plant Biol. 2020, 20, 135. [Google Scholar] [CrossRef] [PubMed]
  49. Berezhnaya, A.; Kiseleva, A.; Leonova, I.; Salina, E. Allelic variation analysis at the vernalization response and photoperiod genes in Russian wheat varieties identified two novel alleles of Vrn-B3. Biomolecules 2021, 11, 1897. [Google Scholar] [CrossRef] [PubMed]
  50. Alhabbar, Z.; Yang, R.; Juhasz, A.; Xin, H.; She, M.; Anwar, M.; Sultana, N.; Diepeveen, D.; Ma, W.; Islam, S. NAM gene allelic composition and its relation to grain-filling duration and nitrogen utilization efficiency of Australian wheat. PLoS ONE 2018, 13, e0205448. [Google Scholar] [CrossRef]
  51. Alhabbar, Z.; Islam, S.; Yang, R.; Diepeveen, D.; Anwar, M.; Balotf, F.; Sultana, N.; Maddern, R.; She, M.; Zhang, J.; et al. Associations of NAM-A1 alleles with the onset of senescence and nitrogen use efficiency under Western Australian conditions. Euphytica 2018, 214, 180. [Google Scholar] [CrossRef]
  52. Shaukat, M.; Sun, M.; Ali, M.; Mahmood, T.; Naseer, S.; Maqbool, S.; Rehman, S.; Mahmood, Z.; Hao, Y.; Xia, X.; et al. Genetic gain for grain micronutrients and their association with phenology in historical wheat cultivars released between 1911 and 2016 in Pakistan. Agronomy 2021, 11, 1247. [Google Scholar] [CrossRef]
  53. Orlovsjaya, O.A.; Vakula, S.I.; Khotyleva, L.V.; Kilchevsky, A.V. Estimation of NAM-A1 haplotypes effects on the level of quantitative traits and grain protein content in wheat. Fakt. Eksperimentalnoi Evol. Org. 2020, 26, 114–119. [Google Scholar] [CrossRef]
  54. Genetic Resources Information System for Wheat and Triticale. Available online: http://wheatpedigree.net (accessed on 11 January 2022).
  55. Kiseleva, A.A.; Shcherban, A.B.; Leonova, I.N.; Frenkel, Z.; Salina, E.A. Identification of new heading date determinants in wheat 5B chromosome. BMC Plant Biol. 2016, 16, 8. [Google Scholar] [CrossRef] [PubMed] [Green Version]
  56. Bradbury, P.J.; Zhang, Z.; Kroon, D.E.; Casstevens, T.M.; Ramdoss, Y.; Buckler, E.S. TASSEL: Software for association mapping of complex traits in diverse samples. Bioinformatics 2007, 23, 2633–2635. [Google Scholar] [CrossRef]
  57. Gogarten, S.M.; Bhangale, T.; Conomos, M.P.; Laurie, C.A.; McHugh, C.P.; Painter, I.; Zheng, X.; Crosslin, D.R.; Levine, D.; Lumley, T.; et al. GWASTools: An R/Bioconductor package for quality control and analysis of genome-wide association studies. Bioinformatics 2012, 28, 3329–3331. [Google Scholar] [CrossRef] [Green Version]
  58. Benjamini, Y.; Hochberg, Y. Controlling the false discovery rate: A practical and powerful approach to multiple testing. J. R. Stat. Soc. Ser. B 1995, 57, 289–300. [Google Scholar] [CrossRef]
  59. Population Genetics. Available online: https://cran.r-project.org/web/packages/genetics/index.html (accessed on 15 October 2021).
  60. Shin, J.H.; Blay, S.; McNeney, B.; Graham, J. LDheatmap: An r function for graphical display of pairwise linkage disequilibria between single nucleotide polymorphisms. J. Stat. Soft. 2006, 16, 1–10. [Google Scholar] [CrossRef] [Green Version]
Figure 1. Box plot of (a) grain protein content, (b) grain weight per spike, and (c) thousand-kernel weight in Russian spring wheat varieties evaluated at six environments (two locations × three years).
Plants 11 00437 g001
Figure 2. Summary of genome-wide association studies based on the grain protein content in six environments. (A) Manhattan plot; (B) quantile–quantile plot; (C) LD plot representing the association of significant SNP markers with the color key indicating the strength of LD from 0 to 1; (D) schematic illustration of the localization of QTLs and the NAM-A1 locus on chromosome 6A with the vertical line in the middle referring to the centromere position.
Plants 11 00437 g002
Figure 3. Variability of grain protein content in 93 spring wheat varieties based on (a) the allelic composition of three NAM-A1 haplotypes, and (b) polymorphism based on the SNP2. Asterisks (**) indicate statistically significant differences (p < 0.01) between NAM-A1 alleles. The horizontal line inside the box is the median.
Plants 11 00437 g003
Table 1. Summary of the polymorphic genome-wide SNPs used in the present study across three wheat genomes.
GenomeChromosomeUnknownTotal
1234567
A571499479382514532570-3547
B567747535215681600463-3808
D34742921396288296214-1883
Unknown-------1139351
Table 2. SNP markers associated with grain protein content (GPC) in 93 spring wheat varieties evaluated across six environments.
MarkerChromosome Based on IWGSC Refseq v. 1.0PositionF *p-ValueFavorable AlleleR2 **QTL
IWGSC Refseq v. 1.0 (bp)90K Array Consensus Map, cM
Tdurum_contig63703_11436A673349416.589.750.00018T19.3QGpc.icg-6A.1
wsnp_Ra_c3996_73341696A673380316.9522.110.00001A21.8
BS00065076_516A2337201243.099.160.00030A27.1
Kukri_rep_c68344_6276A6103767871.237.670.00095T26.8QGpc.icg-6A.2
wsnp_CAP7_c1839_9080116A6121249571.2312.790.00063A24.6
tplb0032i10_4206A10376010676.927.590.00100A23.6QGpc.icg-6A.3
BobWhite_c20782_6976A10711319877.138.590.00044G22.8
RAC875_c103443_4756A596903177125.227.890.00078A27.7QGpc.icg-6A.4
Kukri_rep_c111369_536A597031623125.228.340.00054T27.7
Ku_c3891_3954A2767309937.0512.190.00083C25.4
Excalibur_c55782_55Unknown5950127.65 (7D)8.540.00047G18.7
*—F-test for marker; **—marker R2 (%) for grain protein content.
Publisher’s Note: MDPI stays neutral with regard to jurisdictional claims in published maps and institutional affiliations.

