Article

Expression Profiling of Four Mango FT/TFL1-Encoding Genes under Different Fruit Load Conditions, and Their Involvement in Flowering Regulation

1
Institute of Plant Sciences, Agricultural Research Organization (ARO), The Volcani Center, Rishon LeZion 7528809, Israel
2
The Robert H. Smith Institute of Plant Sciences and Genetics in Agriculture, Faculty of Agriculture, Food and Environment, The Hebrew University of Jerusalem, Rehovot 76100, Israel
*
Author to whom correspondence should be addressed.
Plants 2022, 11(18), 2409; https://doi.org/10.3390/plants11182409
Submission received: 10 August 2022 / Revised: 5 September 2022 / Accepted: 14 September 2022 / Published: 15 September 2022
(This article belongs to the Special Issue Control of Flowering Time and Their Environmental Regulation in Crops)

Abstract

:
Plant flowering is antagonistically modulated by similar FLOWERING LOCUS T (FT) and TERMINAL FLOWER 1 (TFL1) proteins. In mango (Mangifera indica L.), flowering is induced by cold temperatures, unless the tree is juvenile or the adult tree had a high fruit load (HFL) in the summer. Here, we studied the effects of juvenility and fruit load on the expression of four MiFT/TFL1 genes cloned from the mango ‘Shelly’ cultivar. Ectopic expression of MiFT1 in Arabidopsis resulted in early flowering, whereas over-expression of MiFT2 and the two cloned MiTFL1 genes repressed flowering. Moreover, juvenility was positively correlated with higher transcript levels of MiFT2 and both MiTFL1s. In trees with a low fruit load, leaf MiFT1 expression increased in winter, whereas HFL delayed its upregulation. MiFT2 expression was upregulated in both leaves and buds under both fruit load conditions. Downregulation of both MITFL1s in buds was associated with a decrease in regional temperatures under both conditions; nevertheless, HFL delayed the decrease in their accumulation. Our results suggest that cold temperature has opposite effects on the expression of MiFT1 and the MiTFL1s, thereby inducing flowering, whereas HFL represses flowering by both suppressing MiFT1 upregulation and delaying MiTFL1s downregulation. The apparent flowering-inhibitory functions of MiFT2 are discussed.

1. Introduction

Mango (Mangifera indica L.), grown in tropical and subtropical climate zones, is an important fruit tree crop [1,2]. Despite the fact that global demand for mango is rapidly increasing [3], its production is frequently limited. In mango, flower induction occurs in early winter; anthesis, fertilization and fruit set in early spring, and further fruit development occurs during the late spring and summer [4,5]. Environmental conditions that interfere with any of these essential processes might reduce fruit yield. In addition, high fruit load (HFL) during the summer can inhibit flower induction in the following winter [4]. The negative effect of HFL on the following year’s flowering is observed in various tree species, causing alternate bearing (AB) or biennial fruit bearing [6,7,8]. In some mango cultivars, it is not clear whether the loss of yield after a high load crop year is due to reduced flowering or to other events occurring after flower induction [1,2,6,7,8].
When grown from seeds, the juvenile phase in mango lasts approximately 3 years, followed by an adult reproductive phase, in which flowering and fruiting take place [1]. Typically, mango inflorescences are born from terminal buds of mature new shoots, and initiation of new shoots is therefore the first event required for flowering [5]. Several studies have shown that under subtropical conditions, most mango cultivars flower only after exposure to cool temperatures, namely, after at least 1 month of day and night temperatures of 13–19 °C; higher temperatures (above 20 °C) inhibit flowering [9,10,11]. Moreover, because the presence of mature leaves on shoots is a mandatory prerequisite for flowering, it has been suggested that under floral-inductive cool temperatures, a floral-promoting signal is generated in the leaves of adult trees, and is transferred to the shoot apical meristem to promote floral transition [5]. Other factors are also implicated in affecting mango flowering. For instance, based on studies showing that exogenous application of gibberellins (GAs) enhances mango vegetative growth and represses flowering [12,13,14], it has been proposed that in mango, similar to other fruit crop tree species, GAs inhibit flowering [7]. In line with this prediction, paclobutrazol—a plant growth regulator that inhibits GA synthesis—can be applied to stimulate mango flowering in warm tropical growing zones, or to induce off-season flowering in subtropical zones [14,15,16].
The transition from vegetative to reproductive phase is an important developmental process in flowering plants. It might occur in response to external factors (such as temperature changes), endogenous signals (such as age, changes in sugar or hormone availability), or both. Studies in Arabidopsis have shown that the transition to flowering is antagonistically modulated by two closely related conserved proteins that display structural similarities to the mammalian phosphatidylethanolamine-binding protein (PEBP): FLOWERING LOCUS T (FT) and TERMINAL FLOWER 1 (TFL1) [17,18,19]. While FT encodes the florigen protein, which is transported via the phloem from the leaves to the shoot meristem, where it triggers the initiation of floral transition, TFL1 acts in the meristem as a local repressor that maintains the indeterminate identity of the shoot meristem [20,21,22,23]. Moreover, in Arabidopsis, the PEBP-like family is comprised of four additional members: TWIN SISTER OF FT (TSF), MOTHER OF FT (MFT), ARABIDOPSIS THALIANA CENTRORADIALIS HOMOLOGUES (ATC), and BROTHER OF FT (BFT). In particular, whereas TSF and MFT function redundantly with FT to promote flowering [24,25], ATC and BFT assume floral-inhibitory roles, similar to TFL1 [26,27]. The modus operandi of FT/TFL1, leading to their antagonistic functions, is complex. Briefly, in the shoot meristem, FT associates with the basic leucine zipper transcription factor FD and 14-3-3 proteins to form a ‘floral-activation complex’. This complex activates the expression of MADS box genes, such as APETALA1 (AP1) and SUPPRESSOR OF OVEREXPRESSION OF CONSTANS1 (SOC1), leading to flowering evocation [22,28]. TFL1, on the other hand, is suggested to act as a floral repressor, competing with FT for binding to FD and 14-3-3 proteins, thus leading to the formation of a ‘floral-repressor complex’ that suppresses the floral transition [29,30,31]. Indeed, in line with this proposed model, a recent study showed that the antagonism between FT and TFL1 relies on their competition for the chromatin-bound FD at different shared target loci [32]. Furthermore, the opposite functions of FT and TFL1 proteins were mapped to two conserved amino acids that have been reported as key to promoting flowering, as well as to a short conserved amino acid sequence (termed B-segment) found in the C-terminal region of FT [33,34]. Other key amino acids, including those necessary for the 14-3-3 interaction and FT movement, were also identified [28,35].
Comparative and functional studies have proven the conservation of FT/TFL1 flowering regulators in diverse plant species (reviewed by [18,19,30,31]). In addition, the existence of multiple copies of FT-like and TFL1-like genes has been reported in different plant species. Interestingly, it has also been reported that during evolution, some FT homologs seem to have evolved to function as flowering repressors [18,30,31]. In sugar beet, two FT-like genes exist, whereas BvFT1 represses flowering, BvFT2 promotes it [17]. Similarly, in Nicotiana tabacum, which possesses five FT-like genes, three of them (NtFT1-3) are suggested to act as floral inhibitors, and the other two (NtFT4 and NtFT5) as floral inducers [36,37]. In both cases, the FT-like genes that assume repressor functions display a semi-conserved B-segment, with distinct non-conserved amino acid substitutions in the segment extending from amino acid positions 128–141 (corresponding to AtFT) [17,37]. Moreover, characterization of FT/TFL1 genes in different species has revealed a wider impact on plant development than originally thought. For instance, besides flowering control, FT-like proteins are suggested to play roles in controlling stomatal opening and seed germination, whereas TFL1-like proteins are suggested to take part in the control of juvenility, and in affecting shoot growth patterns [18,30,31].
Homologs of Arabidopsis FT/TFL1 genes have been identified in various fruit tree species. Moreover, in some cases, functional evidence has been presented of these proteins affecting flowering (reviewed in [7,8]). Indeed, early flowering was shown to be induced by overexpression of FT-like genes in citrus [38], apple [39], olive [40], and kiwifruit [41], whereas an early flowering phenotype could also be achieved by reduced expression of TFL1-like gene transcripts, as shown, for example, in pear [42] and apple [43]. Furthermore, studies of different commercial AB cultivars of citrus [44,45,46], avocado [47], olive [40] and apple [48] fruits showed that the presence of fruit on the tree affected the expression of different flowering-related genes in both leaves and buds.
In mango, several studies have led to the identification of distinct FT/TFL1 family members. Nakagawa et al. [4] were the first to report on the isolation of a FT-like gene from mango cv. Irwin, showing that its expression increased during the winter in leaves of de-fruited trees which flowered intensively in the spring, whereas HFL and GA3 treatment repressed its expression. Further studies using mango cvs. Alphonso and SiJiMi led to the isolation of three FT-like genes (MiFT1–3) [49,50]. Sequence analysis indicated that MiFT1 and MiFT2 from ‘Alphonso’ corresponded to MiFT1 and MiFT2 from ‘SiJiMi’. Moreover, MiFT1 of both cultivars corresponded to the MiFT sequence in ‘Irwin’ [49], whereas the sequences of MiFT3 differed between the two cultivars [49,50]. Interestingly, based on expression analysis results, it was suggested that the MiFTs’ functions might differ between the cultivars [50]. Finally, ectopic expression of the three isolated MiFT genes from ‘SiJiMi’ in Arabidopsis resulted in early flowering, but MiFT1 displayed the strongest effect [50]. Regarding the MiTFL1 genes, Wang et al. [51] recently reported on the isolation of four TFL1-like genes (MiTFL1-1–4) from cv. SiJiMi. Based on findings showing that overexpression of the four ‘SiJiMi’ MiTFL1 genes in Arabidopsis delays flowering time, it was suggested that all MiTFL1s play roles in regulating mango flowering [51]. Further details on their specific modes of action remain to be established. The current release of different mango genome drafts [52,53], opens now new possibilities to explore the mango PEBP-like gene family. As such, the ‘Tommy Atkins’ genome assembly includes approximately  86% of the  439 Mb haploid mango genome [52].
Mango ‘Shelly’ cultivar was developed by the Israeli breeding project and has been planted extensively since the early 2000s in commercial orchards throughout Israel [54]. It was bred as a late-ripening cultivar, with harvest season starting in September to mid-November; nevertheless, growers in the north of Israel tend to harvest it earlier, even in late August. Moreover, despite its increasing popularity, there are controversial reports on its tendency toward AB behavior. Here, we aimed to determine if and how HFL affects ‘Shelly’ flowering, and to elucidate the possible roles of distinct ‘Shelly’ FT/TFL1 genes in modulating its flowering. We first performed de-fruiting treatments to help define the nature of the AB in ‘Shelly’. We next isolated four ‘Shelly’ FT/TFL1 genes and assessed their functions in flowering regulation by ectopic expression in Arabidopsis. We also monitored their expression levels in tissues of juvenile and adult trees, and in leaves and terminal buds of trees under different fruit load conditions. The information provided herein will serve to improve our understanding of the AB behavior of the ‘Shelly’ cultivar, and of the potentially distinct functions of MiFT/TFL1 family members. We compared our findings to previous results in other mango cultivars, and discuss the identified differences. The possible mechanisms by which changes imposed by ambient temperature, together with the memory of HFL on the tree, affect mango flowering are discussed.

2. Results

2.1. Exploring the Effects of Crop Load on Return Flowering in Mango ‘Shelly’ Cultivar

Under our local growing conditions, in northern Israel, the ‘Shelly’ cultivar blooms in the spring, with peak flowering usually occurring in March to April, although inflorescences can already be detected in January. To examine whether and to what degree HFL in ‘Shelly’ represses return to flowering, we selected uniform heavily producing trees and performed manual de-fruiting treatments at different time points (see Section 4.1). Flowering records, collected from January through to March, demonstrated that heavy fruit loaded trees, whose fruits remained on the trees until August (at the time of commercial harvest), displayed the lowest levels of return to flowering. The fruit removal/harvest at this time point resulted in a significantly lower flowering score than for the trees in the other groups, which were de-fruited earlier (see Figure 1A). Fruit removal in the HFL trees at earlier stages had no significant effect on the flowering magnitude. In this case, the flowering scores recorded in March, for trees which had been de-fruited in June and July, were almost the same as those trees which had been de-fruited at the beginning of May (mimicking natural off conditions). Nevertheless, the results also showed that when the de-fruiting treatments were delayed, so was the inflorescence appearance (Figure 1A). Lastly, determination of the following season’s total yields demonstrated a direct correlation between the recorded flowering scores and the following year’s yields (Figure 1B). Taken together, the results indicated that in ‘Shelly’, HFL suppresses, but does not completely abolish the next season’s flowering.

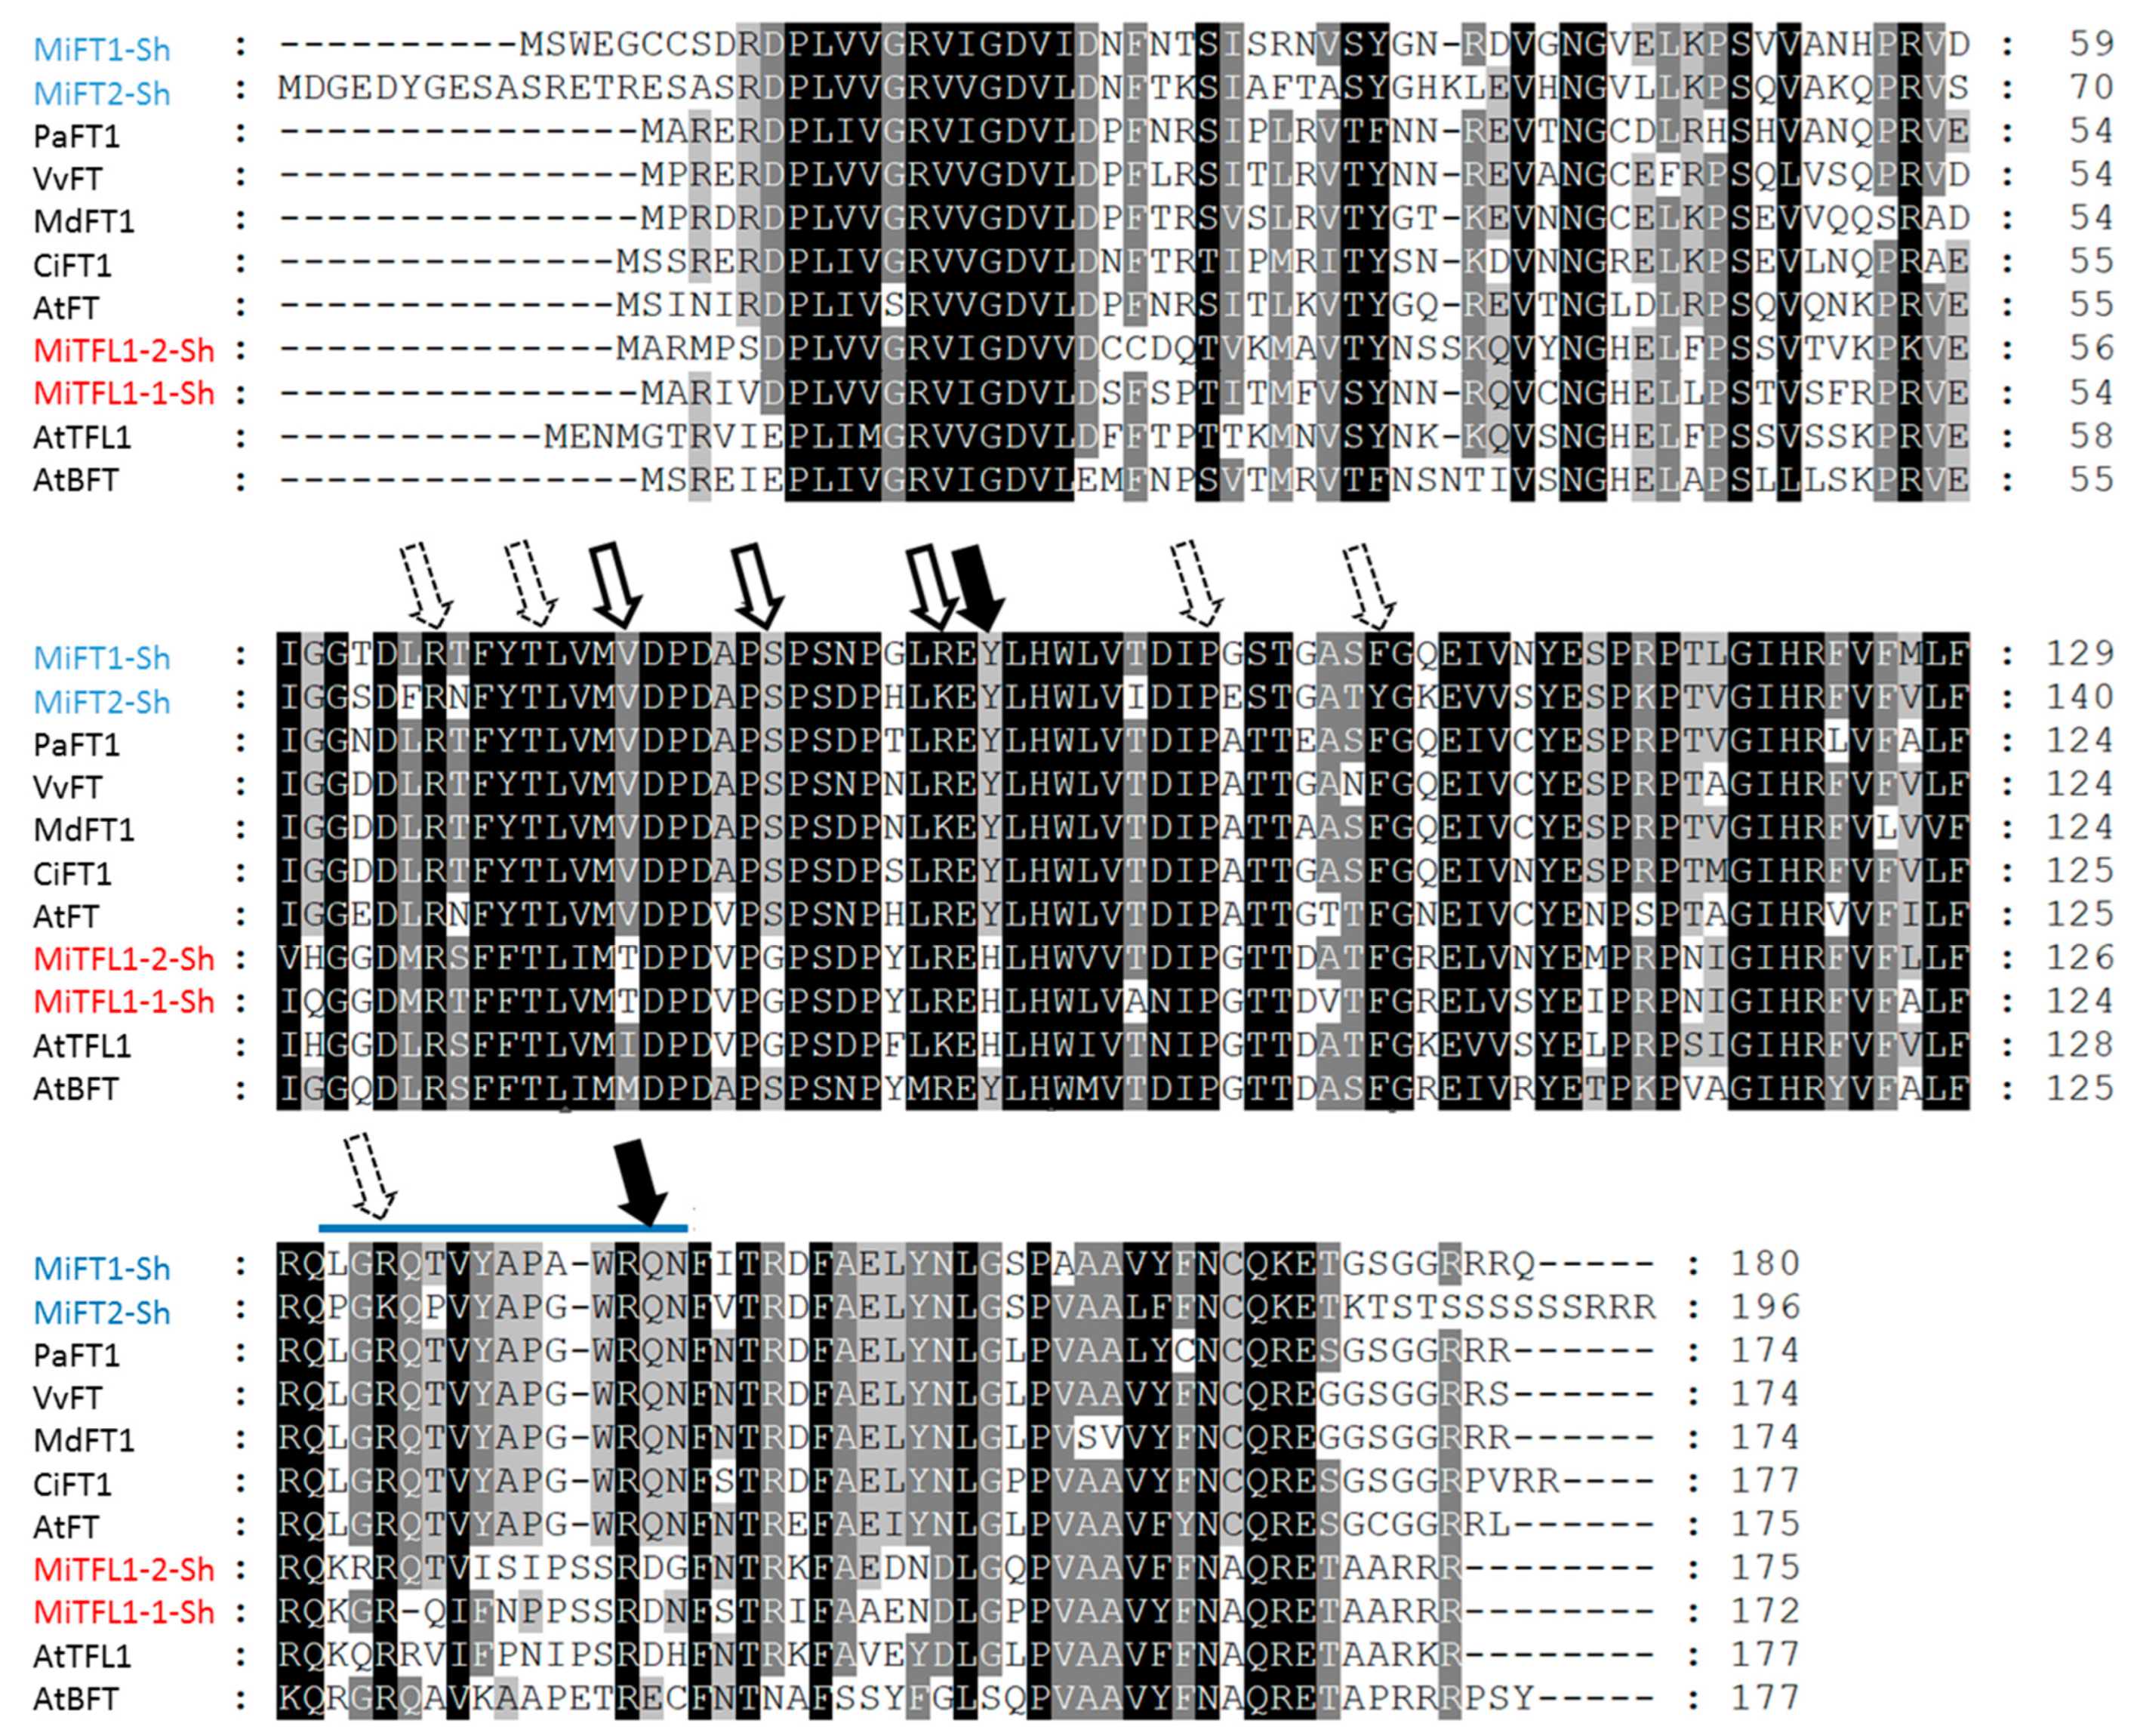
2.2. Identification and Characterization of MiFT/MiTFL1 Transcripts from Mango ‘Shelly’ Cultivar

As mentioned in Section 1, several studies with different mango cultivars have led to the identification of distinct mango FT/TFL1 family members [4,49,50,51]. To obtain cDNAs of MiFTs and MiTFL1s from ‘Shelly’, we used primers designed within the 5′ and 3′ untranslated regions (UTRs) of distinct MiFTs and MiTFL1s from cultivars with annotated sequences (see Section 4.2). The PCR products were cloned, resulting in the isolation of two full-length sequences of FT encoding 181- and 197-amino acid proteins (which we named MiFT1 and MiFT2, respectively), and two full-length sequences of TFL1 encoding 171- and 174-amino acid proteins (MiTFL1-1 and MiTFL1-2, respectively).
Sequence comparison indicated that the predicted translated sequence of MiFT1 from ‘Shelly’ shares 97.2% identity with the translated sequence of MiFT from mango cv. Irwin [4], and also corresponds to two similar genes isolated from cv. Alphonso and the Chinese mango cv. SiJiMi [49,50] (see Figure S1A). The translated sequence of MiFT2 from ‘Shelly’ shared 100% identity with the predicted translated sequence of an EST encoding an FT-like gene which we identified in ‘Tommy Atkins’ and ‘Keitt’ mango transcriptomes (see Section 4.2), and 99.4% identity with the translated MiFT-like sequence of ‘SiJiMi’, which was named MiFT3 [50] (see Figure S1B). As shown in Figure 2, ClustalW-based alignment of the translated versions of the MiFT/TFL1s identified from ‘Shelly’, together with FT/TFL1 proteins from various other plant species, revealed that MiFT1 contains major characteristics associated with FT florigenic activity [27,33,34]. These include two conserved amino acids (Tyr-89 and Gln-144, corresponding to Tyr-85 and Gln-140 in AtFT) that have been reported as key residues for promoting flowering, as well as an almost completely conserved FT amino acid sequence—LGRQTVYAPAWRQN—in its C-terminal region, where a conservative amino acid substitution, Ala-141, corresponds to Gly-137 in AtFT. Notably, MiFT1 is also characterized by the existence of three amino acid residues, Val-74, Ser-80 and Arg-87 (corresponding to Val-70, Ser-76 and Arg-83 in AtFT), which are suggested to have essential roles in regulating FT transport from leaves to the shoot apex [35]. MiFT1 is also characterized by the presence of five additional conserved amino acid residues, Arg-66, The-70, Pro-98, Fhe-105, and Arg-134 (corresponding to Arg-62, The-66, Pro-94, Fhe-101 and Arg-130 in AtFT), which is suggested to be required for the 14-3-3 interaction [28] (see Figure 2). By comparison, ‘Shelly’ MiFT2 also contains the two important conserved amino acids Tyr-89 and Gln-144, but it is characterized by a semi-conserved amino acid sequence in its C-terminal region—PGKQPVYAPGWRQN—in which Pro-143, Lys-145 and Pro-147 are present, instead of the expected conserved Leu-128, Arg-130 and Thr-132 (corresponding to AtFT). Moreover, unlike MiFT1, ‘Shelly’ MiFT2 contains only two conserved amino acid residues, Val-74 and Ser-80, which is suggested to play a role in FT movement. Only three conserved residues, Arg-66, The-70, Pro-98, is suggested to be required for the 14-3-3 interaction (see Figure 2).
With regards to the two MiTFL1 genes isolated from ‘Shelly’, sequence analysis indicated that their translated sequences share 99.4% identity with the translated versions of two TFL1 genes isolated from ‘Alphonso’ (MiTFL1 and MiTFL1) [49], and also correspond to the translated sequences of MiTFL1-1 and MiTFL1-2 from ‘SiJiMi’ [51] (see Figure S1C,D). A detailed examination of their translated sequences revealed that both clones exhibit 68.5–80.2% similarity to TFL1 proteins from other plant species (not shown), and contain the two crucial conserved amino acid residues, His-85 and Asp-140 (corresponding to AtTFL1), which are required for their anti-florigenic function [27,33,34] (see Figure 2).
Lastly, the identity of the four isolated genes was also confirmed by phylogenetic analysis, where MiFT1 and MiFT2 proteins were more closely related to other FT-like proteins, whereas MiTFL1-1 and MiTFL1-2 clustered with other TFL1 proteins (see Figure S2). For the benefit of readers from the mango community, we also used the recently published ‘Tommy Atkins’ mango genomic database [52] to search for the corresponding genomic annotations of our four cloned ‘Shelly’ genes, and for the different MiFT/TFL1 genes previously isolated from distinct mango cultivars [4,49,50,51]. A summary of that search is presented is the supplementary section (see Data S1A–C).

2.3. Functional Analysis of Mango cDNA Encoding FT/TFL1 Proteins in Transgenic Arabidopsis Plants

To further investigate the functions of the isolated ‘Shelly’ MiFT/MiTFL1 genes in flowering regulation, their cDNA (driven by the cauliflower mosaic virus (CaMV) 35S promoter) was individually ectopically expressed in wild-type (WT) Arabidopsis Col-0 plants (see Section 4.3). After transformation with the pART27 35S:MiFT constructs, nine independent PCR-positive 35S::MiFT1 and four independent PCR-positive 35S:MiFT2 kanamycin-resistant plants were obtained. All of the 35S:MiFT1 plants were phenotypically distinguishable from the WT plants and exhibited an early flowering phenotype under inductive long-day (LD) conditions. In contrast, the MiFT2-overexpressing plants displayed different degrees of late flowering phenotype under the same conditions (not shown). We then used the F3 progeny of four 35S:MiFT1 and three 35S:MiFT2 homozygous lines for detailed phenotypic analysis, together with the non-transformed control plants. In all 35S:MiFT1-transgenic lines, MiFT1 promoted a significantly early floral transition under inductive LD conditions. In contrast, under the same conditions, MiFT2 did not induce early flowering (Figure 3). Specifically, the 35S:MiFT1-transgenic lines flowered within 25–26 days of seed sowing after producing 7–10 rosette leaves, whereas WT control plants flowered within 30 days of seed sowing, after producing 12 rosette leaves. 35S:MiFT2 plants flowered within 31–42 days of seed sowing, after producing a significantly higher number of rosette leaves (14–18) than the WT plants. Except for the altered flowering time, no obvious floral phenotypes were observed in either 35S::MiFT1- or 35S::MiFT2-transgenic plants (Figure 3B).
A similar approach was used to investigate the roles of MiTFL1-1 and MiTFL1-2. In this case, four independent PCR-positive 35S:MiTFL1-1 and seven independent PCR-positive 35S:MiTFL1-2 kanamycin-resistant plants were obtained, all displaying different degrees of late flowering phenotype under LD conditions. Notably, some of the 35S:MiTFL1-1- and 35S:MiTFL1-2-transformed plants also exhibited a branched phenotype and/or shoot-like inflorescences (Figure 4B,D). The F3 progeny of four 35S:MiFTFL1-1 and three 35S:MiTFL1-2 homozygous lines were further used for detailed phenotypic analysis, together with non-transformed control plants. All of the examined 35S:MiTFL1-1- and 35S:MiTFL1-2-transgenic lines showed a significant delay in flowering transition under LD conditions, reflected in more days required for flowering, along with an increased number of rosette leaves upon flowering compared to the WT control plants (Figure 4E). The degree to which flowering was delayed was more or less similar to that in the MiFT2-overexpressing plants.

2.4. Tissue-Specific Expression Patterns of MiFT/TFL1 Genes

To gain further insight into the potential roles played by the isolated MiFT/TFL1 genes, we examined their specific expression patterns by studying different RNA samples using real-time quantitative PCR (qPCR) with gene-specific primers (see Table S1). We first assessed MiFT/TFL1- expression levels in leaf or bud tissues collected in mid-December from trees at different stages of the juvenile-to-adult transition (0.5- or 3-year-old seedlings, and 5-year-old grafted ‘Shelly’ trees). In addition, we measured the expression levels of MiFT/TFL1 in fruitlet tissues (pericarp and seeds) collected in May from adult trees. As expected, the juvenile (0.5- and 3-year-old) seedlings did not flower, whereas the 5-year-old ‘Shelly’ trees exhibited high flowering rates in the spring (not shown). In line with Nakagawa’s previous observations [4], MiFT1 was predominantly expressed in the leaves of adult trees. No significant expression of this gene was detected in juvenile leaves, buds of any age or fruitlets (Figure 5A). This pattern fits the suggested role of MiFT1 as a flowering inducer, produced in leaves of adult trees during the winter.
MiFT2 was expressed in all examined tissues, but its highest accumulation was in the leaves of the 0.5-year-old seedlings and in the seeds of young fruitlets. As the juvenile seedlings matured, MiFT2 expression decreased in the leaves and increased in the buds (Figure 5B).
Finally, MiTFL1-1 and MiTFL1-2 displayed similar expression patterns. Both transcripts were highly expressed in leaves of 0.5-year-old juvenile seedlings. Both TFL1-encoding genes were also expressed in the buds and leaves of the 3-year-old semi-juvenile trees. By comparison, at the selected sampling point, their expression in the buds and leaves of the adult trees was very low. In addition, both transcripts exhibited very low accumulation levels in fruitlet tissues (Figure 5C,D).
Taken together, while our results confirm previous studies linking MiFT1 with mango floral induction [4,49,50], they also hint at a possible non-canonical modified function for MiFT2 that is not related to flower induction. Furthermore, the data on MiTFL1-1 and MiTFL1-2 suggest that both genes assume similar redundant roles, repressing transition to flowering, thus corroborating Wang et al.’s data [51].

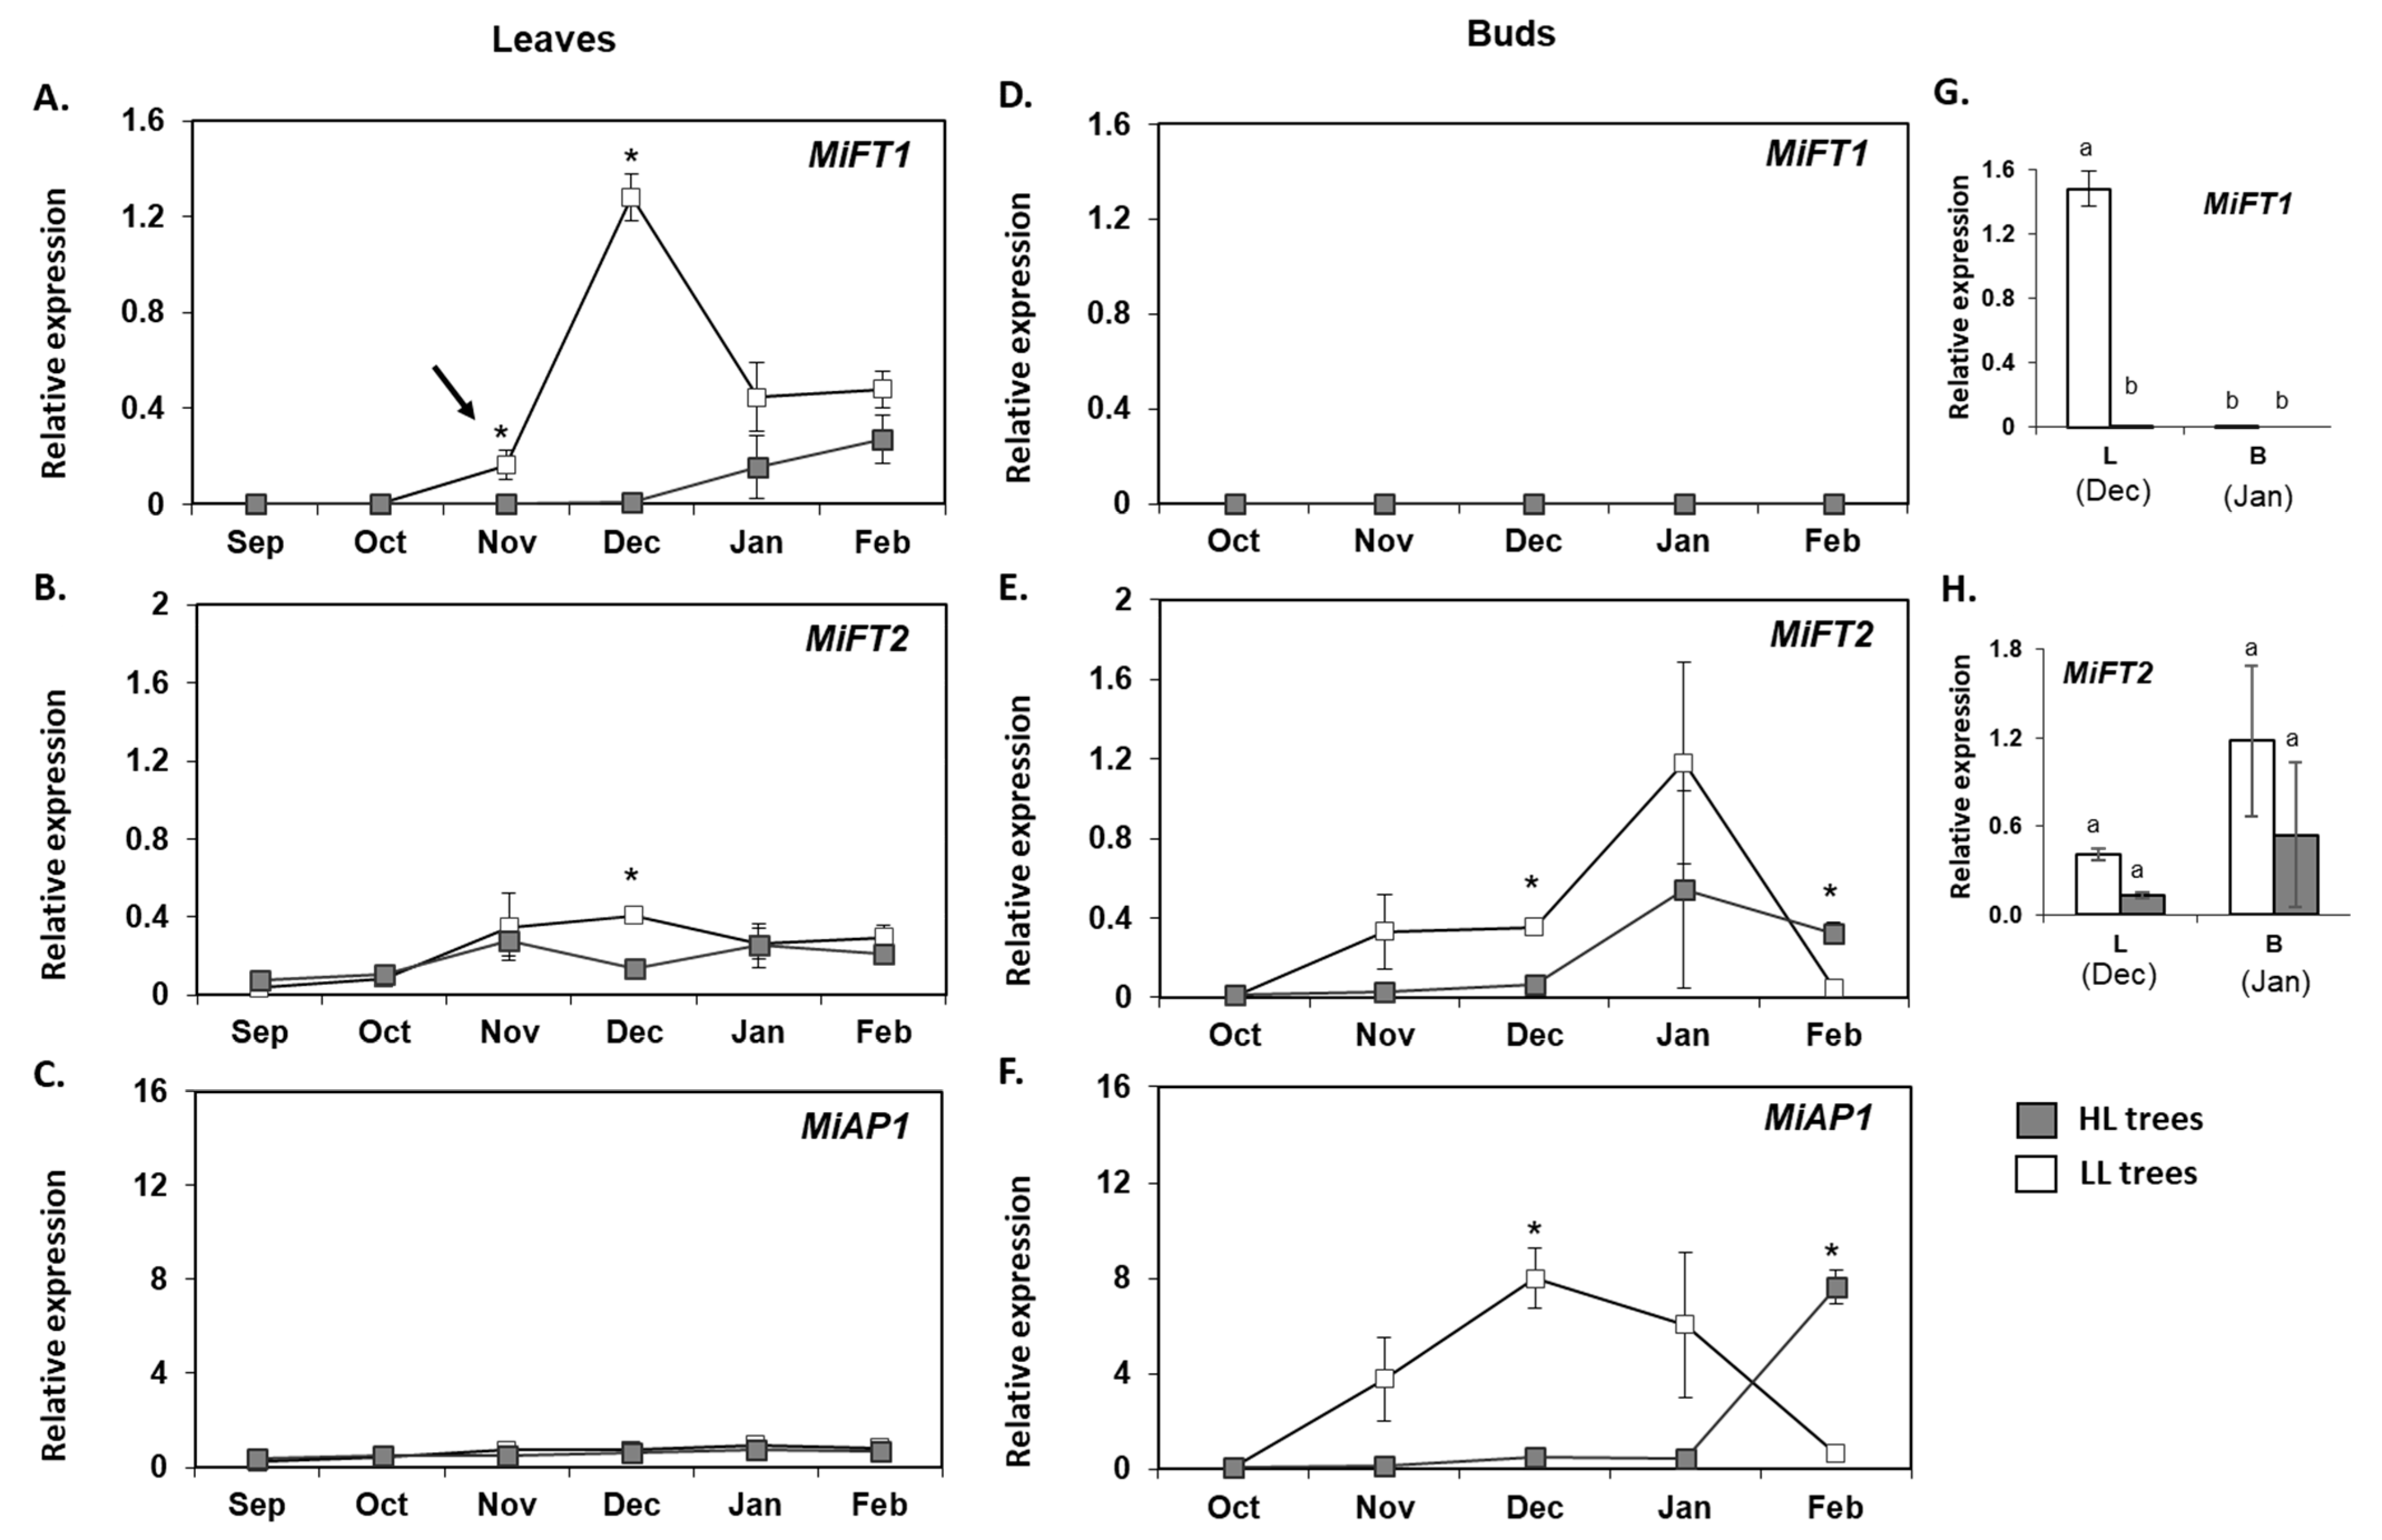
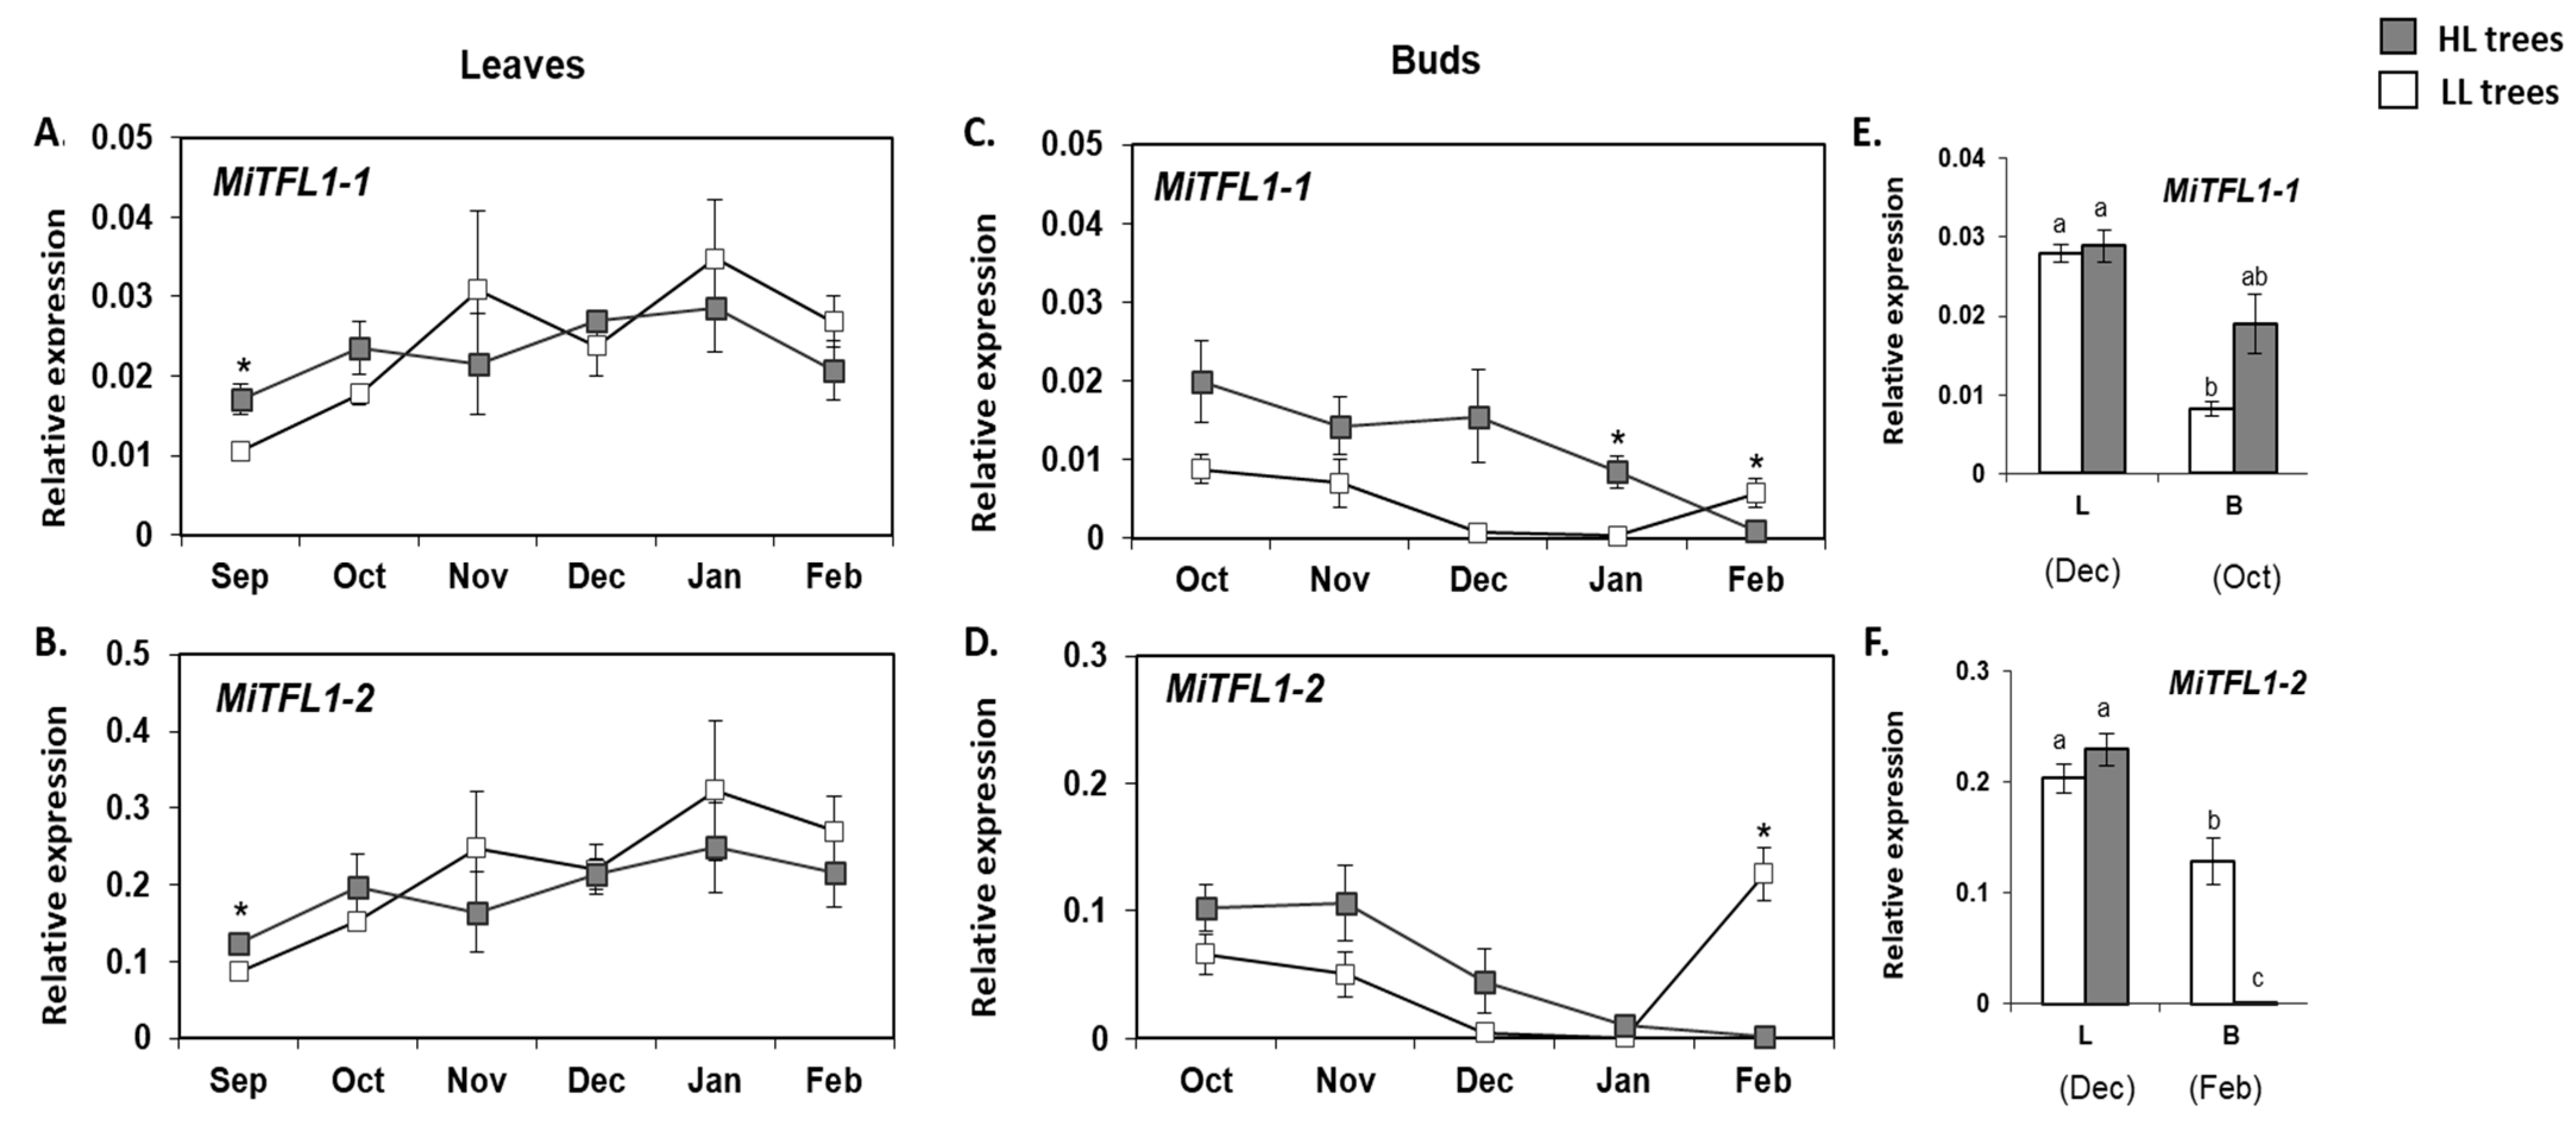
2.5. Monitoring the Expression of MiFT/TFL1 Genes under Different Fruit Load Conditions

In the spring of 2017, we identified six uniform ‘Shelly’ trees in a commercial orchard with a potentially light load (LL) of fruit, and six uniform trees with a potentially heavy load (HL) of fruit. The fruit were harvested from each tree in August 2017. As shown in Figure 6B, the average yield of the LL trees was 22.3 kg/tree, whereas the average yield of the HL trees was significantly higher (63 kg/tree). From September 2017 to February 2018, we sampled leaves and terminal buds at different times for RNA extraction. The flowering surveys, which were carried out from January through March, revealed that inflorescences appeared earlier in the LL trees than in the HL trees (Figure 6A); the LL trees displayed new developing inflorescences from January to March, while in the HL trees, the vast majority of new emerging inflorescences were mainly detected 2 months later (see Figure 6C,D). Accordingly, the flowering records indicated that in March, the LL trees displayed significantly higher scores than the HL trees (Figure 6A—black columns). Finally, the following year’s yield data (recorded in August 2018) matched the level of the previous spring flowering intensity scores (see Figure 6B—gray columns).
Next, we carried out real-time qPCR analyses to monitor MiFT/TFL1 expression patterns in leaves and terminal buds that were sampled from September 2017 to February 2018 from previously LL or HL trees. LL leaves revealed a sharp increase in MiFT1 expression from November through December, followed by a decrease in transcript accumulation in January and February. In the leaves of HL trees, MiFT1 followed a different pattern. In this case, MiFT1 expression was very low until December, and then it marginally increased (Figure 7A). Furthermore, in a parallel examination of MiFT1 accumulation in the buds, it was nearly undetectable throughout the sampling period under both conditions (Figure 7D). Lastly, a comparison of MiFT1 transcript accumulation in leaves and buds of HL vs. LL trees, at the time points at which expression was maximal, revealed a significantly higher accumulation in the leaves of the LL trees (Figure 7G).
MiFT2 expression in leaves increased slightly till November under both fruit load conditions. In December, MiFT2 expression became significantly higher in the samples of LL trees compared to HL trees (Figure 7B). Expression of MiFT2 in buds sampled in December was also significantly higher in LL vs. HL trees. In buds, the highest expression for both fruit loads was reached in January. In February, expression in HL buds was significantly higher than in LL buds (Figure 7E). Moreover, a comparison of MiFT2 expression levels in leaves and buds revealed that unlike MiFT1, MiFT2 accumulation at the time points at which its expression was maximal did not differ significantly between the two tissues, or between trees under different fruit load states (Figure 7H).
Finally, we followed the expression of the downstream MiAP1 gene, which is expected to accumulate in meristems that are going through floral transition, forming inflorescences [4]. In the leaves, throughout the entire sampling period, MiAP1 transcript remained stable and low under both fruit load conditions (Figure 7C). In contrast, bud analyses revealed that coinciding with the transient strong upregulation of MiFT1 observed in the leaves of LL trees from November through December, a strong increment in MiAP1 transcript was found at those same sampling points in the buds from those trees, followed by a sharp decrease to its initial levels (Figure 7F). On the other hand, concurring with the delayed elevation of MiFT1 in the leaves under HL conditions, in the buds of those trees, MiAP1 remained very low until January and only then increased in level.
MiTFL1-1 and MiTFL1-2 expression in leaves from trees under both fruit load conditions displayed a similar moderate upregulation from September to February (Figure 8A,B). Both transcripts only accumulated to slightly higher levels in the HL leaves in September. The bud analyses revealed different results. As shown in Figure 8C,D, starting from October, and coinciding with a decrease in the regional maximum and minimum temperatures (see Figure S3), both MiTFL1-1 and MiTFL1-2 exhibited a downregulation pattern, reaching close to null levels in HL trees in February. In LL trees, there was an increase in MiTFL1-1 and MiTFL1-2 levels from January to February. Moreover, the rate of decrease in MiTFL1s levels was higher in the LL vs. HL trees and therefore in January, MiTFL1-1 expression remained significantly higher in the HL trees. Finally, a comparison between MiTFL1-1 and MiTFL1-2 expression in leaves and buds on the sampling dates with maximal expression showed that overall, both transcripts accumulated to higher levels in the leaves than in the buds (see Figure 8E,F).

3. Discussion

The most common version of AB is usually manifested as a repression of flower induction after a heavy-load fruit year, leading to a reduction in the next season’s yield. On the other hand, there are cases in which AB occurs despite a suitable return to flowering. Such is the case, for example, in pistachio (Pistacia vera L.), where the alternation between years of high and low fruit load is a consequence of abscission of inflorescence buds on high-yielding trees during the summer [55]. In the case studied here, the results of the de-fruiting experiment confirmed the classical nature of the AB trait in the ‘Shelly’ mango. The results also demonstrated that from May onwards, HFL in ‘Shelly’ attenuated the rate of inflorescence development, but it was only from July onwards that this factor repressed, to some extent, the rate of return to flowering. Previous studies performed in fruit tree species such as citrus [44], olive [56] and avocado [47] have pointed to the existence of a critical physiological window of time, after which fruit load (or the memory of fruit being present on the tree) effectively represses flowering. A noteworthy point is that whereas in avocado and citrus, flowering induction occurs in parallel to the presence of developing fruit on the tree [44,47] In mango, like in olive, flower induction takes place after the fruit is harvested from the tree [4,48]. Consideration of the time interval observed here between presence of the fruit on the trees (during the spring and summer), and the period when flowering induction is expected to occur (in the winter), together with the observed delay in inflorescence appearance with later de-fruiting treatments, suggests that in ‘Shelly’, the “memory” of HFL on the tree is preserved after fruit removal. This both delays and partially suppresses flowering.
HFL or the “memory” of HFL has been shown to affect FT/TFL1-like gene expression in leaves, buds or both in different fruit trees [4,40,44,46,47,48]. Here, we cloned two FT-like and two TFL1-like genes from mango ‘Shelly’ cultivar. Cloning of the ‘Shelly’ MiFT/TFL1 genes allowed us to further investigate their expression patterns at various stages of the tree’s life cycle, as well as their spatial and temporal expression profiles, i.e., prior to and during inflorescence development, in both leaves and terminal buds of trees under different fruit load conditions. We also studied the effect of overexpressing each of the cloned genes in Arabidopsis.
One of the FT-encoding genes in ‘Shelly’—MiFT1—is annotated in the ‘Tommy Atkins’ mango genomic database [52] as Manin02g003570.1, located on chromosome 2 and corresponding to the previously described MiFT from ‘Irwin’ [4], MiFT1 from ‘Alphonso’ [49], and MiFT1 from ‘SiJiMi’ [50] (Data S1A,B). The encoded protein appears to contain all known characteristics associated with FT flowering-induction activity [27,33,34]. MiFT1 was mainly expressed in leaves of adult ‘Shelly’ trees, and its ectopic expression in Arabidopsis resulted in early flowering. Our expression and transgenic results thus corroborate earlier reports suggesting that MiFT1 acts as the major factor controlling flower induction [4,49,50]. Furthermore, similar to Nakagawa et al. [4], our analysis showed that starting in November, accumulation of MiFT1 in LL trees transiently increased in the leaves, and was accompanied by a parallel upregulation of the floral marker gene MiAP1 in the buds. On the other hand, concomitant with a reduction in flowering levels, MiFT1 upregulation was delayed and reduced in the leaves of HFL ‘Shelly’ trees, resulting in parallel delayed and reduced upregulation of MiAP1 in the buds.
The second FT-encoding gene cloned from ‘Shelly’, which we termed MiFT2, is annotated in the mango genome database as Manin03g001830.1, located on chromosome 3; it corresponds to the previously described MiFT3 from ‘SiJiMi’ [50] (Data S1A,B). FT paralogs that sometimes exhibit different expression patterns or functions are well documented. For instance, in apple, two FT paralogs appear to share redundant floral-promoting roles; whereas MdFT1 is expressed in the apical meristem during the floral transition, MdFT2 peaks at a later stage in the reproductive organs [57]. On the other hand, in Satsuma mandarin, whereas CiFT3 is expressed mainly in the stems and leaves and is suggested to act as the major factor controlling flowering, two other FT homologs (CiFT1 and CiFT2), which are highly expressed in young fruitlet tissues, are not considered to be involved in flowering induction [58]. Our results, based on sequence analysis, expression patterns and phenotype resulting from overexpression in Arabidopsis suggest that MiFT2 acts as a flowering repressor. We note that this conclusion is not in full agreement with the results presented for MiFT3 from ‘SiJiMi’ (encoding the corresponding protein), where evidence suggests that it encodes a flowering inducer, albeit a weaker one than MiFT1 [51]. However, our data are most consistent with the notion that in ‘Shelly’, MiFT2′s role is not related to flower induction. In particular, its putative protein comprises a semi-conserved B segment, characterizing different FT homologs that have acquired flowering-repression functions during evolution [18]. Furthermore, whereas MiFT1 was mainly expressed in the leaves of adult trees, MiFT2 was very strongly expressed in the leaves of young seedlings in their juvenile phase, as well as in fruitlet tissues and adult tree buds. MiFT2 was also similarly expressed in the leaves and buds of trees under different levels of fruit load. Lastly, ectopic expression of MiFT2 delayed flowering in Arabidopsis.
With respect to the TFL1-encoding genes, the ‘Shelly’ TFL1 gene MiTFL1-1 is annotated in the mango genome database as Manin19g005780.1, located on chromosome 19, and corresponds to the previously described MiTFL1α from ‘Alphonso’ [49] and MdTFL1-1 from ‘SiJiMi’ [51]. The ‘Shelly’ TFL1-encoding gene termed here as MiTFL1-2 corresponds to the previously described MiTFL1 from ‘Alphonso’ [49] and MdTFL1-2 from ‘SiJiMi’ [51]. This gene is not annotated in the ‘Tommy Atkins’ mango genomic database [52], however, we were able to locate its sequence on chromosome 3 (see Data S1A,C). The putative proteins encoded by both genes display the crucial conserved amino acid residues required for TFL1 activity [49,51]. Moreover, coinciding Wang et al. [51] who showed that overexpression of MiTFL1s from ‘SiJiMi’ delayed flowering in Arabidopsis, here we also confirmed that both MiTFL1 genes from ‘Shelly’ inhibit flowering when ectopically expressed in Arabidopsis. In addition, we noticed that in some overexpressing lines, MiTFL1-1 and MiTFL1-2 induced a highly branched phenotype, affecting plant architecture. This branching phenotype was not reported upon overexpression of MiTFL1s from ‘SiJiMi’ in Arabidopsis, but is well described in the literature [21,31].
As already noted, TFL1 genes act to repress floral transition in different types of meristems, regulating both plant juvenility and flowering time [30,31]. For instance, in citrus, increased levels of CsTFL1 were shown to be well-correlated with juvenility, because its transcript accumulated to higher levels in juvenile stem tissues than in adult tissues [59]. PoTFL1-like genes were also recently shown to be highly expressed during the juvenile phase in passion fruit (Passiflora spp.) [60]. Similarly, our expression analysis revealed that both MiTFL1 transcripts were preferentially expressed in leaves and apical meristems of ‘Shelly’ seedlings, linking them with the control of mango juvenility.
Moreover, current studies in fruit trees, including Japanese apricot and loquat, have demonstrated that TFL1 genes can be detected not only in juvenile tissues, but also in leaf buds or in tree leaves at their mature stage [61,62]. In line with these reports, it was recently shown that four MiTFL1 genes, showing similar expression patterns, are expressed in both vegetative and reproductive tissues of adult ‘SiJiMi’ mango trees [51]. Here, our expression analysis showed fluctuations in the expression patterns of the two cloned MiTFL1 genes in the leaves and buds of adult trees. From September to January, accumulation of MiTFL1-1 and MiTFL1-2 transcripts increased similarly in leaves under both fruit load conditions. On the other hand, a downregulation pattern of the two MiTFL1 transcripts, which was associated with a decrease in regional temperatures, was observed in the buds of trees under both conditions. Despite these similarities, MiTFL1s downregulation was delayed, to some extent, under HFL conditions, suggesting that de novo MiTFL1s expression in the buds affects flowering transition.
Taken together, our results reinforce the notion that in mango, similar to other evergreen fruit tree species, a putative low temperature-based signal results in the upregulation of FT-like genes, which have floral-promoting functions [4,40,44,47]. In addition, they imply that this putative low temperature signal might also induce downregulation of MiTFL1 genes. The requirement of a prolonged cold period to flower is perhaps best documented in Arabidopsis, where cold temperature (vernalization) triggers flowering through epigenetic silencing of the floral repressor gene FLOWERING LOCUS C (FLC) [63]. Interestingly, recent studies in citrus have identified a gene encoding a protein similar to FLC (CcMADS19), with increased expression under HFL, together with epigenetic changes [64]. Those authors suggested that the increase in this gene’s expression is regulated by epigenetic changes similar to FLC. They also suggested that CcMADS19 accumulation under HFL might repress flowering by inhibiting the increase in FT-encoding gene expression during the winter [64]. Whether a similar mechanism operates in mango remains to be established. Furthermore, experimental data have been reported from other species indicating that downregulation of TFL1 genes associated with a decrease in ambient temperature, reduced fruit load, or both correlates with flowering. For example, studies in woodland strawberry (Fragaria vesca) have shown that a reduction in ambient temperature (<13 °C) is required for downregulation of FvTFL1 in the shoot apex, so that flowering can occur independently of photoperiod [65]. Similarly, in an accession of F. vesca endemic to northern Norway, very low temperatures were shown to be required to downregulate FvTFL1 prior to flowering [66]. Moreover, studies in citrus and olive have demonstrated that HFL prevents downregulation of TFL1-encoding genes in the buds [40,45]. At the same time, different flowering responses to various fruit loads, correlating with distinct degrees of TFL1-encoding gene accumulation, were detected in different apple cultivars [48]. Bearing these observations in mind, our results suggest that MiTFL1 downregulation is induced by low temperature, but that HFL delays this response. Side by side, in view of the opposite MiTFL1 and MiAP1 expression patterns observed in the buds (Figure 8C,D vs. Figure 7F), and knowing that in Arabidopsis, AP1 suppresses TFL1 expression in emerging floral meristems [67], an alternative or additional scenario might involve the possibility that MiAP1 accumulation in mango buds impacts their MiTFL1 expression.
Lastly, as already noted, studies have suggested that the regulation of GA metabolism by fruit load affects mango flowering induction [4]. Additional mango studies have shown that paclobutrazol treatments, which decrease GA content, also lead to an increase in sugar and abscisic acid (ABA) levels in leaves and buds [14,68,69]. Interestingly, accumulation of ABA in the leaves has been recently suggested to impact flowering in mandarin trees by affecting FT-encoding gene expression [70], whereas studies in apple have shown that GA treatment, which affects flowering, results in upregulation of TFL1-encoding genes in the buds [48]. The possibility that fruit load confers changes in the GA:ABA ratio, or in carbohydrate levels, directly or indirectly impacting FT/TFL1 gene expression in ‘Shelly’, thus warrants further exploration.

4. Materials and Methods

4.1. Plant Material and De-Fruiting Treatments

Fifteen-year-old ‘Shelly’ mango trees, grafted on ‘13-1’ rootstocks and grown in a commercial orchard at Almagor in the northern district area of Israel (32°50′ N 35°36′ E), were used for the experiment. The fruit load intensity of trees in the orchard was determined at the beginning of May 2017. Sixteen uniform heavily producing trees were randomly assigned to different de-fruiting treatments in groups of four trees (replicates) per treatment (different dates of fruit removal). Complete de-fruiting treatments were performed manually at the beginning of May, June and July 2017. In the fourth treatment, fruit were collected during the commercial harvest season (August 2017). The intensity of flowering was evaluated upon the appearance of the first inflorescences, starting at the end of January 2019 to March 2019, using a blind test in which two surveyors independently scored each tree from 0 (no flowering) to 4 (very high flowering intensity). Lastly, the total yield of fruit that developed from the inflorescences of March 2017 was determined in all treated trees in August 2018, by weighing all of the fruit harvested from individual trees.

4.2. Cloning of MiFT/MiTFLs from Mango ‘Shelly’ Cultivar

A previously published annotated sequence of MiFT from mango cv. Irwin (AB671587.1), and two annotated sequences of MiTFL1s from mango cv. Alphonso (KF258590 and KU206290), were utilized in this study. We also made use of an additional sequence annotation, putatively encoding for an FT-like gene (mango_rep_c5502), which was identified in a search conducted against ‘Tommy Atkins’ and ‘Keitt’ mango transcriptomes [71]. The four corresponding ‘Shelly’ cDNAs were isolated by real-time qPCR using pairs of end-to-end primers, designed within the 5′ and 3′ UTRs of each sequence annotation (see Table S1), and cDNA synthesized from ‘Shelly’ tissues as the template (a mixture of samples collected from leaves and buds at different time points). The obtained PCR products were ligated into the CloneJET vector (Fermentas, Vilnius, Lithuania), sequenced (Hy-labs Laboratories, Rehovot, Israel), and further used as templates to generate constructs for Arabidopsis transformation purposes.

4.3. Arabidopsis Transformation and Phenotypic Analysis

For constitutive expression of the MiFT/TFL1 genes in Arabidopsis, the plasmid pART7-based pART27 vector was used. The protein-encoding regions of the MiFT/TFL1 genes were first amplified using MiIFT1/MiIFT2-EcoRI and MiIFT1/MiIFT2-XbaI, or MiITFL1-1/MiITFL1-2-EcoRI and MiITFL1-1/MiITFL1-2-BamHI primers, respectively (Table S1). The purified PCR fragments were next digested with EcoRI and XbaI, or with EcoRI and BamHI, respectively, and cloned into the corresponding sites of the pART7 vector, between the 35SCaMV promoter and the ocs 3′ transcription terminator. The expression cassettes were then NotI-excised from the pART7 constructs and inserted into the binary plant transformation vector pART27. The resulting plasmids were further used for stable transformation of WT (Col-0) Arabidopsis plants using the Agrobacterium tumefaciens-mediated floral dip method [72]. The transformed seeds were selected on medium containing half-strength Murashige and Skoog salts and kanamycin (50 μg/mL). After transforming with pART27, the third generation of three or four randomly selected transgenic lines for each gene was used for phenotypic assessment of flowering times, along with WT plants which served as controls. Plants were placed in a growth room under a LD regime (25 °C, 16/8 light/dark). Flowering times were measured by counting the number of rosette leaves and the number of days from sowing to bolting.

4.4. Plant Material and Tissue Collection from Juvenile and Adult Trees

To compare the expression patterns of MiFT/TFL1 genes in adult vs. juvenile tissues, we used three 5-year-old ‘Shelly’ mango trees (adult ‘Shelly’ trees grafted on ‘13-1′ rootstocks), and fifteen 0.5-year-old and nine 3-year-old potted ‘Shelly’ seedlings (juvenile trees, germinated from seeds). The trees were grown in an experimental orchard and in a net-house (adult and juvenile trees, respectively) at the Volcani campus, Bet Dagan, Israel (32°6N 34°49E). During the floral induction period, in December 2019, tissue sampling (leaves and terminal buds from adult trees, and leaves and apical meristems from juvenile trees) was carried out early in the morning. Samples of the adult trees (three biological replicates) were immediately frozen in liquid nitrogen, brought to the laboratory and kept at −80 °C until further analysis. For juvenile trees, tissue samples were first pooled to form three biological replicates (each comprising leaves or apical meristems, collected from five 0.5-year-old or 3-year-old seedlings, respectively). Lastly, during May 2020, fruitlet tissues (pericarp and seeds), were collected from the adult trees, frozen in liquid nitrogen and stored at −80 °C.

4.5. Tissue Collection from Fruit Trees with Heavy and Low Fruit Loads

Fifteen-years-old ‘Shelly’ mango trees, which were grafted on ‘13-1’ rootstocks and grown in a commercial orchard at Almagor, were used to investigate the effect of fruit load on the expression patterns of MiFT/TFL1 genes and on flowering. Six uniform HL trees and six uniform LL trees were selected at the beginning of May 2017 for tissue sampling. The total yield of the selected trees was first determined in the commercial harvest season, in August 2017, by weighing all of the fruit harvested from individual selected trees. Following harvest, as part of the agronomical practice carried out in the commercial orchard, all trees were pruned and new emerging shoots were tagged on each tree in September 2017. For sampling purposes, the HL and LL trees were divided into three pairs of trees (three biological replicates). HL and LL tree tissue sampling was carried out at various intervals (from September 2017 to February 2018) using the tagged shoots. Collected leaves and terminal buds of the sampled shoots were dissected in the orchard, pooled to form three biological replicates (for each tissue and tree status), frozen in liquid nitrogen, transported to the laboratory and stored at −80 °C for further analysis. To maintain a uniform sampling pattern, dissection of three to four leaves was performed from the fourth leaf relative to a reference point, set as the base of a newly born shoot. The intensity of the flowering in the selected trees was then evaluated at various time intervals, starting from the end of January 2018 until March 2018, as described in Section 4.1. The total yield of individual trees carrying fruit that developed from the flowers of March 2018 was determined in August 2018.

4.6. RNA Isolation and cDNA Synthesis

Total RNA from leaves and terminal buds was extracted using a Plant/Fungi Total RNA Isolation Kit (NorgenBiotekcrop, Thorold, ON, Canada) following the manufacturer’s instructions. RNA was quantified using a NanoDrop ND-100 spectrophotometer (NanoDrop Technologies, Rockland, ON, Canada). Total RNA (4 μg) pretreated with 1 unit of RQ1 DNase served as the template in the synthesis of first-strand cDNA, using an anchored oligo-dT primer and Verso cDNA Synthesis Kit (Thermo Scientific, Waltham, MA, USA) according to the manufacturer’s instructions. The reaction products were used for further analyses.

4.7. Real-Time qPCR Analysis

The accumulation of MiFT1, MiFT2, MiTFL1-1, MiTFL1-2 and MiAP1 genes in the sampled tissues was evaluated by real-time qPCR using Fast SYBR Green Master Mix (Applied Biosystems, Foster City, CA, USA). Reactions were carried out using 3 μL of the cDNA products (1:10 dilution), 6 μL of SYBR Green PCR Master mix, and 200 nM primers from the relevant specific primer pair (see Table S1), in a final volume of 12 μL. Analysis was performed with a StepOnePlus Real-Time PCR system (Applied Biosystems). A dilution series of CloneJET plasmids, containing the full length of the relevant amplified fragment, was created and standard curves for each gene were established using the pairs of specific primers. The cDNA samples were analyzed in triplicate, with each reaction being subjected to melting-point analysis to confirm the presence of single amplified products. Transcript levels in each sample were estimated using a standard curve for each gene and normalized against the level MiEF transcript. The R2 values and PCR efficiency obtained for the standard curves of the examined genes are presented in Table S2. Relative expression levels were calculated by dividing each individual gene copy number by the MiEF copy number.

4.8. Statistical Analysis

Data from different sets of experiments were analyzed using JMP software (JMP Pro14, SAS Institute, Cary, NC, USA). Statistical analyses of the phenotypic data of the 35S:MiFT/TFL1 lines and Arabidopsis WT plants, mango flowering records, and real-time qPCR data of MiFT/TFL1 genes in various mango tissues, were performed using one-way analysis of variance (ANOVA) by the Tukey–Kramer multiple comparison test, with p ≤ 0.05. Additional analyses were performed by the least significant difference (LSD) test, according to pairwise comparison by Student’s t-test, with p ≤ 0.05.

5. Conclusions

Based on our results, we propose that in the mango ‘Shelly’ cultivar, a decrease in ambient temperature induces both an increase in MiFT1 levels in the leaves, and a decrease in MiTFL1 accumulation in the buds. On the other hand, HFL also affects MiFT/MiTFL1 gene expression by suppressing MiFT1 upregulation and delaying MiTFL1 downregulation. As a result, flowering is repressed, but not abolished. MiFT2 might operate together with the MiTFL1s to regulate juvenility, whereas in the adult phase, MiFT2 activity might not be related to flowering induction. Further elucidation of the mechanisms by which changes in ambient temperature, together with fruit load, affect the regulation of flowering could encourage the development of trustable agricultural practices that will reduce AB while enhancing ‘Shelly’ cultivar profitability. In particular, with the expected warmer winters, growers will benefit from an improved understanding of these mechanisms.

Supplementary Materials

The following supporting information can be downloaded at: https://www.mdpi.com/article/10.3390/plants11182409/s1, Figure S1: Structural features of ‘Shelly’ MiFT1, MiFT2, MiTFL1-1 and MiTFL1-2 and amino acid sequence comparison with the corresponding FT/TFL1-like proteins from distinct mango cultivars. Figure S2: Phylogeny of MiFT/TFL1s and FT, TSF, MFT, TFL and BFT proteins from various plant species. Figure S3: Minimal and maximal temperatures recorded from September to February at Kfar Nahum near Almagor, where the experimental ‘Shelly’ trees were grown. Data S1: ‘Shelly’ MiFT/TFL1cDNA sequences, genomic annotations and their corresponding genes from different mango cultivars. Table S1: Primers used for MiFT/MiTFL1 gene isolation, real-time qPCR analysis and plasmid preparation. Table S2: R2 values and PCR efficiency obtained for the standard curves of the examined genes.

Author Contributions

Conceptualization, I.G., A.S. and V.I.; Investigation, I.G., A.C.R., E.H., T.Z. and I.S.; Writing—Original Draft Preparation, A.S. and V.I. All authors have read and agreed to the published version of the manuscript.

Funding

This work was supported by grant number 20-01-0081 from the Chief Scientist of the Israeli Ministry of Agriculture to V.I. and A.C.R. was supported in part by an Agricultural Research Organization Postdoctoral Fellowship for Indian and Chinese candidates.

Data Availability Statement

Not applicable.

Acknowledgments

We thank Daniel Bani for providing access to the commercial ‘Shelly’ mango orchard at Almagor for the experiments and tissue sampling. We thank Yuval Cohen for providing access to ‘Shelly’ juvenile and adult mango trees grown at the Volcani Center for tissue sampling.

Conflicts of Interest

The authors declare no conflict of interest.

References

  1. Mukherjee, S.K.; Litz, R.E. Introduction: Botany and importance. In The Mango: Botany, Production and Uses, 2nd ed.; Litz, R.E., Ed.; CAB International: Wallingford, UK, 2009; pp. 1–18. [Google Scholar]
  2. Saúco, V.G. Trends in world mango production and marketing. Acta Hortic. 2017, 1183, 351–363. [Google Scholar] [CrossRef]
  3. FAOSTAT Food and Agriculture Data 2016; Food and Agriculture Organization: Rome, Italy, 2016.
  4. Nakagawa, M.; Honsho, C.; Kanzaki, S.; Shimizu, K.; Utsunomiya, N. Isolation and Expression analysis of FLOWERING LOCUS T-like and gibberellin metabolism genes in biennial-bearing mango trees. Sci. Hortic. 2012, 139, 108–117. [Google Scholar] [CrossRef]
  5. Ramírez, F.; Davenport, T.L. Mango (Mangifera indica L.) flowering physiology. Sci. Hortic. 2010, 126, 65–72. [Google Scholar] [CrossRef]
  6. Monselise, S.P.; Goldschmidt, E.E. Alternate bearing in fruit trees. In Horticultural Reviews; Janick, J., Ed.; John Wiley & Sons: Hoboken, NJ, USA, 1982; Volume 4, pp. 128–173. [Google Scholar]
  7. Goldschmidt, E.E.; Sadka, A. Yield alternation: Horticulture, physiology, molecular biology, and evolution. In Horticultural Reviews; Warrington, I., Ed.; John Wiley & Sons: Hoboken, NJ, USA, 2005; pp. 363–418. [Google Scholar]
  8. Samach, A.; Smith, H.M. Plant science constraints to obtaining consistent annual yields in perennials. II: Environment and fruit load affect induction of flowering. Plant Sci. 2013, 207, 168–176. [Google Scholar] [CrossRef] [PubMed]
  9. Shu, Z.H.; Sheen, T.F. Floral induction in axillary buds of mango (Mangifera indica L.) as affected by temperature. Sci. Hortic. 1987, 31, 81–87. [Google Scholar] [CrossRef]
  10. Núñez-Elisea, R.; Davenport, T.L. Flowering of mango trees in containers as influenced by seasonal temperature and water stress. Sci. Hortic. 1994, 58, 57–66. [Google Scholar] [CrossRef]
  11. Núñez-Elisea, R.; Davenport, T.L. Effect of leaf age, duration of cool temperature treatment, and photoperiod on bud dormancy release and floral initiation in mango. Sci. Hortic. 1995, 62, 63–73. [Google Scholar] [CrossRef]
  12. Tomer, E. Inhibition of flowering in mango by gibberellic acid. Sci. Hortic. 1984, 24, 299–303. [Google Scholar] [CrossRef]
  13. Núñez-Elisea, R.; Davenport, T.L. Gibberellin and temperature effects on dormancy release and shoot morphogenesis of mango (Mangifera indica L.). Sci. Hortic. 1998, 77, 11–21. [Google Scholar] [CrossRef]
  14. Protacio, C.M.; Quinto, J.E.; Serrano, E.P.; Marquez, I.P.; Rodriguez, F.M. Unravelling the mechanism of mango flowering. Acta Hortic. 2009, 820, 259–270. [Google Scholar] [CrossRef]
  15. Nunez-Elisea, R.; Davenport, T.L.; Caldeira, M.L. Bud initiation and morphogenesis in “Tommy Atkins” mango as affected by temperature and triazole growth retardants. Acta Hortic. 1993, 341, 192–198. [Google Scholar] [CrossRef]
  16. Upreti, K.K.; Reddy, Y.T.N.; Prasad, S.R.S.; Bindu, G.V.; Jayaram, H.L.; Rajan, S. Hormonal changes in response to paclobutrazol induced early flowering in mango cv. Totapuri. Sci. Hortic. 2013, 150, 414–418. [Google Scholar] [CrossRef]
  17. Pin, P.A.; Nilsson, O. The multifaceted roles of FLOWERING LOCUS T in plant development. Plant Cell Environ. 2012, 35, 1742–1755. [Google Scholar] [CrossRef] [PubMed]
  18. Wickland, D.P.; Hanzawa, Y. The FLOWERING LOCUS T/TERMINAL FLOWER 1 gene family: Functional evolution and molecular mechanisms. Mol. Plant 2015, 8, 983–997. [Google Scholar] [CrossRef] [PubMed]
  19. Putterill, J.; Varkonyi-Gasic, E. FT and florigen long-distance flowering control in plants. Curr. Opin. Plant Biol. 2016, 33, 77–82. [Google Scholar] [CrossRef] [PubMed]
  20. Shannon, S.; Meeks-Wagner, D.R. Genetic interactions that regulate inflorescence development in Arabidopsis. Plant Cell 1993, 5, 639–655. [Google Scholar] [CrossRef]
  21. Ratcliffe, O.J.; Amaya, I.; Vincent, C.A.; Rothstein, S.; Carpenter, R.; Coen, E.S.; Bradley, D.J. A common mechanism controls the life cycle and architecture of plants. Development 1998, 1615, 1609–1615. [Google Scholar] [CrossRef]
  22. Andrés, F.; Coupland, G. The genetic basis of flowering responses to seasonal cues. Nat. Rev. Genet. 2012, 13, 627–639. [Google Scholar] [CrossRef] [PubMed]
  23. Kardailsky, I.; Shukla, V.K.; Ahn, J.H.; Dagenais, N.; Christensen, S.K.; Nguyen, J.T.; Chory, J.; Harrison, M.J.; Weigel, D. Activation tagging of the floral inducer FT. Science 1999, 286, 1962–1965. [Google Scholar] [CrossRef]
  24. Yamaguchi, A.; Kobayashi, Y.; Goto, K.; Abe, M.; Araki, T. TWIN SISTER of FT (TSF) acts as a floral pathway integrator redundantly with FT. Plant Cell Physiol. 2005, 46, 1175–1189. [Google Scholar] [CrossRef] [Green Version]
  25. Yoo, S.Y.; Kardailsky, I.; Lee, J.S.; Weigel, D.; Ahn, J.H. Acceleration of flowering by overexpression of MFT (MOTHER OF FT and TFL1). Mol. Cells 2004, 17, 95–101. [Google Scholar]
  26. Mimida, N.; Goto, K.; Kobayashi, Y.; Araki, T.; Ahn, J.H.; Weigel, D.; Murata, M.; Motoyoshi, F.; Sakamoto, W. Functional divergence of the TFL1-like gene family in Arabidopsis revealed by characterization of a novel homologue. Genes Cells 2001, 6, 327–336. [Google Scholar] [CrossRef] [PubMed]
  27. Yoo, S.J.; Chung, K.S.; Jung, S.H.; Yoo, S.Y.; Lee, J.S.; Ahn, J.H. BROTHER OF FT AND TFL1 (BFT) has TFL1-like activity and functions redundantly with TFL1 in inflorescence meristem development in Arabidopsis. Plant J. 2010, 63, 241–253. [Google Scholar] [CrossRef] [PubMed]
  28. Taoka, K.I.; Ohki, I.; Tsuji, H.; Furuita, K.; Hayashi, K.; Yanase, T.; Yamaguchi, M.; Nakashima, C.; Purwestri, Y.A.; Tamaki, S.; et al. 14-3-3 proteins act as intracellular receptors for rice Hd3a florigen. Nature 2011, 476, 332–335. [Google Scholar] [CrossRef] [PubMed]
  29. Bäurle, I.; Dean, C. The timing of developmental transitions in plants. Cell 2006, 125, 655–664. [Google Scholar] [CrossRef] [PubMed]
  30. Périlleux, C.; Bouché, F.; Randoux, M.; Orman-Ligeza, B. Turning meristems into fortresses. Trends Plant Sci. 2019, 24, 431–442. [Google Scholar] [CrossRef] [PubMed]
  31. Moraes, T.S.; Dornelas, M.C.; Martinelli, A.P. FT/TFL1: Calibrating plant architecture. Front. Plant Sci. 2019, 10, 97. [Google Scholar] [CrossRef]
  32. Zhu, Y.; Klasfeld, S.; Jeong, C.W.; Jin, R.; Goto, K.; Yamaguchi, N.; Wagner, D. TERMINAL FLOWER 1-FD complex target genes and competition with FLOWERING LOCUS T. Nat. Commun. 2020, 11, 5118. [Google Scholar] [CrossRef]
  33. Hanzawa, Y.; Money, T.; Bradley, D. A single amino acid converts a repressor to an activator of flowering. Proc. Natl. Acad. Sci. USA 2005, 102, 7748–7753. [Google Scholar] [CrossRef]
  34. Ahn, J.H.; Miller, D.; Winter, J.; Banfield, M.J.; Hwan, J.; Yoo, S.Y.; Henz, S.R.; Brady, R.L.; Weigel, D. A divergent external loop confers antagonistic activity on floral regulators FT and TFL1. EMBO J. 2006, 25, 605–614. [Google Scholar] [CrossRef]
  35. Endo, M.; Yoshida, M.; Sasaki, Y.; Negishi, K.; Horikawa, K.; Daimon, Y.; Kurotani, K.; Notaguchi, M.; Abe, M.; Araki, T. Re-evaluation of florigen transport kinetics with separation of functions by mutations that uncouple flowering initiation and long-distance transport. Plant J. 2018, 59, 1621–1629. [Google Scholar] [CrossRef] [PubMed]
  36. Wang, G.; Wang, P.; Gao, Y.; Li, Y.; Wu, L.; Gao, J.; Zhao, M.; Xia, Q. Isolation and functional characterization of a novel FLOWERING LOCUS T homolog (NtFT5) in Nicotiana tabacum. J. Plant Physiol. 2018, 231, 393–401. [Google Scholar] [CrossRef] [PubMed]
  37. Harig, L.; Beinecke, F.A.; Oltmanns, J.; Muth, J.; Müller, O.; Rüping, B.; Twyman, R.M.; Fischer, R.; Prüfer, D.; Noll, G.A. Proteins from the FLOWERING LOCUS T-like subclade of the PEBP family act antagonistically to regulate floral initiation in tobacco. Plant J. 2012, 72, 908–921. [Google Scholar] [CrossRef]
  38. Endo, T.; Shimada, T.; Fujii, H.; Kobayashi, Y.; Araki, T.; Omura, M. Ectopic expression of an FT homolog from Citrus confers an early flowering phenotype on trifoliate orange (Poncirus trifoliata L. Raf.). Transgenic Res. 2005, 1, 703–712. [Google Scholar] [CrossRef]
  39. Tränkner, C.; Lehmann, S.; Hoenicka, H.; Hanke, M.-V.; Fladung, M.; Lenhardt, D.; Dunemann, F.; Gau, A.; Schlangen, K.; Malnoy, M.; et al. Over-expression of an FT-homologous gene of apple induces early flowering in annual and perennial plants. Planta 2010, 232, 1309–1324. [Google Scholar] [CrossRef]
  40. Haberman, A.; Bakhshian, O.; Cerezo-Medina, S.; Paltiel, J.; Adler, C.; Ben-Ari, G.; Mercado, J.A.; Pliego-Alfaro, F.; Lavee, S.; Samach, A. A possible role for flowering locus T-encoding genes in interpreting environmental and internal cues affecting olive (Olea europaea L.) flower induction. Plant Cell Environ. 2017, 40, 1263–1280. [Google Scholar] [CrossRef] [PubMed]
  41. Moss, S.M.A.; Wang, T.; Voogd, C.; Brian, L.A.; Wu, R.; Hellens, R.P.; Allan, A.C.; Putterill, J.; Varkonyi-Gasic, E. AcFT promotes kiwifruit in vitro flowering when overexpressed and Arabidopsis flowering when expressed in the vasculature under its own promoter. Plant Direct 2018, 2, e00068. [Google Scholar] [CrossRef]
  42. Freiman, A.; Shlizerman, L.; Golobovitch, S.; Yablovitz, Z.; Korchinsky, R.; Cohen, Y.; Samach, A.; Chevreau, E.; Le Roux, P.M.; Patocchi, A.; et al. Development of a transgenic early flowering pear (Pyrus communis L.) genotype by RNAi silencing of PcTFL1-1 and PcTFL1-2. Planta 2012, 235, 1239–1251. [Google Scholar] [CrossRef]
  43. Flachowsky, H.; Szankowski, I.; Waidmann, S.; Peil, A.; Tränkner, C.; Hanke, M.V. The MdTFL1 gene of apple (Malus × domestica Borkh.) reduces vegetative growth and generation time. Tree Physiol. 2012, 32, 1288–1301. [Google Scholar] [CrossRef]
  44. Muñoz-Fambuena, N.; Mesejo, C.; Carmen González-Mas, M.; Primo-Millo, E.; Agustí, M.; Iglesias, D.J. Fruit regulates seasonal expression of flowering genes in alternate-bearing ‘Moncada’ mandarin. Ann. Bot. 2011, 108, 511–519. [Google Scholar] [CrossRef]
  45. Muñoz-Fambuena, N.; Mesejo, C.; González-Mas, M.C.; Primo-Millo, E.; Agustí, M.; Iglesias, D.J. Fruit load modulates flowering-related gene expression in buds of alternate-bearing ‘Moncada’ mandarin. Ann. Bot. 2012, 110, 1109–1118. [Google Scholar] [CrossRef] [PubMed] [Green Version]
  46. Shalom, L.; Samuels, S.; Zur, N.; Shlizerman, L.; Zemach, H.; Weissberg, M. Alternate bearing in citrus: Changes in the expression of flowering control genes and in global gene expression in ON- versus OFF-crop trees. PLoS ONE 2012, 7, e46930. [Google Scholar] [CrossRef] [PubMed]
  47. Ziv, D.; Zviran, T.; Zezak, O.; Samach, A.; Irihimovitch, V. Expression profiling of FLOWERING LOCUS T-Like gene in alternate bearing ‘Hass’ avocado trees suggests a role for PaFT in avocado flower induction. PLoS ONE 2014, 9, e110613. [Google Scholar] [CrossRef] [PubMed]
  48. Haberman, A.; Ackerman, M.; Crane, O.; Kelner, J.; Costes, E.; Samach, A. Different flowering response to various fruit loads in apple cultivars correlates with degree of transcript reaccumulation of a TFL1-encoding gene. Plant J. 2016, 87, 161–173. [Google Scholar] [CrossRef]
  49. Vyavahare, S.N.; Krishna, B.; Joshi, S.S.; Chaudhari, R.S.; Subramaniam, V.R.; Sane, P.V. Characterization of mango Flowering Locus T (FT) and Terminal Flower 1 (TFL1) genes. Acta Hortic. 2017, 1, 113–124. [Google Scholar] [CrossRef]
  50. Fan, Z.-Y.; He, X.-H.; Fan, Y.; Yu, H.-X.; Wang, Y.-H.; Xie, X.-J.; Liu, Y.; Mo, X.; Wang, J.-Y.; Luo, C. Isolation and functional characterization of three MiFTs genes from mango. Plant Physiol. Biochem. 2020, 155, 169–176. [Google Scholar] [CrossRef]
  51. Wang, Y.-H.; He, X.-H.; Yu, H.-X.; Mo, X.; Fan, Y.; Fan, Z.-Y.; Xie, X.-J.; Liu, Y.; Luo, C. Overexpression of four MiTFL1 genes from mango delays the flowering time in transgenic Arabidopsis. BMC Plant Biol. 2021, 21, 407. [Google Scholar] [CrossRef]
  52. Mango Genome Consortium; Bally, I.S.E.; Bombarely, A.; Chambers, A.H.; Cohen, Y.; Dillon, N.L.; Innes, D.J.; Islas-Osuna, M.A.; Kuhn, D.N.; Mueller, L.A.; et al. The ‘Tommy Atkins’ mango genome reveals candidate genes for fruit quality. BMC Plant Biol. 2021, 21, 108. [Google Scholar] [CrossRef]
  53. Wang, P.; Luo, Y.; Huang, J.; Gao, S.; Zhu, G.; Dang, Z.; Gai, J.; Yang, M.; Zhu, M.; Zhang, H.; et al. The genome evolution and domestication of tropical fruit mango. Genome Biol. 2020, 21, 60. [Google Scholar] [CrossRef]
  54. Lavi, U.; Kaufman, D.; Sharon, D.; Gazit, S.; Tomer, E. ‘Shelly’: A new mango cultivar. HortScience 1997, 32, 138. [Google Scholar] [CrossRef]
  55. Khezri, M.; Heerema, R.; Brar, G.; Ferguson, L. Alternate bearing in pistachio (Pistacia vera L.): A review. Trees 2020, 34, 855–868. [Google Scholar] [CrossRef]
  56. Dag, A.; Bustan, A.; Avni, A.; Tzipori, I.; Lavee, S.; Riov, J. Timing of fruit removal affects concurrent vegetative growth and subsequent return bloom and yield in olive (Olea europaea L.). Sci. Hortic. 2010, 123, 469–472. [Google Scholar] [CrossRef]
  57. Kotoda, N.; Hayashi, H.; Suzuki, M.; Igarashi, M.; Hatsuyama, Y.; Kidou, S.-I.; Igasaki, T.; Nishiguchi, M.; Yano, K.; Shimizu, T.; et al. Molecular characterization of Flowering LOCUS T-like genes of apple (Malus × domestica Borkh.). Plant Cell Physiol. 2010, 51, 561–575. [Google Scholar] [CrossRef] [PubMed]
  58. Nishikawa, F.; Endo, T.; Shimada, T.; Fujii, H.; Shimizu, T.; Omura, M.; Ikoma, Y. Increased CiFT abundance in the stem correlates with floral induction by low temperature in Satsuma mandarin (Citrus unshiu Marc.). J. Exp. Bot. 2007, 58, 3915–3927. [Google Scholar] [CrossRef] [PubMed]
  59. Pillitteri, L.J.; Lovatt, C.J.; Walling, L.L. Isolation and characterization of a TERMINAL FLOWER homolog and its correlation with juvenility in Citrus. Plant Physiol. 2004, 135, 1540–1551. [Google Scholar] [CrossRef] [PubMed]
  60. Moraes, T.S.; Immink, R.G.H.; Martinelli, A.P.; Angenent, G.C.; van Esse, W.; Dornelas, M.C. Passiflora organensis FT/TFL1 gene family and their putative roles in phase transition and floral initiation. Plant Reprod. 2021, 35, 105–126. [Google Scholar] [CrossRef]
  61. Esumi, T.; Kitamura, Y.; Hagihara, C.; Yamane, H.; Tao, R. Identification of a TFL1 ortholog in Japanese apricot (Prunus mume Sieb. et Zucc.). Sci. Hortic. 2010, 125, 608–616. [Google Scholar] [CrossRef]
  62. Jiang, Y.; Zhu, Y.; Zhang, L.; Su, W.; Peng, J.; Yang, X.; Song, H.; Gao, Y.; Lin, S. EjTFL1 genes promote growth but inhibit flower bud differentiation in loquat. Front. Plant Sci. 2020, 11, 576. [Google Scholar] [CrossRef]
  63. Jean Finnegan, E.; Kovac, K.A.; Jaligot, E.; Sheldon, C.C.; James Peacock, W.; Dennis, E.S. The downregulation of FLOWERING LOCUS C (FLC) expression in plants with low levels of DNA methylation and by vernalization occurs by distinct mechanisms. Plant J. 2005, 44, 420–432. [Google Scholar] [CrossRef]
  64. Agustí, M.; Mesejo, C.; Muñoz-Fambuena, N.; Vera-Sirera, F.; de Lucas, M.; Martínez-Fuentes, A.; Reig, C.; Iglesias, D.J.; Primo-Millo, E.; Blázquez, M.A. Fruit-dependent epigenetic regulation of flowering in Citrus. New Phytol. 2020, 225, 376–384. [Google Scholar] [CrossRef]
  65. Rantanen, M.; Kurokura, T.; Jiang, P.; Mouhu, K.; Hytönen, T. Strawberry Homologue of TERMINAL FLOWER1 Integrates Photoperiod and Temperature Signals to Inhibit Flowering. Plant J. 2015, 82, 163–173. [Google Scholar] [CrossRef] [PubMed]
  66. Koskela, E.A.; Kurokura, T.; Toivainen, T.; Sønsteby, A.; Heide, O.M.; Sargent, D.J.; Isobe, S.; Jaakola, L.; Hilmarsson, H.; Elomaa, P.; et al. Altered Regulation of TERMINAL FLOWER 1 Causes the Unique Vernalisation Response in an Arctic Woodland Strawberry Accession. New Phytol. 2017, 216, 841–853. [Google Scholar] [CrossRef] [PubMed]
  67. Liljegren, S.J.; Gustafson-Brown, C.; Pinyopich, A.; Ditta, G.S.; Yanofsky, M.F. Interactions among APETALA1, LEAFY, and TERMINAL FLOWER1 Specify Meristem Fate. Plant Cell 1999, 11, 1007–1018. [Google Scholar] [CrossRef] [PubMed]
  68. Burondkar, M.M.; Upreti, K.K.; Ambavane, A.R. Hormonal Changes during Flowering in Response to Paclobutrazol Application in Mango Cv. Alphonso under Konkan Conditions. Indian J. Plant Physiol. 2016, 21, 306–311. [Google Scholar] [CrossRef]
  69. Abdel Rahim, A.O.S.; Elamin, O.M.; Bangerth, F.K. Effects of Paclobutrazol (PBZ) on Floral Induction and Associated Hormonal and Metabolic Changes of Biennially Bearing Mango (Mangifera Indica L.) Cultivars during off Year. ARPN J. Agric. Biol. Sci. 2011, 6, 55–67. [Google Scholar]
  70. Endo, T.; Shimada, T.; Nakata, Y.; Fujii, H.; Matsumoto, H.; Nakajima, N.; Ikoma, Y.; Omura, M. Abscisic Acid Affects Expression of Citrus FT Homologs upon Floral Induction by Low Temperature in Satsuma mandarin (Citrus unshiu Marc.). Tree Physiol. 2018, 38, 755–771. [Google Scholar] [CrossRef]
  71. Sherman, A.; Rubinstein, M.; Eshed, R.; Benita, M.; Ish-Shalom, M.; Sharabi-Schwager, M.; Rozen, A.; Saada, D.; Cohen, Y.; Ophir, R. Mango (Mangifera indica L.) Germplasm Diversity Based on Single Nucleotide Polymorphisms Derived from the Transcriptome. BMC Plant Biol. 2015, 15, 277. [Google Scholar] [CrossRef]
  72. Harrison, S.J.; Mott, E.K.; Parsley, K.; Aspinall, S.; Gray, J.C.; Cottage, A. A Rapid and Robust Method of Identifying Transformed Arabidopsis thaliana Seedlings Following Floral Dip Transformation. Plant Methods 2006, 2, 19. [Google Scholar] [CrossRef] [Green Version]
Figure 1. Effects of fruit load on flowering and yield in the next season. (A) Effects of de-fruiting treatments on return to flowering. Complete fruit-removal treatments, conducted from May 2017 through August 2017, were performed at the beginning of May, June and July, and at the end of August (representing the commercial harvesting period). Flowering intensity levels of individual trees within each group were ranked at the beginning of January and February and at the end of March 2018, using the following scale: (0) no flowering; (1) low intensity—<20 inflorescences; (2) medium intensity—<50 inflorescences; (3) high intensity—<150 inflorescences; (4) very high intensity—>150 inflorescences. (B) Effects of de-fruiting treatments on yield in the next season. Total yield per tree was determined in the following commercial harvest season (August 2018). Values represent means ± SE of four trees per treatment, and different letters indicate significant differences according to Tukey–Kramer multiple comparison test, with p ≤ 0.05.
Plants 11 02409 g001
Figure 2. Amino acid sequence comparison and structural features of mango ‘Shelly’ cultivar MiFT1, MiFT2, MiTFL1-1 and MiTFL1-2. Comparison of the deduced amino acid sequences of the four MiFT/TFL1 genes isolated from ‘Shelly’ with representative FT and TFL1 proteins from: avocado (Persea americana) PaFT (accession no. [ac]: AIG92770.1), grape (Vitis vinifera) VvFT1 (ac: ABL98120.1), citrus (Citrus unshiu) CiFT1 (ac: BAA77836.1), apple (Malus x domestica) MdFT (ac: ACL98164.1) and Arabidopsis (Arabidopsis thaliana) AtFT (ac: BAA77838.1); and with BFT and TFL1 proteins from Arabidopsis, AtTFL1 (ac: AED90661.1) and AtBFT (ac: Q9FIT4.1). Residue shading in black, dark gray and light gray indicates 100%, 75%, and 50% amino acid similarity, respectively. Dashed lines indicate gaps introduced to achieve maximum alignment. The two key FT amino acid residues corresponding to AtFT Tyr-85 and Gln-140 in AtFT1 are indicated with black arrows. The three amino acid residues corresponding to Val-70, Ser-76 and Arg-83 in AtFT, which have been suggested to play an essential role in regulating FT transport, are indicated with white arrows. The five conserved amino acid residues corresponding to Arg-62, The-66, Pro-94, Fhe-101 and Arg-130 in AtFT, which have been suggested to be required for the 14-3-3 interaction, are indicated with dashed white arrows. The conserved amino acid sequence LGRQTVYAPGWRQN, which distinguishes FT from TFL1 and/or BFT, is overlined in blue.
Plants 11 02409 g002
Figure 3. Ectopic expression of ‘Shelly’ MiFT1 and MiFT2 genes in Arabidopsis. (A) Number of days to flowering and rosette leaf’s at bolting of Arabidopsis Col-0 (WT), four representative lines constitutively expressing MiFT1, and three representative lines constitutively expressing MiFT2, under LD conditions. Values represent means ± SE of number of days to flowering and number of rosette leaves at flowering; n = 7–34 plants per line. Different small or capital letters indicate significant differences of number of days to flowering or rosette leaf number at bolting, using Tukey–Kramer multiple comparison test, with p ≤ 0.05. Asterisks (*) denote a significant difference between the control and a specific 35S:MiFT1- or MiFT2-overexpressing line, using least significant difference (LSD) test, according to pairwise comparison by Student’s t-test, with p ≤ 0.05. (B) MiFT1- and MiFT2-overexpressing lines exhibiting early and late flowering phenotypes, respectively, relative to WT plants under LD conditions. Photographs were taken 32 days after sowing.
Plants 11 02409 g003
Figure 4. Ectopic expression of ‘Shelly’ MiTFL1-1 and MiTFL1-2 genes in Arabidopsis. 35S:MiTFL1-1- and 35S:MiTFL1-2-transformed plants exhibit late flowering phenotype relative to WT plants and display branched phenotype and/or shoot-like inflorescences. Photographs were taken 66 and 72 days from sowing (A,C), and 94 and 103 days from sowing (B,D). Comparison of flowering phenotypes of Arabidopsis Col-0 (WT), four lines constitutively expressing MiTFL1-1 and three lines constitutively expressing MiTFL1-2, under LD conditions (E). Values represent means + SE of number of days to flowering and number of rosette leaves at flowering; n = 17–35 plants per line. Different small or capital letters indicate significant differences of number of days to flowering or rosette leaf number at bolting, using Tukey–Kramer multiple comparison test, with p ≤ 0.05. Asterisks (*) denote a significant difference between the control and a specific 35S:MiTFL1-1- or MiTFL1-2-overexpressing line, using least significant difference (LSD) test, according to pairwise comparison by Student’s t-test, with p ≤ 0.05.
Plants 11 02409 g004
Figure 5. Expression of MiFT/TFL1 genes in various tissues. Expression profiles of MiFT1 (A), MiFT2 (B), MiTFL1-1 (C) and MiTFL1-2 (D) genes in leaves and buds of 0.5- or 3-year-old seedlings and 5-year-old grafted ‘Shelly’ trees, and in fruitlet Mesocarp (M) and Seed (S) tissues. The data are mean of three replicates ± SE. Different letters indicate significant differences according to Tukey–Kramer multiple comparison test, with p ≤ 0.05.
Plants 11 02409 g005
Figure 6. Effect of fruit load on flowering and on the next year’s total yield. (A) Flowering-intensity levels. (B) Total yield. Uniform HL and LL trees were selected at the beginning of May 2017. Flowering levels were ranked from the end of January 2018 through March 2018, as decribed in Figure 1. Total yield of fruit developing from fruit set in March 2017 was determined in August 2017 and in August 2018 by weighing all fruit harvested from the selected trees. Values represent means ± SE of six trees. Asterisks (*) denote a significant difference at the same time point, or between seasons, using least significant difference (LSD) test, according to pairwise comparison by Student’s t-test, with p ≤ 0.05. (CF) Images of LL and HL trees selected based on their fruit load intensity at the beginning of May 2017. Photographs were taken in January 2018 (C,D) and March 2018 (E,F).
Plants 11 02409 g006
Figure 7. Seasonal expression profiles of MiFT1, MiFT2 and MiAP1 in leaves (AC), and buds (DF) of HL (heavy load), and LL (light load) ‘Shelly’ trees. Tissue sampling was performed using six uniform HL and LL trees that were divided into three pairs of trees at the beginning of May 2017. The collected leaves and terminal buds were dissected and pooled to form three biological replicates (for each tissue and tree status). Data are means±SE of three independent replicates. Asterisks (*) denote a significant difference between the transcript expression in HL and LL tissues at the same time point, using least significant difference (LSD) test, according to pairwise comparison by Student’s t-test, with p ≤ 0.05. Sampling intervals are shown on the X-axis. The timing of flower induction is indicated by black arrow. Comparison of MiFT1 and MiFT2 expression in leaves (L) vs. buds (B), at those time points at which its expression was maximal (G,H). Different letters indicate significant differences according to Tukey–Kramer multiple comparison test, with p ≤ 0.05.
Plants 11 02409 g007
Figure 8. Seasonal expression profiles of MiTFL1-1 and MiTFL1-2 in leaves (A,B), and buds (C,D), of HL (heavy load), and LL (light load) ‘Shelly’ trees. Tissue sampling was performed using six uniform HL and LL trees that were divided into three pairs of trees at the beginning of May 2017. The collected leaves and terminal buds were dissected and pooled to form three biological replicates (for each tissue and tree status). Data are means±SE of three independent replicates. Asterisks (*) denote a significant difference between the transcript expression in HL and LL tissues at the same time point, using least significant difference (LSD) test, according to pairwise comparison by Student’s t-test, with p ≤ 0.05. Sampling intervals are shown on the X-axis. Comparison of MiTFL1-1 and MiTFl1-2 expression in leaves (L) vs. buds (B), at those time points at which its expression was maximal (E,F). Different letters indicate significant differences according to Tukey–Kramer multiple comparison test, with p ≤ 0.05.
Plants 11 02409 g008
Publisher’s Note: MDPI stays neutral with regard to jurisdictional claims in published maps and institutional affiliations.

