
Oxidative Stress Mitigation by Chitosan Nanoparticles in Durum Wheat Also Affects Phytochemicals and Technological Quality of Bran and Semolina

 ,
,  , , ,
, , ,  and
and 
Abstract
:1. Introduction
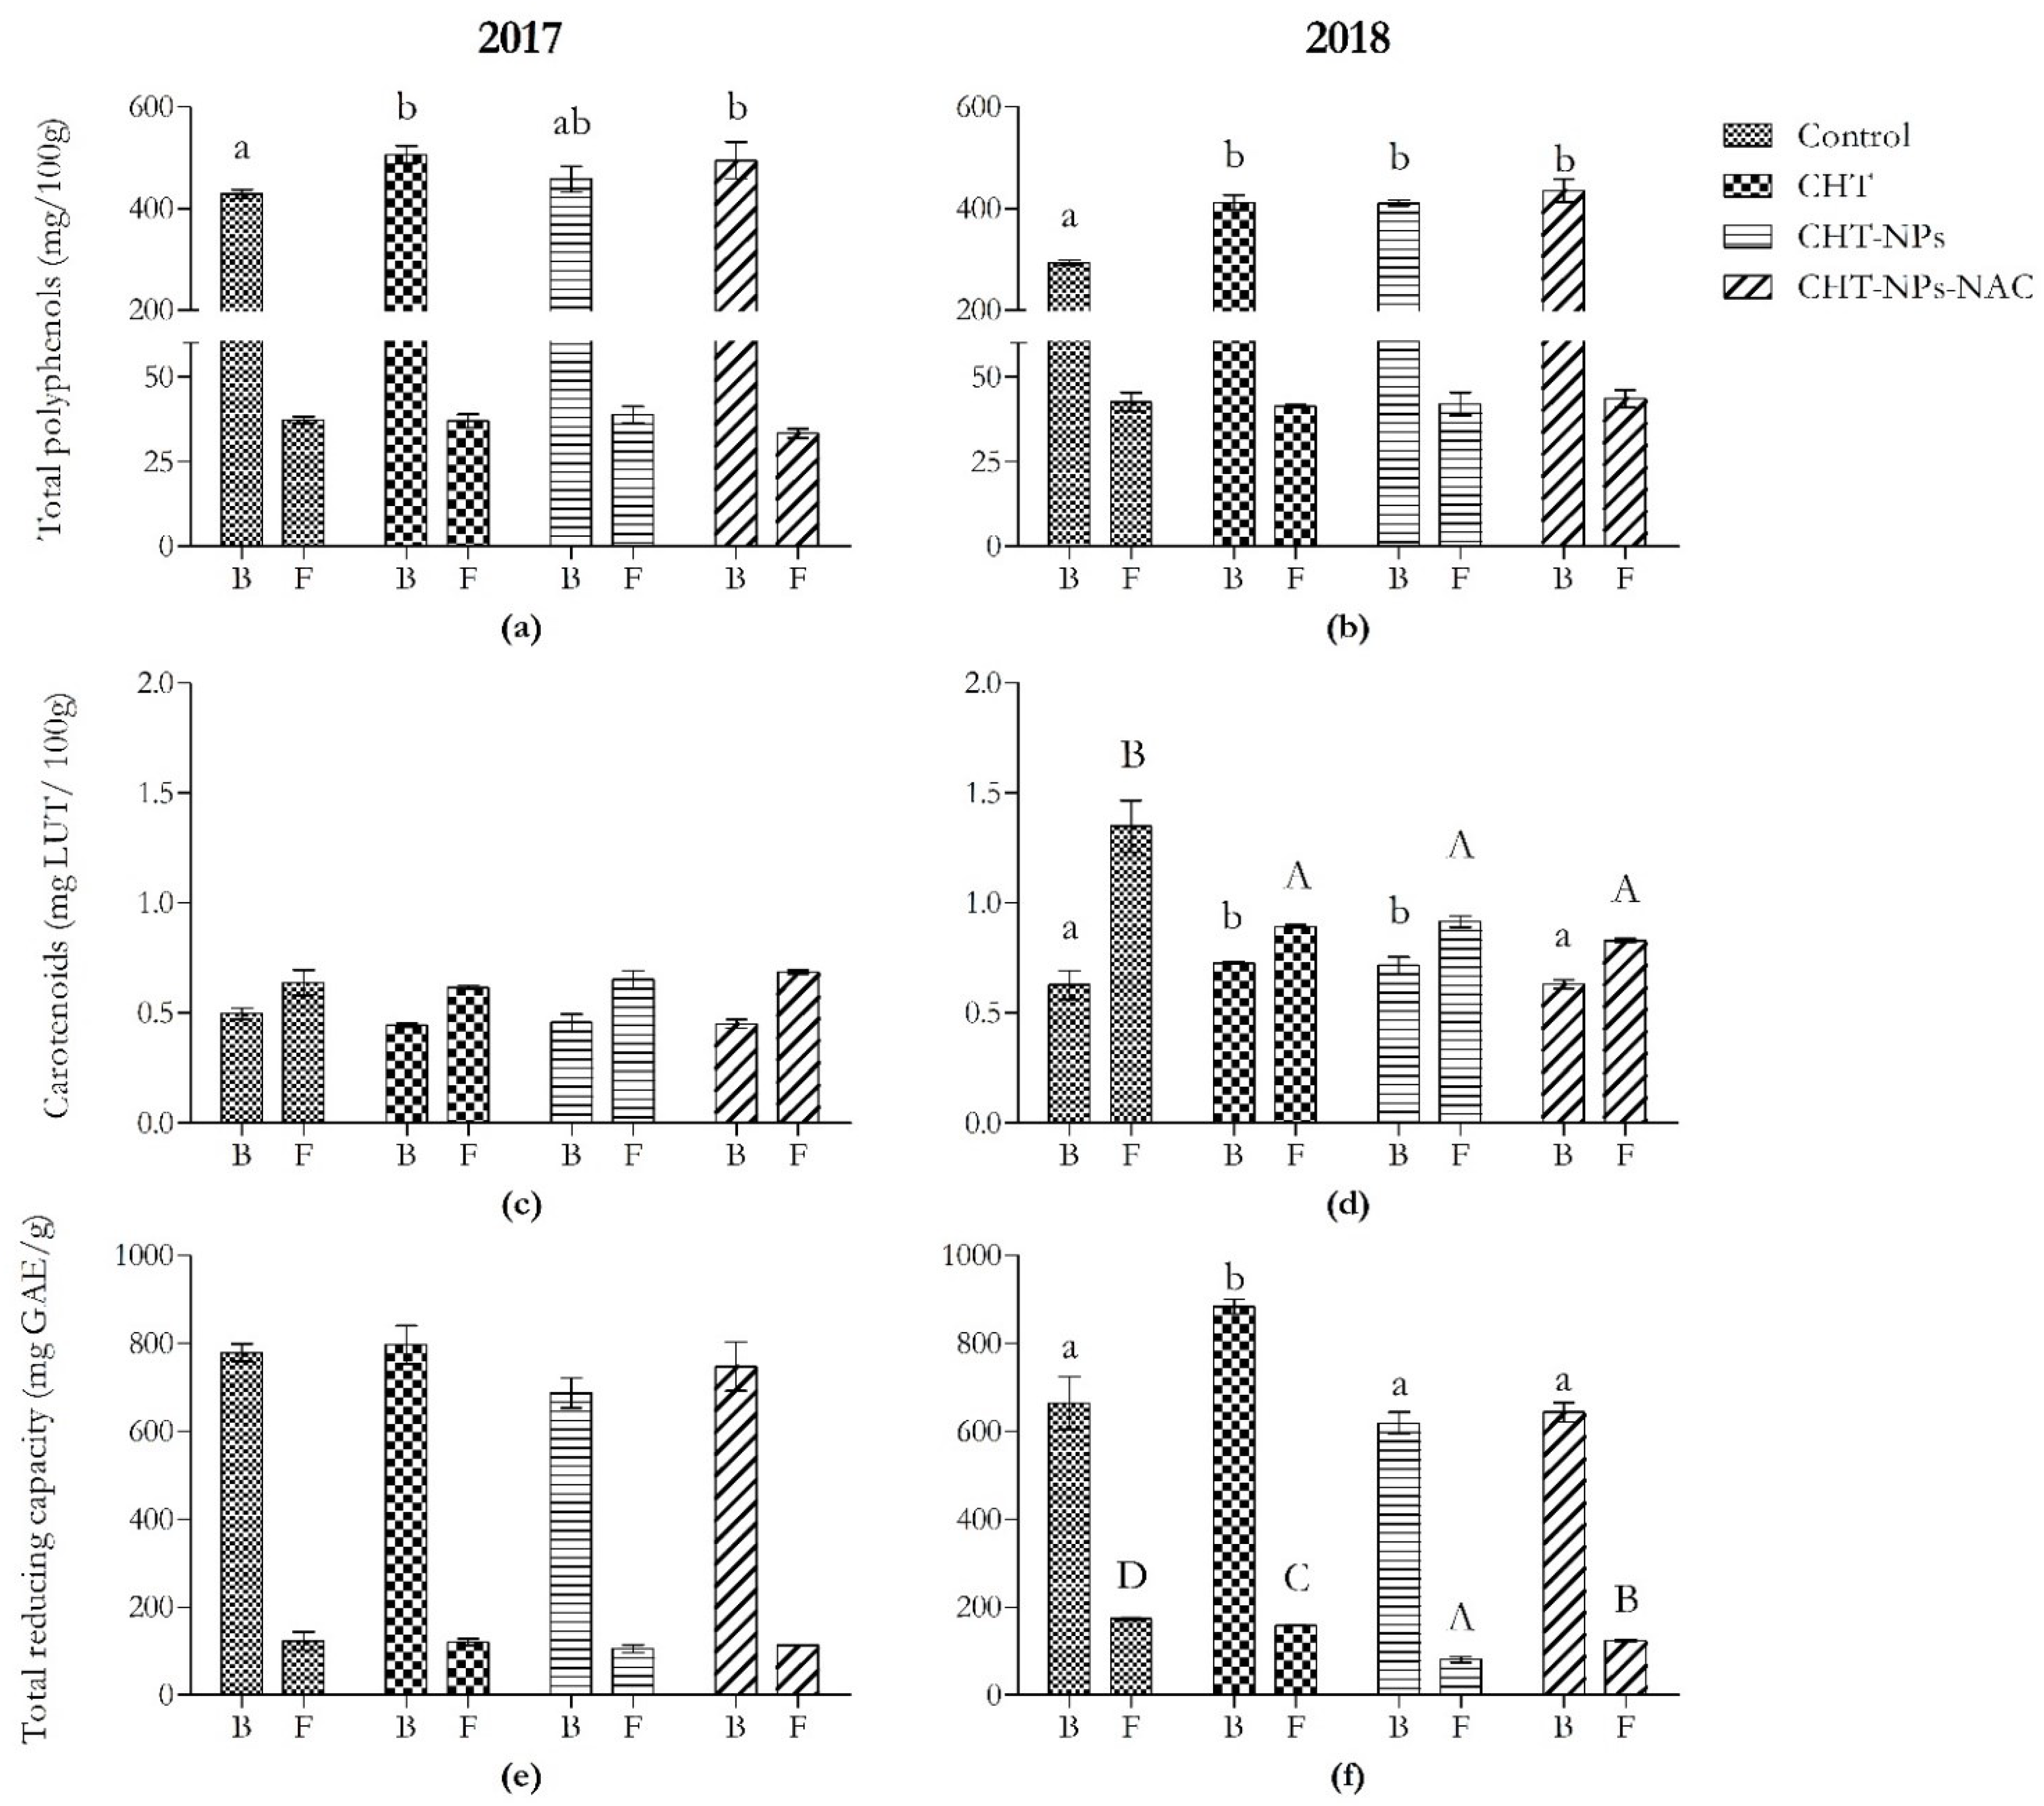
2. Results
2.1. Effect of CHT Nanoparticles on the Nutritional Quality of Durum Wheat Bran and Semolina
2.1.1. Phenolic Acid Content
2.1.2. Tocopherol and Tocotrienol Content
2.1.3. Total Carotenoid Content
2.1.4. Total Reducing Capacity
2.2. Effect of CHT Nanoparticles on Technological Properties of Durum Wheat Semolina
2.2.1. Total Starch, Damaged Starch, and Pasting Properties
2.2.2. Proteins, Thiol Content, and Gluten Aggregation Capacity
3. Discussion
4. Materials and Methods
4.1. Experimental Design and Sample Preparation
4.2. Analysis of Polyphenols
4.3. Analysis of Tocopherols, Tocotrienols, and Total Carotenoids
4.4. Analysis of Total Reducing Capacity
4.5. Starch Analyses and Pasting Properties on Durum Wheat Semolina
4.6. Protein and Total Thiol Analyses
4.7. Gluten Aggregation Properties
4.8. Statistical Analysis
5. Conclusions
Supplementary Materials
Author Contributions
Funding
Institutional Review Board Statement
Informed Consent Statement
Data Availability Statement
Conflicts of Interest
References
- IDRC. Facts and Figures on Food and Biodiversity; IDRC Communications, International Development Research Centre: Ottawa, ON, Canada, 2010; Available online: https://www.idrc.ca/en/research-in-action/facts-figures-food-and-biodiversity (accessed on 23 December 2010).
- Mills, G.; Buse, A.; Gimeno, B.; Bermejo, V.; Holland, M.; Emberson, L.; Pleijel, H. A synthesis of AOT40-based response functions and critical levels of ozone for agricultural and horticultural crops. Atmos. Environ. 2007, 41, 2630–2643. [Google Scholar] [CrossRef]
- Gaudel, A.; Cooper, O.R.; Chang, K.-L.; Bourgeois, I.; Ziemke, J.R.; Strode, S.A.; Oman, L.D.; Sellitto, P.; Nédélec, P.; Blot, R.; et al. Aircraft observations since the 1990s reveal increases of tropospheric ozone at multiple locations across the Northern Hemisphere. Sci. Adv. 2020, 6, 8272. [Google Scholar] [CrossRef] [PubMed]
- Ainsworth, E.A. Understanding and improving global crop response to ozone pollution. Plant J. 2017, 90, 886–897. [Google Scholar] [CrossRef] [PubMed]
- Fiscus, E.L.; Booker, F.L.; Burkey, K.O. Crop responses to ozone: Uptake, modes of action, carbon assimilation and partitioning. Plant Cell Environ. 2005, 28, 997–1011. [Google Scholar] [CrossRef]
- Wilkinson, S.; Mills, G.; Illidge, R.; Davies, W.J. How is ozone pollution reducing our food supply? J. Exp. Bot. 2012, 63, 527–536. [Google Scholar] [CrossRef]
- Feng, Z.; Pang, J.; Kobayashi, K.; Zhu, J.; Ort, D.R. ifferential responses in two varieties of winter wheat to elevated ozone concentration under fully open-air field conditions. Glob. Chang. Biol. 2011, 17, 580–591. [Google Scholar] [CrossRef]
- Feng, Y.; Nguyen, T.H.; Alam, M.S.; Emberson, L.; Gaiser, T.; Ewert, F.; Frei, M. Identifying and modelling key physiological traits that confer tolerance or sensitivity to ozone in winter wheat. Environ. Pollut. 2022, 304, 119251. [Google Scholar] [CrossRef] [PubMed]
- Osborne, S.; Pandey, D.; Mills, G.; Hayes, F.; Harmens, H.; Gillies, D.; Büker, P.; Emberson, L. New insights into leaf physiological responses to ozone for use in crop modelling. Plants 2019, 8, 84. [Google Scholar] [CrossRef] [PubMed] [Green Version]
- Feng, Z.; Kobayashi, K.; Ainsworth, E.A. Impact of elevated ozone concentration on growth, physiology, and yield of wheat (Triticum aestivum L.): A meta-analysis. Glob. Chang. Biol. 2008, 14, 2696–2708. [Google Scholar] [CrossRef]
- Broberg, M.C.; Feng, Z.; Xin, Y.; Pleijel, H. Ozone effects on wheat grain quality: A summary. Environ. Pollut. 2015, 197, 203–213. [Google Scholar] [CrossRef]
- Wang, Y.X.; Frei, M. Stressed food e the impact of abiotic environmental stresses on crop quality. Agric. Ecosyst. Environ. 2011, 141, 271–286. [Google Scholar] [CrossRef]
- Pleijel, H.; Broberg, M.C.; Uddling, J.; Mills, G. Current surface ozone concentrations significantly decrease wheat growth, yield and quality. Sci. Total Environ. 2018, 613, 687–692. [Google Scholar] [CrossRef] [PubMed]
- Piikki, K.; De Temmerman, L.; Ojanpera, K.; Danielsson, H.; Pleijel, H. The grain quality of spring wheat (Triticum aestivum L.) in relation to elevated ozone uptake and carbon dioxide exposure. Eur. J. Agron. 2008, 28, 245–254. [Google Scholar] [CrossRef]
- Lunn, G.D.; Major, B.J.; Kettlewell, P.S.; Scott, R.K. Mechanisms leading to excess alpha-amylase activity in wheat (Triticum aestivum L) grain in the UK. J. Cereal Sci. 2001, 33, 313–329. [Google Scholar] [CrossRef]
- Saitanis, C.J.; Agathokleous, E. Exogenous application of chemicals for protecting plants against ambient ozone pollution: What should come next? Curr. Opin. Environ. Sci. Health 2021, 19, 100215. [Google Scholar] [CrossRef]
- Kannaujia, R.; Singh, P.; Prasad, V. Evaluating impacts of biogenic silver nanoparticles and ethylenediurea on wheat (Triticum aestivum L.) against ozone-induced damages. Environ. Res. 2022, 203, 111857. [Google Scholar] [CrossRef] [PubMed]
- Foyer, C.H.; Noctor, G. Ascorbate and glutathione: The hearth of the redox hub. Plant Physiol. 2011, 155, 2–18. [Google Scholar] [CrossRef] [Green Version]
- Noctor, G.; Reichheld, J.P.; Foyer, C.H. ROS-related redox regulation and signaling in plants. Semin. Cell Dev. Biol. 2018, 80, 3–12. [Google Scholar] [CrossRef] [PubMed] [Green Version]
- Picchi, V.; Monga, R.; Marzuoli, R.; Gerosa, G.; Faoro, F. The ozone-like syndrome in durum wheat (Triticum durum Desf.): Mechanisms underlying the different symptomatic responses of two sensitive cultivars. Plant Physiol. Biochem. 2017, 112, 261–269. [Google Scholar] [CrossRef] [PubMed]
- Fatima, A.; Singh, A.A.; Mukherjee, A.; Agrawal, M.; Agrawal, S.B. Ascorbic acid and thiols as potential biomarkers of ozone tolerance in tropical wheat cultivars. Ecotoxicol. Environ. Saf. 2019, 171, 701–708. [Google Scholar] [CrossRef] [PubMed]
- Safikhan, S.; Khoshbakht, K.; Chaichi, M.R.; Amini, A.; Motesharezadeh, B. Role of chitosan on the growth, physiological parameters and enzymatic activity of milk thistle (Silybum marianum (L.) Gaertn.) in a pot experiment. J. Appl. Res. Med. Aromat. Plants 2018, 10, 49–58. [Google Scholar] [CrossRef]
- Chun, S.C.; Chandrasekaran, M. Chitosan and chitosan nanoparticles induced expression of pathogenesis-related proteins genes enhances biotic stress tolerance in tomato. Int. J. Biol. Macromol. 2019, 125, 948–954. [Google Scholar] [CrossRef] [PubMed]
- Bakhoum, G.S.; Sadak, M.S.; Badr, E.A.E.M. Mitigation of adverse effects of salinity stress on sunflower plant (Helianthus annuus L.) by exogenous application of chitosan. Bull. Natl. Res. Cent. 2020, 44, 79. [Google Scholar] [CrossRef]
- Sen, S.K.; Chouhan, D.; Das, D.; Ghosh, R.; Mandal, P. Improvisation of salinity stress response in mung bean through solid matrix priming with normal and nano-sized chitosan. Int. J. Biol. Macromol. 2020, 145, 108–123. [Google Scholar] [CrossRef]
- Balusamy, S.R.; Rahimi, S.; Sukweenadhi, J.; Sunderraj, S.; Shanmugam, R.; Thangavelu, L.; Mijakovic, I.; Perumalsamy, H. Chitosan, chitosan nanoparticles and modified chitosan biomaterials, a potential tool to combat salinity stress in plants. Carbohydr. Polym. 2022, 284, 119–189. [Google Scholar] [CrossRef] [PubMed]
- Iriti, M.; Faoro, F. Chitosan as a MAMP, searching for a PRR. Plant Signal. Behav. 2009, 4, 66–68. [Google Scholar] [CrossRef] [Green Version]
- Picchi, V.; Gobbi, S.; Fattizzo, M.; Zefelippo, M.; Faoro, F. Chitosan nanoparticles loaded with N-acetyl cysteine to mitigate ozoneand other possible oxidative stresses in durum wheat. Plants 2021, 10, 691. [Google Scholar] [CrossRef] [PubMed]
- Hadwiger, L.A. Multiple effects of chitosan on plant systems: Solid science or hype. Plant Sci. 2013, 208, 42–49. [Google Scholar] [CrossRef]
- Malerba, M.; Cerana, R. Recent applications of chitin- and chitosan-based polymers in plants. Polymers 2019, 11, 839. [Google Scholar] [CrossRef] [PubMed] [Green Version]
- Stasinska-Jakubas, M.; Hawrylak-Nowak, B. Protective, biostimulating, and eliciting effects of chitosan and its derivatives on crop plants. Molecules 2022, 27, 2801. [Google Scholar] [CrossRef] [PubMed]
- Martini, D.; Taddei, F.; Ciccoritti, R.; Pasquini, M.; Nicoletti, I.; Corradini, D.; D’Egidio, M.G. Variation of total antioxidant activity and of phenolic acid, total phenolics and yellow coloured pigments in durum wheat (Triticum turgidum L. var. durum) as a function of genotype, crop year and growing area. J. Cereal Sci. 2015, 65, 175–185. [Google Scholar] [CrossRef]
- De Santis, M.A.; Soccio, M.; Laus, M.N.; Flagella, Z. Influence of drought and salt stress on durum wheat grain quality and composition: A review. Plants 2021, 10, 2599. [Google Scholar] [CrossRef] [PubMed]
- Frei, M.; Kohno, Y.; Tietze, S.; Jekle, M.; Hussein, M.A.; Becker, T.; Becker, K. The response of rice grain quality to ozone exposure during growth depends on ozone level and genotype. Environ. Pollut. 2012, 163, 199–206. [Google Scholar] [CrossRef] [PubMed]
- Frater, R.; Hird, F.; Moss, H. A role for thiol and disulphide groups in determining the rheological properties of dough made from wheaten flour. Nature 1960, 186, 451–454. [Google Scholar] [CrossRef] [PubMed]
- Adom, K.K.; Sorrells, M.E.; Liu, R.H. Phytochemicals and antioxidant activity of milled fractions of different wheat varieties. J. Agric. Food Chem. 2005, 53, 2297–2306. [Google Scholar] [CrossRef] [PubMed]
- Gülçin, İ. Antioxidant activity of food constituents: An overview. Arch. Toxicol. 2012, 86, 345–391. [Google Scholar] [CrossRef]
- Di Loreto, A.; Bosi, S.; Montero, L.; Bregola, V.; Marotti, I.; Sferrazza, R.E.; Dinelli, G.; Herrero, M.; Cifuentes, A. Determination of phenolic compounds in ancient and modern durum wheat genotypes. Electrophoresis 2018, 39, 2001–2010. [Google Scholar] [CrossRef] [PubMed]
- Chandra, S.; Chakraborty, N.; Dasgupta, A. Chitosan nanoparticles: A positive modulator of innate immune responses in plants. Sci. Rep. 2015, 5, 15195. [Google Scholar] [CrossRef] [Green Version]
- Colak, N.; Torun, H.; Gruz, J.; Strnad, M.; Ayaz, F.A. Exogenous N-acetylcysteine alleviates heavy metal stress by promoting phenolic acids to support antioxidant defence systems in wheat roots. Ecotoxicol. Environ. Saf. 2019, 181, 49–59. [Google Scholar] [CrossRef] [PubMed]
- Gandía, M.L.; Del Monte, J.P.; Tenorio, J.L.; María Inés Santín-Montanyá. The influence of rainfall and tillage on wheat yield parameters and weed population in monoculture versus rotation systems. Sci. Rep. 2021, 11, 22138. [Google Scholar] [CrossRef]
- Yoshida, Y.; Niki, E.; Noguchi, N. Comparative study on the action of tocopherols and tocotrienols as antioxidant: Chemical and physical effects. Chem. Phys. Lipids 2003, 123, 63–75. [Google Scholar] [CrossRef]
- Pongprayoon, W.; Roytrakul, S.; Pichayangkura, R. The role of hydrogen peroxide in chitosan-induced resistance to osmotic stress in rice (Oryza sativa L.). Plant Growth Regul. 2013, 70, 159–173. [Google Scholar] [CrossRef]
- Belefant-Miller, H.; Grunden, E. Carotenoid metabolism is induced in rice bran during very high temperature stress. J. Sci. Food Agric. 2014, 94, 1808–1815. [Google Scholar] [CrossRef] [PubMed]
- Bohland, C.; Balkenhoh, T.; Loers, C.; Feussner, I.; Grambow, H.J. Differential induction of lipoxygenase isoforms in wheat upon treatment with rust fungus elicitor, chitin oligosaccharides, chitosan, and methyl jasmonate. Plant Physiol. 1997, 114, 679–685. [Google Scholar] [CrossRef] [Green Version]
- Siedow, J.N. Plant lipoxygenase: Structure and function. Annu. Rev. Plant Physiol. Plant. Mol. Biol. 1991, 42, 145–188. [Google Scholar] [CrossRef]
- De Noni, I.; Pagani, M.A. Cooking properties and heat damage of dried pasta as influenced by raw material characteristics and processing conditions. Crit. Rev. Food Sci. 2010, 50, 465–472. [Google Scholar] [CrossRef]
- Grassi, S.; Gullì, M.; Visioli, G.; Marti, A. Gluten aggregation properties as a tool for durum wheat quality assessment: A chemometric approach. LWT 2021, 142, 111048. [Google Scholar] [CrossRef]
- Marti, A.; Augst, E.; Cox, S.; Koehler, P. Correlations between gluten aggregation properties defined by the GlutoPeak test and content of quality related protein fractions of winter wheat flour. J. Cereal Sci. 2015, 66, 89–95. [Google Scholar] [CrossRef]
- Vaher, M.; Matso, K.; Levandi, T.; Helmja, K.; Kaljurand, M. Phenolic compounds and the antioxidant activity of the bran, flour and whole grain of different wheat varieties. Procedia Chem. 2010, 2, 76–82. [Google Scholar] [CrossRef] [Green Version]
- Mittler, R. Oxidative stress, antioxidants and stress tolerance. Trends Plant Sci. 2002, 7, 405–410. [Google Scholar] [CrossRef]
- Lethia, D.L.; Lu, Y.J.; John, K.M.M. Bioactive phytochemicals in wheat: Extraction, analysis, processing, and functional properties. J. Funct. Foods 2015, 18, 910–925. [Google Scholar] [CrossRef]
- Picchi, V.; Iriti, M.; Quaroni, S.; Saracchi, M.; Viola, P.; Faoro, F. Climate variations and phenological stages modulate ozone damages in field-grown wheat. A three-year study with eight modern cultivars in Po Valley (Northern Italy). Agric. Ecosys. Environ. 2010, 135, 310–317. [Google Scholar] [CrossRef]
- Mazzoncini, M.; Antichi, D.; Silvestri, N.; Ciantelli, G.; Sgherri, C. Organically vs conventionally grown winter wheat: Effects on grain yield, technological quality, and on phenolic composition and antioxidant properties of bran and refined flour. Food Chem. 2015, 175, 445–451. [Google Scholar] [CrossRef]
- Lampi, A.M.; Nurmi, T.; Ollilainen, V.; Piironen, V. Tocopherols and tocotrienols in wheat genotypes in the health grain diversity screen. J. Agric. Food Chem. 2008, 56, 9716–9721. [Google Scholar] [CrossRef] [PubMed]
- Goodwin, T.W. Carotenoids. Annu. Rev. Biochem. 1955, 24, 497–522. [Google Scholar] [CrossRef] [PubMed]
- Singleton, V.L.; Orthofer, R.; Lamuela-Raventós, R.M. Analysis of total phenols and other oxidation substrates and antioxidants by means of Folin-Ciocalteu reagent. Methods Enzymol. 1999, 299, 152–178. [Google Scholar] [CrossRef]
- AACC. Approved Methods of Analysis 2001; Cereals & Grains Association: St. Paul, MN, USA, 2001; Available online: https://www.cerealsgrains.org/resources/methods/Pages/default.aspx (accessed on 6 January 2001).
- Fierens, E.; Helsmoortel, L.; Joye, I.J.; Courtin, C.M.; Delcour, J.A. Changes in wheat (Triticum aestivum L.) flour pasting characteristics as a result of storage and their underlying mechanisms. J. Cereal Sci. 2015, 65, 81–87. [Google Scholar] [CrossRef]

| FA | VA | SYR | CA | p-CA | SA | ||
|---|---|---|---|---|---|---|---|
| 2017 | Bran | ||||||
| Ctrl | 344.2 ± 25.8 a | 8.01 ± 0.06 b | 13.30 ± 0.74 a | 2.00 ± 0.33 | 8.01 ± 0.99 | 35.70 ± 2.61 a | |
| CHT | 425.9 ± 23.0 b | 8.83 ± 0.02 c | 18.06 ± 1.94 b | 2.49 ± 0.13 | 8.83 ± 1.06 | 43.99 ± 2.81 b | |
| CHT-NPs | 386.2 ± 37.5 ab | 7.68 ± 0.59 a | 12.30 ± 0.52 a | 2.20 ± 0.45 | 7.68 ± 0.89 | 41.98 ± 2.39 b | |
| CHT-NPs-NAC | 414.5 ± 52.3 b | 8.97 ± 0.22 d | 17.92 ± 3.08 b | 1.98 ± 0.50 | 8.97 ± 0.99 | 45.72 ± 3.12 b | |
| p | * | ** | ** | ns | ns | ** | |
| Semolina | |||||||
| Ctrl | 28.3 ± 0.8 | 0.79 ± 0.04 | 1.79 ± 0.13 | 0.17 ± 0.04 | 0.79 ± 0.12 b | 5.23 ± 0.43 | |
| CHT | 28.8 ± 2.5 | 0.68 ± 0.14 | 1.54 ± 0.03 | 0.18 ± 0.06 | 0.68 ± 0.02 ab | 4.96 ± 0.60 | |
| CHT-NPs | 30.1 ± 3.0 | 0.68 ± 0.10 | 1.54 ± 0.29 | 0.17 ± 0.00 | 0.68 ± 0.07 ab | 5.68 ± 0.75 | |
| CHT-NPs-NAC | 25.6 ± 1.4 | 0.59 ± 0.17 | 1.56 ± 0.28 | 0.13 ± 0.04 | 0.59 ± 0.02 a | 4.58 ± 0.40 | |
| p | ns | ns | ns | ns | * | ns | |
| 2018 | Bran | ||||||
| Ctrl | 194.5 ± 7.4 a | 4.69 ± 0.33 a | 1.77 ± 0.05 a | 0.87 ± 0.07 | 5.81 ± 0.60 ab | 24.41 ± 1.13 a | |
| CHT | 264.1 ± 25.8 b | 5.38 ± 0.47 b | 2.51 ± 0.03 b | 0.91 ± 0.10 | 8.38 ± 2.13 b | 31.65 ± 3.53 b | |
| CHT-NPs | 261.3 ± 3.7 b | 5.81 ± 0.50 b | 2.27 ± 0.12 ab | 0.73 ± 0.21 | 4.69 ± 1.16 a | 30.64 ± 0.68 b | |
| CHT-NPs-NAC | 275.9 ± 19.3 b | 5.12 ± 0.80 b | 2.58 ± 0.25 b | 1.02 ± 0.21 | 5.12 ± 2.34 a | 37.08 ± 0.91 c | |
| p | * | ** | * | ns | * | *** | |
| Semolina | |||||||
| Ctrl | 26.3 ± 2.7 | 0.49 ± 0.13 a | 0.50 ± 0.06 a | 0.11 ± 0.04 ab | 0.64 ± 0.03 | 5.80 ± 0.60 | |
| CHT | 27.7 ± 2.5 | 0.52 ± 0.06 b | 0.60 ± 0.08 ab | 0.05 ± 0.02 a | 0.49 ± 0.05 | 5.76 ± 0.24 | |
| CHT-NPs | 29.4 ± 6.9 | 0.50 ± 0.07 a | 0.56 ± 0.12 b | 0.07 ± 0.02 a | 0.50 ± 0.13 | 6.76 ± 1.09 | |
| CHT-NPs-NAC | 29.9 ± 4.6 | 0.64 ± 0.04 c | 0.63 ± 0.02 b | 0.14 ± 0.06 b | 0.52 ± 0.17 | 6.85 ± 1.11 | |
| p | ns | *** | * | * | ns | ns | |
| (β + γ)-T3 | α-T3 | (β + γ)-T | α-T | Total T3 | Total T | ||
|---|---|---|---|---|---|---|---|
| 2017 | Bran | ||||||
| Ctrl | 11.85 ± 0.95 b | 0.49 ± 0.01 | 1.40 ± 0.09 a | 0.76 ± 0.13 | 12.33 ± 0.99 | 2.16 ± 0.04 a | |
| CHT | 14.25 ± 0.07 c | 0.55 ± 0.06 | 2.06 ± 0.01 b | 1.35 ± 0.00 | 14.80 ± 0.01 | 3.41 ± 0.01 bc | |
| CHT-NPs | 10.11 ± 1.02 a | 0.26 ± 0.01 | 1.39 ± 0.31 a | 1.04 ± 0.23 | 10.37 ± 1.03 | 2.43 ± 0.54 ab | |
| CHT-NPs-NAC | 12.55 ± 1.15 c | 0.29 ± 0.02 | 2.58 ± 0.38 c | 1.58 ± 0.77 | 12.98 ± 1.17 | 4.16 ± 1.03 c | |
| p | ** | ns | ** | ns | ns | * | |
| Semolina | |||||||
| Ctrl | 4.35 ± 0.38 a | 0.04 ± 0.01 | 0.68 ± 0.02 | 0.23 ± 0.02 a | 4.39 ± 0.38 a | 0.91 ± 0.03 a | |
| CHT | 4.02 ± 0.72 a | 0.15 ± 0.21 | 0.63 ± 0.09 | 0.23 ± 0.02 a | 4.17 ± 0.87 a | 0.86 ± 0.11 a | |
| CHT-NPs | 4.22 ± 0.51 a | 0.04 ± 0.01 | 0.55 ± 0.12 | 0.30 ± 0.03 b | 4.26 ± 0.52 a | 0.85 ± 0.14 a | |
| CHT-NPs-NAC | 5.50 ± 0.21 b | 0.03 ± 0.01 | 0.78 ± 0.02 | 0.32 ± 0.01 b | 5.53 ± 0.21 b | 1.10 ± 0.01 b | |
| p | * | ns | ns | ** | * | * | |
| 2018 | Bran | ||||||
| Ctrl | 7.53 ± 0.46 a | 0.30 ± 0.02 ab | 0.42 ± 0.03 | 0.32 ± 0.03 b | 7.83 ± 0.44 a | 0.74 ± 0.01 b | |
| CHT | 8.26 ± 0.17 b | 0.36 ± 0.03 bc | 0.50 ± 0.04 | 0.30 ± 0.04 b | 8.62 ± 0.18 b | 0.81 ± 0.08 c | |
| CHT-NPs | 9.31 ± 0.48 c | 0.36 ± 0.01 c | 0.48 ± 0.05 | 0.33 ± 0.02 b | 9.67 ± 0.48 c | 0.82 ± 0.07 c | |
| CHT-NPs-NAC | 8.20 ± 0.31 ab | 0.25 ± 0.04 a | 0.37 ± 0.01 | 0.16 ± 0.02 a | 8.45 ± 0.35 ab | 0.52 ± 0.01 a | |
| p | * | ** | * | ** | * | ** | |
| Semolina | |||||||
| Ctrl | 3.50 ± 0.09 a | 0.07 ± 0.01 a | 0.97 ± 0.05 | 0.52 ± 0.08 b | 3.57 ± 0.09 a | 1.49 ± 0.11 b | |
| CHT | 4.76 ± 0.05 b | 0.07 ± 0.01 ab | 1.16 ± 0.08 | 0.49 ± 0.01 b | 4.83 ± 0.06 b | 1.66 ± 0.09 c | |
| CHT-NPs | 4.29 ± 0.11 b | 0.11 ± 0.01 b | 0.95 ± 0.05 | 0.68 ± 0.08 c | 4.40 ± 0.11 b | 1.64 ± 0.05 c | |
| CHT-NPs-NAC | 3.50 ± 0.01 a | 0.06 ± 0.02 a | 0.88 ± 0.03 | 0.24 ± 0.10 a | 3.56 ± 0.03 a | 1.12 ± 0.08 a | |
| p | ** | * | ** | * | ** | * | |
| Total Starch | Damaged Starch | Beginning of Gelatinization | Maximum Viscosity | End of Final Holding Period | Breakdown | Setback | ||
|---|---|---|---|---|---|---|---|---|
| 2017 | ||||||||
| Ctrl | 71.34 ± 3.18 | 11.00 ± 0.52 | 64.87 ± 0.23 | 235.67 ± 8.08 | 650.33 ± 23.29 | 35.00 ± 1.73 | 461.00 ± 22.52 | |
| CHT | 71.71 ± 2.69 | 11.36 ± 0.08 | 65.50 ± 0.46 | 232.00 ± 15.87 | 641.00 ± 47.03 | 37.67 ± 2.08 | 458.67 ± 28.31 | |
| CHT-NPs | 72.22 ± 4.38 | 11.01 ± 0.67 | 65.00 ± 0.52 | 237.33 ± 10.41 | 668.67 ± 38.48 | 35.67 ± 1.53 | 476.67 ± 29.94 | |
| CHT-NPs-NAC | 72.76 ± 2.81 | 11.43 ± 0.42 | 65.17 ± 0.40 | 227.33 ± 6.66 | 643.33 ± 19.35 | 33.67 ± 2.52 | 457.33 ± 14.57 | |
| p | ns | ns | ns | ns | ns | ns | ns | |
| 2018 | ||||||||
| Ctrl | 67.78 ± 1.77 | 7.18 ± 0.50 | 65.46 ± 1.08 ab | 183.88 ± 11.86 | 414.38 ± 25.60 | 48.86 ± 2.04 | 285.75 ± 17.98 | |
| CHT | 67.16 ± 2.21 | 7.33 ± 0.40 | 66.19 ± 0.72 ab | 176.63 ± 8.94 | 405.50 ± 13.26 | 44.50 ± 4.21 | 277.88 ± 12.16 | |
| CHT-NPs | 66.99 ± 1.21 | 7.54 ± 0.51 | 66.58 ± 1.51 b | 169.63 ± 12.37 | 378.13 ± 31.42 | 46.63 ± 3.81 | 259.63 ± 22.92 | |
| CHT-NPs-NAC | 66.98 ± 0.79 | 7.34 ± 0.24 | 64.53 ± 1.34 a | 178.00 ± 20.33 | 401.25 ± 57.81 | 45.88 ± 5.22 | 273.25 ± 42.46 | |
| p | ns | ns | * | ns | ns | ns | ns | |
| Thiols | Total Proteins | Peak Maximum Time | Maximum Torque | ||
|---|---|---|---|---|---|
| 2017 | |||||
| Ctrl | 25.14 ± 3.76 | 13.69 ± 0.68 | 40.57 ± 2.37 | 50.91 ± 3.07 | |
| CHT | 23.05 ± 0.92 | 13.77 ± 0.38 | 38.17 ± 2.14 | 51.80 ± 3.51 | |
| CHT-NPs | 22.89 ± 2.88 | 13.33 ± 0.77 | 44.50 ± 3.73 | 48.67 ± 3.07 | |
| CHT-NPs-NAC | 20.72 ± 2.46 | 13.97 ± 0.23 | 37.17 ± 1.72 | 54.50 ± 1.50 | |
| p | ns | ns | ns | ns | |
| 2018 | |||||
| Ctrl | 18.48 ± 0.88 | 13.77 ± 0.09 | 35.56 ± 2.60 a | 50.80 ± 1.47 a | |
| CHT | 22.81 ± 5.83 | 13.98 ± 0.05 | 33.50 ± 2.22 a | 52.38 ± 1.12 ab | |
| CHT-NPs | 20.66 ± 0.65 | 14.00 ± 0.22 | 34.55 ± 2.62 a | 53.13 ± 2.38 b | |
| CHT-NPs-NAC | 19.01 ± 1.51 | 13.92 ± 0.27 | 37.00 ± 2.39 a | 52.90 ± 1.56 b | |
| p | ns | ns | ns | * | |
Publisher’s Note: MDPI stays neutral with regard to jurisdictional claims in published maps and institutional affiliations. |
© 2022 by the authors. Licensee MDPI, Basel, Switzerland. This article is an open access article distributed under the terms and conditions of the Creative Commons Attribution (CC BY) license (https://creativecommons.org/licenses/by/4.0/).
Share and Cite
Picchi, V.; Calzone, A.; Gobbi, S.; Paccani, S.; Lo Scalzo, R.; Marti, A.; Faoro, F. Oxidative Stress Mitigation by Chitosan Nanoparticles in Durum Wheat Also Affects Phytochemicals and Technological Quality of Bran and Semolina. Plants 2022, 11, 2021. https://doi.org/10.3390/plants11152021
Picchi V, Calzone A, Gobbi S, Paccani S, Lo Scalzo R, Marti A, Faoro F. Oxidative Stress Mitigation by Chitosan Nanoparticles in Durum Wheat Also Affects Phytochemicals and Technological Quality of Bran and Semolina. Plants. 2022; 11(15):2021. https://doi.org/10.3390/plants11152021
Chicago/Turabian StylePicchi, Valentina, Antonella Calzone, Serena Gobbi, Sara Paccani, Roberto Lo Scalzo, Alessandra Marti, and Franco Faoro. 2022. "Oxidative Stress Mitigation by Chitosan Nanoparticles in Durum Wheat Also Affects Phytochemicals and Technological Quality of Bran and Semolina" Plants 11, no. 15: 2021. https://doi.org/10.3390/plants11152021
APA StylePicchi, V., Calzone, A., Gobbi, S., Paccani, S., Lo Scalzo, R., Marti, A., & Faoro, F. (2022). Oxidative Stress Mitigation by Chitosan Nanoparticles in Durum Wheat Also Affects Phytochemicals and Technological Quality of Bran and Semolina. Plants, 11(15), 2021. https://doi.org/10.3390/plants11152021