
Phytochemical Investigation and Reproductive Capacity of the Bulgarian Endemic Plant Species Marrubium friwaldskyanum Boiss. (Lamiaceae)

 ,
,  , , ,
, , ,
Abstract
1. Introduction
2. Results
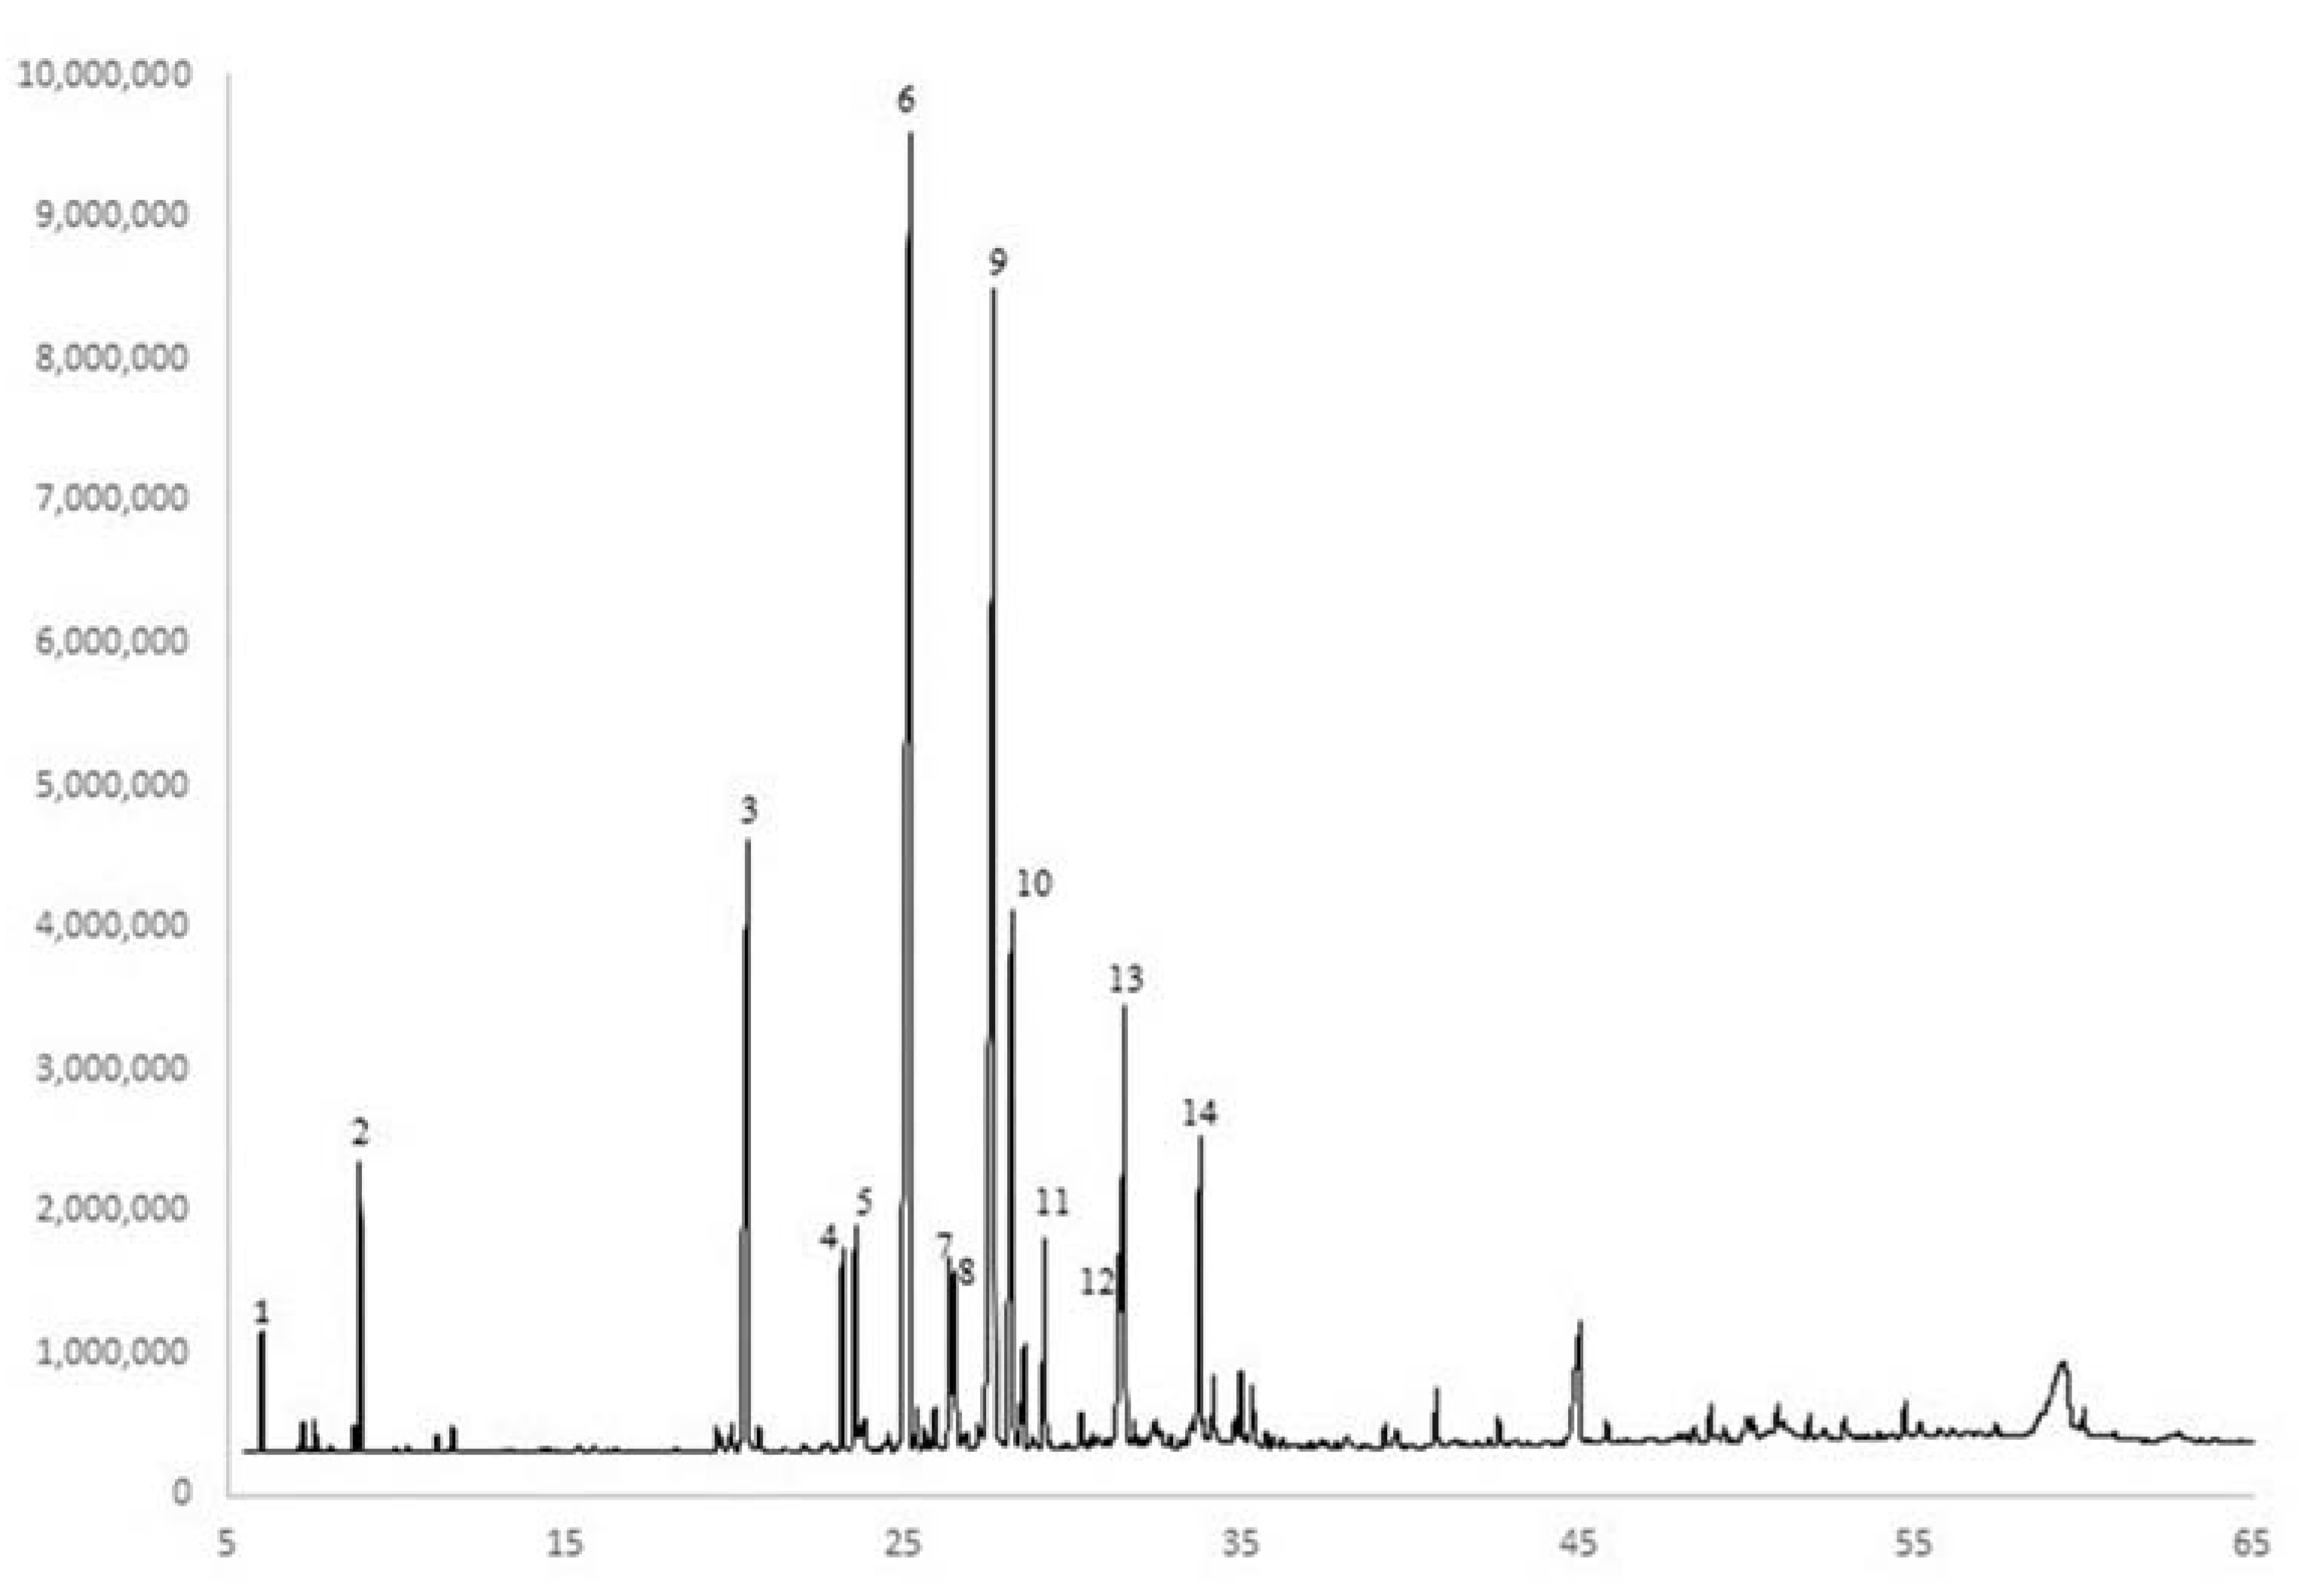
2.1. Essential Oils Analysis
Qualitative Composition of the Essential Oil (EO)
2.2. Phytochemical Determination
2.3. Embryological Research
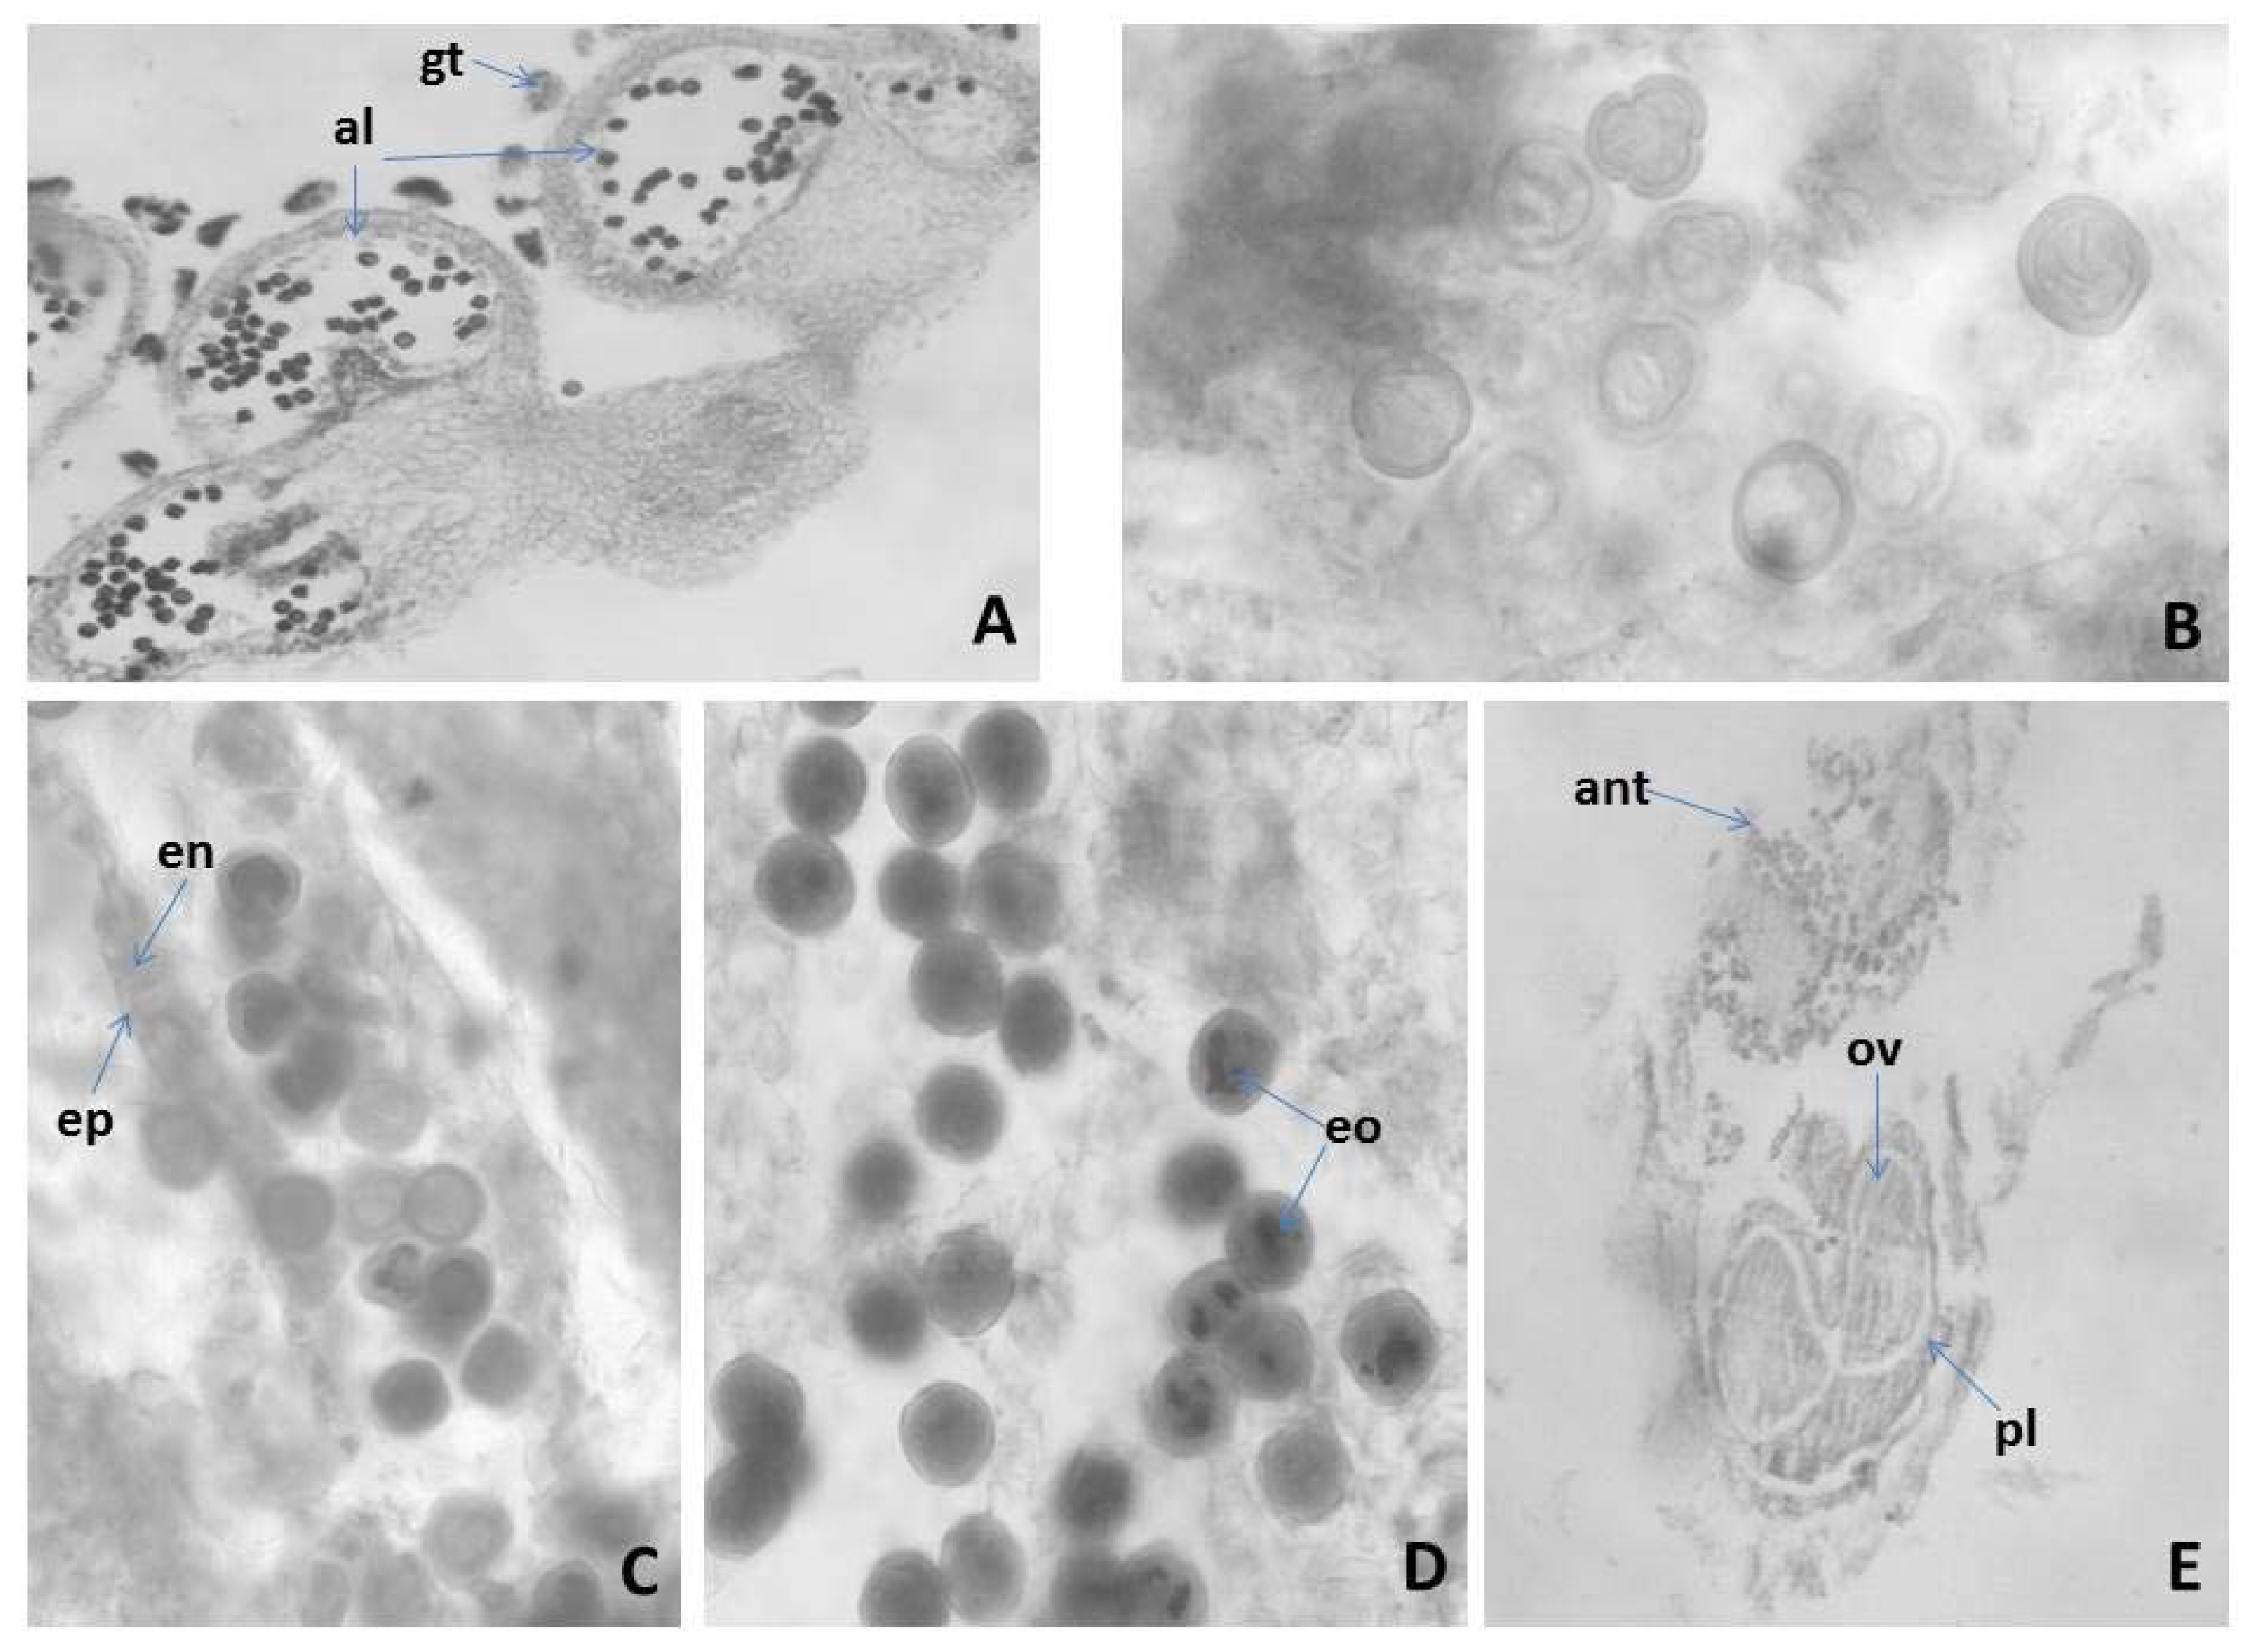
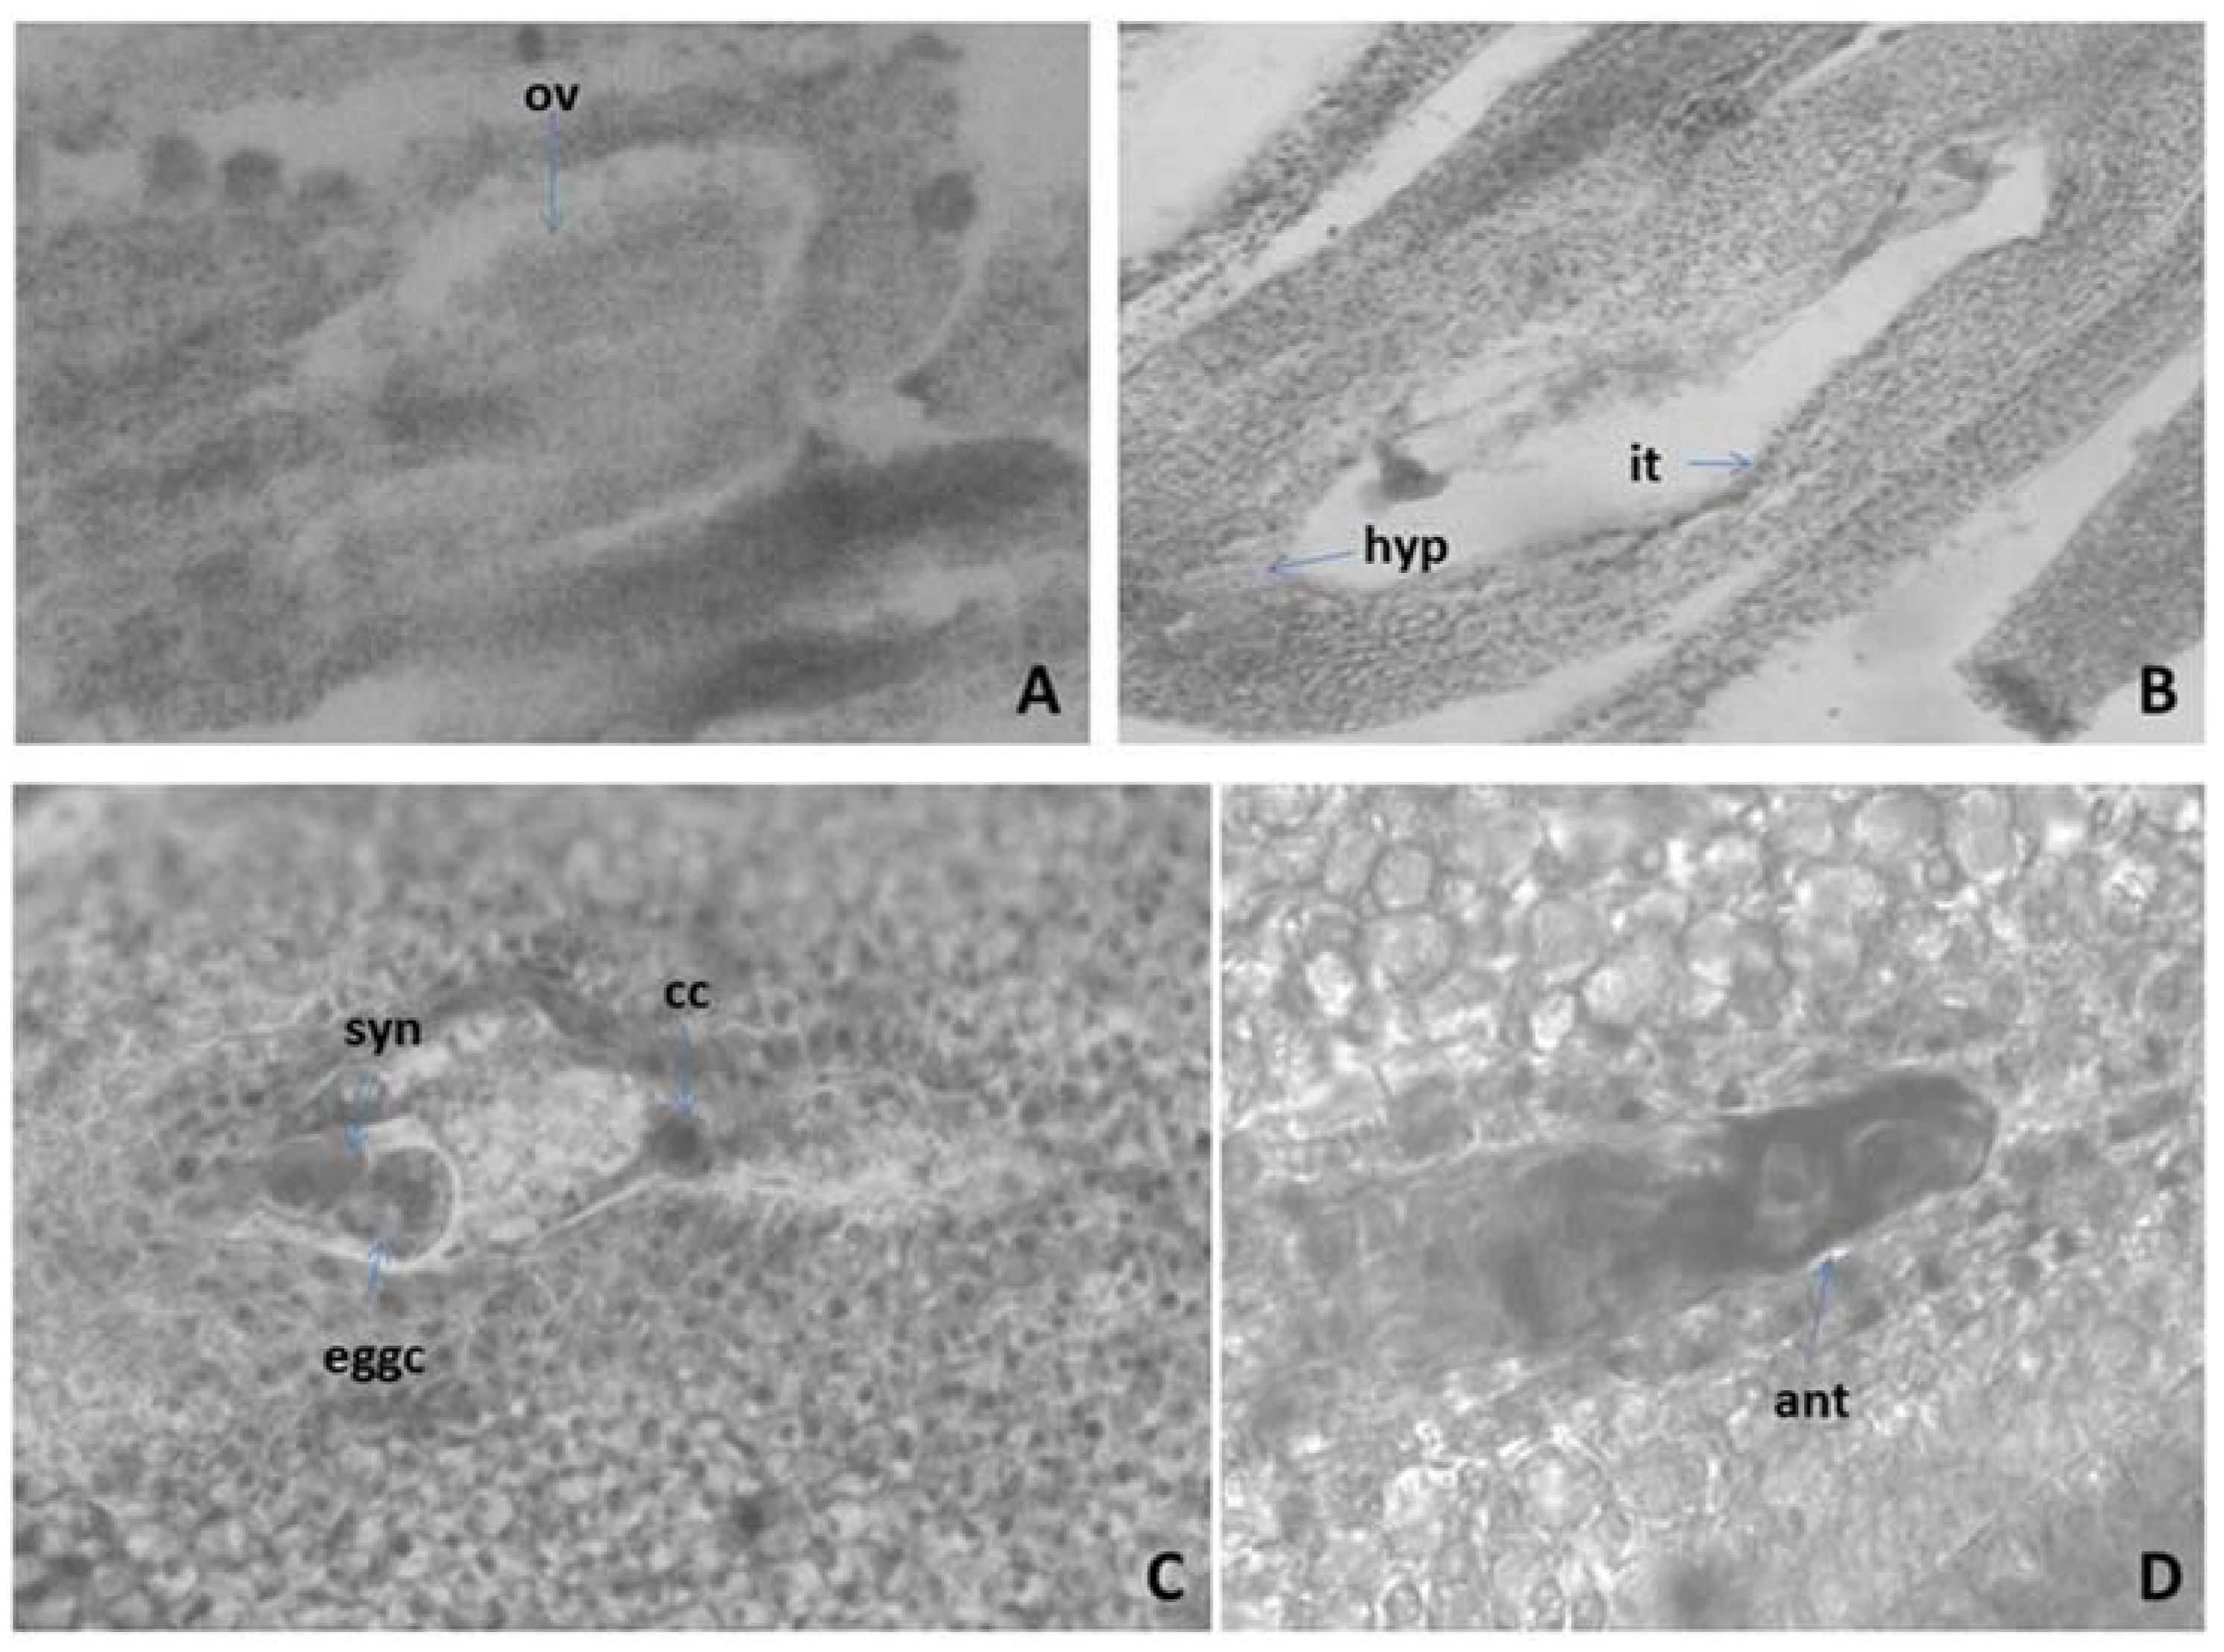
2.3.1. Anther and Development of the Male Gametophyte of M. friwaldskyanum
2.3.2. Ovule and Development of the Female Gametophyte
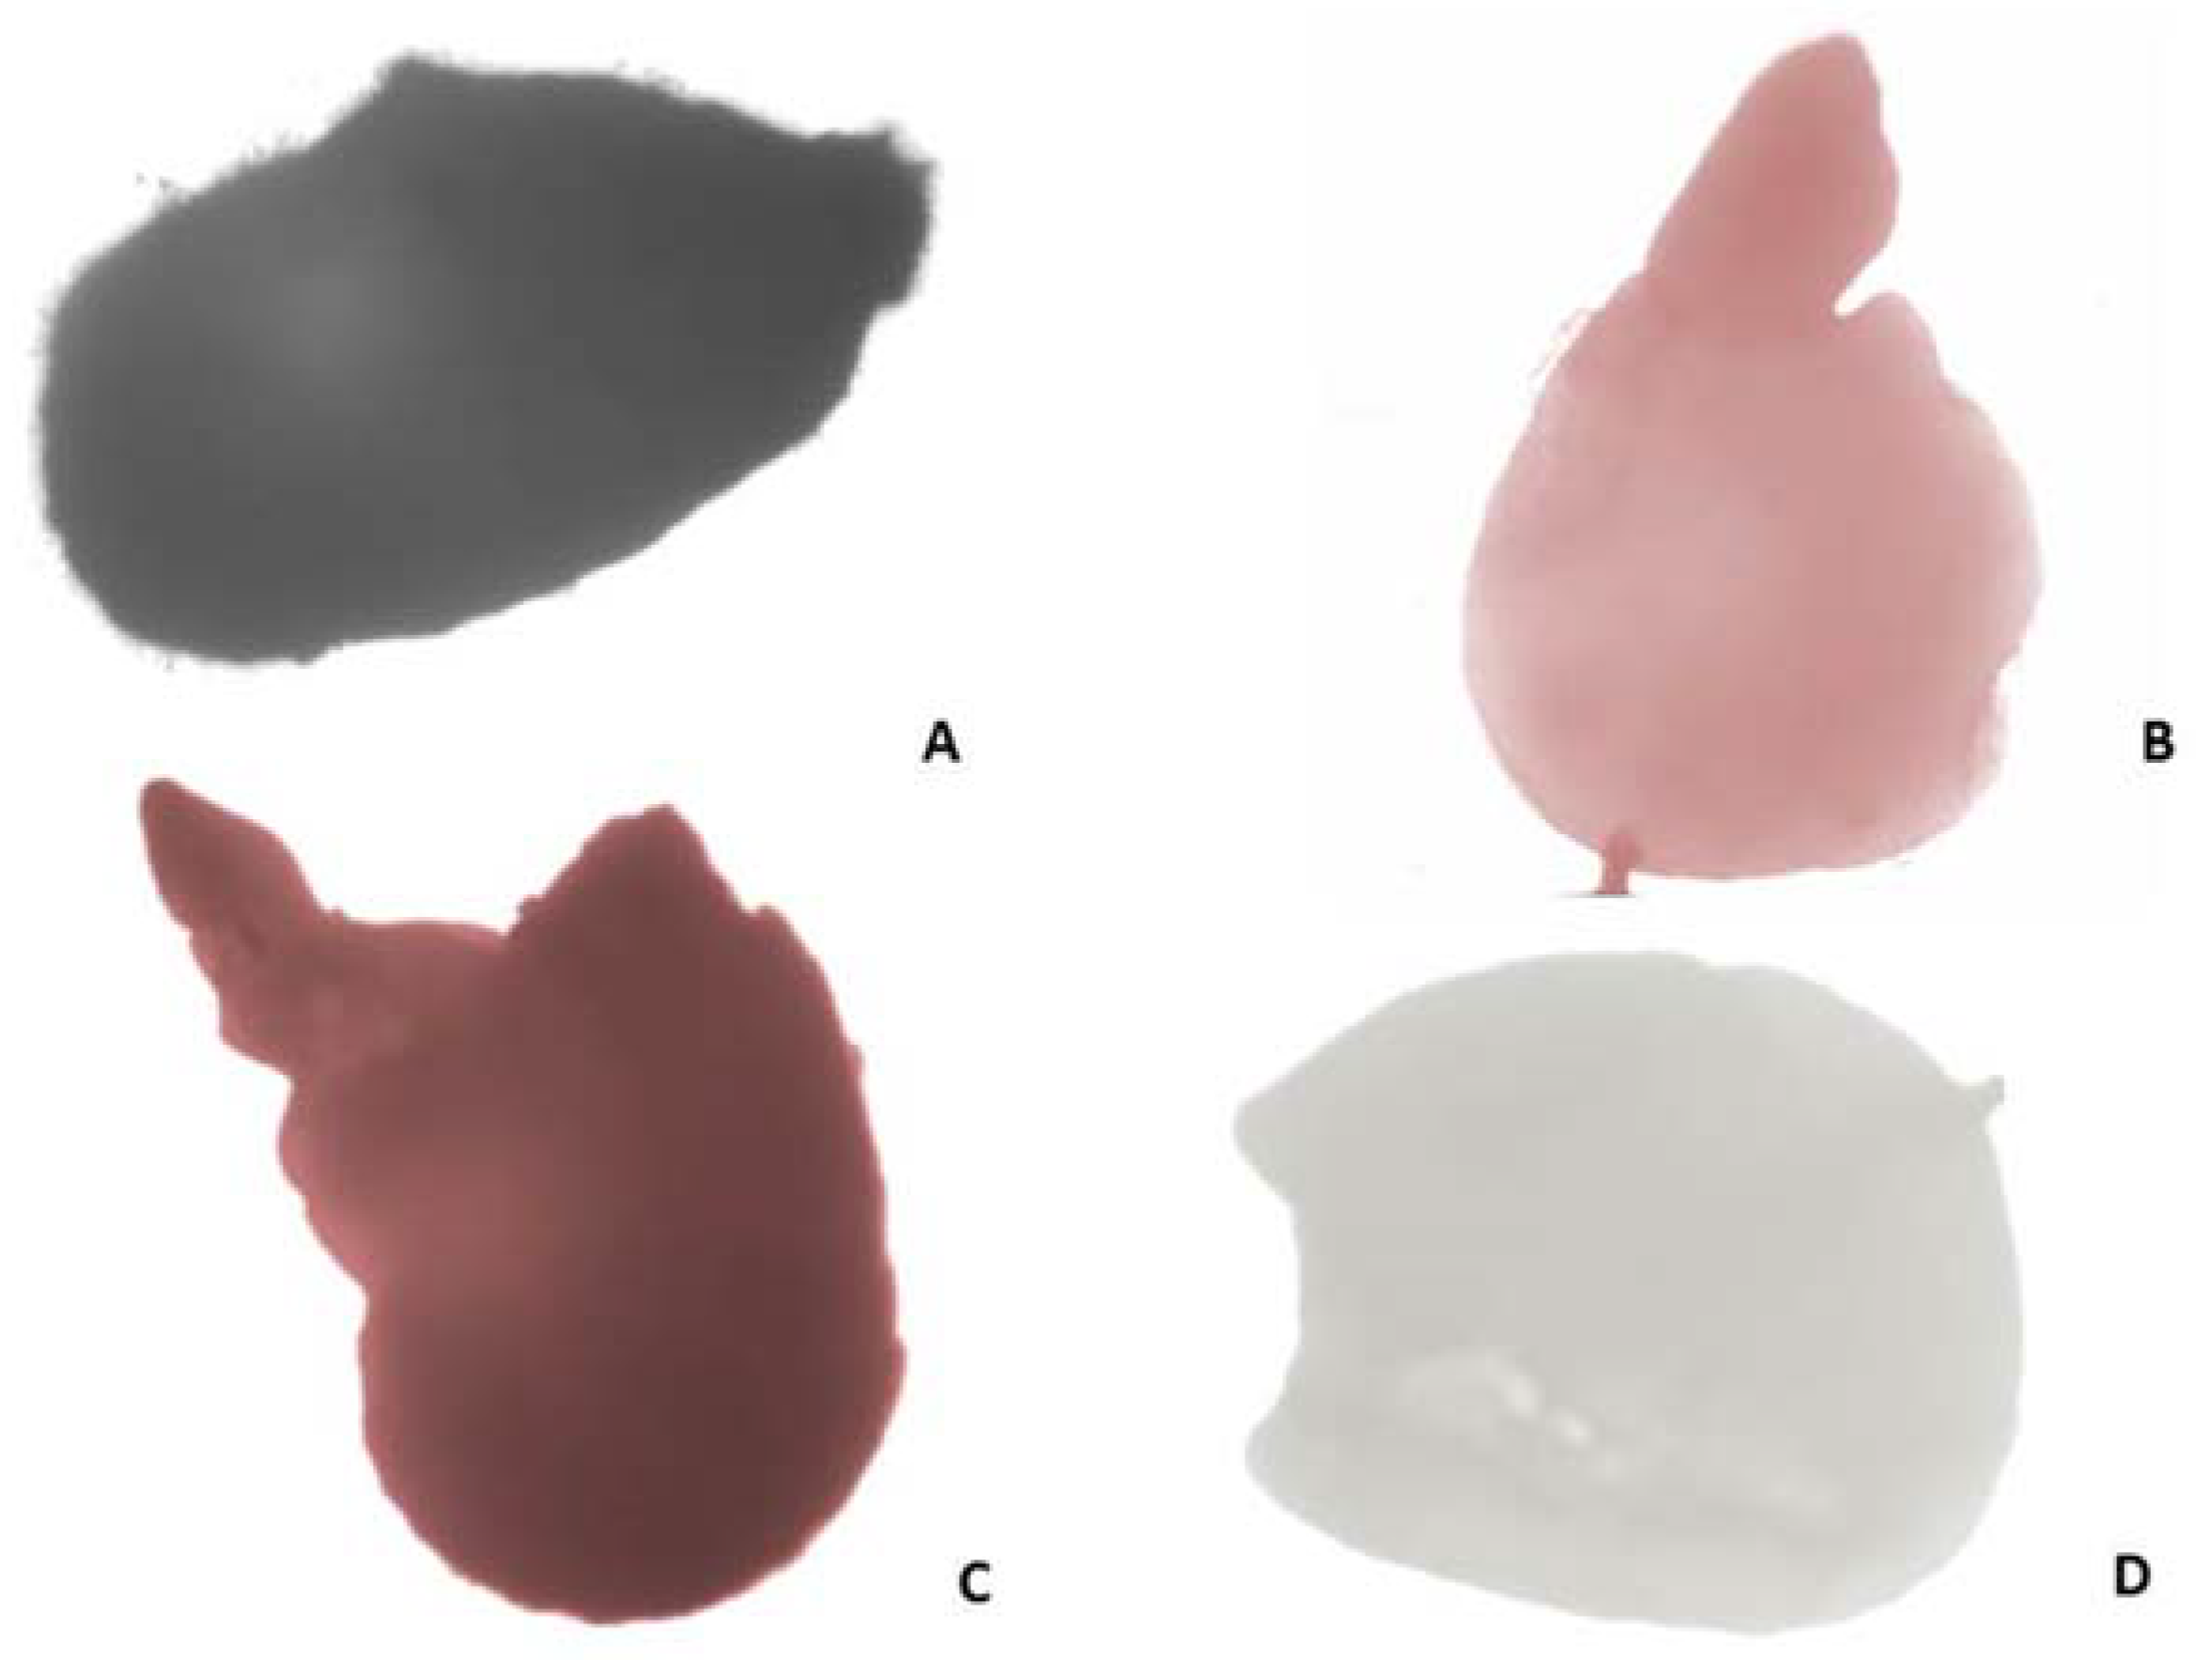
2.3.3. Pollen and Nutlets (Seed) Viability
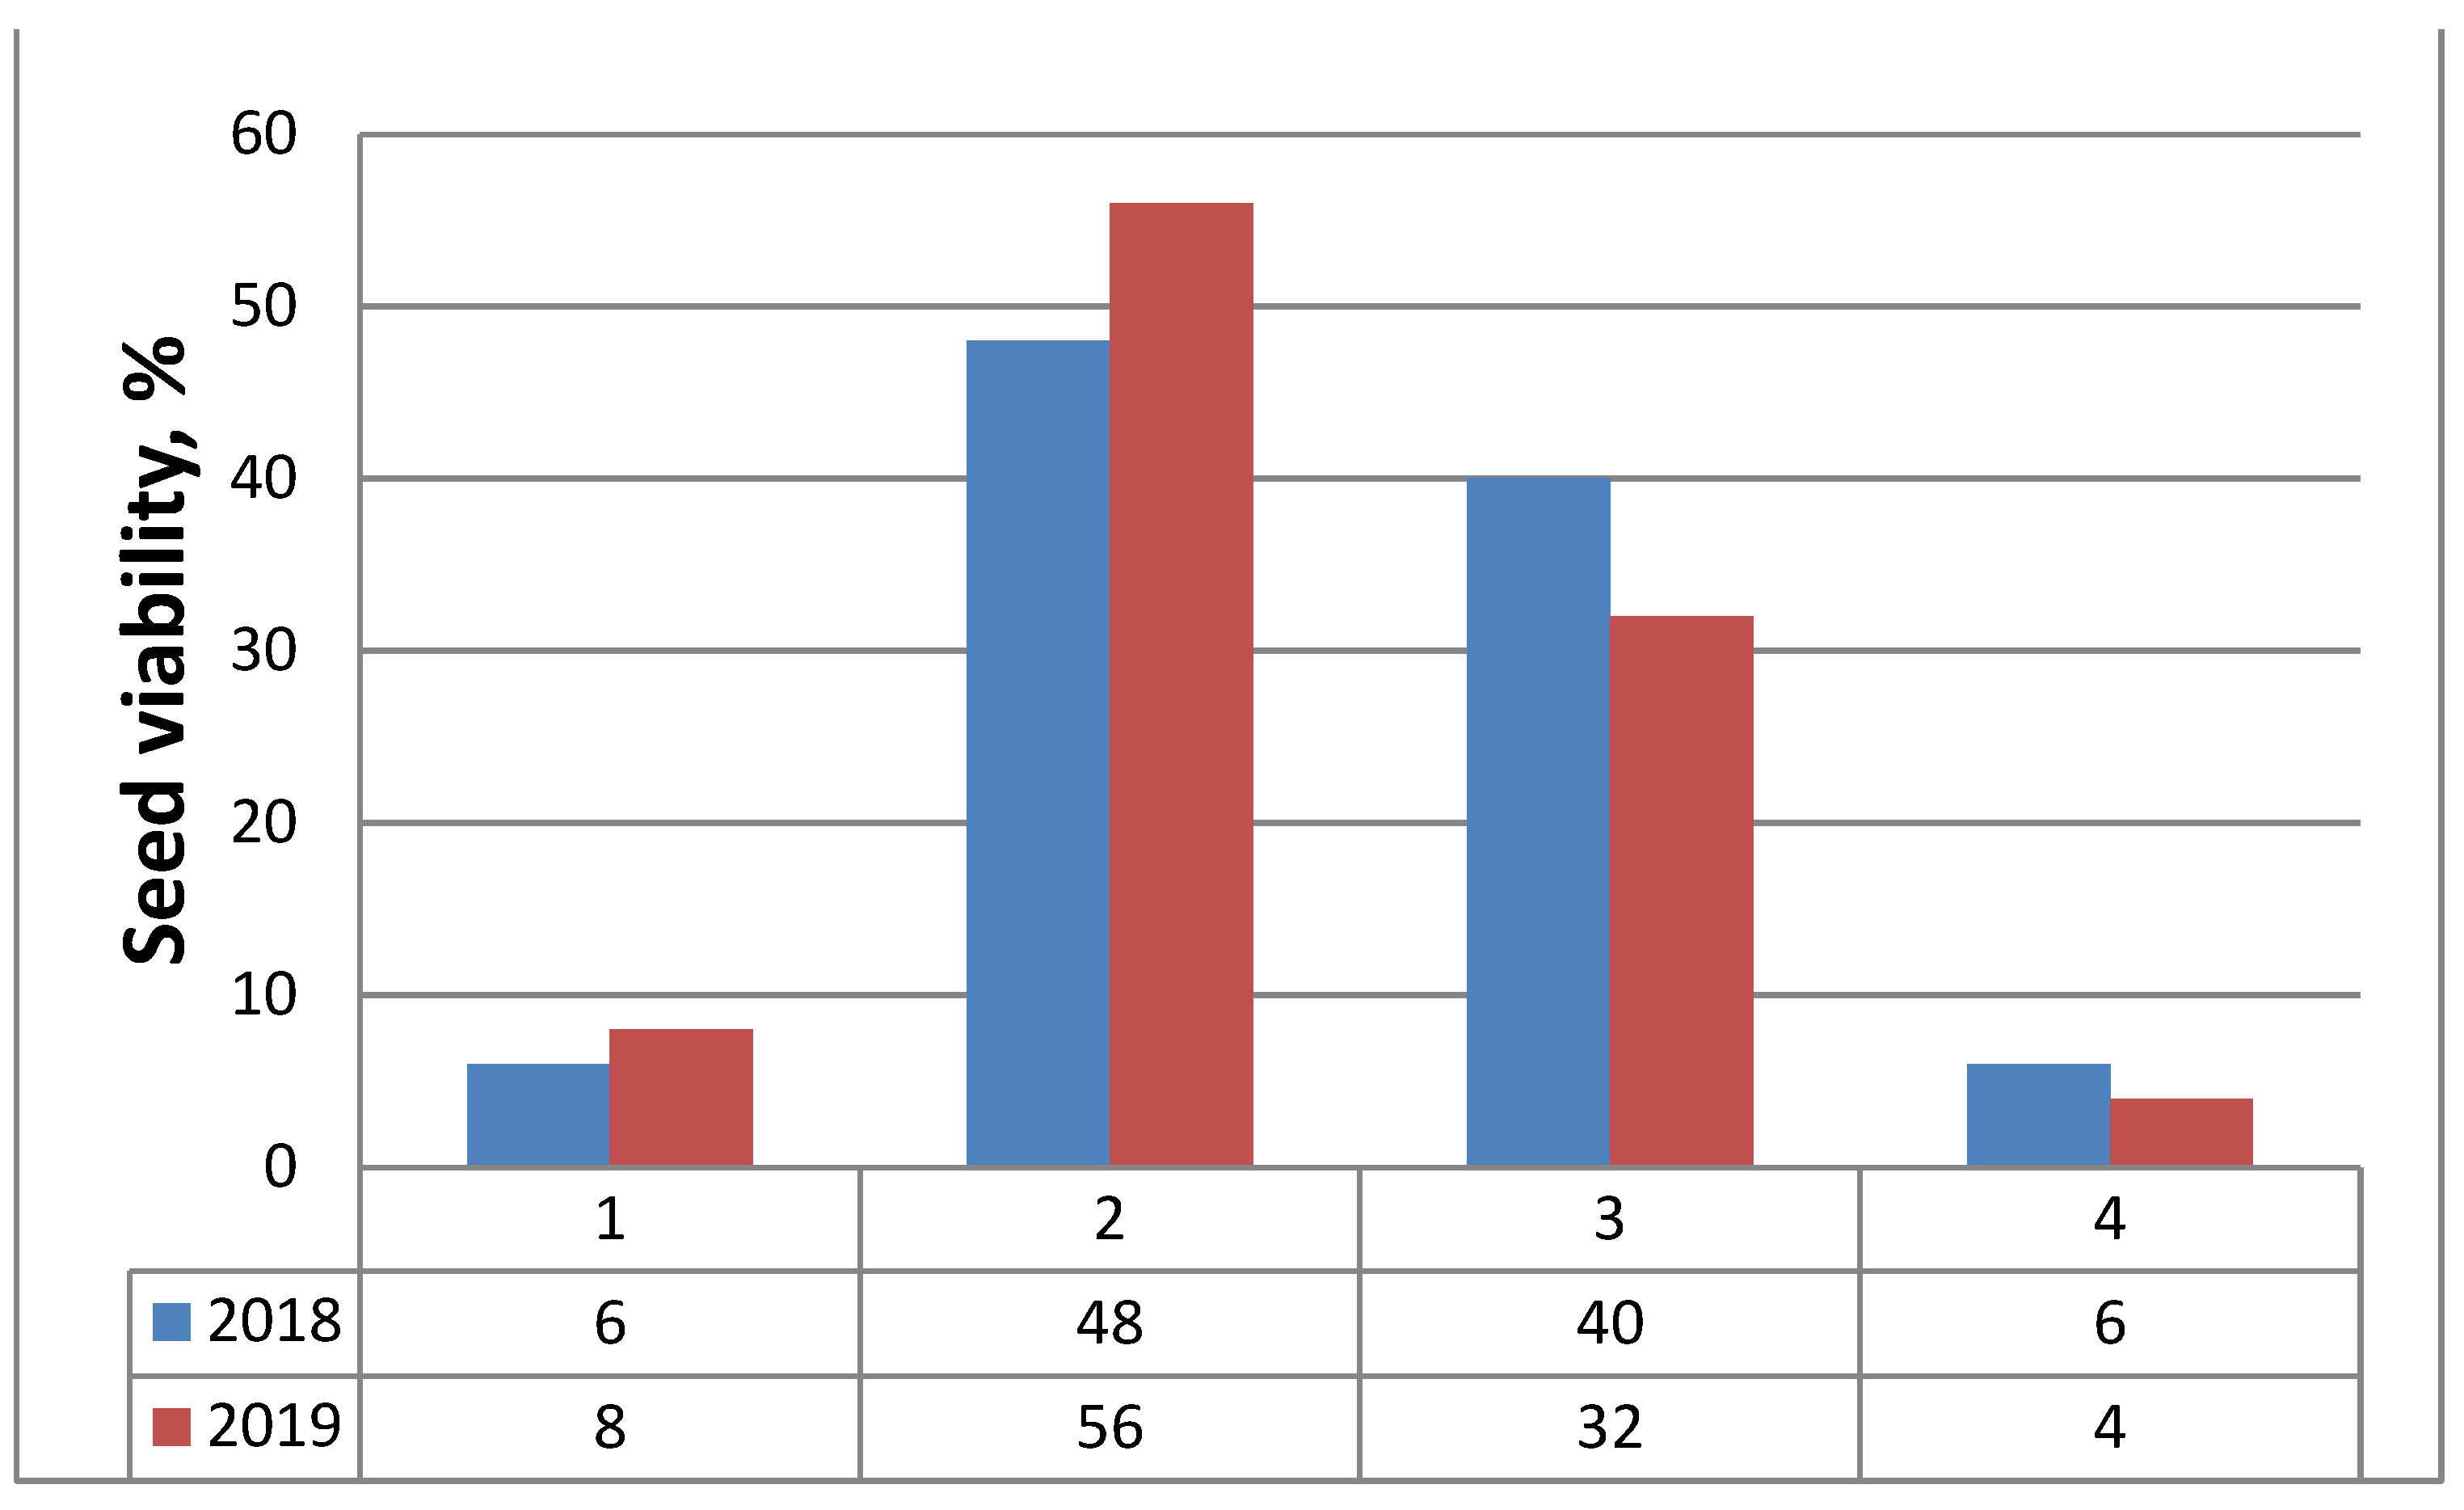
2.4. Seed (Nutlets) Germination
2.5. Morphological Analysis by Scanning Electron Microscopy (SEM)
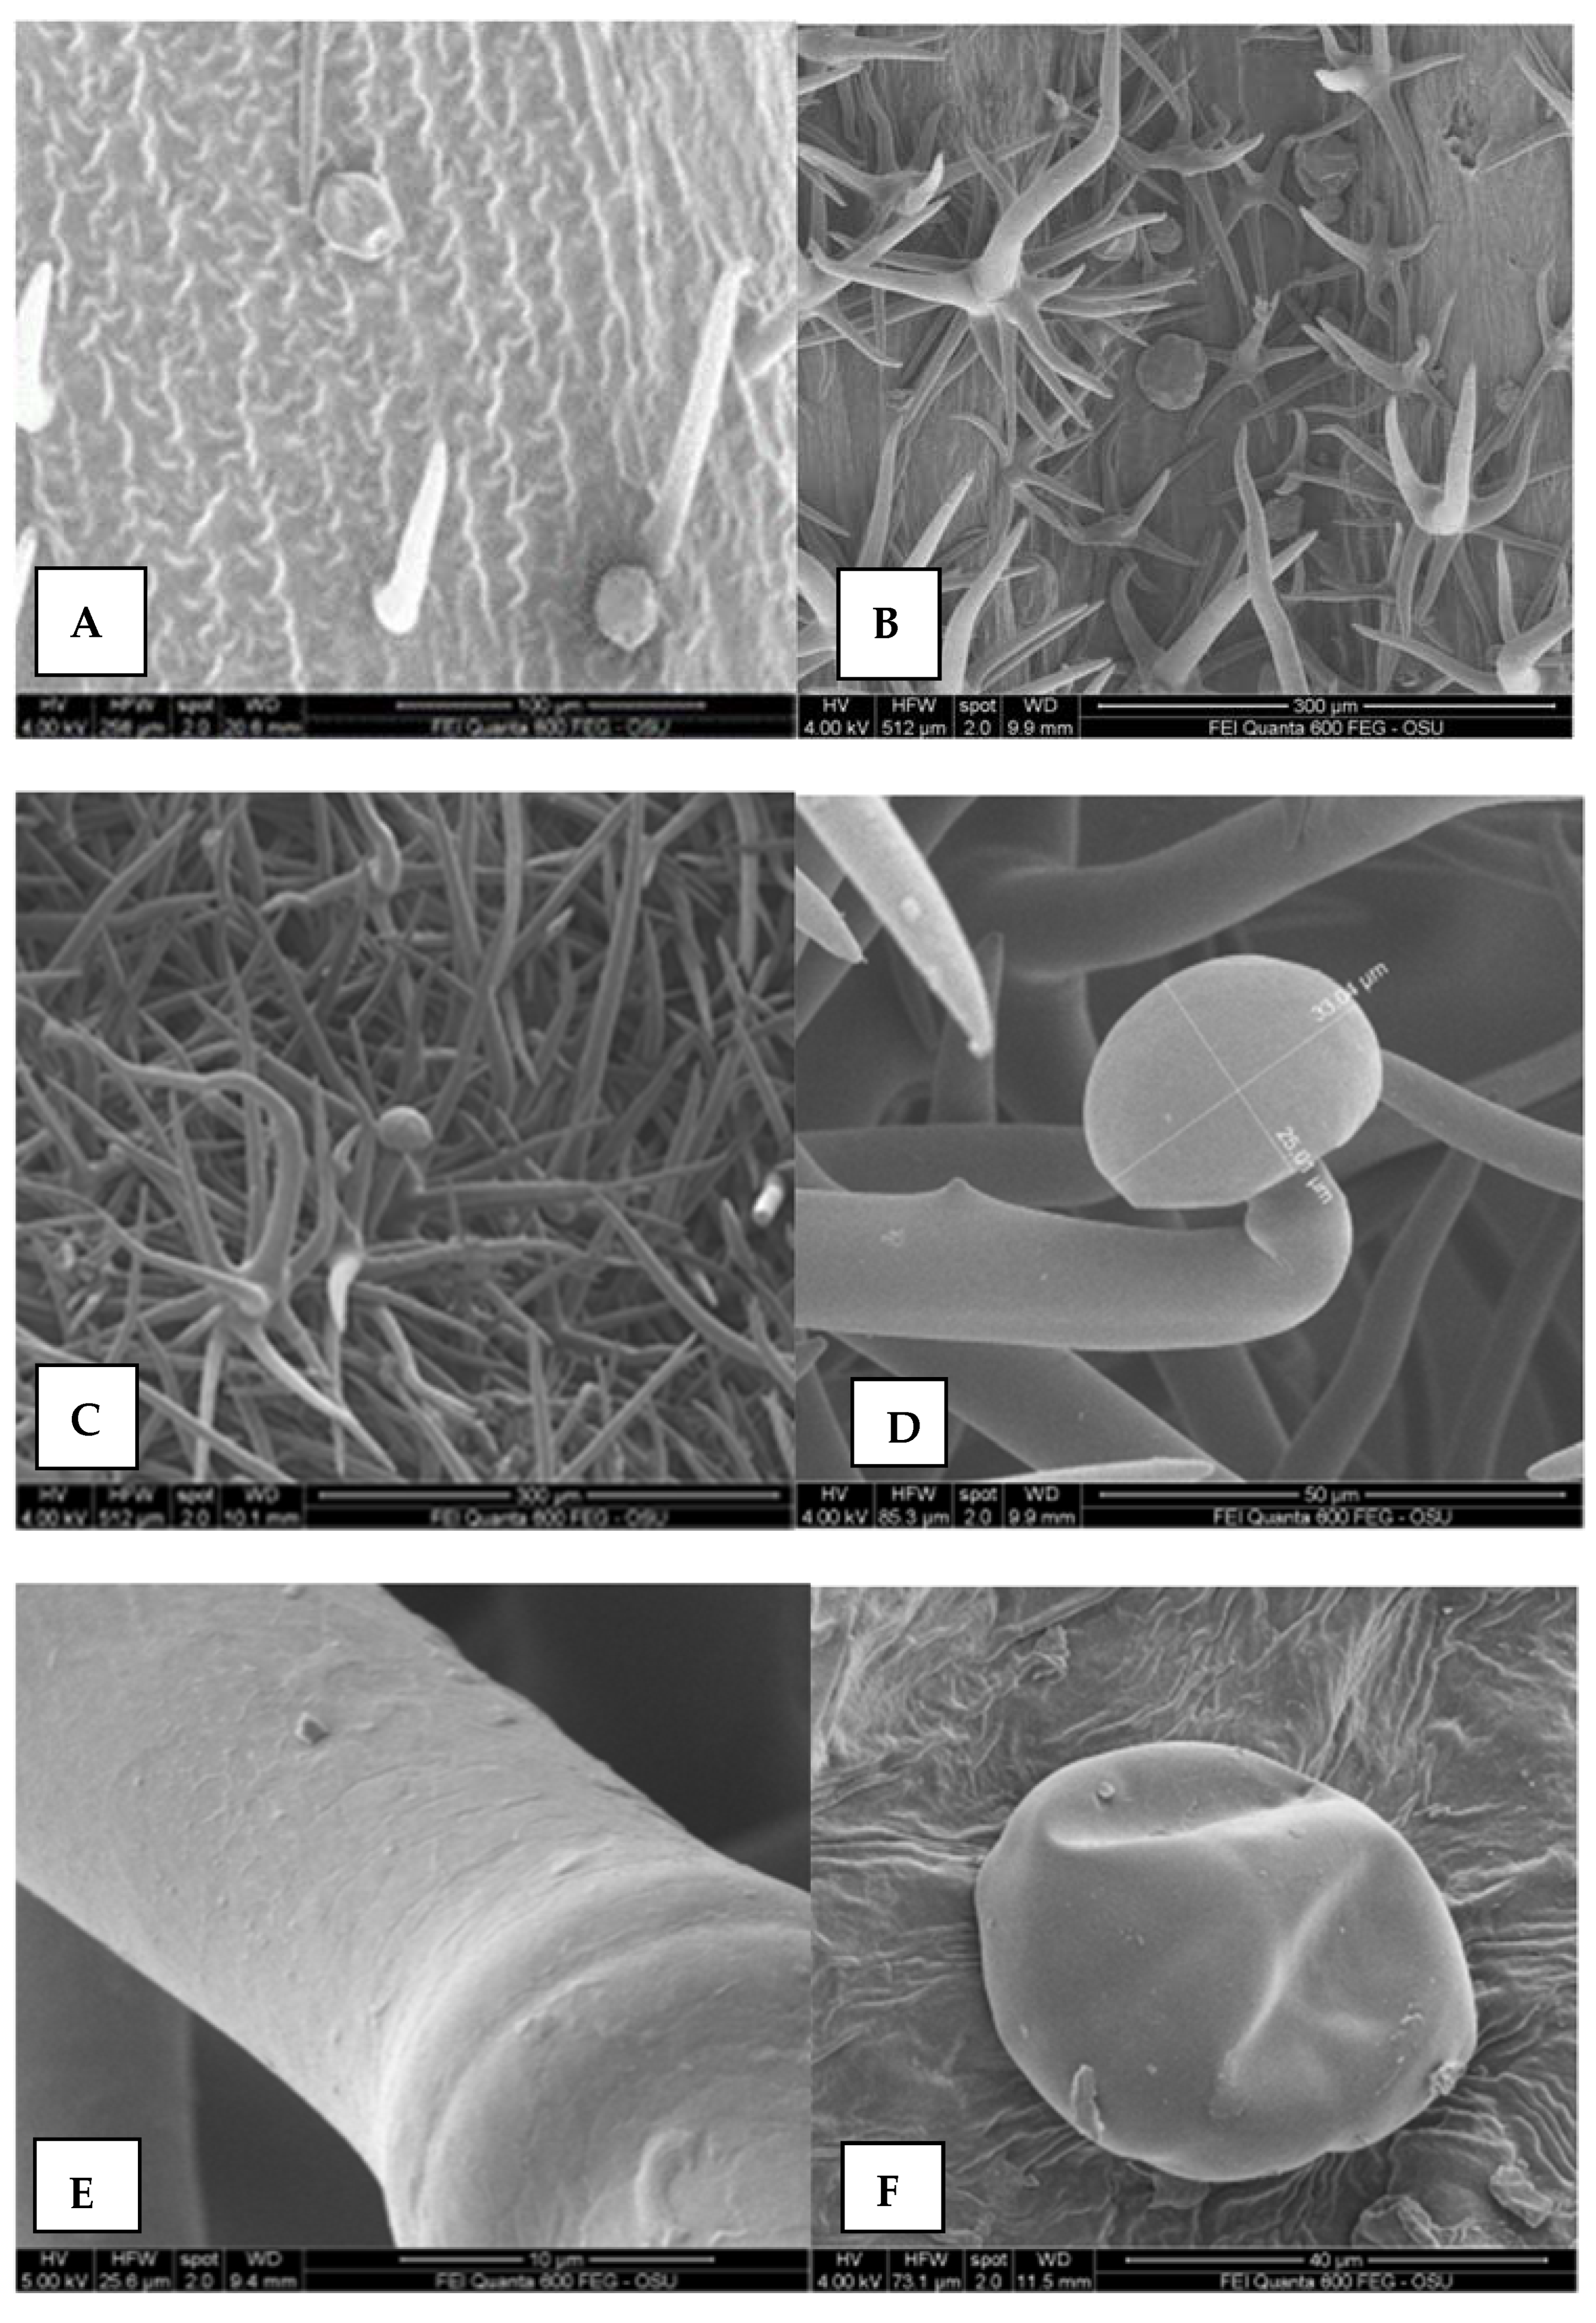
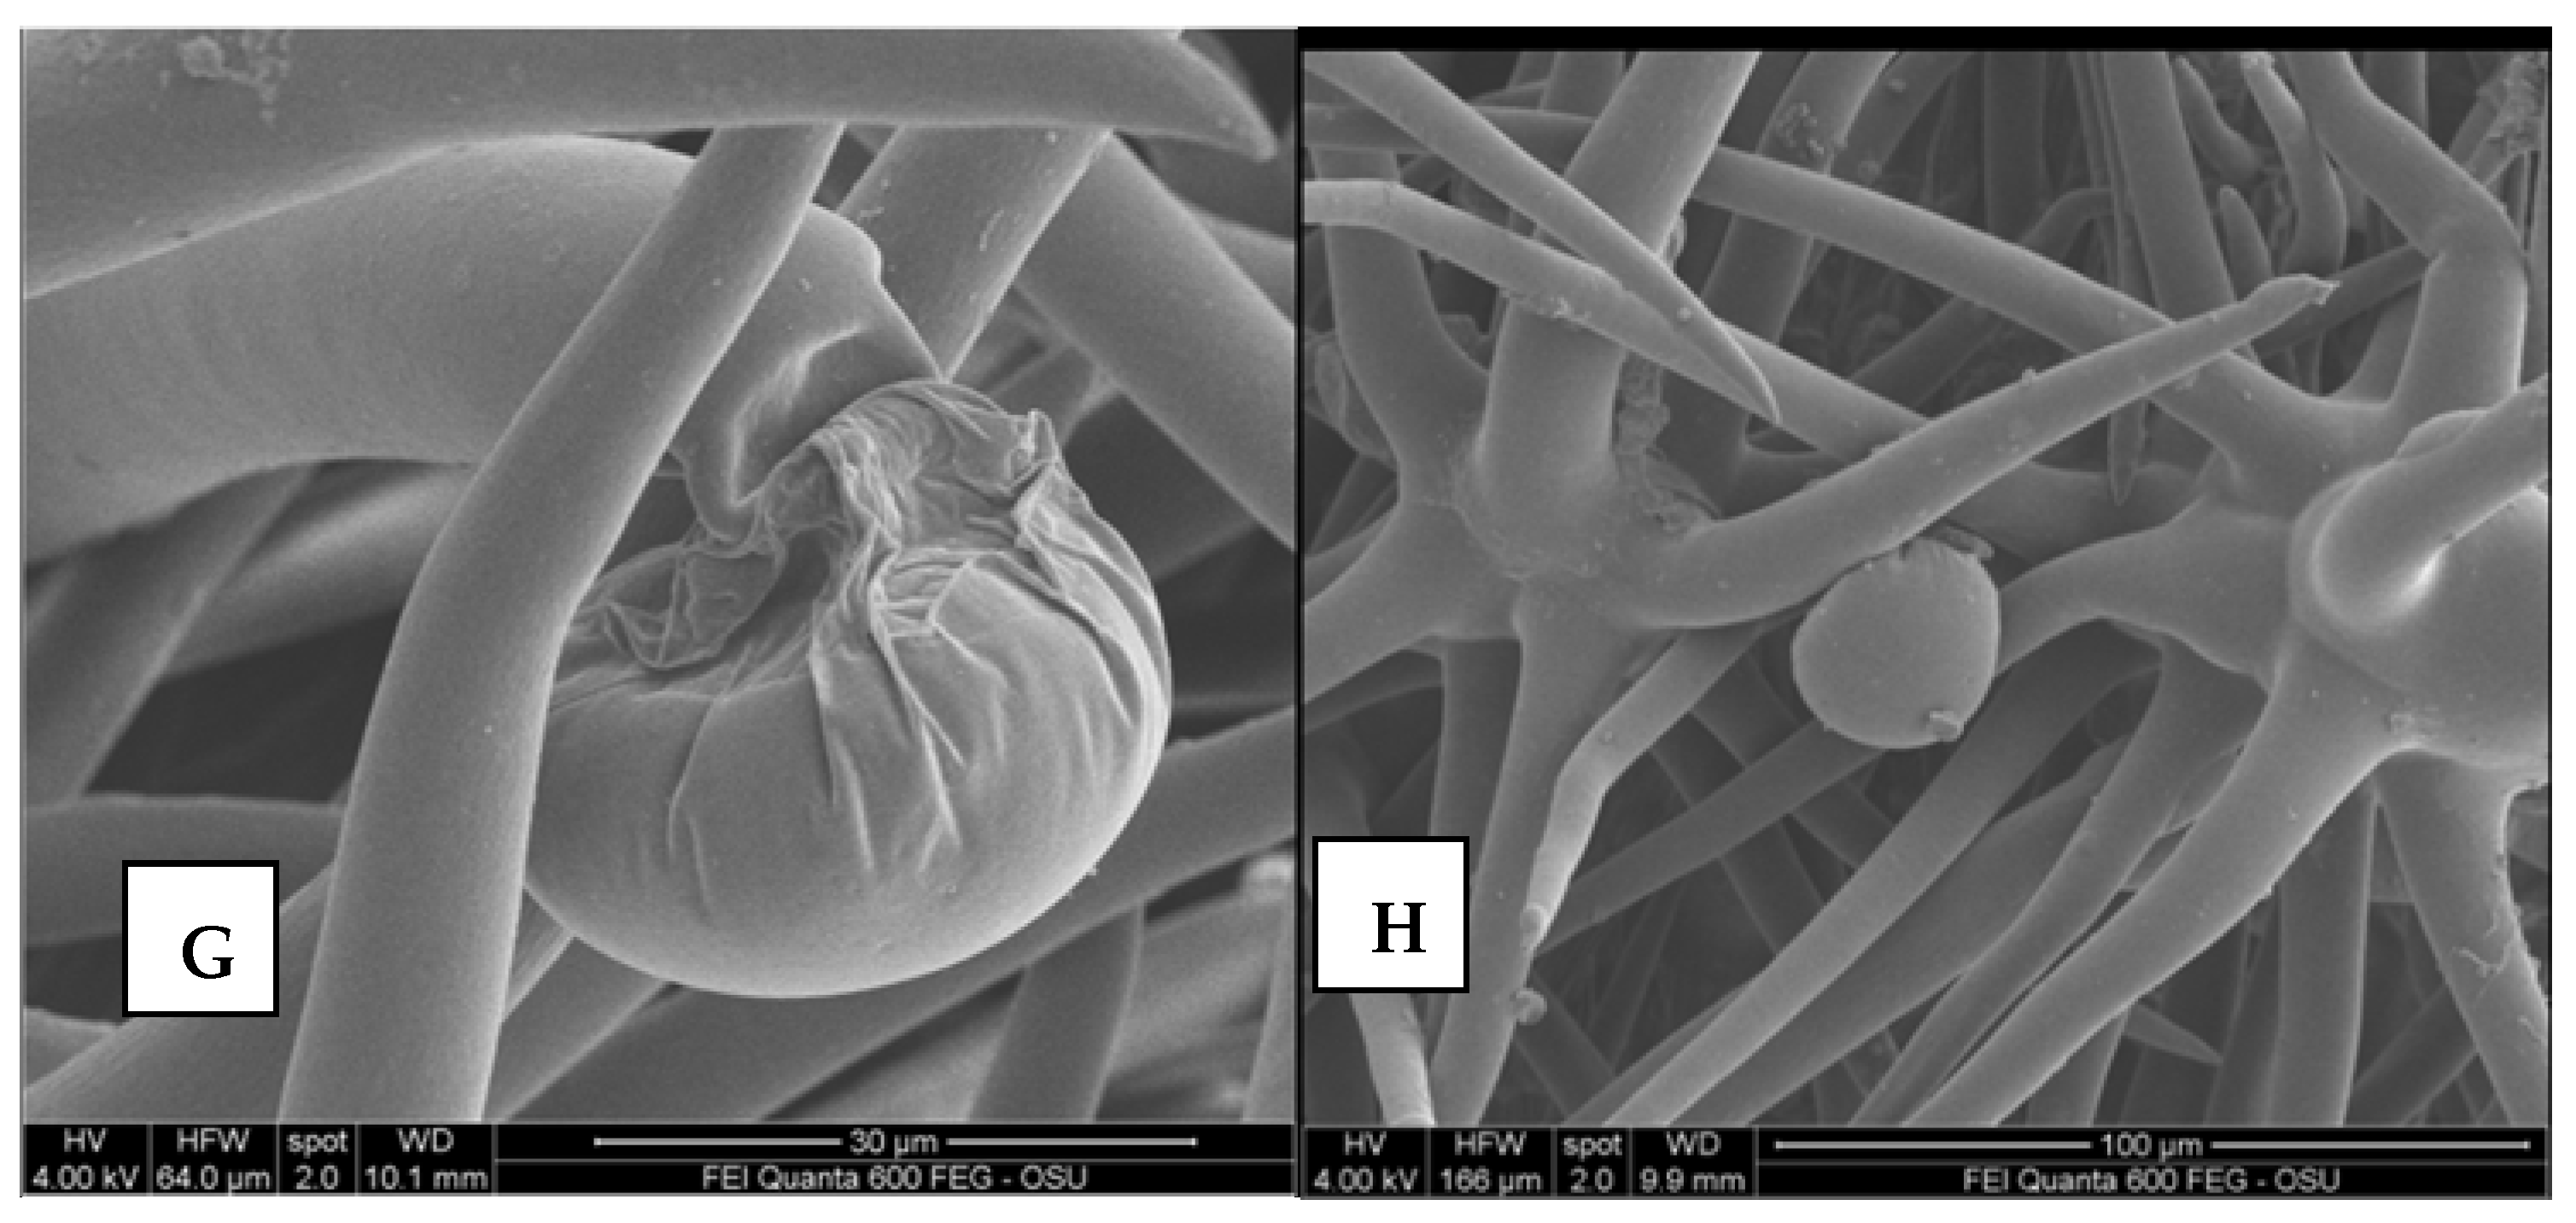
2.5.1. Leaves, Stem, Calyx and Corolla Surfaces
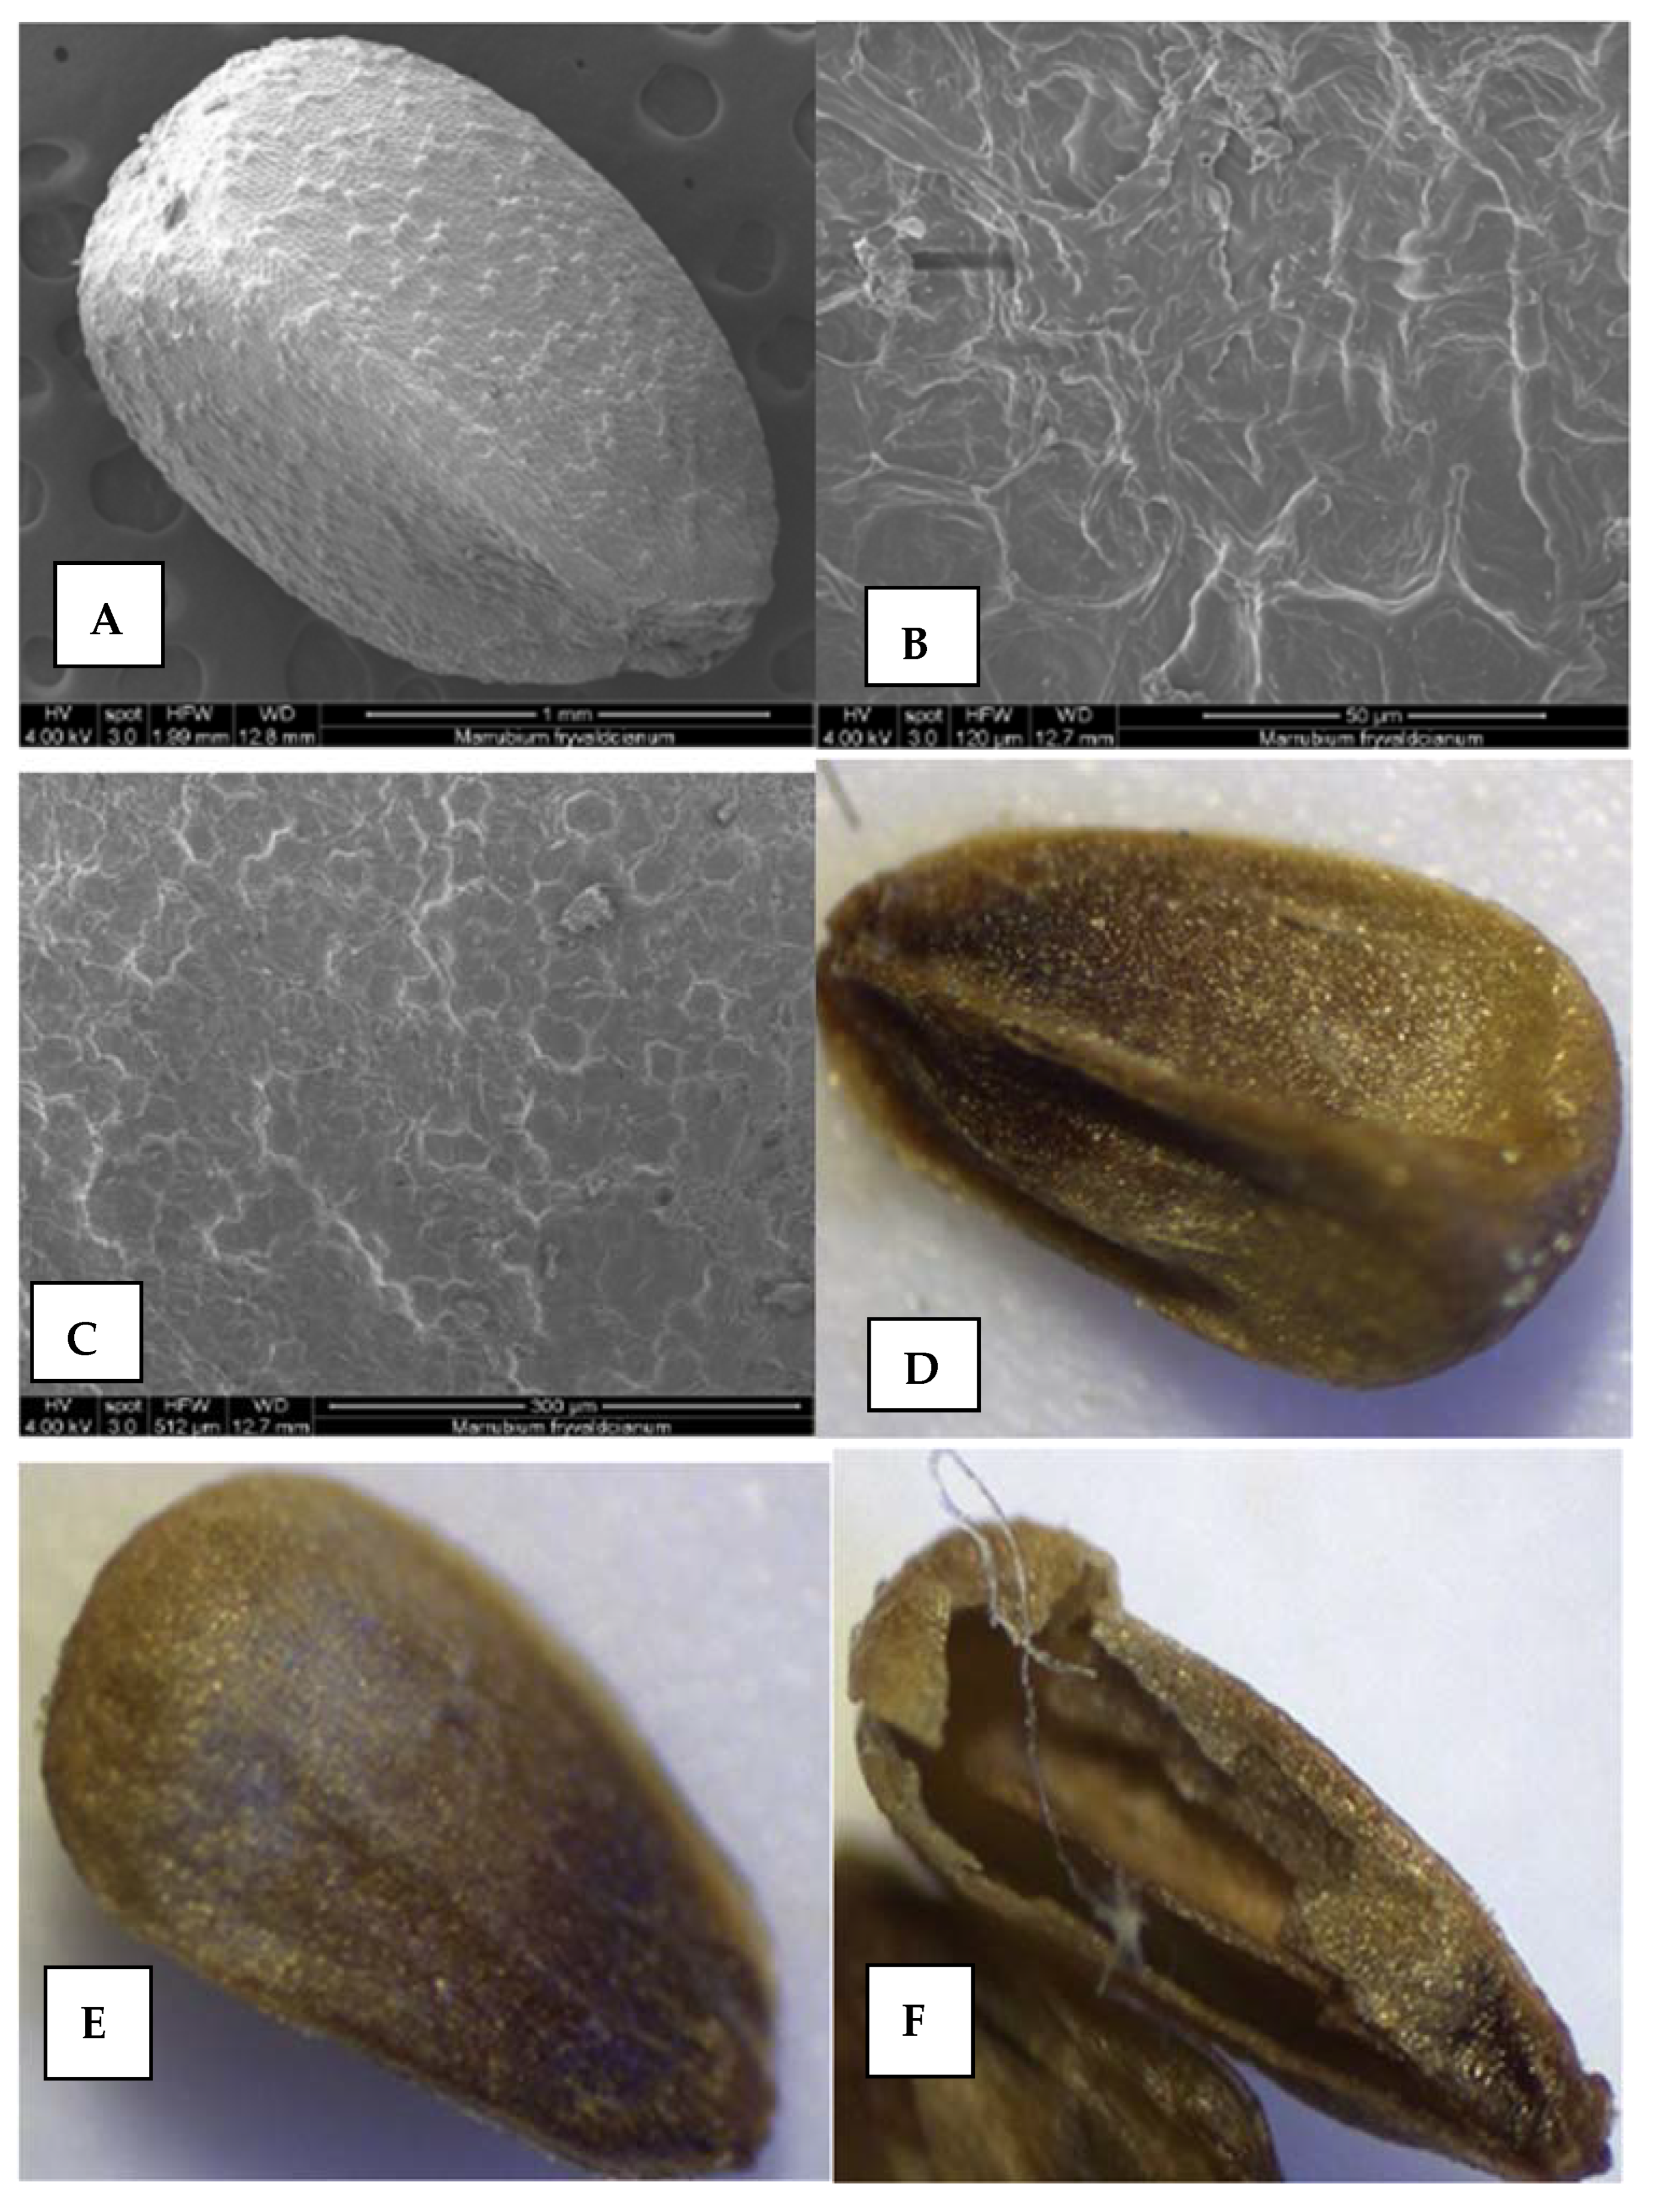
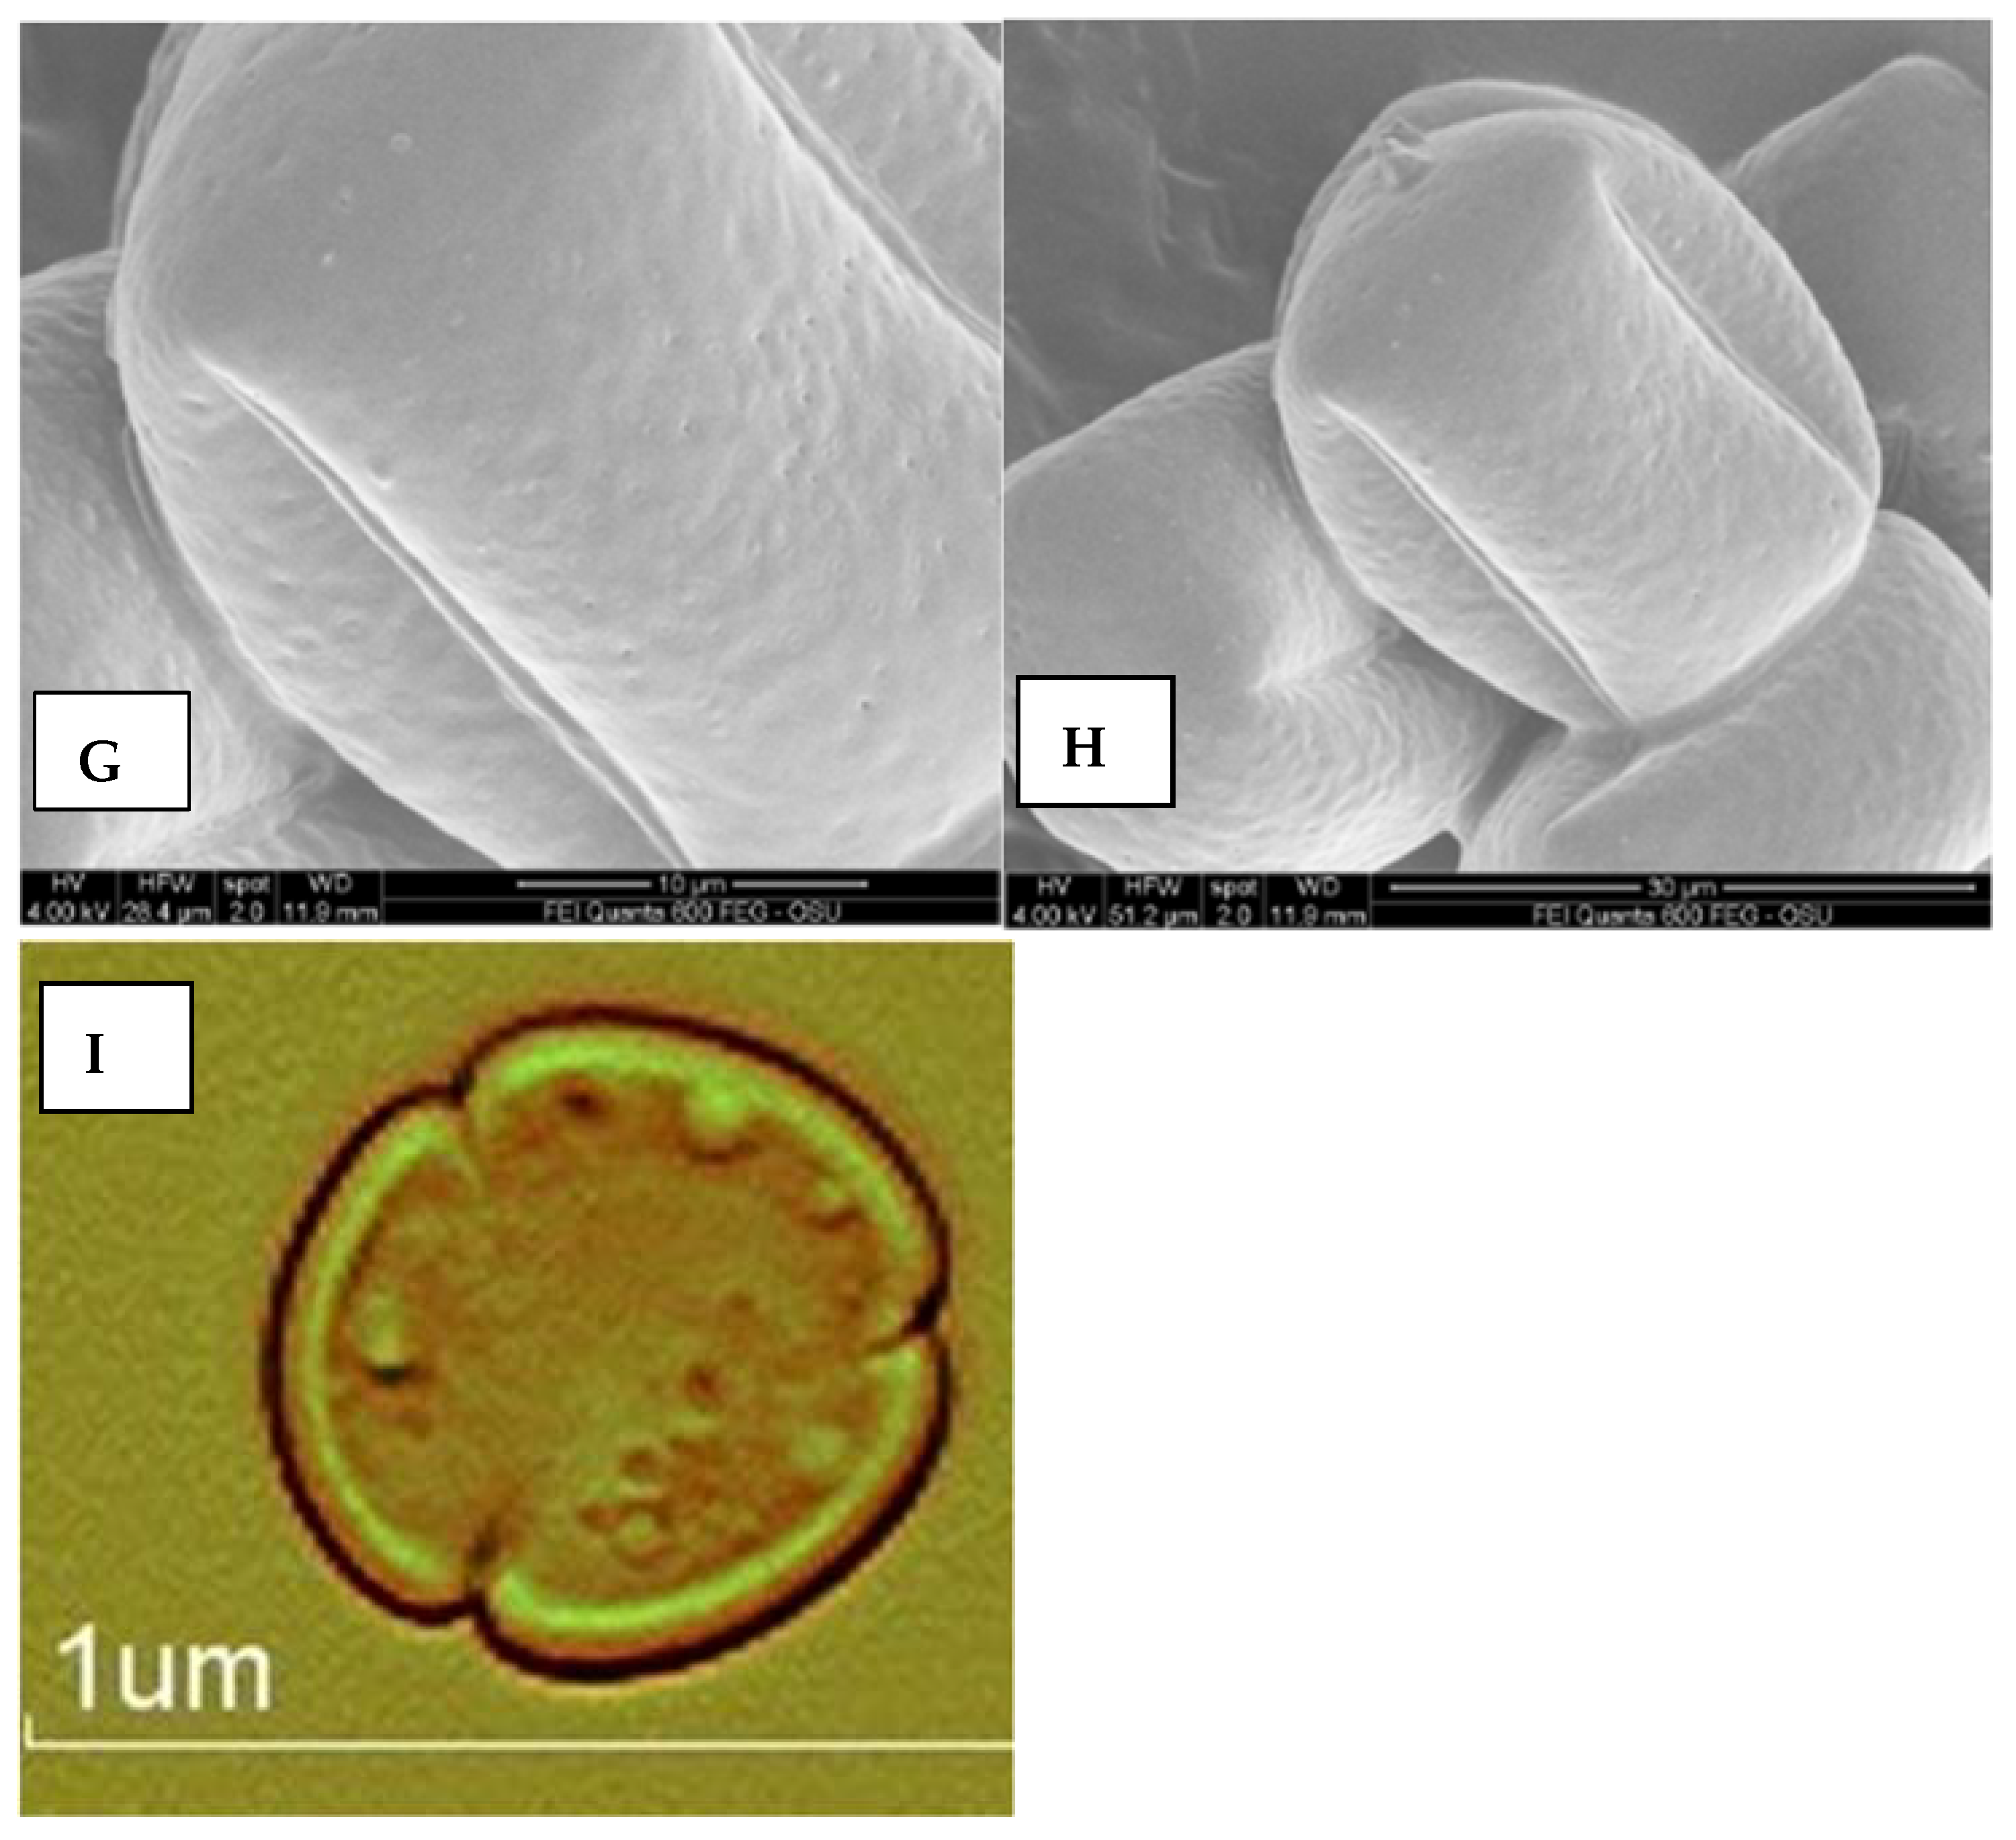
2.5.2. Nutlets (Seeds) and Pollen Surfaces
Nutlets
Pollen
3. Discussion
3.1. Essential Oils Analysis
3.2. Essential Oil Yield
3.3. Phytochemical Determination
3.4. Embryological Research
3.5. Nutlets (Seed) Germination
3.6. Morphological Analysis by Scanning Electron Microscopy (SEM)
3.6.1. Leaves, Stem, Calyx, and Corolla Surfaces
3.6.2. Pollen Surfaces
3.6.3. Nutlets Surfaces
4. Materials and Methods
4.1. Collection of the Plant Material
4.2. Essential Oil (EO) Extraction of Marrubium friwaldskyanum
4.2.1. Steam Distillation of the Essential Oil (EO)
4.2.2. Hydro-Distillation by Clevenger-Type Apparatus
4.3. Gas Chromatography Mass Spectrometry Flame Ionization Detection (GC-MS-FID) of Essential Oil (EO)
4.4. Metabolomics Method
4.5. Scanning Electron Microscopy (SEM) Analysis
4.6. Embryological Analyses
4.6.1. Pollen Viability
4.6.2. Nutlets (Seed) Viability Testing
4.6.3. Testing of Nutlets (Seed) Germination at Different Light Regimes
4.7. Statistical Analyses
5. Conclusions
Author Contributions
Funding
Institutional Review Board Statement
Informed Consent Statement
Data Availability Statement
Acknowledgments
Conflicts of Interest
Abbreviations
| SEM | scanning electron microscopy |
| U.S. | United States |
| NPs | natural products |
| SOA | Herbarium of the Agricultural University, Plovdiv, Bulgaria |
| GC-MS-FID | gas chromatography mass spectrometry flame ionization detection |
| EO | essential oil |
| N | natural daylight |
| WR7:B1 | fluorescent white light with the addition of LED red and blue light in a ratio of 7:1 |
| WR4:B1 | fluorescent white light with the addition of red and blue light in a ratio of 4:1 |
| Wh | fluorescent white light |
| LED | Light-emitting diode |
References
- Fu, Y.; Luo, J.; Qin, J.; Yang, M. Screening techniques for the identification of bioactive compounds in natural products. J. Pharm. Biomed. 2019, 168, 189–200. [Google Scholar] [CrossRef] [PubMed]
- Newman, D.J.; Cragg, G.M. Natural Products as Sources of New Drugs from 1981 to 2014. J. Nat. Prod. 2016, 79, 629–661. [Google Scholar] [CrossRef] [PubMed]
- Newman, D.J.; Cragg, G.M. Natural Products as Sources of New Drugs over the Nearly Four Decades from 01/1981 to 09/2019. J. Nat. Prod. 2020, 83, 770–803. [Google Scholar] [CrossRef]
- Law of the Bulgarian Biodiversity. Available online: http://eea.government.bg/bg/legislation/biodiversity/ZBR_en_26_07_2016.pdf (accessed on 10 April 2019).
- Meshinev, T. Marrubium friwaldskyanum. In Red Book in Bulgaria; Peev, D., Vladimirov, V., Petrova, A., Anchev, M., Temniskova, D., Denchev, C., Ganeva, A., Gussev, C., Eds.; BAS & MOSW: Sofia, Bulgaria, 2015; Volume 1, Available online: http://e-ecodb.bas.bg/rdb/bg/vol1/Marfriwa.html (accessed on 15 June 2021).
- Markovska, Y.K.; Dimitrov, D.S. The effect of leaf age on gas exchange and malate accumulation in C3-CAM plant Marrubium frivaldszkyanum. Photosynthetica 2001, 39, 191–195. [Google Scholar] [CrossRef]
- Smith, J.P.; Sawyer, J.O. Checklist of the Families and Genera of Vascular Plants of California. Bot. Stud. 2019, 88. Available online: https://digitalcommons.humboldt.edu/botany_jps/88 (accessed on 21 September 2021).
- Moore, R.P. Handbook on Tetrazolium Testing; International Seed Testing Association: Zurich, Switzerland, 1985. [Google Scholar]
- Barthlott, W.; Ehler, N. Raster-Elektronenmikroskopie der Epidermis-Oberfl€achen von Spermatophyten. Trop. subtrop. Pflanzenwelt 19; Akad. Wiss. Lit. Mainz; Franz Steiner Verlag: Stuttgart, Germany, 1977; p. 105. [Google Scholar]
- Sarikurkcu, C.; Ozer, M.S.; Calli, N.; Popović-Djordjević, J. Essential oil composition and antioxidant activity of endemic Marrubium parviflorum subsp. Oligodon. Ind. Crops Prod. 2018, 119, 209–213. [Google Scholar] [CrossRef]
- Mahmoud, A.A.; Gendy, A.S.H.; Said-Al Ahl, H.A.; Grulova, D.; Astatkie, T.; Abdelrazik, T.M. Impacts of harvest time and water stress on the growth and essential oil components of horehound (Marrubium vulgare). Sci. Hortic. 2018, 232, 139–144. [Google Scholar] [CrossRef]
- Elbali, W.; Djouahri, A.; Djerrad, Z.; Saka, B.; Aberrane, S.; Sabaou, N. Chemical variability and biological activities of Marrubium vulgare L. essential oil, depending on geographic variation and environmental factors. J. Essent. Oil Res. 2017, 30, 470–487. [Google Scholar] [CrossRef]
- Yabrir, B. Chemical composition and biological activities of some Marrubium species essential oil: A review. Chem. J. Mold. 2018, 13, 8–23. [Google Scholar] [CrossRef]
- Hamdaoui, B.; Wannes, W.A.; Marrakchi, M.; Brahim, N.B.; Marzouk, B. Essential oil composition of two Tunisian horehound species: Marrubium vulgare L. and Marrubium aschersonii Magnus. J. Essent. Oil-Bear Plants 2013, 16, 608–612. [Google Scholar] [CrossRef]
- Tajbakhsh, M.; Khalilzadeh, M.A.; Rineh, A.; Balou, J. Essential oils of Marrubium anisodon C. Koch and Marrubium propinquum Fisch. et C.A. Mey., growing wild in Iran. J. Essent. Oil Res. 2008, 20, 161–162. [Google Scholar] [CrossRef]
- Morteza-Semnani, K.; Saeedi, M. The essential oil composition of Marrubium astracanicum Jacq. from Iran. J. Essent. Oil-Bear. Plants 2004, 7, 239–242. [Google Scholar] [CrossRef]
- Savona, G.; Bruno, M.; Rodriguez, B. Preperegrinine, a prefuranic labdane diterpene from Marrubium friwaldskyanum. Phytochemistry 1984, 23, 191–192. [Google Scholar] [CrossRef]
- Afendi, F.M.; Okada, T.; Yamazaki, M.; Hirai-Morita, A.; Nakamura, Y.; Nakamura, K.; Ikeda, S.; Takahashi, H.; Altaf-Ul-Amin, M.; Darusman, L.K.; et al. KNApSAcK family databases: Integrated metabolite-plant species databases for multifaceted plant research. Plant Cell Physiol. 2011, 52, 1904–1914. Available online: http://www.knapsackfamily.com/knapsack_core/result.php?sname=all&word=Marrubium (accessed on 23 August 2021). [CrossRef]
- Davis, G.L. Systematic Embryology of the Angiosperms; John and Wiley and Sons: Hoboken, NJ, USA, 1966. [Google Scholar]
- Kamellina, O.; Dzevaltovsky, A. Lamiaceae. In Comparative Embryology of Flowering Plants; Batygina, M., Yakovlev, T.B., Eds.; Nauka: Leningrad, Russia, 1987; pp. 225–236. (In Russian) [Google Scholar]
- Wunderlich, R. Ein vorschlag zu einer natürlichen gleiderung der Labiaten auf grund der pollenkörner, der samenentwicklung und des reifen samens. Oesterr. Bot. Z. 1967, 114, 380–483. [Google Scholar] [CrossRef]
- Yurukova-Grancharova, P.; Daskalova, T. Embryological study of Agastache foeniculum (Pursh) Kuntze (Lamiaceae). Phytol. Balc. 2002, 8, 73–80. [Google Scholar]
- Yurukova-Grancharova, P.; Daskalova, T. Microsporogenesis and development of male gametophyte in Hyssopus officinalis L. (Lamiaceae). Phytol. Balc. 1995, 1, 89–92. [Google Scholar]
- Daskalova, T.; Geneva, E. Histological Structure of the Anthers and Microsporogenesis in Salvia tomentosa Mill. (Labiatae). J. Herbs Spices Med. Plants 1996, 4, 63–68. [Google Scholar] [CrossRef]
- Daskalova, T. Histological structure of the microsporangia, microsporogenesis and development of the male gametophyte in Nepeta cataria (Lamiaceae). Phytol. Balc. 2004, 10, 241–246. [Google Scholar]
- Schnarf, K. Beiträge zur Kenntnis der Samenentwicklung der Labiaten. Denkschr. Acad. Wiss. Wien Math. Naturwiss. Kl. 1917, 94, 211–295. [Google Scholar]
- Ramegowda, V.; Senthil-Kumar, M. The interactive effects of simultaneous biotic and abiotic stresses on plants: Mechanistic understanding from drought and pathogen combination. J. Plant. Physiol. 2015, 176, 47–54. [Google Scholar] [CrossRef]
- Figueiredo, D.D.; Köhler, C. Bridging the generation gap: Communication between maternal sporophyte, female gametophyte and fertilization products. Curr. Opin. Plant. Biol. 2016, 29, 16–20. [Google Scholar] [CrossRef]
- Yankova-Tsvetkova, E.; Yurukova-Grancharova, P.; Vitkova, A. Reproductive biology of the Balkan endemic Sideritis scardica (Lamiaceae). Bot. Serb. 2013, 37, 83–87. [Google Scholar]
- Foley, M.E.; Gu, X.Y.; Kianian, S.F. Quantitative Trait loci, epistasis and other interactions associated with dormancy in Weedy Rice (Oryza sativa L.). In Seeds: Biology Development and Ecology; Adkins, S.W., Ashmore, S.E., Navie, S.E., Eds.; CAB International: Wallingford, UK, 2007; pp. 217–225. [Google Scholar]
- Gutterman, Y. Seed Germination in Desert Plants; Springer: Berlin/Heidelberg, Germany, 1993. [Google Scholar]
- Baskin, C.C.; Baskin, J.M. Seeds—Ecology, Biogeography, and Evolution of Dormancy and Germination; Academic Press: San Diego, CA, USA, 1998. [Google Scholar]
- Enache, I.M.; Oana Livadariu, O. Preliminary results regarding the testing of treatments with light emitting diode (LED) on the seed germination of Artemisia dracunculus L. Sci. Bull. Ser. F. Biotechnol. 2016, 20, 51–56. [Google Scholar]
- Ryu, J.H.; Sun Seo, K.S.; Choi, G.L.; Rha, E.S.; Lee, S.C.; Choi, S.K.; Kang, S.Y.; Bae, C.H. Effects of LED light illumination on germination, growth and anthocyanin content of Dandelion (Taraxacum officinale). Korean J. Plant Res. 2012, 25, 731–738. [Google Scholar] [CrossRef][Green Version]
- Nedjimi, B.; Souissi, Z.E.; Guit, B.; Daoud, Y. Differential effects of soluble salts on seed germination of Marrubium vulgare L. J. Appl. Res. Med. Aromat. Plants 2020, 17, 100250. [Google Scholar] [CrossRef]
- Benvenuti, S.; Andolfi, L.; Macchia, M. Light and temperature dependence for germination and emergence of White Horehound (Marrubium vulgare L.) seeds. Seed Technol. 2001, 23, 138–144. [Google Scholar]
- Javaid, M.; Florentine, S.; Ali, H.; Chauhan, B. Environmental factors affecting the germination and emergence of white horehound (Marrubium vulgare L.): A weed of arid-zone areas. Rangel. J. 2018, 40, 47–54. [Google Scholar] [CrossRef]
- Solano, C.J.; Hernández, J.A.; Suardíaz, J.; Barba-Espín, G. Impacts of LEDs in the Red Spectrum on the Germination, Early Seedling Growth and Antioxidant Metabolism of Pea (Pisum sativum L.) and Melon (Cucumis melo L.). Agriculture 2020, 10, 204. [Google Scholar] [CrossRef]
- Metcalfe, C.R.; Chalk, L. Anatomy of the Dicotyledons, Systematic Anatomy of the Leaf and Stem, 2nd ed.; Claredon Press: Oxford, UK, 1979; Volume 1, p. 750. [Google Scholar]
- Marin, D.P.; Petkovic, B.; Duletic, S. Nutlet sculpturing of selected Teucrium species (Lamiaceae): A character of taxonomic significance. Plant Syst. Evol. 1994, 192, 199–214. [Google Scholar] [CrossRef]
- Kharazian, N.; Hashemi, M. Chemotaxonomy and morphological studies in five Marrubium L. species in Iran. Iran J. Sci. Technol Trans. Sci. 2017, 41, 17–31. [Google Scholar] [CrossRef]
- Azizian, D.; Cutler, D. Anatomical, cytological and phytochemical studies on Phlomis L. and Eremostachys bunge (Labiatae). Bot. J. Linn. Soc. 1982, 85, 249–281. [Google Scholar] [CrossRef]
- Marin, M.; Budimir, S.; Janosevic, D.; Marin, P.; Duletic-Lausevic, S.; Ljaljević-Grbić, M. Morphology, distribution, and histochemistry of trichomes of Thymus lykae Degen & Jav. (Lamiaceae). Arch. Biol. Sci. 2008, 60, 667–672. [Google Scholar]
- Osman, A. Trichome micromorphology of Egyptian Ballota (Lamiaceae) with emphasis on its systematic implication. Pak. J. Bot. 2012, 44, 33–46. [Google Scholar]
- Akgül, G.; Ketenoğlu, O.; Pinar, N.M.; Kurt, L. Pollen and seed morphology of the genus Marrubium (Lamiaceae) in Turkey. Ann. Bot. Fenn. 2008, 45, 1–10. [Google Scholar] [CrossRef]
- Talebi, S.M.; Sheidai, M.; Ariyanejad, F.; Matsyura, A. Stem anatomical study of some Iranian Marrubium L. species. Biodiversitas J. Biol. Divers. 2019, 20, 2589–2595. [Google Scholar] [CrossRef][Green Version]
- Ahvazi, M.; Jamzad, Z.; Balali, G.R.; Saeidi, H. Trichome micromorphology in Marrubium L. (Lamiaceae) in Iran and the role of environmental factors on their variation. Iran J. Bot. 2016, 22, 39–58. [Google Scholar]
- Werker, E. Function of essential oil-secreting glandular hairs in aromatic plants of the Lamiaceae. A review. Flavour Fragr. J. 1993, 8, 249–255. [Google Scholar] [CrossRef]
- Haratym, W.; Weryszko-Chmielewska, E. Ultrastructural and histochemical analysis of glandular trichomes of Marrubium vulgare L. (Lamiaceae). Flora 2017, 231, 11–20. [Google Scholar] [CrossRef]
- Muravnik, L.E.; Mosina, A.A.; Zaporozhets, N.L.; Bhattacharya, R.; Saha, S.; Ghissing, U.; Mitra, A. Glandular trichomes of the flowers and leaves in Millingtonia hortensis (Bignoniaceae). Planta 2021, 253, 13. [Google Scholar] [CrossRef]
- Erdtman, G. Pollen Morphology and Plant Taxonomy: Angiosperms (An Introduction to Palynology I); Hafner Publishing Co.: New York, NY, USA; London, UK, 1966. [Google Scholar]
- Fırat, M. Marrubium eriocephalum (Lamiaceae); A species new to the flora of Turkey, with contributions to its taxonomy. PhytoKeys 2016, 58, 9–20. [Google Scholar] [CrossRef] [PubMed]
- McDonald, I.; Kwong, M.B.I.; Francis, Y. Flowers-Seeds. In Flower Seeds: Biology and Technology; McDonald, I., Kwong, F., Eds.; CAB International: Wallingford, UK, 2005; p. 372. [Google Scholar]
- Hedge, I.C. A Global Survey of the Biogeography of the Labiatae. In Advances in Labiatae Science; Harley, R.M., Reynolds, T., Eds.; Royal Botanic Gardens, Kew: Richmond, UK, 1992; pp. 7–17. [Google Scholar]
- Thiers, B. Index Herbariorum: A Global Directory of Public Herbaria and Associated Staff, USA: New York Botanical Garden’s Virtual Herbarium. 2019. Available online: http://sweetgum.nybg.org/ih (accessed on 25 June 2021).
- Arzamaszev, A.P.; Kosireva, I.S. The State Pharmacopoeia of the USSR, 11th ed.; Medizina: Moscow, Russia, 1990. [Google Scholar]
- Adams, R.P. Identification of Essential oil Components by Gas Chromatography/Mass Spectrometry, 4th ed.; Allured Publishing Corporation: Carol Stream, IL, USA, 2007. [Google Scholar]
- Punt, W.; Hoen, P.; Blackmore, S.; Nilsson, S.; Le Thomas, A. Glossary of pollen and spore terminology. Rev. Palaeobot. Palynol. 2007, 143, 1–81. [Google Scholar] [CrossRef]
- Sundara, R.S. Practical Manual of Plant Anatomy and Embryology; Anmol Publications Pvt Ltd.: New Delhi, India, 2000. [Google Scholar]
- Heslop-Harrison, J.S. Pollen Capture Adhesion and Hydration. In Sexual Plant Reproduction; Cresti, M., Tizzi, A., Eds.; Springer: Berlin/Heidelberg, Germany, 1992; pp. 81–88. [Google Scholar] [CrossRef]
- Peters, J. Tetrazolium Testing Handbook. In Contribution No 29 to the Handbook on Seed Testing Revised, the Association of Official Seed Analysts (AOSA); PMB: Las Cruces, NM, USA, 2000. [Google Scholar]
- Montgomery, D.C. Design and Analysis of Experiments, 10th ed.; John and Wiley and Sons: Hoboken, NJ, USA, 2020. [Google Scholar]
- SAS Institute Inc. SAS/STAT® 9.4 User’s Guide; SAS Institute Inc.: Cary, NC, USA, 2014. [Google Scholar]


| Harvest Stage | α-Copaene | (E)-Caryophyllene | Caryophyllene Oxide | τ-Muurolol |
|---|---|---|---|---|
| 2–3 pair of leaves | 1.83 a | 41.0 a | 11.81 a | 2.67 a |
| Before flowering | 1.44 ab | 39.3 a | 9.98 ab | 2.80 a |
| Flowering | 1.26 b | 30.8 b | 6.35 b | 1.32 b |
| Compound | Overall Mean Concentration (%) |
|---|---|
| β-bourbonene | 1.10 |
| α-humulene | 2.83 |
| germacrene D | 23.30 |
| bicyclogermacrene | 2.85 |
| δ-cadinene | 1.07 |
| spathulenol | 2.83 |
| Grinding | D-Limonene | Bicyclogermacrene |
|---|---|---|
| ------ (%) is the GC-FID area 1 ----- | ||
| Whole plant | 1.88 b | 9.14 a |
| Grinded/without water | 0.24 d | 6.93 ab |
| Fresh/ground with water | 1.08 c | 3.55 b |
| Ground/immediately extracted | 3.25 a | 6.02 ab |
| Variants | Germination Energy (%) ± SD | Germination (%) ± SD |
|---|---|---|
| Variant 1 (N) | 24.0 ± 1.0 | 48.0 ± 2.0 |
| Variant 2 (WR7:B1) | 26.0 ± 1.0 | 56.0 ± 2.1 |
| Variant 3 (WR4:B1) | 26.0 ± 1.0 | 52.0 ± 1.0 |
| Variant 4 (W) | 27.0 ± 0.6 | 58.0 ± 2.0 |
| Phenologycal Stage | Sample Size/g | Moisture Content (%) | Yield of EO (% v/w) | Yield of EO (%) |
|---|---|---|---|---|
| (1) 2–3 pairs of leaves | 97.5 | 9.23 | 0.097 | 0.107 |
| (2) pre-flowering flowering | 86.5 | 9.45 | 0.074 | 0.082 |
| (3) Flowering | 159.5 | 62.19 | 0.012 | 0.034 |
| Treatments | Sample Size (g) | Water (mL) | Yield of EO, % Volume/Weight |
|---|---|---|---|
| (1) Fresh samples, whole plants, without grinding | 200 | 1100 | 0.05 |
| (2) Fresh, grinding without water | 200 | 1100 | 0.03 |
| (3) Fresh, ground with water | 200 | 1400 | 0.04 |
| (4) Fresh, ground with water, macerated with 0.1% Tween® 20 for 12 h prior to the extraction | 200 | 1400 | 0.04 |
| (5) Fresh, ground with water and macerated with 0.1% Tween® 20 and immediately extracted | 200 | 1400 | 0.03 |
| Light Colour | Technical Specification | |||
|---|---|---|---|---|
| Power (W) | Tension (V) | Wavelength nm | Light Flux | |
| Red/blue 7:1 | 200 W | 220 V (85−265 V) | 660 nm: 460 nm, (64 diode) of 3 W | 50 sm–250 µmol/m2s |
| Red/blue 4:1 | 200 W | 220 V (85–265 V) | 660 nm: 460 nm, (64diode) of 3 W; 730 nm-2 pcs; | 50 sm–250 µmol/m2s |
| White | 200 W | 220 V (85–265 V) | 660 nm-26 pcs; 630 nm-16 pcs460 nm-9 pcs; 440 nm-6 pcs; 610 nm-2 pcs; 380 nm-1 pcs; 3500 k-2 pcs; (64 diode) of 3 W | 50 sm–250 µmol/m2s |
| daylight | 300 µmol/m2s–2000 µmol/m2s | |||
Publisher’s Note: MDPI stays neutral with regard to jurisdictional claims in published maps and institutional affiliations. |
© 2021 by the authors. Licensee MDPI, Basel, Switzerland. This article is an open access article distributed under the terms and conditions of the Creative Commons Attribution (CC BY) license (https://creativecommons.org/licenses/by/4.0/).
Share and Cite
Zheljazkov, V.D.; Semerdjieva, I.B.; Stevens, J.F.; Wu, W.; Cantrell, C.L.; Yankova-Tsvetkova, E.; Koleva-Valkova, L.H.; Stoyanova, A.; Astatkie, T. Phytochemical Investigation and Reproductive Capacity of the Bulgarian Endemic Plant Species Marrubium friwaldskyanum Boiss. (Lamiaceae). Plants 2022, 11, 114. https://doi.org/10.3390/plants11010114
Zheljazkov VD, Semerdjieva IB, Stevens JF, Wu W, Cantrell CL, Yankova-Tsvetkova E, Koleva-Valkova LH, Stoyanova A, Astatkie T. Phytochemical Investigation and Reproductive Capacity of the Bulgarian Endemic Plant Species Marrubium friwaldskyanum Boiss. (Lamiaceae). Plants. 2022; 11(1):114. https://doi.org/10.3390/plants11010114
Chicago/Turabian StyleZheljazkov, Valtcho D., Ivanka B. Semerdjieva, Jan F. Stevens, Wenbin Wu, Charles L. Cantrell, Elina Yankova-Tsvetkova, Lyubka H. Koleva-Valkova, Albena Stoyanova, and Tess Astatkie. 2022. "Phytochemical Investigation and Reproductive Capacity of the Bulgarian Endemic Plant Species Marrubium friwaldskyanum Boiss. (Lamiaceae)" Plants 11, no. 1: 114. https://doi.org/10.3390/plants11010114
APA StyleZheljazkov, V. D., Semerdjieva, I. B., Stevens, J. F., Wu, W., Cantrell, C. L., Yankova-Tsvetkova, E., Koleva-Valkova, L. H., Stoyanova, A., & Astatkie, T. (2022). Phytochemical Investigation and Reproductive Capacity of the Bulgarian Endemic Plant Species Marrubium friwaldskyanum Boiss. (Lamiaceae). Plants, 11(1), 114. https://doi.org/10.3390/plants11010114