Article

Phytostimulatory Influence of Comamonas testosteroni and Silver Nanoparticles on Linum usitatissimum L. under Salinity Stress

1
Biology Department, Faculty of Science, King Khalid University, P.O. Box 9004, Abha 61413, Saudi Arabia
2
Research Center for Advanced Materials Science (RCAMS), King Khalid University, P.O. Box 9004, Abha 61413, Saudi Arabia
3
Department of Microbiology, National Organization for Drug Control and Research (NODCAR), Cairo 12611, Egypt
4
Department of Plant Production, College of Food and Agriculture Sciences, King Saud University, Riyadh 11461, Saudi Arabia
5
National Agricultural Research Center, Baqa 19381, Jordan
*
Authors to whom correspondence should be addressed.
Plants 2021, 10(4), 790; https://doi.org/10.3390/plants10040790
Submission received: 25 February 2021 / Revised: 13 April 2021 / Accepted: 15 April 2021 / Published: 16 April 2021
(This article belongs to the Special Issue Plants Subjected to Salinity Stress)

Abstract

:
They were shifting in land use increases salinity stress, significant abiotic stress affecting plant growth, limiting crop productivity. This work aimed to improve Linum usitatissimum L. (linseed) growth under salinity using Comamonas testosteroni and silver nanoparticles (AgNPs). AgNPs were fabricated exploiting Rosmarinus officinalis and monitored by U.V./Vis spectrophotometry scanning electron microscopy (SEM) and Fourier transforms infrared spectroscopy (FTIR). Photosynthetic pigments, enzymatic and nonenzymatic antioxidants of linseed were investigated under salt stress in treated and untreated plants with C. testosteroni alongside AgNPs. Our findings recorded the formation of AgNPs at 457 nm, which were globular and with a diameter of 75 nm. Notably, chlorophyll-a, b, and total chlorophyll reduction while enhanced carotenoids and anthocyanin contents were attained under salinity stress. Total dissoluble sugars, proline, and dissoluble proteins, H2O2, malondialdehyde, enzymatic and nonenzymatic antioxidants were significantly elevated in NaCl well. Combined AgNPs and C. testosteroni elevated photosynthetic pigments. Also, they led to the mounting of soluble sugars, proline, and soluble proteins. H2O2 and malondialdehyde decreased while enzymatic and nonenzymatic antioxidants increased in response to AgNPs, C. testosteroni, and their combination. Thus, AgNPs and C. testosteroni might bio-fertilizers to improve linseed crop productivity under salinity stress.

1. Introduction

The utmost serious environmental threat for plant survival and harvest yield is soil salinity. It affects 19.5% of inundated land and 2.1% of dry ground cultivation over the globe. Salinity poses several undesirable consequences for plants through hypertonic and hyperosmotic effects on several plant bio-processes, prompting membrane disorganization, increment in reactive oxygen species (ROS) levels, and metabolic harmfulness [1]. Salinity influences carotenoids, anthocyanin, chlorophyll content, soluble sugar, and lipid contents [2]. Under salt pressure, plants have created complex techniques to contend with these oxidative stresses using different antioxidants′ synchronous actions. Of these, catalase (CAT), superoxide dismutase (SOD), and peroxidase (POD) assume critical roles in detoxifying reactive oxygen species (ROS). Catalase and peroxidase are engaged together, converting H2O2 into oxygen and water [3]. Khan et al. [4] stated that plants adjust to osmotic stress by amassing some convenient solutes such as glycine betaine (G.B.), proline, trehalose, and polyols during salt pressure proline conduct a principal function in defending plants from osmotic pressure. Subsequently, antioxidants and convenient solutes may award a strategy to upgrade salt resistance in plants. Linseed (Linum usitatissimum L.) is an herbaceous plant all over the globe related to the Linaceae family. It has a broad scope of manufacturing uses because of its primary products, such as seeds and fibers [5]. Linseed is a significant nutritional crop in antioxidants and omega-3 fatty acids. Polyphenols are critical substances concerning the antioxidant features of the plants. Flavonoids serve as scavengers of different oxidizing free radicals [4]. Notwithstanding, the vulnerability of the yield to salt pressure is the major factor for diminished crop productivity. The survey is meager on the resistance of linseed plants to saltiness. Certain methods would be an effective strategy to improve harvest productivity [6]. It is highly desirable to alleviate salt stress′s adverse actions to fulfill the population′s increase globally. Chemical treatments and agronomical crop handling pursuit were tried to alleviate the salinity stress with little success [7]. A viable alternative is to induce plants′ capability to face the detrimental situation successfully by remediation using rhizosphere bacteria and AgNPs, which were accounted for relieving the ominous effects of salinity by improving the growth and yield of the plant. In an ever-changing world, nanoscience is a fascinating field of sciences, enabling the plants to endure salts influencing the plant system for ameliorating the plant growth and the potential of ROS scavenging. The green fabricated nanoparticles from plants are frugal and naturally benevolent [8]. Applications of nanoparticles can help limit the utilization of poisonous, brutal, and costly synthetic compounds used in the common processes of plant output [9]. Metal nanoparticles exert a significant action on plant growth that concerns food quality [10]. Oppositely, sometimes, AgNPs exert counteractive effects on crops [11]. It was widely reported that plants exposed to nanoparticles could use and translocate nanoparticles to different plant parts. Among nanoparticles, AgNPs have miscellaneous applications and have been extremely used as antimicrobial agents in cosmetics, household items, filters, and cosmetic items [12]. AgNPs boosted or diminished the plant development and biomass, relying on the dose, size, and exposure period [13]. As of late, hardly any investigations have detailed the positive function of AgNPs under saltiness [14]. Interestingly, AgNPs boost the seed up-growth of tomatoes; notwithstanding, little data is accessible concerning the impact of AgNPs on wheat seedlings in salty environments [13]. It was theorized that seed preparation with AgNPs might reduce the salt pressure in wheat plants by diminishing the oxidative stress by altering antioxidant enzyme activities leaning on the dosages of AgNPs applied [15]. Nowadays, many reports discussed the effects of AgNPs on improving the development and seed germination of plants like Panicum vulgatum, Phytolacca Americana, Brassica juncea, Zea mays, Phaseolus vulgaris, Pennisetum glaucum, Boswellia ovalifoliolata [10,16,17]. Since bacteria plentifully take part in the rhizosphere microorganisms, it is profoundly likely that they affected plant physiology, especially considering their association in root colonization [18]. Rhizobacteria enhancing plant outgrowth are soil-borne, free-living microbes, which boost plant growth and development directly or indirectly [19]. Microorganisms such as Azospirillum, Xanthomonas, Pseudomonas, Alcaligenes faecalis, Rhizobium, Bradyrhizobium japonicum, and Acetobacter diazotrophicus have been appeared to deliver auxins associate with invigorating plant growth [20]. C. testosteroni is a facultative anaerobic bacterium and selected in this study to alleviate the salinity threatening plant growth. It was previously used as a good bio-fertilizer [21]. C. testosteroni can also degrade phenol and 4-chlorophenol mixtures completely through a meta-cleavage pathway, which is beneficial not only for enhanced cell growth but also for the biotreatment of both compounds [22]. C. testosteroni is capitalized on in heavy metal bioremediation because of its high heavy metal tolerance [23]. The exploitation of PGPR offers an alluring method to supplant compost pesticides. PGPR is a part of coordinated management frameworks in which diminished paces of agrochemicals and cultural control rehearses biocontrol operators. Such an incorporated framework could be used for moving vegetables to create more fiery transfers that would be lenient to nematodes and different infections for at any rate hardly a few weeks in the wake of relocating to the field [24]. This work intends to assess AgNPs and rhizosphere bacteria′s influence in mitigation saltiness for Linum usitatissimum L. In Addition, monitoring of the physiological state of the plant was done that was represented by photosynthetic pigments, soluble protein, total soluble sugars, proline, hydrogen peroxidation (H2O2), malondialdehyde (MDA), total phenolics (TPC), glutathione (GSH), ascorbic acid (AsA), and the activity of the antioxidant enzymes (superoxide dismutase, catalase, peroxidase, ascorbate peroxidase, and glutathione reductase).

2. Results

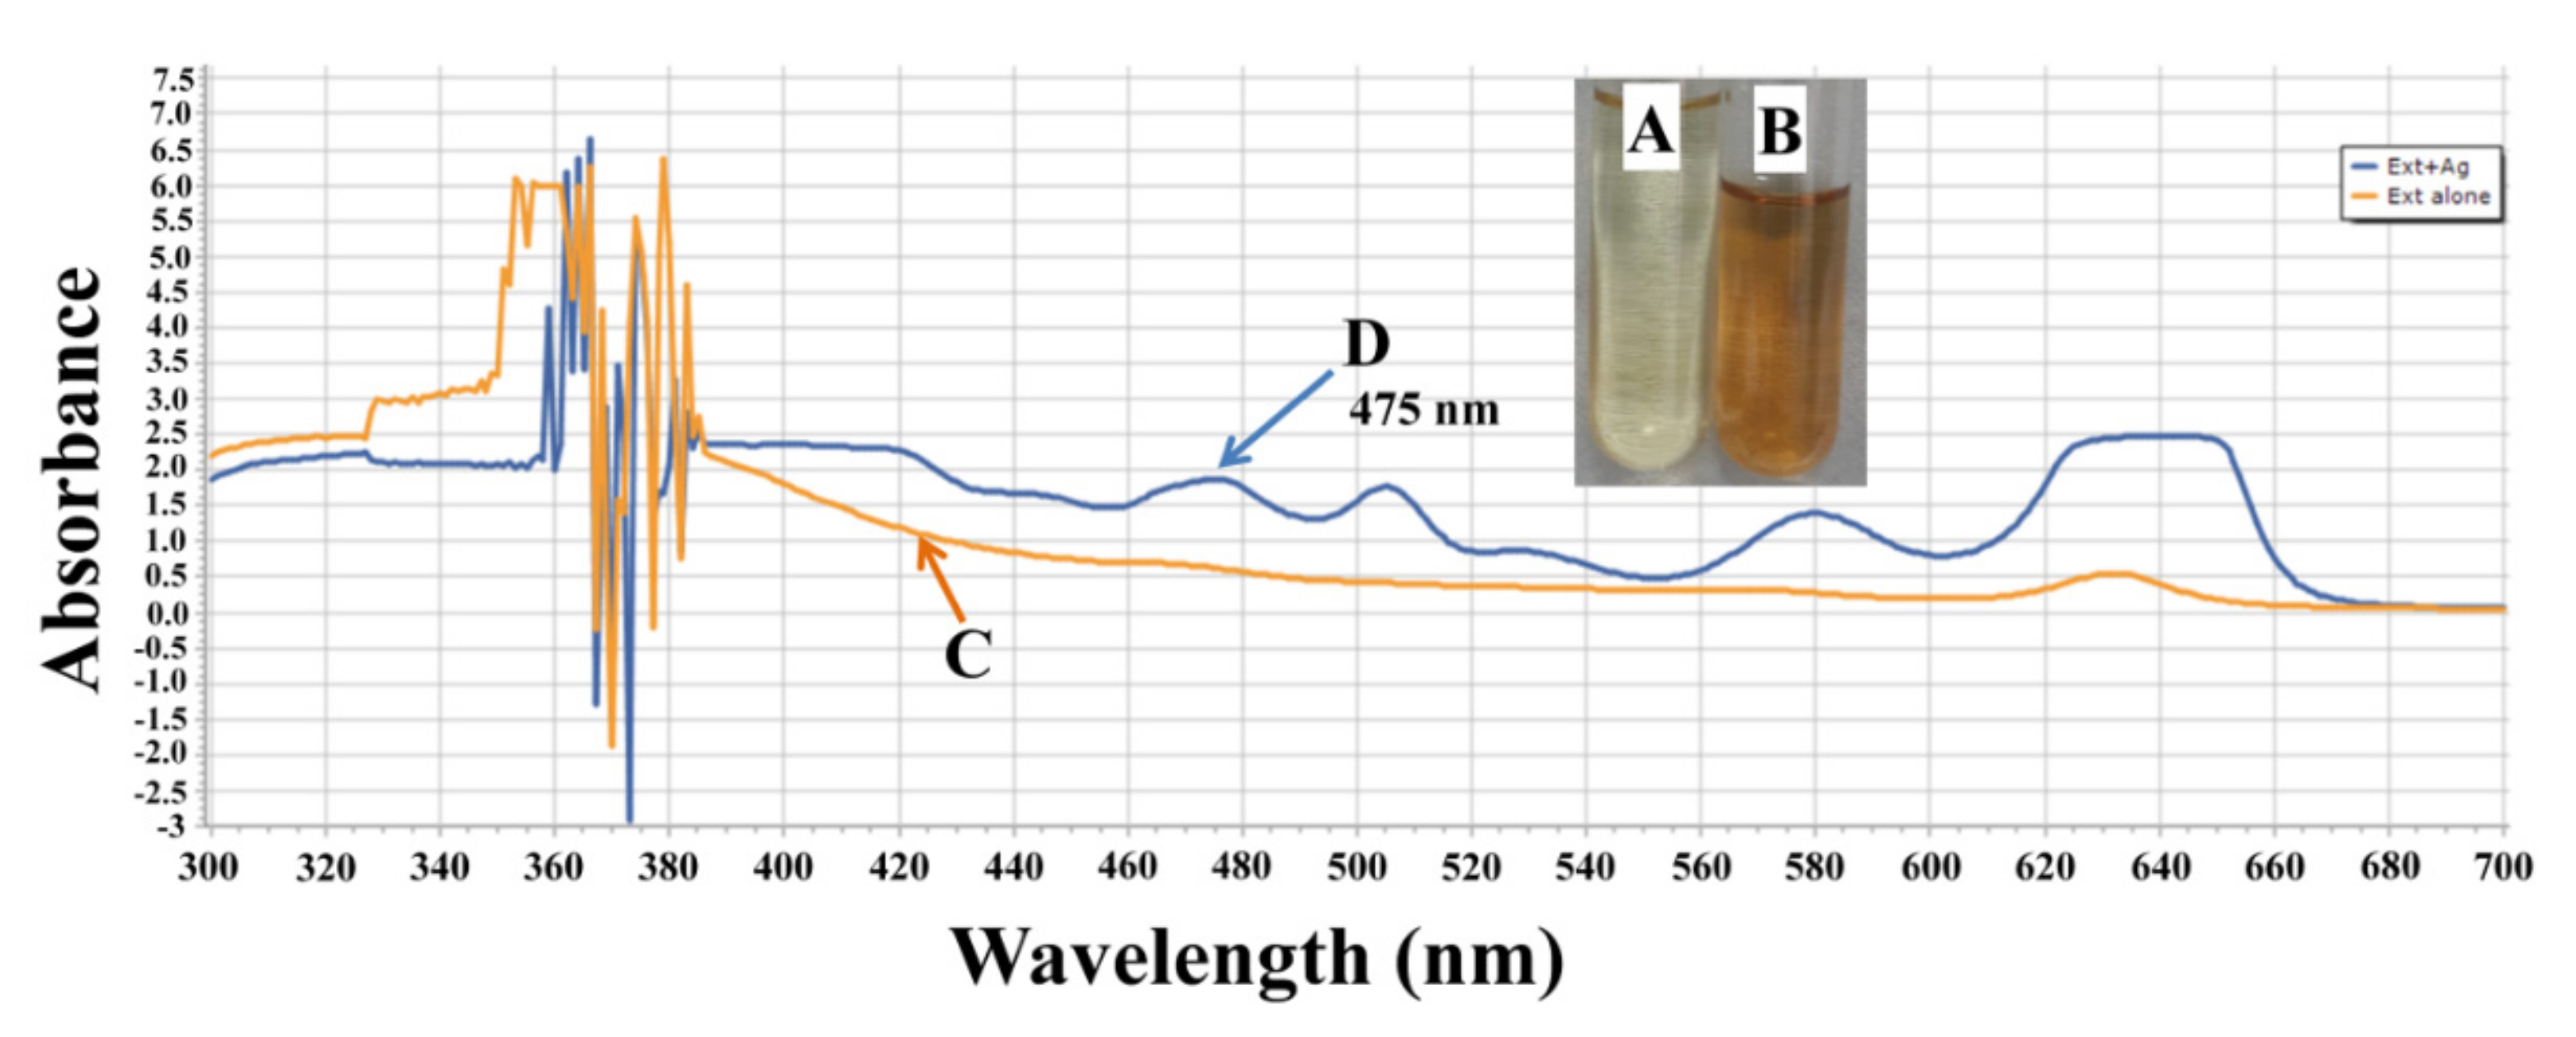
2.1. Characterization of AgNPs

Rosmarinus officinalis was used in AgNPs generation. Color variation and spectroscopic analysis (Figure 1) are good evidence for Nano-silver biosynthesis, where a distinctive plasmon absorption peak was monitored at 475 nm.
As certified in Supplementary Figures S1 and S2, FT-IR spectroscopy revealed the characteristic peaks of bio- compounds responsible for reducing and capping AgNPs. The apparent peaks at 3570–3050, 2926–2856, 1720, 1602, 1602, 1436, 1340, 1269, 1174, 982, and 690–540 cm−1 were related to the specific functional groups. Distinctive strong broadband of alcoholic compounds in the range ~3570–3050 cm−1 due to extending O-H groups′ vibration. There are two strong bands at 2926–2856 cm−1 because of extending the C-H bond′s vibration corresponding to methylene. Prominent peaks at 1720 and 1602 cm−1 could be attributed to extending the vibration of C=O that is allocated to aldehyde or ketone. Medium peaks emerged at 1602–1436–1340–1269 cm−1 attributed to stretching vibration of C=C bond referred to the aromatic compound. The weak band at 1174 cm−1 might be because of the stretching vibration of the aliphatic ether. The medium peak at 1030 cm−1 might be because of the stretching vibration of S=O assigned to sulfoxide. At 982 cm−1, a strong C=C bending vibration could be ascribed to a monosubstituted alkene. Strong peaks at 690–540 cm−1 may result from the stretching halo compound.

2.2. Photosynthetic Pigments

The findings showed a significant lowering in chlorophyll-a, b, and total chlorophyll at 50 and 100 mM NaCl. While total chlorophyll and chlorophyll-b were non-significantly decreased at 25 mM compared to the control as depicted in Table 1, however, the carotenoids and anthocyanin content significantly increased at 50 and 100 mM compared to the control as depicted (Table 1). Interestingly, AgNPs boost all pigments contents, particularly at 50 mM leading to a significant increase in total chlorophyll, chlorophyll-b, and carotenoids pigments. AgNPs led to significantly prompting in the total chlorophyll, carotenoids, and anthocyanin at 100 mM salt. There is no difference between total pigments from control plants and plants treated with C. testosteroni. Using both AgNPs and C. testosteroni offers to ascend to increase the photosynthetic pigment levels. The letter mixture caused a significant increase in chlorophyll-b, the total chlorophyll, carotenoids, and anthocyanin levels at 25 mM, while chlorophyll-b, the total chlorophyll, and carotenoids significantly increase at 50; meanwhile, all chlorophyll types reached the maximum levels at 100 mM.

2.3. Soluble Sugars, Proteins, and Proline Contents

Our results showed a significant boost of total soluble sugars, soluble proteins, and proline with an increase in salt concentration contrasted with the control. The generation of soluble sugars, soluble proteins, and proline was substantially higher with treatment with AgNPs and C. testosteroni combination than those at the use of AgNPs alone, while the lowest value was observed at the use of C. testosteroni alone in non-stressful and stressful linseed plants (Table 2).

2.4. MDA and H2O2 Contents

As per our outcomes, H2O2 content significantly increased by increasing salinity levels, and the most increased values were at 50- and 100-mM NaCl contrasted with control. Both H2O2 and MDA decreased in the stressed and non-stressed linseed plants after treatment with AgNPs, C. testosteroni, and the combination of both of them (Table 2).

2.5. Determination of Nonenzymatic Antioxidants

Our findings showed that TPC, AsA, and GSH significantly increased under salinity. No significant differences were found in TPC content, while significant increases in AsA and GSH were attained after applying AgNPs alone, C. testosteroni alone, and blending of them (Table 3).

2.6. Assay of Antioxidant Enzyme Activities

Data illustrated in Table 4 cleared that the progressive increase in NaCl concentrations (25, 50, 100 mM) resulted in a significant increase in the activity of antioxidant enzymes SOD, CAT, POD, APX, and G.R. contrasted with the control. Also, enzyme activity increased in the stressed and non-stressed linseed plants because of the treatment using AgNPs alone, C. testosteroni, and their combination.

3. Discussion

C. testosteroni was selected to alleviate the salinity threatening plant growth because it was previously used as a salinity challenger up to 3% concentration [25]. A color change successfully approved the greenly AgNPs fabrication into dark brown. The U.V.–visible spectroscopy empowered us to gauge the distinctive localized surface plasmon resonance peak and its maximum absorbance at more or less 425 nm correlated to the globular shaped AgNPs [26]. Notably, bio-compounds existing in rosemary plant extract associated with reducing AgNO3 resulting AgNPs were checked by FTIR spectroscopy. By matching the FTIR spectra of the rosemary plant extract and the bio-fabricated AgNPs, it could be noted that all peaks attained in plant extract were also observed in the FTIR spectrum of AgNPs, but shifted to higher-frequency positions. These shifts evidenced the functional groups assigned to these peaks were used for the bio-reduction and the stabilization of the resultant AgNPs. SEM micrograph illustrated the shape and size of AgNPs that was confirmed by the spherical shape of AgNPs with a size 75 nm. This result is consistent with other research [27]. Photosynthetic pigments including chlorophyll-a, chlorophyll-b, the total chlorophyll, carotenoids, and anthocyanin play a vital role in photosynthesis. However, salinity affects photosynthesis by reducing stomatal conductance by changing its water status, pigments′ concentration and altering the chloroplast ultrastructure [28]. The results imply that chlorophyll reduction because of salinity led to a lower photosynthesis rate, while AgNPs and C. testosteroni could improve plant development controllers or increase plant nutrient uptake [29]. A decline in chlorophyll might be because of the repression of accountable enzymes for its synthesis [30]. Pigment content suppression was attributed to upgraded chloroplast structure harm, pigment instability, and chlorophyllase production [6]. Nanoparticles have both favorable and unfavorable effects on seed germination, root elongation, cell division, chromosomal aberration, and metabolic activities [31]. However, Gupta et al. [10] confirmed the phytostimulatory impact of green-synthesized AgNPs during rice (Oryza sativa L.) seedling. The initiation of respiration and rapid ATP creation by the effect of AgNPs lowered the germination time and fasting seed germination [32]. Anyhow, the increment in photosynthetic pigments may be because of Na uptake minimizing by plants because of AgNPs [33]. Contrary, Thiruvengadam et al. [34] reported that AgNPs exerted no significant effect at 1.0 mg/L on total chlorophyll, whereas higher concentrations (5.0 and 10.0 mg/L) of AgNPs resulted in significantly decreased total chlorophyll. AgNPs have phytotoxic effects in some seedlings diminishing plant pigments [11]. It was hypothesized that ZnO-NPs involved in the rise of plant chlorophyll-and exceedingly efficient in the synthesis of photosynthetic pigments that increased photosynthesis rate [35]. It might be because nanoparticles are powerful amplifiers of photosynthetic effectiveness that in parallel cause light absorption by chlorophyll, as it causes convey of energy to nanoparticles from chlorophyll [36]. As observed in this work, the higher contents of carotenoids and anthocyanins formed by AgNPs exposure might be because of higher oxidative stress caused by AgNPs. Similar results have been found regarding anthocyanin levels in A. thaliana exposed to AgNPs [37]. Osmotic stresses, such as salinity, light, pH, and temperature, considerably affect anthocyanin′s stability [38]. Anthocyanins are associated with chlorophyll′s photoprotection and in response to osmotic stresses, for example, salinity in plants [39]. Sharma et al. [40] concluded that anthocyanins preserve the plant from visible light under salinity stress. Plant growth advancing rhizobacteria is considered the best remediation tool for plants under saline stress by diverse mechanisms [41]. As we observed, C. testosteroni have a significant part in salt tolerance and enhancing the development of Linum usitatissimum L. Comparable outcomes were obtained by Razzaghi et al. [42], who stated that the stimulatory effect of salinity–tolerant bacteria could be ascribed to improved mineral, nitrogen, and water uptake. Likewise, Zameer et al. [43] stated that plant development advancing rhizobacteria proved best for improving chlorophyll-a, chlorophyll-b, carotenoid, and anthocyanin of NaCl stressed tomato [43]. It is well known that proline and total soluble sugars are important natural solutes that keep the cell homeostasis and assist in cell osmoregulation under salinity stress and their aggregation in plants correlates with enhanced salt resilience. Soluble proteins are an important tool in osmoregulation under saline stress, providing plant cells with nitrogen and protecting them from potential oxidative damage [33]. Likewise, salt pressure enhanced soluble proteins, total soluble sugars, and production in chickpea and proline contents in wheat [44] and in Brassica juncea L. [45]. Besides, Mohamed et al. [46] have documented that AgNPs increased the organic solute concentrations in wheat seedlings under salt pressure, achieved the same findings. Also, Nano-zinc oxide boosts the organic solutes in lupine and tomato plants under salt stress through the activation of translational and/or transcriptional processes [7,47]. Oppositely, Nano-cerium oxide nanoparticles decreased proline contents in leaves of B. napus under salinity [14]. The utilization of beneficial bacteria mitigating stress discovering alternative approaches involved in stress tolerance [48]. Similarly, it was announced that treatment with B. subtilis and Arthrobacter sp. boost proline, total soluble sugars, and soluble proteins [49]. Salinity drives to hyperosmotic stress and ionic imbalance, hence, induce reactive oxygen species, including H2O2, which could extremely harm the lipids, photosynthetic pigments, nucleic acids proteins, and cell membranes [50]. Concurrently, similar results were approximately shown regarding lipid peroxidation (MDA), which substantially increased for stressed plants at all salt concentrations. Concurrently, these results are concordant with several studies expressed that the content of H2O2 and MDA were significantly elevated in different plants under salinity where high aggregation of MDA may be attributed to the destruction of the cellular membrane probity, and cellular compounds, like proteins and lipids [33]. AgNPs reduced H2O2 and MDA contents, thus improving the injury normally induced by salinity stress. AgNPs have been accounted for upregulating the antioxidant system by speedy disposal of H2O2, subsequently prompting growth development upkeep [51], which is consistent with the outcomes of Burman et al. [52], who reported that zinc nanoparticles induced defensive effects on biomembranes versus alternations of membrane permeability and oxidative stress in chickpea seedlings [33]. Gupta et al. [10] realized a similar outcome that investigated that AgNPs decreased MDA and H2O2 content. Pseudomonas spp. were effective in salinity tolerance by constringing H2O2 content [53]. Nonenzymatic antioxidants (TPC, AsA, & GSH) are involved in many cellular processes either by playing critical roles in plant tolerance or acting as enzyme cofactors, affecting plant prosperity and development from initial development phases senescence [54]. Glutathione is a powerful reducing agent, which plays an important role in eliminating ROS either as an individual molecule or through the ascorbate–glutathione cycle [55]. The manifest accumulation of nonenzymatic antioxidants in the lupine plant because of nanoparticles may help salt resistance via osmotic change; improve plant prosperity [7]. Nanoscience has become a fundamental and emerging tool in agronomy for inducing crop production by suppressing disease factors [56]. Our results are consistent with others who declared that by elevating the intensity of NaCl, total phenolic content significantly increases [44,57]. Our finding was consistent with another investigation where AgNPs, Acinetobacter sp. and Bacillus sp. promoted phenolic compounds and anti-oxidation potential because of depletion of free radicals. GSH and AsA were promptly increased with an increase in the concentration of biosynthesized AgNPs in T. foenum-graecum, while the lowermost intensity of GSH and AsA was found in Z. mays and A. cepa L. seedlings [58]. It has been thought that increasing the antioxidant enzyme levels under saltiness is an effective strategy to confer salt resistance. Notably, phenolic compounds played a vital function in safeguarding the plants against harmful effects induced by various pressures like salinity [45]. On contrary, it was stated that GSH and AsA contents of safflower significantly decreased with rising salinization levels. However, bacterial strains B. cereus, and B. aerius elevated the level of ascorbic acid and glutathione in safflower seedlings with elevation in salinity level [59]. Antioxidants enzymes are the utmost common physiological factors regulating plant growth, and they are effective in scavenging ROS through their increased activity under abiotic tension [60]. Similar to our results, several types of research concerning NaCl- treated plants have documented that enzymes′ activity of APX, SOD, CAT, and G.R. increased in Solanum lycopersicum, Brassica juncea L., Zea mays, and Pistachio vera in response to a progressive elevation in NaCl [61]. It was documented that the seedlings of mango rootstock exhibited greater CAT, SOD enzyme activities than control plants under salinity [62]. In close effects of AgNPs are predictable with different outcomes who revealed an essential increase in the rate of seed germination during treatment with AgNPs in B. ovalifoliolata, Z. mays L., A. cepa L., and T. foenum-graecum L. [58]. Consistently, it actually proved the increase in CAT, SOD, AXP, and POD activities because of AgNPs [63]. It has been investigated the high production of CAT and POD that diminished the ROS release and Nano-toxicity and the odds of oxidative pressure in plants [64]. Interestingly, microorganisms could assume a huge part in the management of saltiness stress [65]. C. testosteroni reportedly has favorable effects on plant growth, higher yield, and abiotic tolerance. The selected bacterial strain maintained a higher growth rate under zinc stress (unpublished results from author′s lab). Because of salinity and Zn abiotic pressure resistance, siderophore and organic acids can prompt supplement bioavailability and improving soil aggregation. Thus, C. testosteroni is considered a superior strain in resisting the negative effects of NaCl. In consonance with [3] Habib et al., a substantial increase of antioxidant enzyme activity (APX, CAT, GR, POD, and SOD) occurred under saline conditions in the okra plants treated with PGPR [3]. Identically, other studies stated that B. cereus inoculation significantly increased the antioxidant enzymes (POD, SOD, and CAT) activities that of great importance to cope with oxidative stress during salt stress conditions [66]. This shows the effectiveness of enzymatic activities in controlling the possible oxidative damage under bacterial inoculation [67]. Oppositely, sometimes AgNPs exerted unfavorable effects on antioxidant enzymes [11]. The elevation in the activity of H2O2 scavenging enzymes like CAT and POD allows us to speculate that H2O2 homeostasis has altered in inoculated plants, which led to increased plant prosperity under pressure. It was reported that beneficial bacteria could increase the enzyme activity for ROS scavenging because of their action on genes encoding for antioxidant enzymes [68]. Similar results were reported for Solanum tuberosum and Lactuca sativa treated with Bacillus strains and Pseudomonas mendocin, respectively [69]. Peroxidase enzyme is associated not only in scavenging H2O2 but also in plant prosperity, development, suberization, lignification, and crosslinking of cell wall compounds that prevent the entry of more ions [70]. These results recommend that C. testosteroni and AgNPs can be used in salinized agricultural farming grounds as a bio-inoculant to prompt crop productivity.

4. Materials and Methods

4.1. Bacterial Culture Preparation

Rhizosphere bacteria C. testosteroni has been isolated from the soil rhizosphere, Aseer region, KSA. It was cultured in a nutrient broth medium and incubated at 150 rpm for 48 h at 27 °C. Afterward, the cells were gathered by centrifugation at 5000 rpm for 15 min, rinsed, and resuspended in sterilized water to a concentration of nearly 1 × 10⁷ CFU mL−1. For soil application, nutrient-free bacterial suspension was sprayed, and the control pots were sprayed with a similar volume of sterile water [71].

4.2. Preparation of AgNPs Using Rosmarinus Officinalis

Chemicals (AgNO3) of pure grade were used (Merck, Ltd., Feltham, U.K.). The mature leaves of rosemary were collected from Abha City, Saudi Arabia, rinsed using distilled water, air-dried at 20–25 °C for five days, then ground into a coarse powder. About 10 g of the powder were suspended in 100 mL distilled water at 25 °C for 24 h, filtered through a muslin cloth to discard the fibers, and then filtered through Whatman filter paper (No1). Ultimately, it was centrifuged at 5000 rpm for 10 min to separate the clear leaf extract that will be preserved at 4 °C until used as a reducing and stabilizer agent in nanoparticle preparation [26]. An aqueous solution of AgNO3 (1 mM) was added drop-wise into 50 mL of rosemary leaf extract. The mixture was incubated for 18 h at room temperature. Control without AgNO3 was also kept at the same conditions. The solution was centrifuged for 10 min at 10,000 rpm to isolate the AgNPs. The nanoparticles were washed several times using deionized water and then suspended in 95% ethanol before characterization.

4.3. Description of Bio Fabricated AgNPs

The color alteration was examined within 24 h that potentially showed the development of AgNPs. Characterizations of the bio-formed AgNPs were studied via U.V.–Vis spectroscopy analysis using UV-3600 Shimadzu spectrophotometer (Duisburg, Germany), and the manufacturing of AgNPs was monitored within the range (200–600 nm). Fourier transform infrared spectroscopy (FT-IR) was done using Perkin Elmer Spectrum 2000 (Waltham, MA, USA), at a rate of 16 times within the range 600–4000 cm−1, and clarity of 4 cm−1. The shape and size of the produced AgNPs were depicted by a scanning electron microscope (SEM, JEM-1011, JEOL, Tokyo, Japan) at a quickening voltage of 90 kV.

4.4. Effect of AgNPs and C. testosteroni on Plant Growth

Linseeds used in this study were got from the ministry of agriculture, Abha, Saudi Arabia. First, several NaCl concentrations (0, 25, 50, 100 mM) were prepared using distilled water. Foremost, surface-sterilization of seeds occurred by steeping in 70% ethanol for 5 min, then in 2% sodium hypochlorite for 30 min. Next, sterile seeds were washed, sterilized, and sown in 15-cm plastic pots containing equal amounts of sand and peat moss. The seeds were dispersed at a profundity of 1 cm at 20–25 °C in a greenhouse enlightened with regular light. All pots were watered with 200 mL water trice a week; then they were divided into four groups; each group contained five replicates per treatment (250 seeds per transaction) and was stressed by various NaCl salt concentrations (0, 25, 50, 100 mM). Each group was partitioned into four groups, where the first group was left with no treatment as a control, the second group was foliar sprayed with AgNPs solution, the third group comprised soil sprayed with a bacterial suspension of C. testosteroni. The fourth group included seedlings sprayed with both AgNPs and a nutrient-free bacterial suspension of C. testosteroni. The treatment protocol was carried out for 21 days, and then the plants were washed with sterile distilled water, rinsed, and prone to physiological analysis [28].

4.5. Quantification of Photosynthetic Pigments

The chlorophyll content was determined by homogenizing 0.2 g of mushy leaves in 80% chilled acetone (10 mL) in the dark, then was carried out using 100% acetone [72]. Carotenoid content and anthocyanin pigment were assessed according to Afroz et al. [2].

4.6. Determination of Non-Antioxidant Enzymes

4.6.1. Determination of Soluble Sugars, Soluble Protein, and Proline

A 0.2 g of mushy leaves were homogenized in 10 mL 96% ethanol (v/v) then washed by 5 mL 70% ethanol (v/v). Subsequently, the prepared extract was centrifuged for 10 min at 3500 g, and the supernatant was put away at 4 °C for measurement. Total soluble sugar concentrations were determined by boiling 3 mL of freshly prepared anthrone reagent (100 mL of 72% sulfuric acid (v/v) containing 150 mg anthrone) with 0.1 mL of the alcohol extract for 10 min. After cooling, the absorbance was recorded at 625 nm using a spectrophotometer (UV-1900 BMS, Duisburg, Germany) to gauge total soluble sugars′ quantity using a glucose standard curve [73]. For total soluble protein assay, about 0.5 g of fresh-ground leaves were well homogenized in phosphate buffer (0.05 M-pH 7.8) under cooling, filtered, and centrifuged for 10 min 12,000× g at 4 °C. Uv-Vis spectrum was noted at 595 nm [74]. A 0.5 g of green leaves were soaked in 5 mL of 3% sulfosalicylic acid. About 2 mL of 1% ninhydrin (w/v) in 60% acetic acid (v/v), 20% ethanol (v/v) were mixed with the plant extract and boiled in a water bath at 100 °C for 30 min. After cooling, 6 mL of toluene was added to a separate chromophore gauged at 520 nm [75].

4.6.2. Determination of Hydrogen Peroxide (H2O2) and Malondialdehyde (MDA)

H2O2 content of plant leaves was calorimetrically measured as Mukherjee and Choudhuri [76]. Aliquot of 200 μL acetone extract was mixed with 0.04 mL of 0.1% TiO2 and 0.2 mL NH4OH (20%). The pellet was decollated with acetone and resuspended in 0.8 mL H2SO4. The mixture was then centrifuged at 6000 g for 15 min, and the supernatant was read at 415 nm. The MDA determination showed by Wu estimated lipid peroxidation level [77]. The frozen specimens were crushed in fluid nitrogen and then extracted in 5 mL of 0.5% thiobarbituric acid (TBA), which disintegrated in 5% trichloroacetic acid (TCA). The extract was boiled for 40 min, immediately cooled, and centrifuged for 10 min at 12,000 g. Spectral analysis was carried out at 523 nm. An extinction coefficient of 155 mM L−1 cm−1 was used to determine lipid peroxidation level.

4.6.3. Determination of Total Phenolic (TPC), Ascorbic Acid (AsA), and Glutathione (GSH)

Approximately 100 µL plant extract was combined with Folin–Ciocalteu reagent (0.75 mL) at 22 °C for 5 min. Then, 0.75 mL of Na2CO3 was incubated with the mixture at 22 °C for 90 min. The absorbance was monitored at 725 nm [78]. Ascorbic acid was determined according to [79]. About 1g of plant leaves was homogenized immediately in fluid nitrogen, extracted with 10 mL 5% (w/v) trichloroacetic acid (TCA), and then centrifuged at 4 °C for 5 min at 15,000 g. The supernatant was immediately investigated for AsA content in a 1 mL reaction mixture containing 50 µL 10 mM dithiothreitol (DDT), 100 µL 0.2 M phosphate buffer (pH 7.4), 0.5% (v/v) N-ethylmaleimide, 10% (w/v) trichloroacetic acid (TCA), 42% (v/v) H3PO4, 4% (v/v) 2,2′-Diphyridyl, and 3% (w/v) FeCl3. The spectral analysis was estimated at 525 nm. GSH was estimated, according to Anderson [80], where nearly 0.5 g mushy leaves were macerated in 2 mL 5% sulfosalicylic acid undercooling and centrifuged at 12000 g for 10 min. A mixture of 0.5 mL supernatant, 0.6 mL of phosphate buffer (100 mM), pH 7, and 40 µL of 5′5′-dithiobis-2-nitrobenzoic acid (DNTB) was prepared. After 2 min, the absorbance was observed at 412 nm.

4.7. Determination of Antioxidant Enzymes

Almost 0.5 g of green leaves were ground, homogenized, filtered, and centrifuged at 12,000 g for 10 min at 4 °C [81]. Superoxide dismutase (SOD) was determined following Li et al. [82]. Potassium phosphate buffer (50 mM, pH 7.8), 13 mM methionine, 75 µL NBT, 2 µL riboflavin, 0.1 mM EDTA was mixed with 100 µL of plant extract. The units of enzymes exploited to inhibit the reduction of 50% of the nitro blue tetrazolium (NBT) represent one unit of SOD activity, which was estimated at 560 nm. To determine Catalase (CAT) A reaction mixture composed of 100 µL plant extract, 100 µL 0.3 M H2O2, 2 mM EDTA and 2.8 mL phosphate buffer (0.050 M, pH 7). The CAT activity was estimated using the formula (ε = 39.4 mM−1cm−1) by checking the absorbance decline at 240 nm because of H2O2 disappearance [83].
Assay of Peroxidase POD activity was carried out as per Zhou and Leul [84]. A mixture of 50 mM potassium phosphate buffer (pH 7), 0.4% H2O2, 1% guaiacol, and 100 µL enzyme extract was subjected to spectral analysis to monitor the variation absorbance because of guaiacol at 470 nm. Ascorbate peroxidase (APX) was assayed as Nakano and Asada [85]. A mixture of 100 µL enzyme extract, 2.7 mL potassium phosphate buffer (25 mM), 100 µL H2O2 (300 mM), 100 µL ascorbate (7.5 mM), and 2 mM EDTA (pH 7) were mixed well. The alteration detected the oxidation of ascorbate in absorbance at 290 nm (ε = 2.8 mM−1cm−1). The glutathione reductase (G.R.) enzyme activity was measured after trice monitoring the state of oxidation of NADPH taken at 340 nm and activity expressed as ∆ A340 min−1 mg−1 protein [86].

4.8. Statistical Analysis

Data were subjected to analysis using two-way analysis of variance (ANOVA), and the honestly significant difference (HSD) at p < 0.05 probability level using Tukey post hoc test to compare the differences among treatment means using SAS software (version 9.1 Institute, Cary, NC, USA) [87].

5. Conclusions

It is deduced that C. testosteroni and silver nanoparticles are jointly involved in ameliorating tolerance of linseed to salt stress. This manuscript reports a unique study describing the positive effects of AgNPs on linseed growth under salinity. C. testosteroni and silver nanoparticles′ synergistic interaction stimulated the production of photosynthetic pigments, sugars, proteins, proline, and antioxidants, whether enzymatic or nonenzymatic, lowered the contents of H2O2 and MDA. Thus, AgNPs combined with C. testosteroni might cultivate linseed plants and energize plants′ growth and economic yield growing in highly salted soils.

Supplementary Materials

The following are available online at https://www.mdpi.com/article/10.3390/plants10040790/s1, Figure S1. FT-IR spectrum of bio-synthesized AgNPs by Rosmarinus officinalis L. plants extract. Figure S2. SEM micrograph of AgNPs bio-synthesized by Rosmarinus officinalis L. plants extract.

Author Contributions

Conceptualization, A.K.; methodology, M.K.; validation, A.K. and M.K.; formal analysis, M.K.; data curation, A.K.; writing—original draft preparation, A.K., M.K. and H.M.; writing—review and editing, H.M. All authors have read and agreed to the published version of the manuscript.

Funding

This research was funded by the Deanship of Scientific Research at King Khalid University, General Research Project (GRP.1/192/41).

Institutional Review Board Statement

Not applicable.

Informed Consent Statement

Not applicable.

Data Availability Statement

The data presented in this study are available on request from the corresponding author.

Acknowledgments

The authors extend their appreciation to the Research Center of Advanced Materials- King Khalid University, Saudi Arabia, for technical support.

Conflicts of Interest

The authors declare no conflict of interest. The funders had no role in the study′s design; in the collection, analyses, or interpretation of data; in the manuscript′s writing, or in the decision to publish the results.

References

  1. Hasegawa, P.M.; Bressan, R.A.; Zhu, J.K.; Bohnert, H.J. Plant cellular and molecular responses to high salinity. Annu. Rev. Plant Biol. 2000, 51, 463–499. [Google Scholar] [CrossRef] [PubMed] [Green Version]
  2. Afroz, S.; Mohammad, F.; Hayat, S.; Siddiqui, M.H. Exogenous Application of Gibberellic Acid Counteracts the Ill Effect of Sodium Chloride in Mustard. Turk. J. Biol. 2005, 29, 233–236. [Google Scholar]
  3. Habib, S.H.; Kausar, H.; Saud, H.M. Plant Growth-Promoting Rhizobacteria Enhance Salinity Stress Tolerance in Okra through ROS-Scavenging Enzymes. BioMed Res. Int. 2016, 2016, 2016. [Google Scholar] [CrossRef] [Green Version]
  4. Khan, M.N.; Siddiqui, M.H.; Mohammad, F.; Naeem, M.; Khan, M.M.A. Calcium chloride and gibberellic acid protect linseed (Linum usitatissimum L.) from NaCl stress by inducing antioxidative defense system and osmoprotectant accumulation. Acta Physiol. Plant. 2010, 32, 121–132. [Google Scholar] [CrossRef]
  5. Allaby, R.G.; Peterson, G.W.; Merriwether, D.A.; Fu, Y.B. Evidence of the domestication history of flax (Linum usitatissimum L.) from the genetic diversity of the sad2 locus. Theor. Appl. Genet. 2005, 112, 58–65. [Google Scholar] [CrossRef] [PubMed]
  6. Weisany, W.; Sohrabi, Y.; Heidari, G.; Siosemardeh, A.; Kazem, G.G. Physiological responses of soybean (Glycine max L.) to zinc application under salinity stress. Aust. J. Crop Sci. 2011, 5, 1441–1447. [Google Scholar]
  7. Abdel Latef, A.A.H.; Abu Alhmad, M.F.; Abdelfattah, K.E. The Possible Roles of Priming with ZnO Nanoparticles in Mitigation of Salinity Stress in Lupine (Lupinus termis) Plants. J. Plant Growth Regul. 2017, 36, 60–70. [Google Scholar] [CrossRef]
  8. Iqbal, M.S.; Singh, A.K.; Singh, S.P.; Ansari, M.I. Nanoparticles and Plant Interaction with Respect to Stress Response. In Nanomaterials and Environmental Biotechnology; Springer: Cham, Switzerland, 2020. [Google Scholar] [CrossRef]
  9. Maroufpour, N.; Mousavi, M.; Abbasi, M.; Ghorbanpour, M. Biogenic nanoparticles as novel sustainable approach for plant protection. In Biogenic Nano-Particles and Their Use in Agro-Ecosystems; Springer: Singapore, 2020. [Google Scholar] [CrossRef]
  10. Gupta, S.D.; Agarwal, A.; Pradhan, S. Phytostimulatory effect of silver nanoparticles (AgNPs) on rice seedling growth: An insight from antioxidative enzyme activities and gene expression patterns. Ecotox. Environ. Safe. 2018, 161, 624–633. [Google Scholar] [CrossRef]
  11. Dewez, D.; Goltsev, V.; Kalaji, H.M.; Oukarroum, A. Inhibitory effects of silver nanoparticles on photosystem II performance in Lemna gibba probed by chlorophyll fluorescence. Curr. Plant Biol. 2018, 16, 15–21. [Google Scholar] [CrossRef]
  12. Anjum, N.A.; Gill, S.S.; Duarte, A.C.; Pereira, E.; Ahmad, I. Silver nanoparticles in soil-plant systems. J. Nanoparticle Res. 2013, 15, 1–26. [Google Scholar] [CrossRef]
  13. Dewez, C.; Domingo, G.; Onelli, E.; De Mattia, F.; Bruni, I.; Marsoni, M.; Bracale, M. Phytotoxic and genotoxic effects of silver nanoparticles exposure on germinating wheat seedlings. J. Plant Physiol. 2014, 171, 1142–1148. [Google Scholar] [CrossRef] [Green Version]
  14. Rossi, L.; Zhang, W.; Lombardini, L.; Ma, X. The impact of cerium oxide nanoparticles on the salt stress responses of Brassica napus L. Environ. Pollut. 2016, 219, 28–36. [Google Scholar] [CrossRef] [PubMed] [Green Version]
  15. Almutairi, Z.M. Influence of silver nanoparticles on the salt resistance of tomato (Solanum lycopersicum) during germination. Int. J. Agric. Biol. 2016, 18, 449–457. [Google Scholar] [CrossRef] [Green Version]
  16. Sharma, G.K.; Mahajan, S.; Matura, R.; Subramaniam, S.; Mohapatra, J.K.; Pattnaik, B. Quantitative single dilution liquid phase blocking ELISA for sero-monitoring of foot-and-mouth disease in India. Biologicals 2015, 43, 158–164. [Google Scholar] [CrossRef]
  17. Zea, L.; Salama, H.M.H. Effects of silver nanoparticles in some crop plants, Common bean (Phaseolus vulgaris L.) and corn. Int. Res. J. Biotech. 2012, 3, 190–197. Available online: http://www.interesjournals.org/IRJOB/Pdf/2012/December/Salama.pdf (accessed on 5 August 2020).
  18. Barriuso, J.; Ramos Solano, B.; Lucas, J.A.; Lobo, A.P.; García-Villaraco, A.; Gutiérrez Mañero, F.J. Ecology, Genetic Diversity and Screening Strategies of Plant Growth Promoting Rhizobacteria (PGPR). J. Plant Nutr. 2008, 4, 1–17. [Google Scholar] [CrossRef]
  19. Kloepper, J.W.; Leong, J.; Teintze, M.; Schroth, M.N. Pseudomonas siderophore: A mechanism explaining disease-suppressive soils. Curr. Microbiol. 1980, 4, 317–320. [Google Scholar] [CrossRef]
  20. Patten, C.L.; Glick, B.R. Role of Pseudomonas putida indoleacetic acid in development of the host plant root system. Appl. Environ. Microb. 2002, 68, 3795–3801. [Google Scholar] [CrossRef] [Green Version]
  21. Lesueur, D.; Deaker, R.; Herrmann, L.; Bräu, L.; Jansa, J. The production and potential of biofertilizers to improve the crop. In Bioformulations: For Sustainable Agriculture; Springer: New Delhi, India, 2016. [Google Scholar] [CrossRef]
  22. Bae, H.S.; Lee, J.M.; Kim, Y.B.; Lee, S.T. Biodegradation of the mixtures of 4-chlorophenol and phenol by Comamonas testosteroni CPW301. Biodegradation 1996, 7, 463–469. [Google Scholar] [CrossRef] [PubMed]
  23. Zheng, S.; Su, J.; Wang, L.; Yao, R.; Wang, D.; Deng, Y.; Rensing, C. Selenite reduction by the obligate aerobic bacterium Comamonas testosteroni S44 isolated from a metal-contaminated soil. BMC Microbiol. 2014, 14, 14. [Google Scholar] [CrossRef]
  24. Kloepper, J.W.; Reddy, M.S.; Rodriguez-Kabana, R.; Kenney, D.S.; Kokalis-Burelle, N.; Martinez-Ochoa, N.; Vavrina, C.S. Application for rhizobacteria in transplant production and yield enhancement. Acta Hortic. 2004, 631, 217–229. [Google Scholar] [CrossRef]
  25. Zhu, D.; Xie, C.; Huang, Y.; Sun, J.; Zhang, W. Description of Comamonas serinivorans sp. nov., isolated from wheat straw compost. Int. J. Syst. Evol. Microbiol. 2014, 64, 4141–4146. [Google Scholar] [CrossRef] [PubMed] [Green Version]
  26. Ghramh, H.A.; Ibrahim, E.H.; Kilnay, M.; Ahmad, Z.; Alhag, S.K.; Khan, K.A.; Asiri, F.M. Silver Nanoparticle Production by Ruta graveolens and Testing Its Safety, Bioactivity, Immune Modulation, Anticancer, and Insecticidal Potentials. Bioinorg. Chem. Appl. 2020, 1–11. [Google Scholar] [CrossRef]
  27. Franca, J.R.; De Luca, M.P.; Ribeiro, T.G.; Castilho, R.O.; Moreira, A.N.; Santos, V.R.; Faraco, A.A.G. Propolis—Based chitosan varnish: Drug delivery, controlled release and antimicrobial activity against oral pathogen bacteria. BMC Complement Altern. Med. 2014, 14, 478. [Google Scholar] [CrossRef] [PubMed] [Green Version]
  28. Geissler, N.; Hussin, S.; Koyro, H.W. Interactive effects of NaCl salinity and elevated atmospheric CO2 concentration on growth, photosynthesis, water relations, and chemical composition of the potential cash crop halophyte Aster tripolium L. Environ. Exp. Bot. 2009, 65, 220–231. [Google Scholar] [CrossRef]
  29. Naumann, J.C.; Anderson, J.E.; Young, D.R. Linking physiological responses, chlorophyll fluorescence and hyperspectral imagery to detect salinity stress using the physiological reflectance index in the coastal shrub, Myrica cerifera. Remote Sens. Environ. 2008, 112, 3865–3875. [Google Scholar] [CrossRef]
  30. Keutgen, A.J.; Pawelzik, E. Modifications of strawberry fruit antioxidant pools and fruit quality under NaCl stress. J. Agric. Food Chem. 2007, 55, 4066–4072. [Google Scholar] [CrossRef]
  31. Lin, D.; Xing, B. Root uptake and phytotoxicity of ZnO nanoparticles. Environ. Sci. Technol. 2008, 42, 5580–5585. [Google Scholar] [CrossRef] [PubMed]
  32. Azimi, R.; Borzelabad, M.J.; Feizi, H.; Azimi, A. Interaction of SiO2 nanoparticles with seed prechilling on germination early seedling growth of tall wheatgrass (Agropyron elongatum L.). Pol. J. Chem. Technol. 2014, 16, 25–29. [Google Scholar] [CrossRef] [Green Version]
  33. Shakeel Ahmed, S.; Ahmad, M.; Swami, B.L.; Ikram, S. Green synthesis of silver nanoparticles using Azadirachta indica aqueous leaf extract. J. Radiat. Res. Appl. Sci. 2016, 9, 1–7. [Google Scholar] [CrossRef] [Green Version]
  34. Thiruvengadam, M.; Gurunathan, S.; Chung, I.M. Physiological, metabolic, and transcriptional effects of biologically-synthesized silver nanoparticles in turnip (Brassica rapa ssp. rapa L.). Protoplasma. 2015, 252, 1031–1046. [Google Scholar] [CrossRef] [PubMed]
  35. Narendhran, S.; Rajiv, P.; Sivaraj, R. Influence of zinc oxide nanoparticles on the growth of Sesamum indicum L. In zinc-deficient soil. Int. J. Pharm. Pharm. Sci. 2016, 8, 365–371. [Google Scholar]
  36. Mohsenzadeh, S.; Moosavian, S.S. Zinc Sulphate, and Nano-Zinc Oxide Effects on Some Physiological Parameters of Rosmarinus officinalis. Am. J. Plant Sci. 2017, 8, 2635–2649. [Google Scholar] [CrossRef] [Green Version]
  37. He, Y.; Du, Z.; Lv, H.; Jia, Q.; Tang, Z.; Zheng, X.; Zhao, F. Green synthesis of silver nanoparticles by Chrysanthemum morifolium Ramat. Extract and their application in clinical ultrasound gel. Int. J. Nanomed. 2013, 8, 1809–1815. [Google Scholar] [CrossRef] [Green Version]
  38. Khoo, H.E.; Azlan, A.; Tang, S.T.; Lim, S.M. Anthocyanidins and anthocyanins: Colored pigments as food, pharmaceutical ingredients, and the potential health benefits. Food Nutr. Res. 2017, 61, 1361779. [Google Scholar] [CrossRef] [PubMed] [Green Version]
  39. Landi, M.; Tattini, M.; Gould, K.S. Multiple functional roles of anthocyanins in plant-environment interactions. Environ. Exp. Bot. 2015, 119, 4–17. [Google Scholar] [CrossRef]
  40. Sharma, A.; Shahzad, B.; Rehman, A.; Bhardwaj, R.; Landi, M.; Zheng, B. Response of the phenylpropanoid pathway and the role of polyphenols in plants under abiotic stress. Molecules 2019, 24, 2452. [Google Scholar] [CrossRef] [PubMed] [Green Version]
  41. Figueiredo, M.D.V.B.; Seldin, L.; de Araujo, F.F.; Mariano, R.D.L.R. Plant Growth Promoting Rhizobacteria: Fundamentals and Applications. In Plant Growth and Health Promoting Bacteria; Springer: Berlin/Heidelberg, Germany, 2010. [Google Scholar] [CrossRef]
  42. Razzaghi Komaresofla, B.; Alikhani, H.A.; Etesami, H.; Khoshkholgh-Sima, N.A. Improved growth and salinity tolerance of the halophyte Salicornia sp. by co-inoculation with endophytic and rhizosphere bacteria. Appl. Soil Ecol. 2019, 138, 160–170. [Google Scholar] [CrossRef]
  43. Zameer, M.; Zahid, H.; Tabassum, B.; Ali, Q.; Nasir, I.A.; Saleem, M.; Butt, S.J. PGPR Potentially Improve Growth of Tomato Plants in Salt-Stressed Environment. Turk. J. Agric. Food Sci. Technol. 2016, 4, 455. [Google Scholar] [CrossRef] [Green Version]
  44. Abdel Latef, A.A. Changes of antioxidative enzymes in salinity tolerance among different wheat cultivars. Cereal Res. Commun. 2010, 38, 43–55. [Google Scholar] [CrossRef]
  45. Ahmad, P.; Ahanger, M.A.; Alyemeni, M.N.; Wijaya, L.; Egamberdieva, D.; Bhardwaj, R.; Ashraf, M. Zinc application mitigates the adverse effects of NaCl stress on mustard [Brassica juncea (L.) czern & coss] through modulating compatible organic solutes, antioxidant enzymes, and flavonoid content. J. Plant Interact. 2017, 12, 429–437. [Google Scholar] [CrossRef] [Green Version]
  46. Mohamed, A.K.S.; Qayyum, M.F.; Abdel-Hadi, A.M.; Rehman, R.A.; Ali, S.; Rizwan, M. Interactive effect of salinity and silver nanoparticles on photosynthetic and biochemical parameters of wheat. Arch. Agron. Soil Sci. 2017, 63, 1736–1747. [Google Scholar] [CrossRef]
  47. Akanbi-Gada, M.A.; Ogunkunle, C.O.; Vishwakarma, V.; Viswanathan, K.; Fatoba, P.O. Phytotoxicity of Nano-zinc oxide to tomato plant (Solanum lycopersicum L.): Zn uptake, stress enzymes response and influence on nonenzymatic antioxidants in fruits. Environ. Technol. Innov. 2019, 14, 100325. [Google Scholar] [CrossRef]
  48. Dodd, I.C.; Pérez-Alfocea, F. Microbial amelioration of crop salinity stress. J. Exp. Bot. 2012, 63, 3415–3428. [Google Scholar]
  49. Upadhyay, S.K.; Singh, J.S.; Saxena, A.K.; Singh, D.P. Impact of PGPR inoculation on growth and antioxidant status of wheat under saline conditions. Plant Biol. 2012, 14, 605–611. [Google Scholar] [CrossRef]
  50. Ahmad, P.; Jaleel, C.A.; Salem, M.A.; Nabi, G.; Sharma, S. Roles of enzymatic and nonenzymatic antioxidants in plants during abiotic stress. Crit. Rev. Biotechnol. 2010, 30, 161–175. [Google Scholar] [CrossRef]
  51. Priyadarshini, S.; Gopinath, V.; Meera Priyadharsshini, N.; MubarakAli, D.; Velusamy, P. Synthesis of anisotropic silver nanoparticles using novel strain, Bacillus flexus, and its biomedical application. Colloid Surf. B 2013, 102, 232–237. [Google Scholar] [CrossRef] [PubMed]
  52. Burman, U.; Saini, M.; Kumar, P. Effect of zinc oxide nanoparticles on growth and antioxidant system of chickpea seedlings. Toxicol. Environ. Chem. 2013, 95, 605–612. [Google Scholar] [CrossRef]
  53. Subramanian, P.; Mageswari, A.; Kim, K.; Lee, Y.; Sa, T. Psychrotolerant endophytic pseudomonas sp. strains OB155 and OS261 induced chilling resistance in tomato plants (Solanum lycopersicum Mill.) by activation of their antioxidant capacity. Mol. Plant Microbe. Interact. 2015, 28, 1073–1081. [Google Scholar] [CrossRef] [Green Version]
  54. Soliman, A.S.; El-feky, S.A.; Darwish, E. Alleviation of salt stress on Moringa peregrina using the foliar application of Nano fertilizers. J. Hortic. Sci. For. 2015, 7, 36–47. [Google Scholar] [CrossRef]
  55. Noctor, G.; Mhamdi, A.; Chaouch, S.; Han, Y.; Neukermans, J.; Marquez-Garcia, B.; Foyer, C.H. Glutathione in plants: An integrated overview. Plant Cell Environ. 2012, 35, 454–484. [Google Scholar] [CrossRef]
  56. Rashad, Y.; Aseel, D.; Hammad, S.; Elkelish, A. Rhizophagus irregularis, and Rhizoctonia solani differentially elicit systemic transcriptional expression of polyphenol biosynthetic pathways genes in sunflower. Biomolecules 2020, 10, 379. [Google Scholar] [CrossRef] [Green Version]
  57. Akbari, M.; Mahna, N.; Ramesh, K.; Bandehagh, A.; Mazzuca, S. Ion homeostasis, osmoregulation, and physiological changes in the roots and leaves of pistachio rootstocks in response to salinity. Protoplasma 2018, 255, 1349–1362. [Google Scholar] [CrossRef] [PubMed]
  58. Soliman, M.; Qari, S.H.; Abu-Elsaoud, A.; El-Esawi, M.; Alhaithloul, H.; Elkelish, A. Rapid green synthesis of silver nanoparticles from blue gum augment growth and performance of maize, fenugreek, and onion by modulating plants cellular antioxidant machinery and genes expression. Acta Physiol. Plant. 2020, 42, 148. [Google Scholar] [CrossRef]
  59. Ochieng, L.A. Agro-Morphological Characterization of Sweet Potato Genotypes Grown in Different Ecological Zones in Kenya. J. Hort. Plant Res. 2019, 5, 1–12. [Google Scholar] [CrossRef]
  60. Abbas, T.; Pervez, M.A.; Ayyub, C.M.; Ahmad, R. Assessment of morphological, antioxidant, biochemical, and ionic responses of salt-tolerant and salt-sensitive okra (Abelmoschus esculentus) under the saline regime. Pak. J. Life Soc. Sci. 2013, 11, 147–153. [Google Scholar]
  61. Ahmad, P.; Ahanger, M.A.; Alyemeni, M.N.; Wijaya, L.; Alam, P.; Ashraf, M. Mitigation of sodium chloride toxicity in Solanum lycopersicum l. By supplementation of jasmonic acid and nitric oxide. J. Plant Interact. 2018, 13, 64–72. [Google Scholar] [CrossRef] [Green Version]
  62. Srivastav, M.; Kishor, A.; Dahuja, A.; Sharma, R.R. Effect of paclobutrazol and salinity onion leakage, proline content, and activities of antioxidant enzymes in mango (Mangifera indica L.). Sci. Hortic. 2010, 125, 785–788. [Google Scholar] [CrossRef]
  63. Lei, Z.; Mingyu, S.; Xiao, W.; Chao, L.; Chunxiang, Q.; Liang, C.; Fashui, H. Antioxidant stress is promoted by Nano-anatase in spinach chloroplasts under UV-B radiation. Biol. Trace Elem. Res. 2008, 121, 69–79. [Google Scholar] [CrossRef]
  64. El-Esawi, M.A.; Alayafi, A.A. Overexpression of rice Rab7 gene improves drought and heat tolerance and increases grain yield in rice (Oryza sativa L.). Genes 2019, 10, 56. [Google Scholar] [CrossRef] [Green Version]
  65. Shrivastava, P.; Kumar, R. Soil salinity: A serious environmental issue and plant growth-promoting bacteria as one of the tools for its alleviation. Saudi J. Biol. Sci. 2015, 22, 23–131. [Google Scholar] [CrossRef] [PubMed] [Green Version]
  66. Islam, F.; Yasmeen, T.; Arif, M.S.; Ali, S.; Ali, B.; Hameed, S.; Zhou, W. Plant growth-promoting bacteria confer salt tolerance in Vigna radiata by upregulating antioxidant defense and biological soil fertility. Plant Growth Regul. 2016, 80, 23–36. [Google Scholar] [CrossRef]
  67. Pérez Rodríguez, N.; Engström, E.; Rodushkin, I.; Nason, P.; Alakangas, L.; öhlander, B. Copper and iron isotope fractionation in mine tailings at the Laver and Kristineberg mines, northern Sweden. Appl. Geochem. 2013, 32, 204–215. [Google Scholar] [CrossRef]
  68. Gururani, M.A.; Upadhyaya, C.P.; Baskar, V.; Venkatesh, J.; Nookaraju, A.; Park, S.W. Plant Growth-Promoting Rhizobacteria Enhance Abiotic Stress Tolerance in Solanum tuberosum through Inducing Changes in the Expression of ROS-Scavenging Enzymes and Improved Photosynthetic Performance. J. Plant Growth Regul. 2013, 32, 245–258. [Google Scholar] [CrossRef]
  69. Kohler, J.; Knapp, B.A.; Waldhuber, S.; Caravaca, F.; Roldán, A.; Insam, H. Effects of elevated CO2, water stress, and inoculation with Glomus intraradices or Pseudomonas mendocina on dry lettuce matter and rhizosphere microbial and functional diversity under growth chamber conditions. J. Soil Sediment. 2010, 10, 1585–1597. [Google Scholar] [CrossRef]
  70. Dolatabadian, A.; Jouneghani, R.S. Impact of exogenous ascorbic acid on antioxidant activity and some physiological traits of common bean subjected to salinity stress. Not. Bot. Horti. Agrobot. Cluj. Napoca. 2009, 37, 165–172. [Google Scholar] [CrossRef]
  71. Esitken, A.; Karlidag, H.; Ercisli, S.; Turan, M.; Sahin, F. The effect of spraying a growth-promoting bacterium on the yield, growth, and nutrient element composition of leaves of apricot (Prunus armeniaca L. cv. Hacihaliloglu). Aust. J. Agric. Res. 2003, 54, 377–380. [Google Scholar] [CrossRef]
  72. Arnon, D.I. Copper Enzymes in Isolated Chloroplasts. Polyphenoloxidase in Beta Vulgaris. Plant Physiol. 1949, 24, 1–15. [Google Scholar] [CrossRef] [PubMed] [Green Version]
  73. Irigoyen, J.J.; Einerich, D.W.; Sánchez-Díaz, M. Water stress-induced changes in proline concentrations and total soluble sugars in nodulated alfalfa (Medicago sativa) plants. Physiol. Plantarum. 1992, 84, 55–60. [Google Scholar] [CrossRef]
  74. Bradford, M. A Rapid and Sensitive Method for the Quantitation of Microgram Quantities of Protein Utilizing the Principle of Protein-Dye Binding. Ann. Biochem. 1976, 72, 248–254. [Google Scholar] [CrossRef]
  75. Bates, L.S.; Waldren, R.P.; Teare, I.D. Rapid determination of free proline for water-stress studies. Plant Soil. 1973, 39, 205–207. [Google Scholar] [CrossRef]
  76. Mukherjee, S.P.; Choudhuri, M.A. Implication of Hydrogen Peroxide–Ascorbate System on Membrane Permeability of Water Stressed Vigna Seedlings. New Phytol. 1985, 99, 355–360. [Google Scholar] [CrossRef]
  77. Wu, F.; Dong, J.; Cai, Y.; Chen, F.; Zhang, G. Differences in Mn uptake and subcellular distribution in different barley genotypes as a response to Cd toxicity. Sci. Total Environ. 2007, 385, 228–234. [Google Scholar] [CrossRef]
  78. Velioglu, Y.S.; Mazza, G.; Gao, L.; Oomah, B.D. Antioxidant Activity and Total Phenolics in Selected Fruits, Vegetables, and Grain Products. J. Agric. Food Chem. 1998, 46, 4113–4117. [Google Scholar] [CrossRef]
  79. Kampfenkel, K.; Van Montagu, M.; Inzé, D. Extraction and determination of ascorbate and dehydroascorbate from plant tissue. Ann. Biochem. 1995, 225, 165–167. [Google Scholar] [CrossRef]
  80. Anderson, M.E. Determination of glutathione and glutathione disulfide in biological samples. Method Enzymol. 1985, 113, 548–555. [Google Scholar] [CrossRef]
  81. Chen, L.S.; Cheng, L. Both xanthophyll cycle-dependent thermal dissipation and the antioxidant system are upregulated in grape (Vitis labrusca L. cv. Concord) leaves in response to N limitation. J. Exp. Bot. 2003, 54, 2165–2175. [Google Scholar] [CrossRef] [PubMed] [Green Version]
  82. Li, B.; Wei, J.; Wei, X.; Tang, K.; Liang, Y.; Shu, K.; Wang, B. Effect of sound wave stress on antioxidant enzyme activities and lipid peroxidation of Dendrobium candidum. Colloid Surf. B 2008, 63, 269–275. [Google Scholar] [CrossRef] [PubMed]
  83. Aebi, H. Catalase in Vitro. Method Enzymol. 1984, 105, 121–126. [Google Scholar] [CrossRef]
  84. Zhou, W.; Leul, M. Uniconazole-induced tolerance of rape plants to heat stress in relation to changes in hormonal levels, enzyme activities, and lipid peroxidation. Plant Growth Regul. 1999, 27, 99–104. [Google Scholar] [CrossRef]
  85. Nakano, Y.; Asada, K. Hydrogen peroxide is scavenged by ascorbate-specific peroxidase in spinach chloroplasts. Plant Cell Physiol. 1981, 22, 867–880. [Google Scholar] [CrossRef]
  86. Rao, M.V.; Paliyath, G.; Ormrod, D.P. Ultraviolet-B- and ozone-induced biochemical changes in antioxidant enzymes of Arabidopsis thaliana. Plant Physiol. 1996, 110, 125–136. [Google Scholar] [CrossRef] [PubMed] [Green Version]
  87. Statistical Analysis System; SAS Release 9.1 for Windows; SAS Institute Inc.: Cary, NC, USA, 2003.
Figure 1. Color change and UV-Visible spectral analysis of Rosmarinus officinalis plant extract and synthesized AgNPs. Where (A) denotes a plant extract, (B) denotes plant extract, and AgNO3, (C) denotes spectral analysis of plant extract, and (D) denotes spectral analysis of synthesized AgNPs.
Plants 10 00790 g001
Table 1. Impact of AgNPs, C. testosteroni, and their combination on chlorophyll-a, chlorophyll-b, total chlorophyll, carotenoids, and anthocyanin pigments of Linum usitatissimum L. plants under salinity stress (0, 25, 50, and 100 mM NaCl). Mean ± Sd values for treatment over three replications. According to Tukey′s test, different letters within the same columns show significant differences (p < 0.05). The higher cases are the differences among salinity treatments, and the lower cases are the differences among AgNPs+C.t treatments′ mean. ns: means not significant.
Salinity Levels/TreatmentsChlorophyll-a (mg/g)Chlorophyll-b (mg/g)Total Chlorophyll (mg/g)Carotenoids (mg/g)Anthocyanin (mg/g)
0.0 mM NaClControl1.27 ± 0.0890.97 ± 0.0822.06 ± 0.0080.63 ± 0.0330.31 ± 0.024
AgNPs1.32 ± 0.0651.02 ± 0.0362.34 ± 0.0030.68 ± 0.0450.35 ± 0.169
C.t1.29 ± 0.0310.99 ± 0.0242.28 ± 0.0060.65 ± 0.0610.33 ± 0.143
AgNPs + C. t1.38 ± 0.0221.05 ± 0.0172.43 ± 0.0010.73 ± 0.1830.39 ± 0.008
NaCl treatment Mean1.32 ± 0.052 A1.01 ± 0.04 A2.28 ± 0.005 A0.67 ± 0.08 D0.35 ± 0.087 C
25 mM NaClControl1.19 ± 0.0340.91 ± 0.0462.10 ± 0.0120.69 ± 0.0260.39 ± 0.014
AgNPs1.23 ± 0.0680.97 ± 0.0232.20 ± 0.0670.74 ± 0.0030.47 ± 0.157
C.t.1.21 ± 0.0470.93 ± 0.0542.14 ± 0.0050.71 ± 0.1170.43 ± 0.082
AgNPs + C. t1.25 ± 0.0210.99 ± 0.0912.24 ± 0.0020.78 ± 0.0930.51 ± 0.163
NaCl treatment Mean1.23 ± 0.043 B0.95 ± 0.038 A2.17 ± 0.022 A0.73 ± 0.06 C0.45 ± 0.104 B
50 mM NaClControl1.12 ± 0.0400.82 ± 0.0761.94 ± 0.0080.74 ± 0.0850.42 ± 0.079
AgNPs1.16 ± 0.0790.89 ± 0.0902.05 ± 0.0360.80 ± 0.1310.46 ± 0.181
C.t.1.14 ± 0.0220.84 ± 0.0541.98 ± 0.0040.76 ± 0.0600.44 ± 0.003
AgNPs + C. t1.18 ± 0.0110.93 ± 0.0272.11 ± 0.0730.83 ± 0.0070.49 ± 0.001
NaCl treatment Mean1.15 ± 0.038 B0.87 ± 0.050 B2.02 ± 0.03 B0.78 ± 0.07 B0.45 ± 0.07 B
100 mM NaClControl0.98 ± 0.0450.63 ± 0.0331.61 ± 0.0210.82 ± 0.0120.45 ± 0.086
AgNPs1.06 ± 0.0370.69 ± 0.0251.75 ± 0.0090.85 ± 0.0780.51 ± 0.191
C.t.1.02 ± 0.0810.67 ± 0.0911.69 ± 0.0160.83 ± 0.1640.48 ± 0.054
AgNPs + C. t1.10 ± 0.0340.72 ± 0.0861.82 ± 0.0420.87 ± 0.0510.53 ± 0.008
NaCl treatment Mean1.04 ± 0.05 C0.68 ± 0.06 C1.72 ± 0.022 C0.84 ± 0.08 A0.49 ± 0.085 A
(Ag/Ct) treatment Mean
Control1.14 ± 0.052 c0.83 ± 0.060 d1.93 ± 0.012 d0.72 ± 0.041 d0.39 ± 0.050 d
AgNPs1.19 ± 0.062 b0.89 ± 0.044 b2.08 ± 0.028 b0.77 ± 0.064 b0.45 ± 0.174 b
C. t1.17 ± 0.045 b0.86 ± 0.056 c2.02 ± 0.008 c0.74 ± 0.101 c0.42 ± 0.071 c
AgNPs + C. t1.23 ± 0.022 a0.92 ± 0.055 a2.15 ± 0.029 a0.81 ± 0.084 a0.48 ± 0.045 a
An honestly significant difference (HSD) at p < 0.05 probability level using Tukey′s test for:
NaCl treatments0.0750.0520.1260.0590.035
(Ag/Ct) treatment 0.0330.0230.0560.0250.015
NaCl × Ag/C. t Interactionnsnsnsnsns
Table 2. Impact of AgNPs, C. testosteroni and their combination on soluble sugar, soluble proteins, proline, hydrogen peroxide, and lipid peroxidation of Linum usitatissimum L. plants under salinity stress (0, 25, 50, and 100 mM NaCl). Mean ± Sd values for treatment over three replications. According to Tukey′s test, different letters within the same columns show significant differences (p < 0.05). The higher cases are the differences among salinity treatments, and the lower cases are the differences among AgNPs + C.t treatments′ mean. ns: means not significant.
Salinity Levels/Treatments Soluble Sugar mg/gSoluble Proteins mg/gProline mg/gHydrogen Peroxide µg/LLipid Peroxidation µg/L
0.0 mM NaClControl121.56 ± 1.39424.87 ± 1.85110.23 ± 0.1742.58 ± 0.04520.87 ± 0.021
AgNPs127.22 ± 1.27127.39 ± 1.66415.19 ± 0.1531.61 ± 0.00519.33 ± 0.065
C. t124.61 ± 1.38225.01 ± 1.04112.68 ± 0.121.81 ± 0.07920.01 ± 0.028
AgNPs + Ct131.80 ± 1.19030.44 ± 1.00917.45 ± 0.181.98 ± 0.01219.82 ± 0.061
NaCl treatment Mean126.3 ± 1.31 B26.93 ± 1.40 D13.89 ± 0.16 D 2.0 ± 0.035 D19.93 ± 0.044 D
25 mM NaClControl128.64 ± 1.00628.03 ± 1.06113.97 ± 0.1204.04 ± 0.00423.88 ± 0.011
AgNPs134.21 ± 1.03731.68 ± 1.04317.99 ± 0.1043.72 ± 0.09121.91 ± 0.083
C. t131.99 ± 1.98228.99 ± 1.92714.05 ± 0.1453.96 ± 0.06722.06 ± 0.003
AgNPs + Ct137.01 ± 1.00335.05 ± 1.08220.74 ± 0.1913.89 ± 0.04322.01 ± 0.092
NaCl treatment Mean131.61 ± 1.257 AB30.94 ± 1.28 C16.69 ± 0.14 C3.90 ± 0.051 C22.47 ± 0.047 C
50 mM NaClControl131.85 ± 1.48131.40 ± 1.04919.62 ± 0.1575.35 ± 0.002829.65 ± 0.006
AgNPs136.42 ± 1.03134.26 ± 1.00323.08 ± 0.1404.92 ± 0.00127.34 ± 0.073
C. t133.97 ± 1.15632.41 ± 1.01722.49 ± 0.1285.12 ± 0.03528.51 ± 0.039
AgNPs + Ct137.39 ± 1.29438.98 ± 1.05026.73 ± 0.1235.03 ± 0.00928.93 ± 0.020
NaCl treatment Mean134.91 ± 1.241 A34.26 ± 1.03 B22.98 ± 0.137 B4.65 ± 0.012 B28.61 ± 0.035 B
100 mM NaClControl137.79 ± 1.00335.29 ± 1.00122.89 ± 0.1827.19 ± 0.01535.40 ± 0.031
AgNPs141.23 ± 1.93239.58 ± 1.05426.65 ± 0.1156.80 ± 0.07034.21 ± 0.002
C. t139.95 ± 1.09636.99 ± 1.08223.04 ± 0.1716.93 ± 0.04134.76 ± 0.007
AgNPs + C. t143.11 ± 1.80042.17 ± 1.03829.95 ± 0.1856.90 ± 0.08235.02 ± 0.059
NaCl treatment Mean140.52 ± 1.458 A38.51 ± 1.04 A25.63 ± 0.163 AA6.96 ± 0.052 A34.85 ± 0.025 A
(Ag/ Ct) treatment Mean
Control129.96 ± 1.221 c29.9 ± 1.24 d16.68 ± 0.16 d4.79 ± 0.02 a27.45 ± 0.02 a
AgNPs134.77 ± 1.32 ab33.23 ± 1.19 b20.73 ± 0.13 b4.26 ± 0.04 c25.7 ± 0.06 b
C.t132.63 ± 1.40 bc30.85 ± 1.27 c18.07 ± 0.14 c4.46 ± 0.06 bc26.36 ± 0.02 ab
AgNPs + C. t137.33 ± 1.32 a36.66 ± 1.04 a23.72 ± 0.17 a4.45 ± 0.04 b26.45 ± 0.06 a
An honestly significant difference (HSD) at p < 0.05 probability level using Tukey′s test for:
NaCl treatments9.712.791.990.4820.502
(Ag/Ct) treatment Mean4.141.210.8530.1880.015
NaCl × Ag/C. t Interactionnsns2.4; 3.6*0.53; 2.42ns
* Comparisons of means for the same level of salt (HSD = 2.4) and different levels of salt (HSD = 3.6).
Table 3. Impact of AgNPs, C. testosteroni, and their combination on total phenolics (TPC), ascorbic acid (AsA), and glutathione (GSH) of Linum usitatissimum L. plants under salinity stress (0, 25, 50, and 100 mM NaCl). Mean ± Sd values for treatment over three replications. According to Tukey′s test, different letters within the same columns show significant differences (p < 0.05). The higher cases are the differences among salinity treatments, and the lower cases are the differences among AgNPs + C.t treatments′ mean. ns: means not significant.
Salinity/AgNPs + Ct TreatmentsTPC mg/gAsA mg/gGSH nM/g
0.0 mM NaClControl5.24 ± 0.1157.66 ± 0.005360.34 ± 0.176
AgNPs5.61 ± 0.10212.04 ± 0.062386.98 ± 0.139
C. t5.38 ± 0.17610.92 ± 0.017379.01 ± 0.023
AgNPs + C.t5.57 ± 0.1929.97 ± 0.043380.43 ± 0.105
NaCl treatment Mean5.45 ± 0.156 D10.15 ± 0.032 D376.69 ± 0.11 C
25 mM NaClControl8.12 ± 0.17111.84 ± 0.098371.92 ± 0.199
AgNPs9.03 ± 0.17314.73 ± 0.002390.06 ± 0.132
C. t8.72 ± 0.10512.06 ± 0.083386.55 ± 0.101
AgNPs + C. t8.50 ± 0.18312.87 ± 0.063388.72 ± 0.102
NaCl treatment Mean8.59 ± 0.158 C12.88 ± 0.062 C384.31 ± 0.133 BC
50 mM NaClControl11.01 ± 0.19715.25 ± 0.065386.59 ± 0.011
AgNPs11.37 ± 0.13117.44 ± 0.0188406.31 ± 0.162
C. t11.25 ± 0.12216.91 ± 0.024399.89 ± 0.190
AgNPs + C. t11.32 ± 0.13417.11 ± 0.029401.57 ± 0.122
NaCl treatment Mean11.24 ± 0.146 B16.68 ± 0.034 B398.59 ± 0.121 AB
100 mM NaClControl13.06 ± 0.16519.06 ± 0.088409.36 ± 0.145
AgNPs13.28 ± 0.19320.82 ± 0.005416.80 ± 0.057
C.t13.09 ± 0.12619.75 ± 0.005410.58 ± 0.168
AgNPs + C. t13.15 ± 0.10420.09 ± 0.061412.11 ± 0.102
NaCl treatment Mean13.145 ± 0.147 A19.93 ± 0.04 A412.21 ± 0.12 A
(Ag/C. t) treatment Mean
Control9.36 ± 0.172 b13.45 ± 0.064 c382.05 ± 0.133 b
AgNPs9.82 ± 0.15 a16.26 ± 0.022 a400.04 ± 0.122 a
C.t9.61 ± 0.132 ab14.91 ± 0.032 b394.01 ± 0.12 a
AgNPs + C. t9.64 ± 0.153 a15.01 ± 0.049 b395.71 ± 0.11 a
An honestly significant difference (HSD) at p < 0.05 probability level using Tukey′s test for:
NaCl treatments0.931.4228.39
(Ag/C. t) treatment Mean0.360.5611.97
NaCl × Ag/C. t Interactionns1.60; 2.51*ns
* Comparisons of means for the same level of salt (HSD = 1.6) and different levels of salt (HSD = 2.51).
Table 4. Impact of AgNPs, C. testosteroni, and their combination on superoxide dismutase (SOD), catalase (CAT), Peroxidase POD, Ascorbate peroxidase APX, and glutathione reductase (G.R) of Linum usitatissimum L. plants under salinity stress (0, 25, 50, and 100 mM NaCl). Mean ± Sd values for treatment over three replications. According to Tukey′s test, different letters within the same columns show significant differences (p < 0.05). The higher cases are the differences among salinity treatments, and the lower cases are the differences among AgNPs + C.t treatments′ mean. ns: means not significant.
Salinity /AgNPs + C. t TreatmentsSOD U/mg ProteinCAT U/mg ProteinPOD U/mg ProteinAPX U/mg ProteinG.R U/mg Protein
0.0 mM NaClControl103.42 ± 0.199205.64 ± 0.191101.26 ± 0.15396.97 ± 0.124120.53 ± 0.112
AgNPs129.50 ± 0.112 220.87 ± 0.113 134.56 ± 0.189 118.26 ± 0.157 145.37 ± 0.117
C. t116.39 ± 0.117 217.02 ± 0.081 117.92 ± 0.127 105.67 ± 0.129 132.65 ± 0.106
AgNPs + C.t121.05 ± 0.143 209.63 ± 0.175 126.55 ± 0.130 112.89 ± 0.108 129.80 ± 0.187
NaCl treatment Mean117.59 ± 0.13 C213.29 ± 0.14 B120.073 ± 0.150 C108.45 ± 0.13 C132.088 ± 0.131 C
25 mM NaClControl119.10 ± 0.156 210.75 ± 0.118 113.68 ± 0.107 104.69 ± 0.113 126.43 ± 0.144
AgNPs132.89 ± 0.103 232.69 ± 0.137 153.54 ± 0.114 130.62 ± 0.194 157.26 ± 0.156
C. t127.75 ± 0.107 224.55 ± 0.122 129.72 ± 0.172 124.17 ± 0.198 140.05 ± 0.107
AgNPs + C. t129.64 ± 0.119 217.22 ± 0.119 134.89 ± 0.183 118.45 ± 0.176 146.33 ± 0.159
NaCl treatment Mean127.3 ± 0.121 C221.31 ± 0.124 B132.96 ± 0.144 AB119.48 ± 0.17 B142.52 ± 0.142 B
50 mM NaClControl125.93 ± 0.130 235.10 ± 0.116 118.51 ± 0.145 113.89 ± 0.151 132.64 ± 0.169
AgNPs154.80 ± 0.127 257.29 ± 0.132 136.92 ± 0129 128.86 ± 0.126 167.39 ± 0.126
C. t141.61 ± 0.109 243.77 ± 0.069 121.87 ± 0.136 119.31 ± 0.023 151.67 ± 0.141
AgNPs + C. t148.78 ± 0.111 248.99 ± 0.185 126.12 ± 0.118 123.11 ± 0.160 162.90 ± 0.101
NaCl treatment Mean142.78 ± 120 B246.23 ± 0.125 A125.86 ± 0.132 BC121.29 ± 0.115 B153.65 ± 0.134 A
100 mM NaClControl133.30 ± 0.106 249.67 ± 0.168 126.63 ± 0.112 116.59 ± 0.127 146.51 ± 0.124
AgNPs168.88 ± 0.159 263.86 ± 0.172 147.95 ± 0.190 148.94 ± 0.004 158.10 ± 0.116
C. t156.31 ± 0.197 251.84 ± 0.015135.16 ± 0.135 123.66 ± 0.139 149.14 ± 0.110
AgNPs + C. t161.07 ± 0.120 257.62 ± 0.04 139.74 ± 0.080 135.07 ± 0.028 153.25 ± 0.108
NaCl treatment Mean154.85 ± 0.145 A255.75 ± 0.098 A137.37 ± 0.129 A131.07 ± 0.075 A151.75 ± 0.115 A
(Ag/C. t) treatment Mean
Control120.44 ± 0.150 b225.29 ± 0.148 c120.44 ± 0.152 d108.04 ± 0.13 d131.53 ± 0.14 d
AgNPs146.48 ± 0.125 b243.66 ± 0.139 a143.24 ± 0.16 a131.67 ± 0.12 a157.03 ± 0.144 a
C. t135.5 ± 0.133 a234.278 ± 0.072 b126.17 ± 0.143 c118.203 ± 0.122 c143.38 ± 0.116 c
AgNPs + C. t140.11 ± 0.123 a233.34 ± 0.130 b131.83 ± 0.128 b122.38 ± 0.118 b148.07 ± 0.139 b
An honestly significant difference (HSD) at p < 0.05 probability level using Tukey′s test for:
NaCl treatments11.1917.979.399.2710.86
(Ag/Ct) treatment Mean4.637.454.063.944.57
NaCl × Ag/C. t Interaction13.13; 20.04*ns11.51; 17.0411.17; 16.743.07; 19.53
* Comparisons of means for the same level of salt (HSD = 13.13) and different levels of salt (HSD = 20.04).
Publisher’s Note: MDPI stays neutral with regard to jurisdictional claims in published maps and institutional affiliations.

