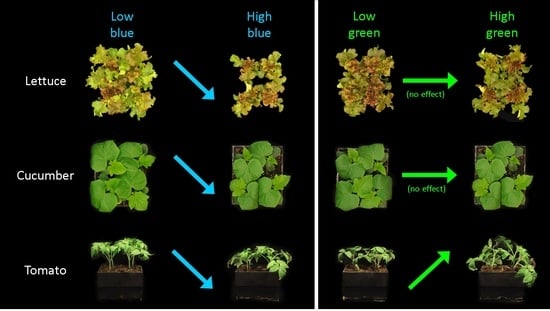
Does Green Really Mean Go? Increasing the Fraction of Green Photons Promotes Growth of Tomato but Not Lettuce or Cucumber
Abstract
1. Introduction
2. Materials and Methods
2.1. Plant Material and Cultural Conditions
2.2. Treatments
2.3. Plant Measurements
2.4. Statistical Analysis
3. Results
3.1. Dry Mass
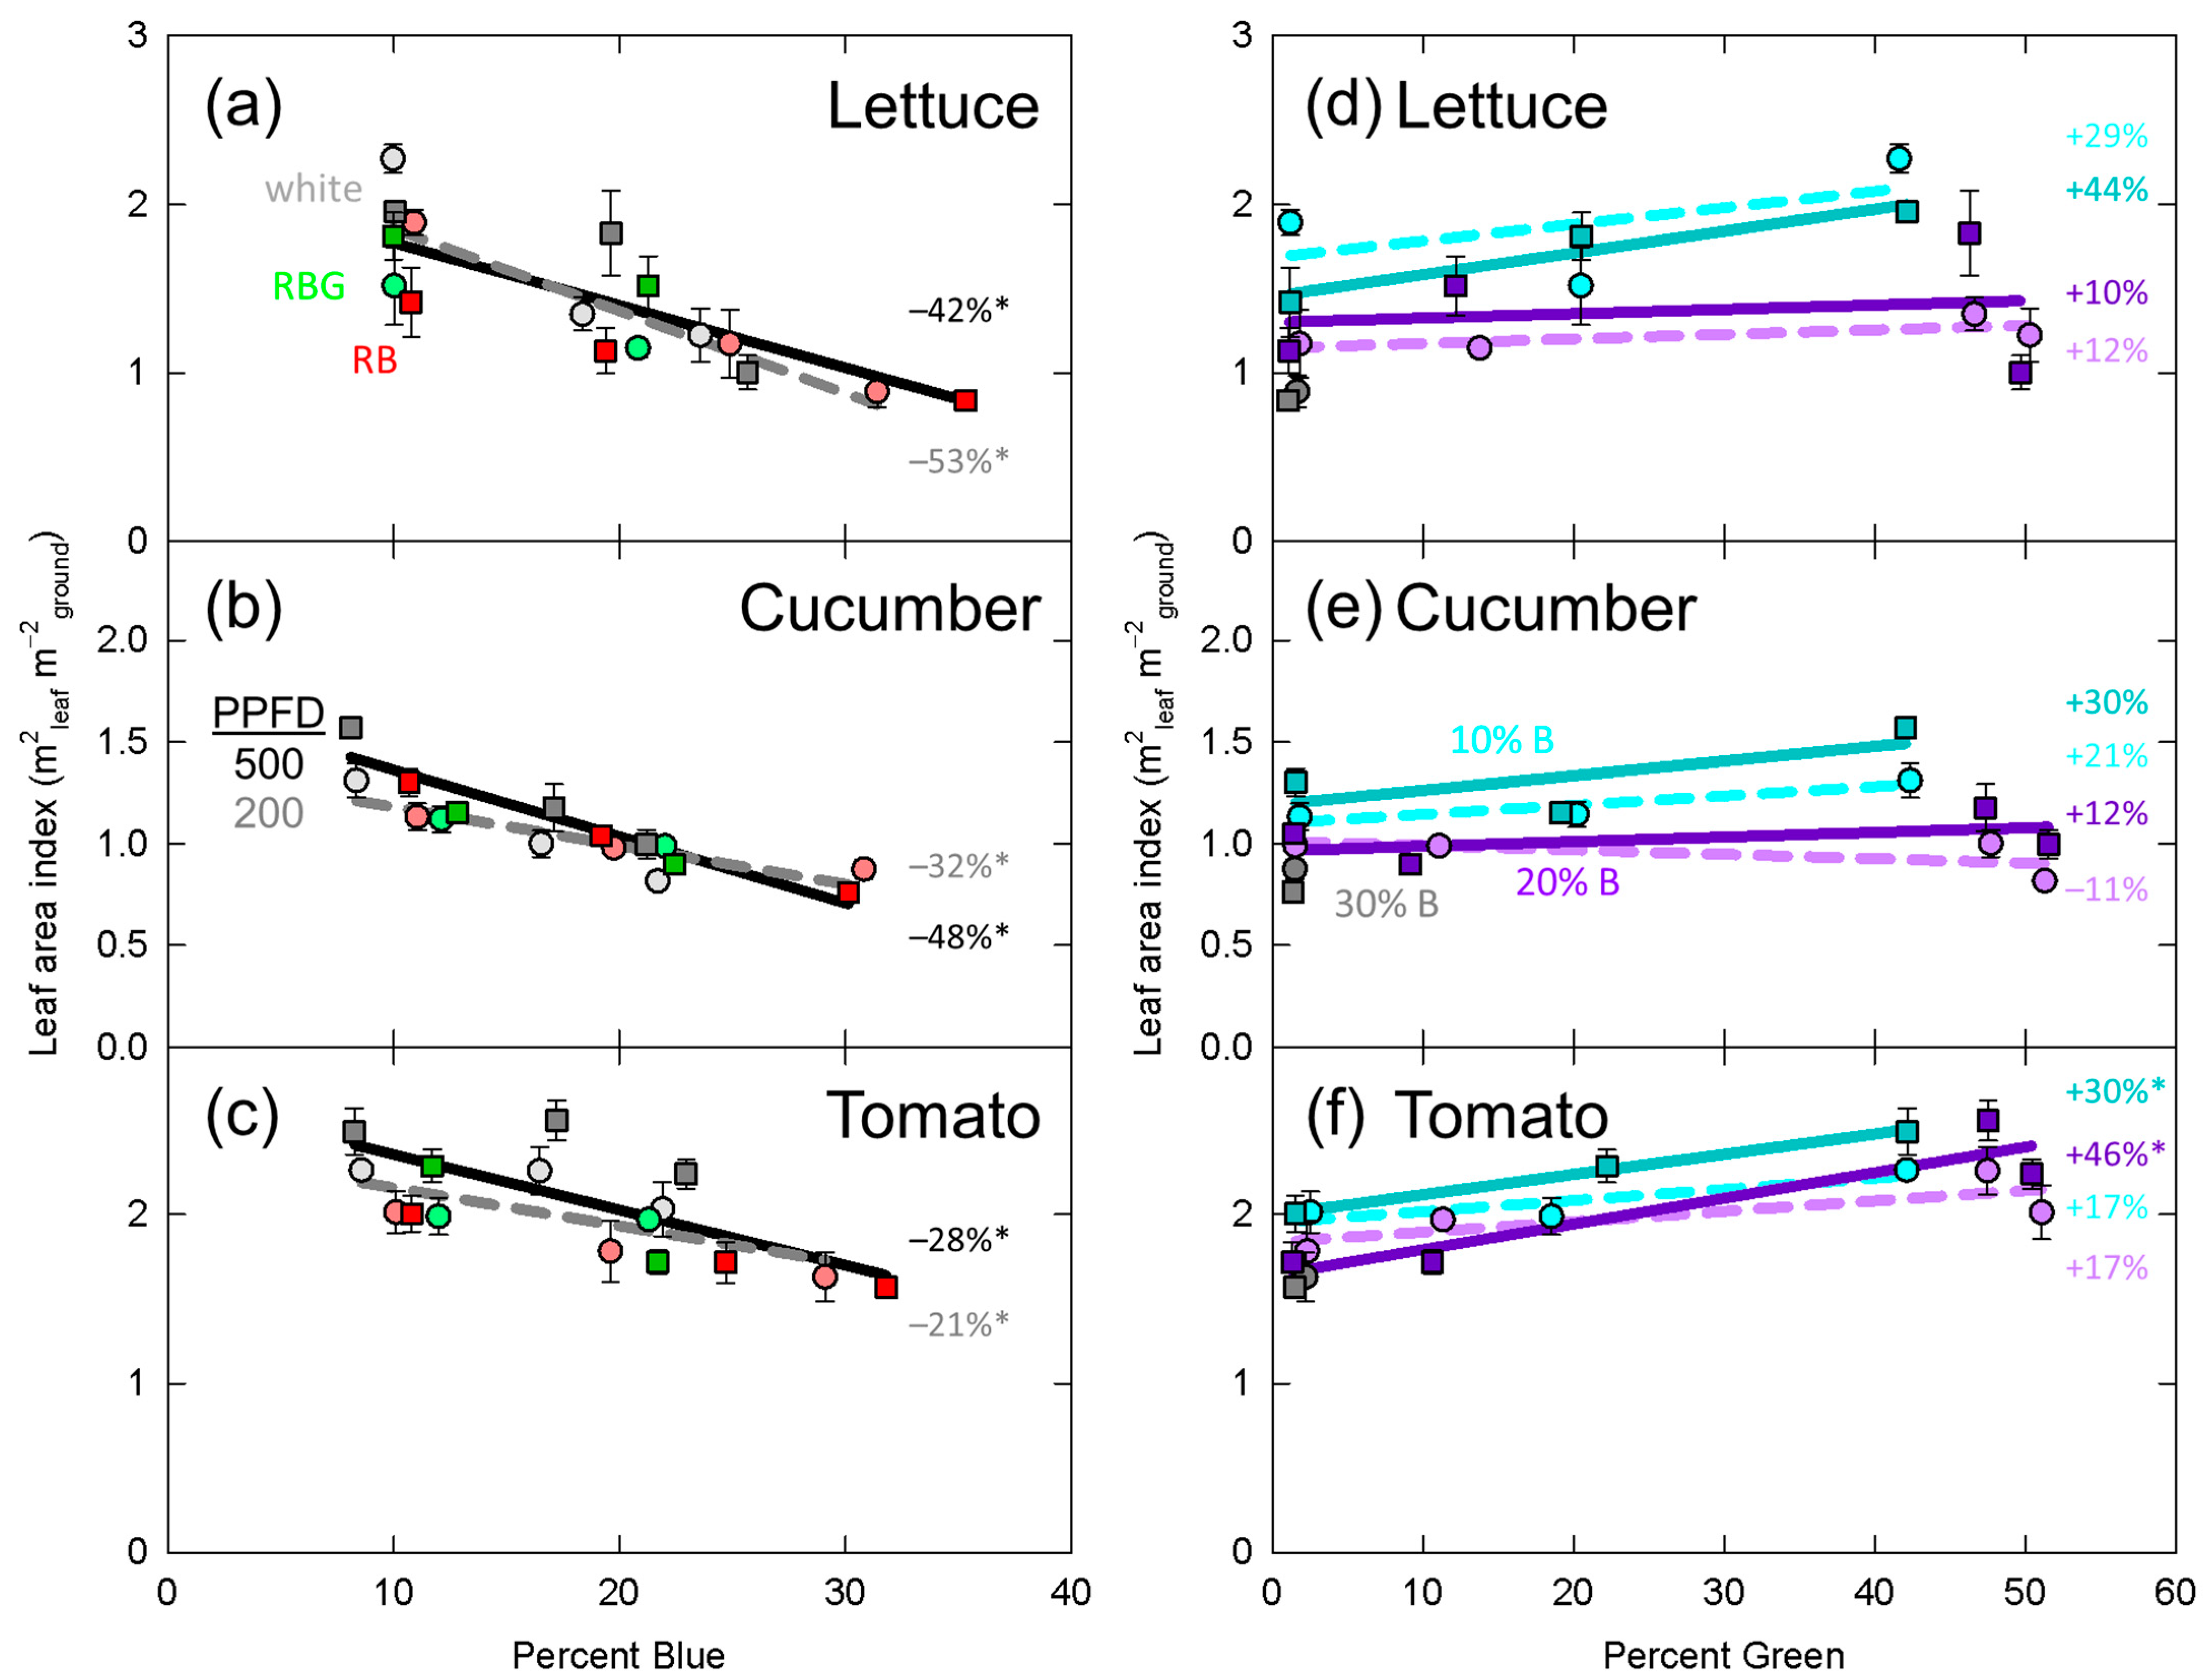
3.2. Leaf Area Index
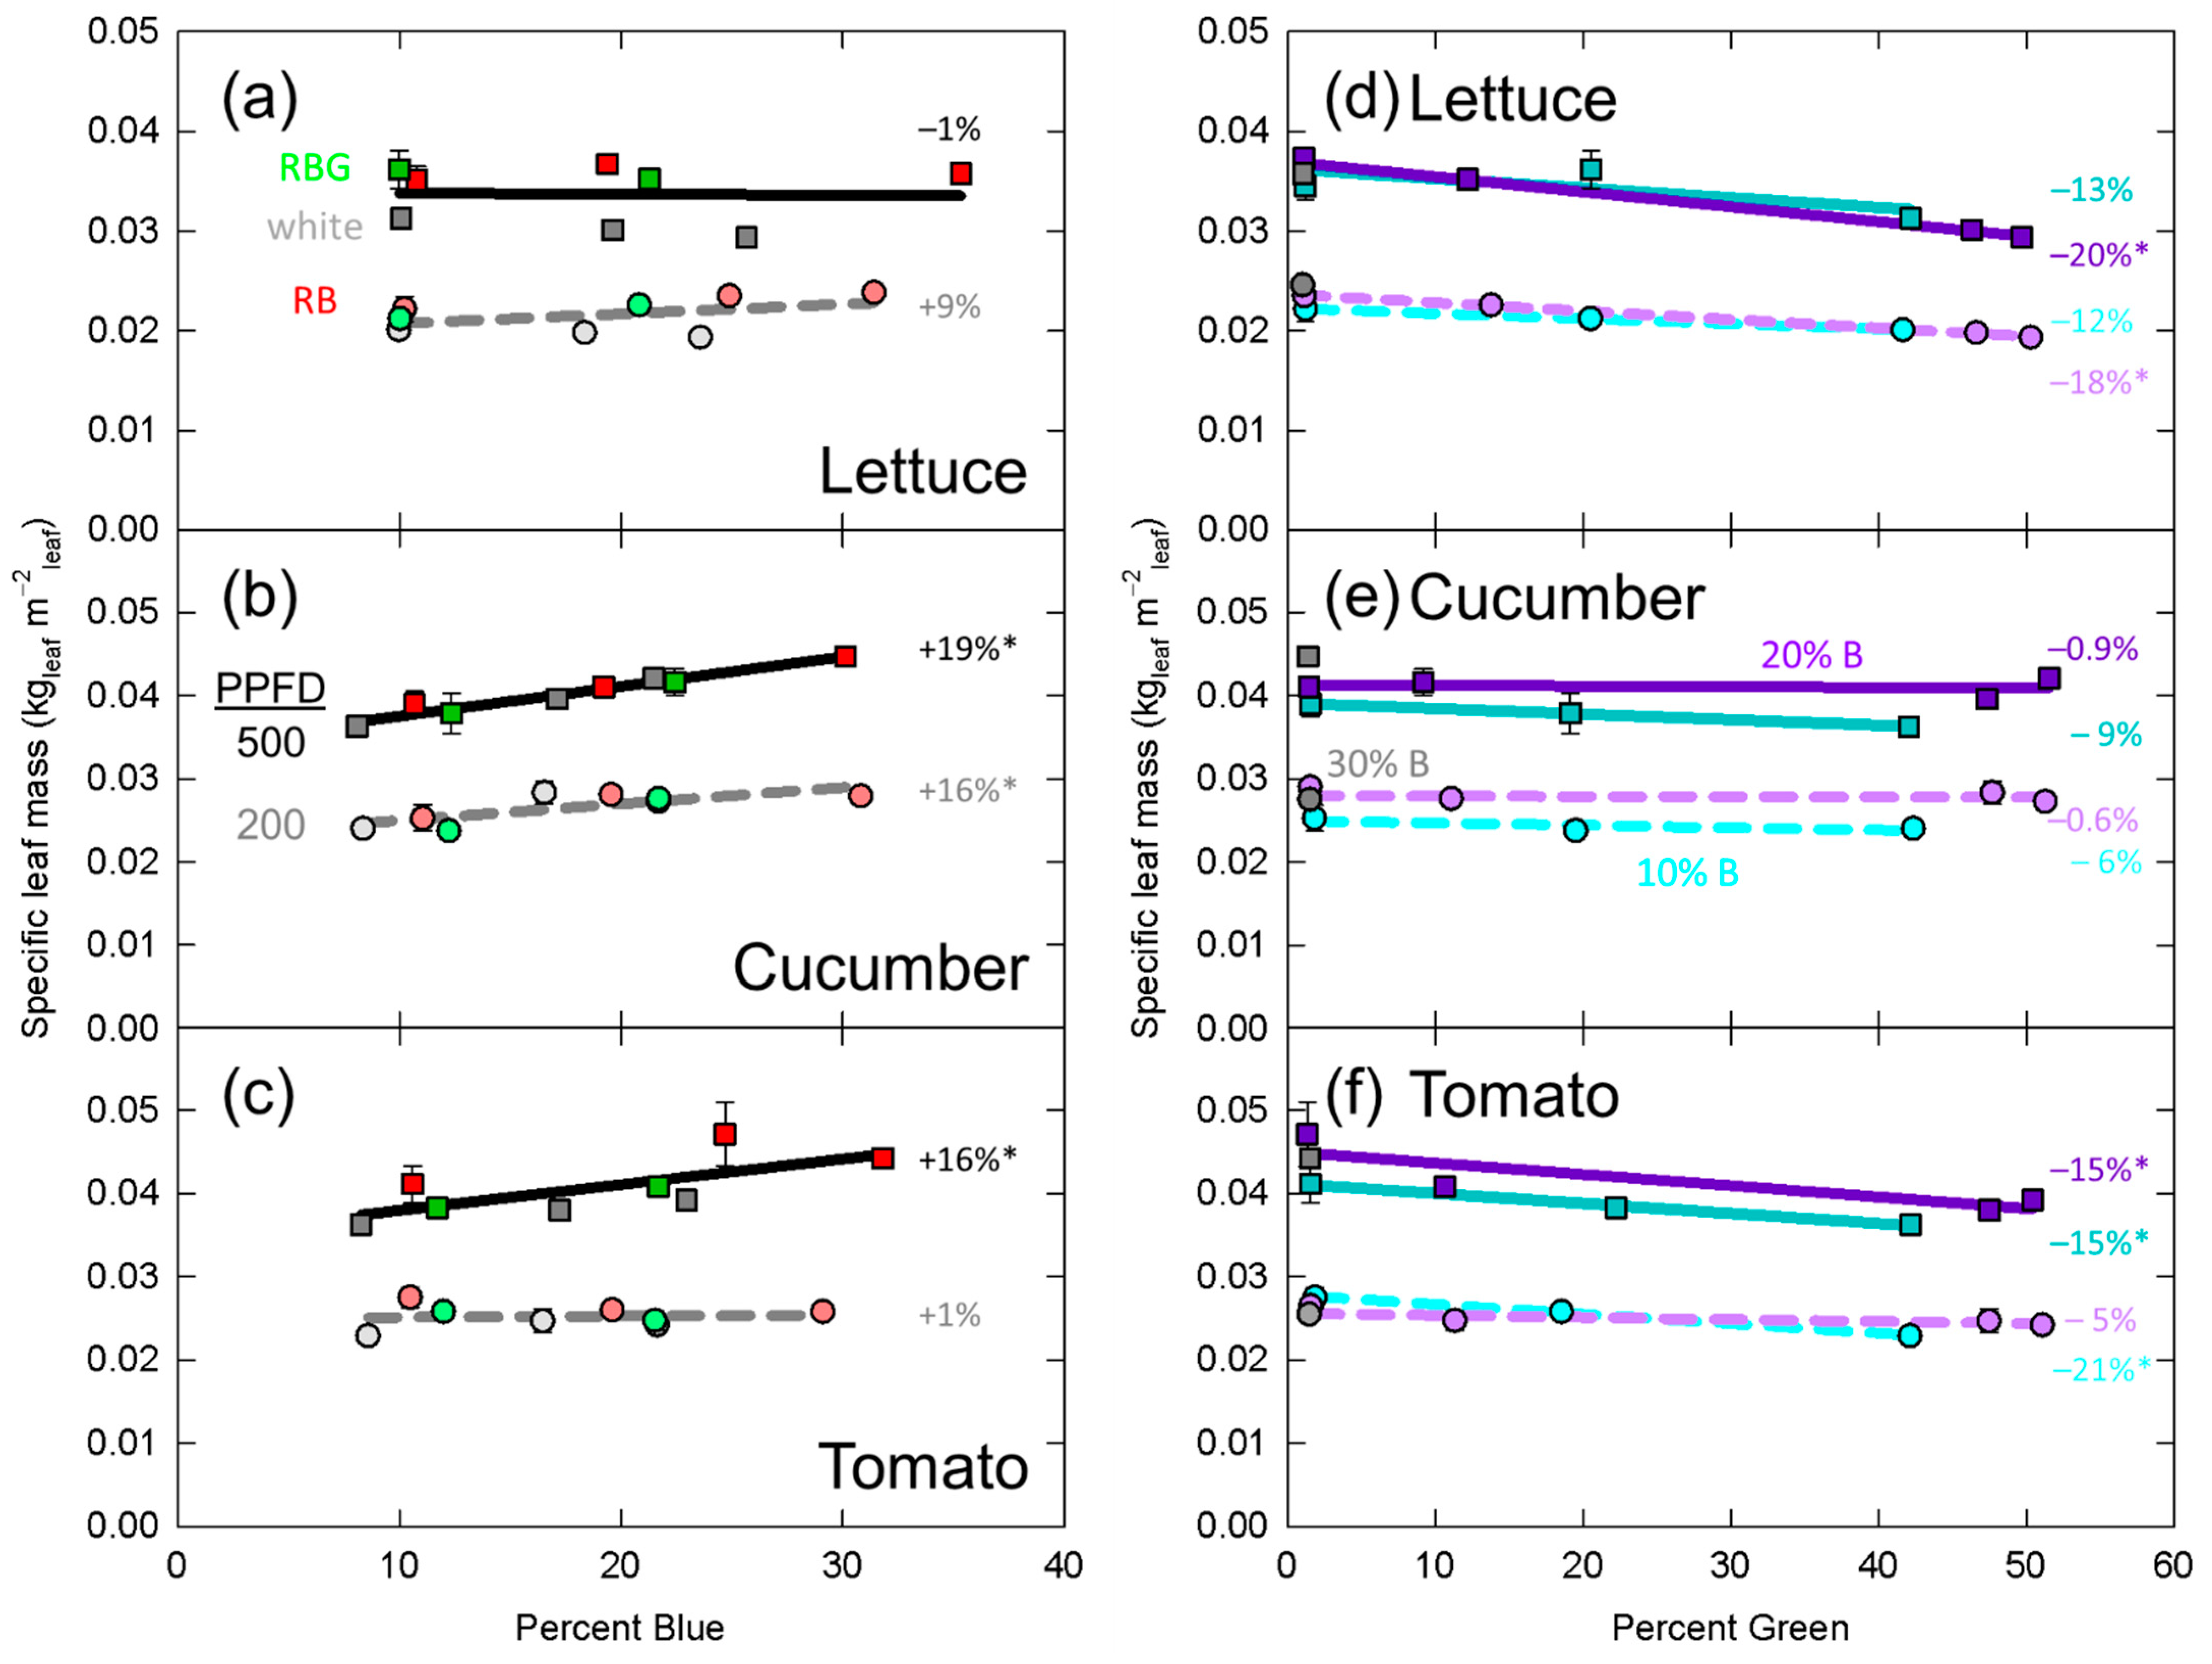
3.3. Specific Leaf Mass
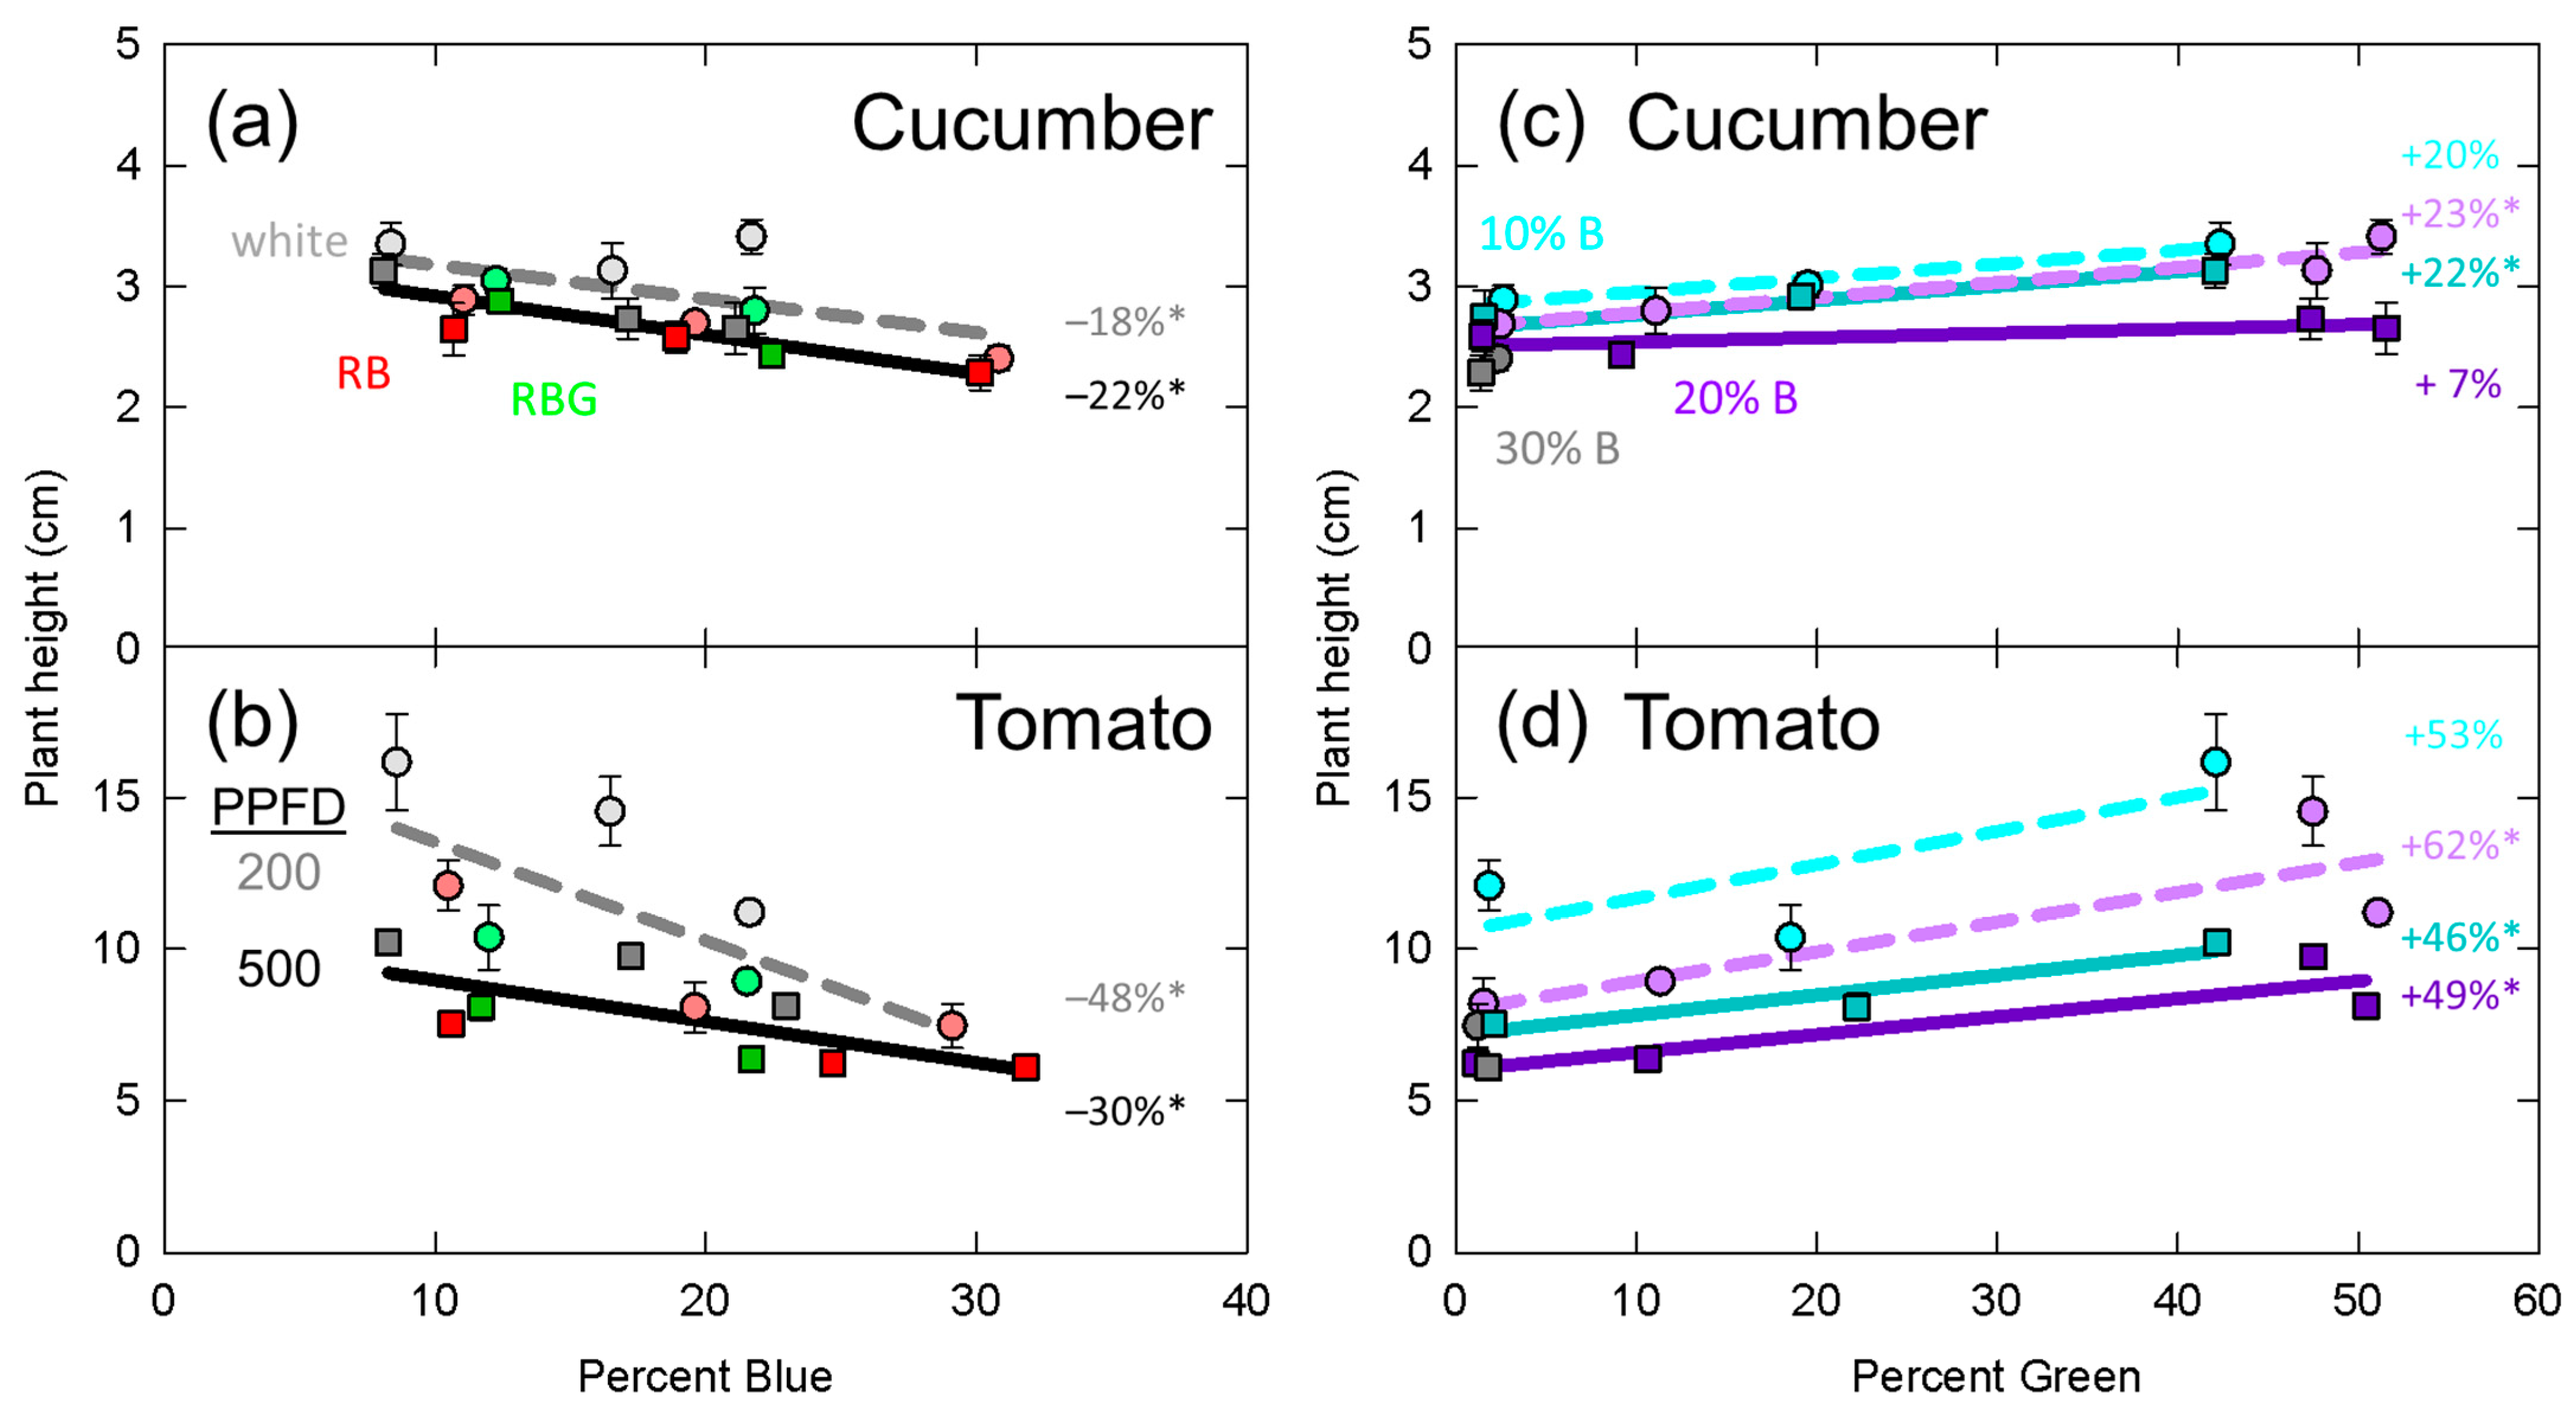
3.4. Plant Height
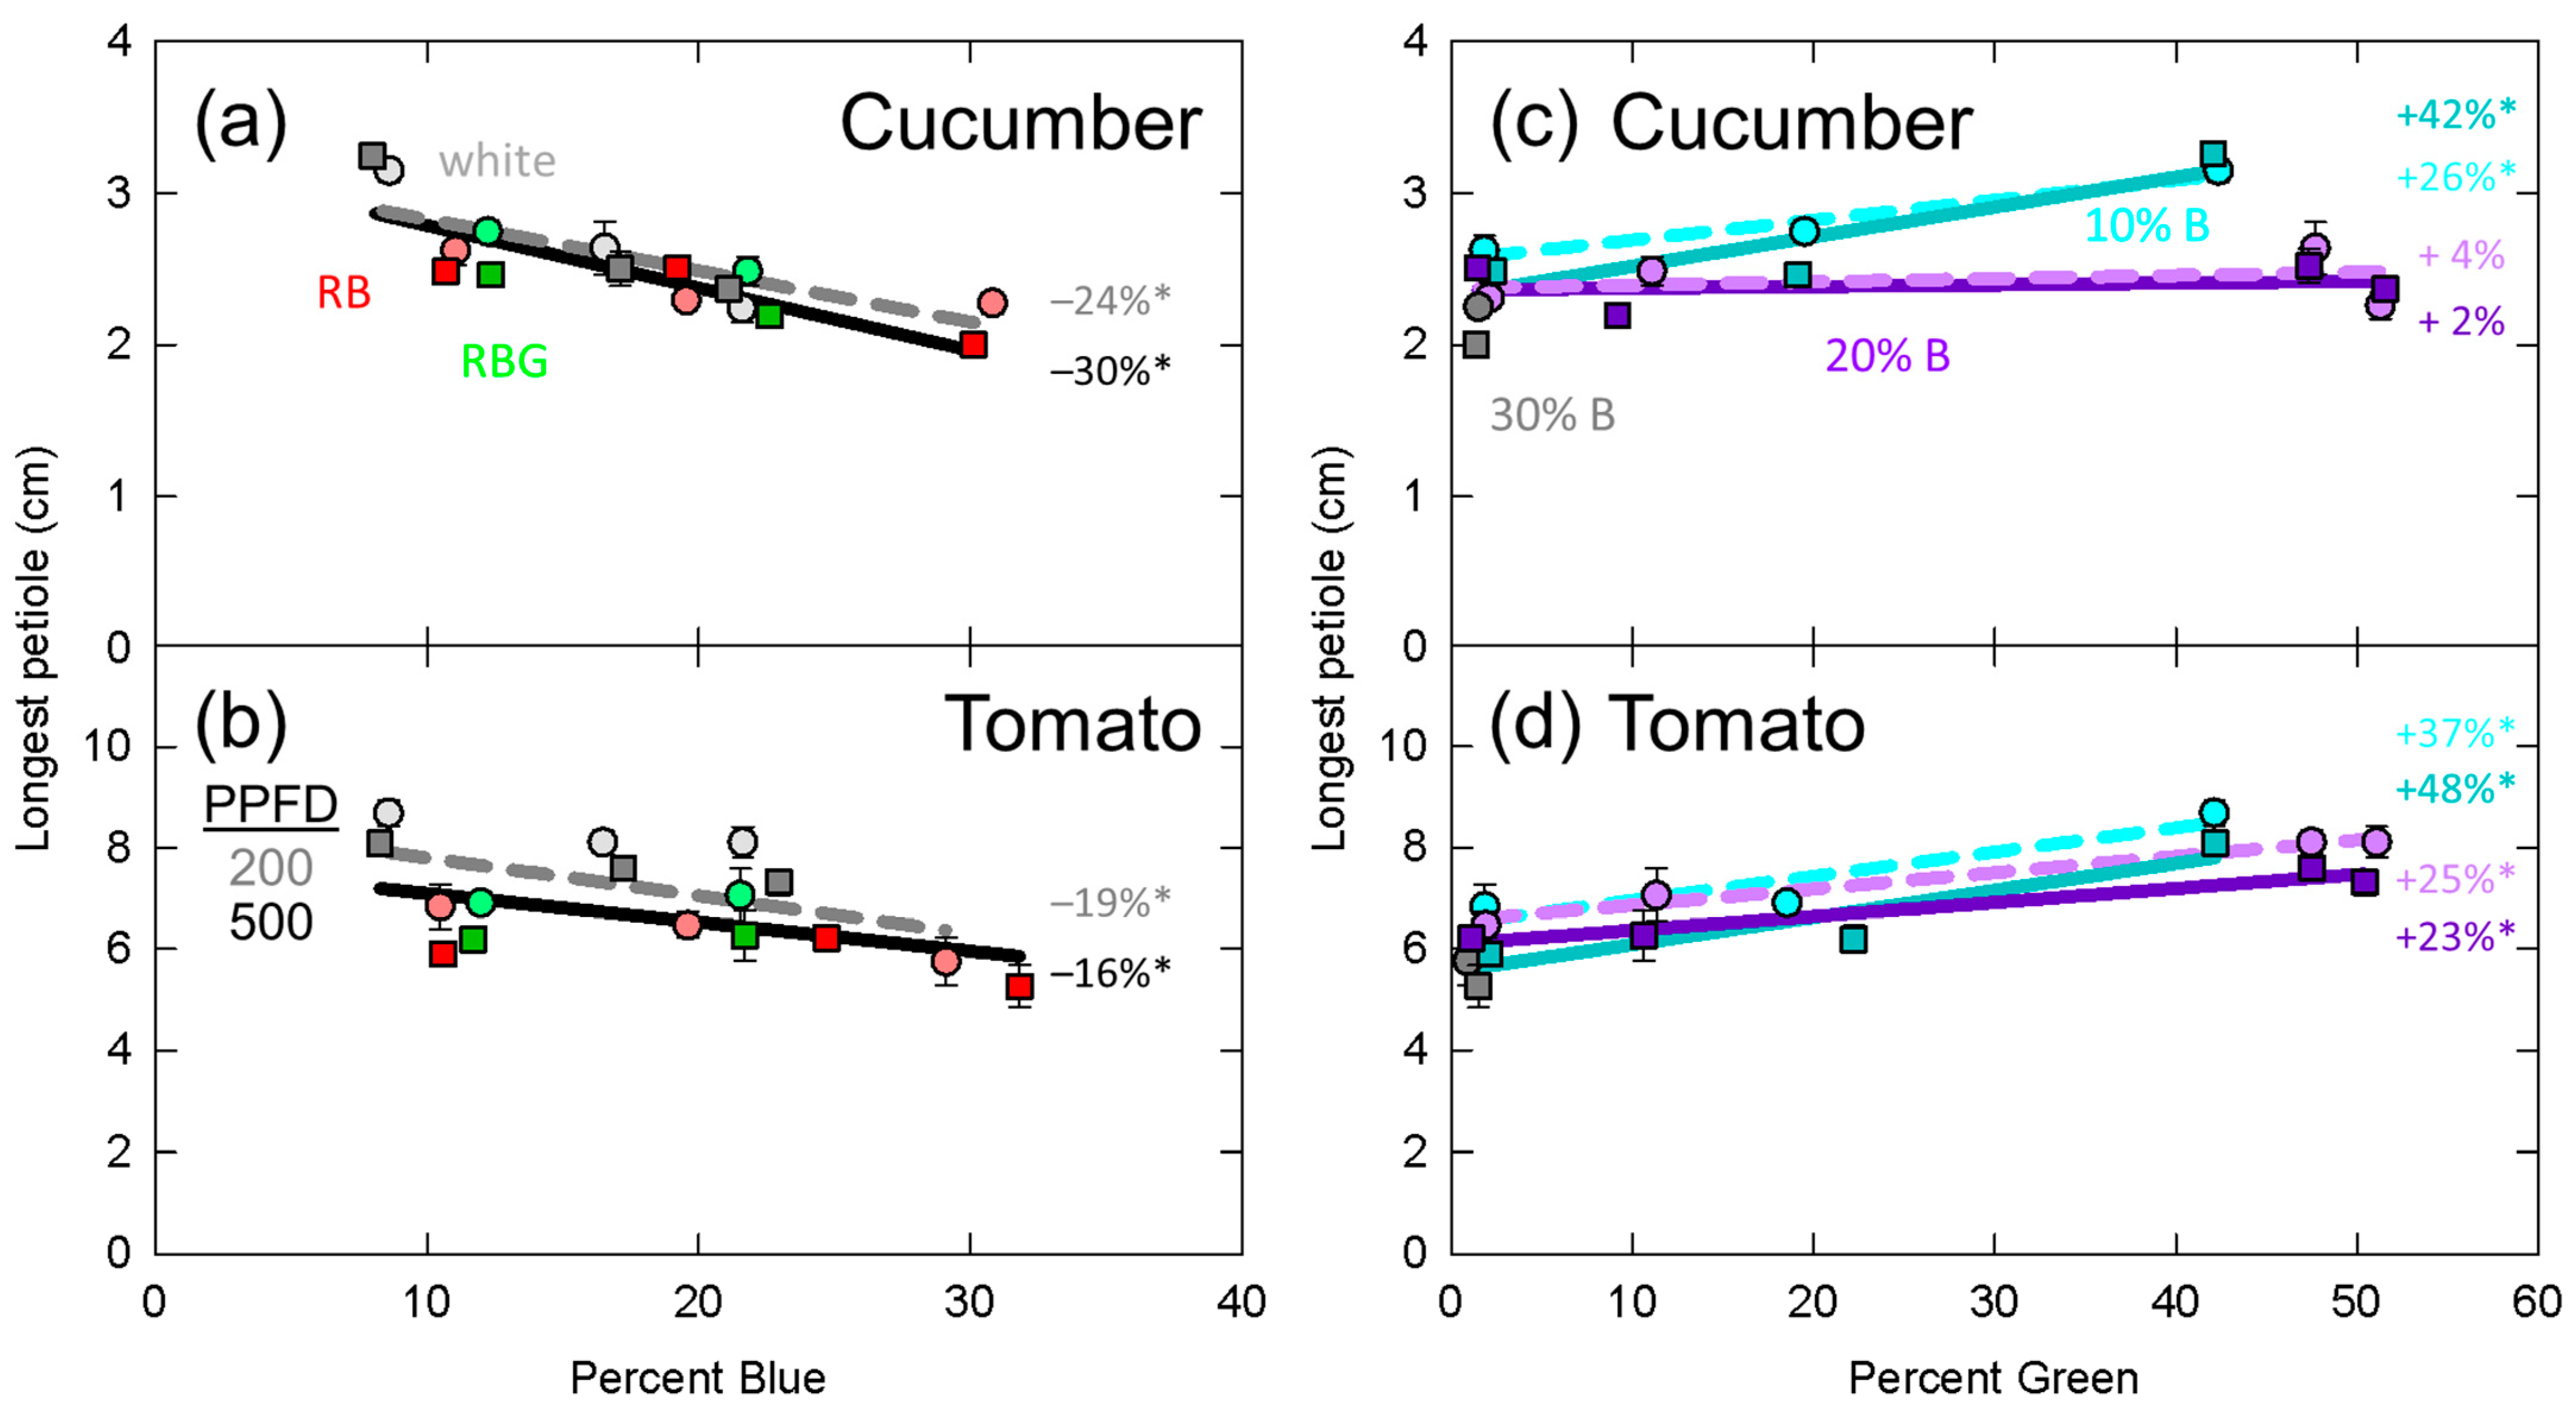
3.5. Longest Petiole Length
4. Discussion
4.1. Mechanism Underlying Specific Leaf Mass
4.2. Leaf Expansion
4.3. Potential Contribution of Photosynthesis to Dry Mass Accumulation
4.4. Comparison to Previous Studies in Horticultural Species
4.5. Interaction between Percent Blue and Percent Green
5. Conclusions
Supplementary Materials
Author Contributions
Funding
Institutional Review Board Statement
Informed Consent Statement
Data Availability Statement
Acknowledgments
Conflicts of Interest
References
- Demotes-Mainard, S.; Péron, T.; Corot, A.; Bertheloot, J.; Le Gourrierec, J.; Pelleschi-Travier, S.; Crespel, L.; Morel, P.; Huche-Thelier, L.; Boumaza, R.; et al. Plant responses to red and far-red lights, applications in horticulture. Environ. Exp. Bot. 2016, 121, 4–21. [Google Scholar] [CrossRef]
- Kusuma, P.; Bugbee, B. Far-red rraction: An improved metric for characterizing phytochrome effects on morphology. J. Am. Soc. Hort. Sci. 2021, 146, 3–13. [Google Scholar] [CrossRef]
- Gommers, C.M.; Visser, E.J.; St Onge, K.R.; Voesenek, L.A.; Pierik, R. Shade tolerance: When growing tall is not an option. Trends Plant. Sci. 2013, 18, 65–71. [Google Scholar] [CrossRef] [PubMed]
- Zhen, S.; Bugbee, B. Substituting far-red for traditionally defined photosynthetic photons results in equal canopy quantum yield for CO2 fixation and increased photon capture during long-term studies: Implications for re-defining PAR. Front. Plant Sci. 2020, 11, 1433. [Google Scholar] [CrossRef]
- Kim, H.H.; Goins, G.D.; Wheeler, R.M.; Sager, J.C. Green-light supplementation for enhanced lettuce growth under red-and blue-light-emitting diodes. HortScience 2004, 39, 1617–1622. [Google Scholar] [CrossRef] [PubMed]
- Smith, H.L.; McAusland, L.; Murchie, E.H. Don’t ignore the green light: Exploring diverse roles in plant processes. J. Exp. Bot. 2017, 68, 2099–2110. [Google Scholar] [CrossRef] [PubMed]
- Battle, M.W.; Vegliani, F.; Jones, M.A. Shades of green: Untying the knots of green photoperception. J. Exp. Bot. 2020, 71, 5764–5770. [Google Scholar] [CrossRef] [PubMed]
- Meng, Q.; Boldt, J.; Runkle, E.S. Blue radiation interacts with green radiation to influence growth and predominantly controls quality attributes of lettuce. J. Am. Soc. Hortic. Sci. 2020, 145, 75–87. [Google Scholar] [CrossRef]
- Lin, C. Plant blue-light receptors. Trends Plant Sci. 2000, 5, 337–342. [Google Scholar] [CrossRef]
- Galvão, V.C.; Fankhauser, C. Sensing the light environment in plants: Photoreceptors and early signaling steps. Curr. Opin. Neurobiol. 2015, 34, 46–53. [Google Scholar] [CrossRef]
- Lin, C.; Yang, H.; Guo, H.; Mockler, T.; Chen, J.; Cashmore, A.R. Enhancement of blue-light sensitivity of Arabidopsis seedlings by a blue light receptor cryptochrome 2. Proc. Natl. Acad. Sci. USA 1998, 95, 2686–2690. [Google Scholar] [CrossRef]
- Ohgishi, M.; Saji, K.; Okada, K.; Sakai, T. Functional analysis of each blue light receptor, cry1, cry2, phot1, and phot2, by using combinatorial multiple mutants in Arabidopsis. Proc. Natl. Acad. Sci. USA 2004, 101, 2223–2228. [Google Scholar] [CrossRef]
- Platten, J.D.; Foo, E.; Elliott, R.C.; Hecht, V.; Reid, J.B.; Weller, J.L. Cryptochrome 1 contributes to blue-light sensing in pea. Plant. Physiol. 2005, 139, 1472–1482. [Google Scholar] [CrossRef] [PubMed]
- Folta, K.M.; Spalding, E.P. Unexpected roles for cryptochrome 2 and phototropin revealed by high-resolution analysis of blue light-mediated hypocotyl growth inhibition. Plant. J. 2001, 26, 471–478. [Google Scholar] [CrossRef] [PubMed]
- Ohashi-Kaneko, K.; Takase, M.; Kon, N.; Fujiwara, K.; Kurata, K. Effect of light quality on growth and vegetable quality in leaf lettuce, spinach and komatsuna. Environ. Control Biol. 2007, 45, 189–198. [Google Scholar] [CrossRef]
- Son, K.H.; Oh, M.M. Leaf shape, growth, and antioxidant phenolic compounds of two lettuce cultivars grown under various combinations of blue and red light-emitting diodes. HortScience 2013, 48, 988–995. [Google Scholar] [CrossRef]
- Cope, K.R.; Snowden, M.C.; Bugbee, B. Photobiological interactions of blue light and photosynthetic photon flux: Effects of monochromatic and broad-spectrum light sources. Photochem. Photobiol. 2014, 90, 574–584. [Google Scholar] [CrossRef] [PubMed]
- Furuyama, S.; Ishigami, Y.; Hikosaka, S.; Goto, E. Effects of blue/red ratio and light intensity on photomorphogenesis and photosynthesis of red leaf lettuce. Acta Hortic. 2013, 1037, 317–322. [Google Scholar] [CrossRef]
- Lee, J.S.; Lim, T.G.; Yong, H.K. Growth and phytochemicals in lettuce as affected by different ratios of blue to red LED radiation. Acta Hortic. 2014, 1037, 843–848. [Google Scholar] [CrossRef]
- Son, K.H.; Oh, M.M. Growth, photosynthetic and antioxidant parameters of two lettuce cultivars as affected by red, green, and blue light-emitting diodes. Hortic. Environ. Biotechnol. 2015, 56, 639–653. [Google Scholar] [CrossRef]
- Wang, J.; Lu, W.; Tong, Y.; Yang, Q. Leaf morphology, photosynthetic performance, chlorophyll fluorescence, stomatal development of lettuce (Lactuca sativa L.) exposed to different ratios of red light to blue light. Front. Plant Sci. 2016, 7, 250. [Google Scholar] [CrossRef]
- Son, K.H.; Jeon, Y.M.; Oh, M.M. Application of supplementary white and pulsed light-emitting diodes to lettuce grown in a plant factory with artificial lighting. Hortic. Environ. Biotechnol. 2016, 57, 560–572. [Google Scholar] [CrossRef]
- Kang, W.H.; Park, J.S.; Park, K.S.; Son, J.E. Leaf photosynthetic rate, growth, and morphology of lettuce under different fractions of red, blue, and green light from light-emitting diodes (LEDs). Hortic. Environ. Biotechnol. 2016, 57, 573–579. [Google Scholar] [CrossRef]
- Meng, Q.; Kelly, N.; Runkle, E.S. Substituting green or far-red radiation for blue radiation induces shade avoidance and promotes growth in lettuce and kale. Environ. Exp. Bot. 2019, 162, 383–391. [Google Scholar] [CrossRef]
- Hernández, R.; Kubota, C. Physiological responses of cucumber seedlings under different blue and red photon flux ratios using LEDs. Environ. Exp. Bot. 2016, 121, 66–74. [Google Scholar] [CrossRef]
- Snowden, M.C.; Cope, K.R.; Bugbee, B. Sensitivity of seven diverse species to blue and green light: Interactions with photon flux. PLoS ONE 2016, 11, e0163121. [Google Scholar] [CrossRef] [PubMed]
- Song, J.; Meng, Q.; Du, W.; He, D. Effects of light quality on growth and development of cucumber seedlings in controlled environment. Int. J. Agric. Biol. Eng. 2017, 10, 312–318. [Google Scholar] [CrossRef]
- Zou, J.; Zhou, C.B.; Xu, H.; Cheng, R.F.; Yang, Q.C.; Li, T. The effect of artificial solar spectrum on growth of cucumber and lettuce under controlled environment. J. Integr. Agric. 2020, 19, 2027–2034. [Google Scholar] [CrossRef]
- Wollaeger, H.M.; Runkle, E.S. Growth of impatiens, petunia, salvia, and tomato seedlings under blue, green, and red light-emitting diodes. HortScience 2014, 49, 734–740. [Google Scholar] [CrossRef]
- Dougher, T.A.; Bugbee, B. Differences in the response of wheat, soybean and lettuce to reduced blue radiation. Photochem. Photobiol. 2001, 73, 199–207. [Google Scholar] [CrossRef]
- Hernández, R.; Kubota, C. Tomato seedling growth and morphological responses to supplemental LED lighting red: Blue ratios under varied daily solar light integrals. Acta Hortic. 2012, 956, 187–194. [Google Scholar] [CrossRef]
- Wollaeger, H.M.; Runkle, E.S. Growth and acclimation of impatiens, salvia, petunia, and tomato seedlings to blue and red light. HortScience 2015, 50, 522–529. [Google Scholar] [CrossRef]
- Hernández, R.; Eguchi, T.; Deveci, M.; Kubota, C. Tomato seedling physiological responses under different percentages of blue and red photon flux ratios using LEDs and cool white fluorescent lamps. Sci. Hortic. 2016, 213, 270–280. [Google Scholar] [CrossRef]
- Liu, X.Y.; Jiao, X.L.; Chang, T.T.; Guo, S.R.; Xu, Z.G. Photosynthesis and leaf development of cherry tomato seedlings under different LED-based blue and red photon flux ratios. Photosynthetica 2018, 56, 1212–1217. [Google Scholar] [CrossRef]
- Meng, Q.; Runkle, E.S. Far-red radiation interacts with relative and absolute blue and red photon flux densities to regulate growth, morphology, and pigmentation of lettuce and basil seedlings. Sci. Hortic. 2019, 255, 269–280. [Google Scholar] [CrossRef]
- Yan, Z.; He, D.; Niu, G.; Zhou, Q.; Qu, Y. Growth, nutritional quality, and energy use efficiency of hydroponic lettuce as influenced by daily light integrals exposed to white versus white plus red light-emitting diodes. HortScience 2019, 54, 1737–1744. [Google Scholar] [CrossRef]
- Yorio, N.C.; Goins, G.D.; Kagie, H.R.; Wheeler, R.M.; Sager, J.C. Improving spinach, radish, and lettuce growth under red light-emitting diodes (LEDs) with blue light supplementation. HortScience 2001, 36, 380–383. [Google Scholar] [CrossRef]
- Li, Q.; Kubota, C. Effects of supplemental light quality on growth and phytochemicals of baby leaf lettuce. Environ. Exp. Bot. 2009, 67, 59–64. [Google Scholar] [CrossRef]
- Kong, S.W.; Chung, H.Y.; Chang, M.Y.; Fang, W. The contribution of different spectral sections to increase fresh weight of boston lettuce. HortScience 2015, 50, 1006–1010. [Google Scholar] [CrossRef]
- Chen, X.L.; Xue, X.Z.; Guo, W.Z.; Wang, L.C.; Qiao, X.J. Growth and nutritional properties of lettuce affected by mixed irradiation of white and supplemental light provided by light-emitting diode. Sci. Hortic. 2016, 200, 111–118. [Google Scholar] [CrossRef]
- Yan, Z.; He, D.; Niu, G.; Zhai, H. Evaluation of growth and quality of hydroponic lettuce at harvest as affected by the light intensity, photoperiod and light quality at seedling stage. Sci. Hortic. 2019, 248, 138–144. [Google Scholar] [CrossRef]
- Spalholz, H.; Perkins-Veazie, P.; Hernández, R. Impact of sun-simulated white light and varied blue: Red spectrums on the growth, morphology, development, and phytochemical content of green-and red-leaf lettuce at different growth stages. Sci. Hortic. 2020, 264, 109195. [Google Scholar] [CrossRef]
- Kong, Y.; Schiestel, K.; Zheng, Y. Maximum elongation growth promoted as a shade-avoidance response by blue light is related to deactivated phytochrome: A comparison with red light in four microgreen species. Canad. J. Plant Sci. 2019, 100, 314–326. [Google Scholar] [CrossRef]
- Bouly, J.P.; Schleicher, E.; Dionisio-Sese, M.; Vandenbussche, F.; Van Der Straeten, D.; Bakrim, N.; Meier, S.; Batschauer, A.; Galland, P.; Bittl, R.; et al. Cryptochrome blue light photoreceptors are activated through interconversion of flavin redox states. J. Biol. Chem. 2007, 282, 9383–9391. [Google Scholar] [CrossRef] [PubMed]
- Banerjee, R.; Schleicher, E.; Meier, S.; Viana, R.M.; Pokorny, R.; Ahmad, M.; Bittl, R.; Batschauer, A. The signaling state of Arabidopsis cryptochrome 2 contains flavin semiquinone. J. Biol. Chem. 2007, 282, 14916–14922. [Google Scholar] [CrossRef] [PubMed]
- Müller, P.; Bouly, J.P.; Hitomi, K.; Balland, V.; Getzoff, E.D.; Ritz, T.; Brettel, K. ATP binding turns plant cryptochrome into an efficient natural photoswitch. Sci. Rep. 2014, 4, 1–11. [Google Scholar] [CrossRef]
- Kao, Y.T.; Saxena, C.; He, T.F.; Guo, L.; Wang, L.; Sancar, A.; Zhong, D. Ultrafast dynamics of flavins in five redox states. J. Am. Chem. Soc. 2008, 130, 13132–13139. [Google Scholar] [CrossRef] [PubMed]
- Liu, B.; Liu, H.; Zhong, D.; Lin, C. Searching for a photocycle of the cryptochrome photoreceptors. Curr. Opin. Plant Biol. 2010, 13, 578–586. [Google Scholar] [CrossRef]
- Ahmad, M. Photocycle and signaling mechanisms of plant cryptochromes. Curr. Opin. Plant Biol. 2016, 33, 108–115. [Google Scholar] [CrossRef]
- Zhang, T.; Maruhnich, S.A.; Folta, K.M. Green light induces shade avoidance symptoms. Plant Physiol. 2011, 157, 1528–1536. [Google Scholar] [CrossRef]
- Wang, Y.; Zhang, T.; Folta, K.M. Green light augments far-red-light-induced shade response. Plant Growth Regul. 2015, 77, 147–155. [Google Scholar] [CrossRef]
- Li, L.; Tong, Y.X.; Lu, J.L.; Li, Y.M.; Yang, Q.C. Lettuce growth, nutritional quality, and energy use efficiency as affected by red–blue light combined with different monochromatic wavelengths. HortScience 2020, 55, 613–620. [Google Scholar] [CrossRef]
- Hoshino, R.; Yoshida, Y.; Tsukaya, H. Multiple steps of leaf thickening during sun-leaf formation in Arabidopsis. Plant J. 2019, 100, 738–753. [Google Scholar] [CrossRef]
- Wheeler, R.M.; Mackowiak, C.L.; Sager, J.C. Soybean stem growth under high-pressure sodium with supplemental blue lighting. Agron. J. 1991, 83, 903–906. [Google Scholar] [CrossRef] [PubMed]
- Cope, K.R.; Bugbee, B. Spectral effects of three types of white light-emitting diodes on plant growth and development: Absolute versus relative amounts of blue light. HortScience 2013, 48, 504–509. [Google Scholar] [CrossRef]
- Kim, G.T.; Yano, S.; Kozuka, T.; Tsukaya, H. Photomorphogenesis of leaves: Shade-avoidance and differentiation of sun and shade leaves. Photochem. Photobiol. Sci. 2005, 4, 770–774. [Google Scholar] [CrossRef] [PubMed]
- Weston, E.; Thorogood, K.; Vinti, G.; López-Juez, E. Light quantity controls leaf-cell and chloroplast development in Arabidopsis thaliana wild type and blue-light-perception mutants. Planta 2000, 211, 807–815. [Google Scholar] [CrossRef]
- López-Juez, E.; Bowyer, J.R.; Sakai, T. Distinct leaf developmental and gene expression responses to light quantity depend on blue-photoreceptor or plastid-derived signals, and can occur in the absence of phototropins. Planta 2007, 227, 113–123. [Google Scholar] [CrossRef] [PubMed]
- Smith, H. Light quality, photoperception, and plant strategy. Ann. Rev. Plant Physiol. 1982, 33, 481–518. [Google Scholar] [CrossRef]
- Oprian, D.D.; Coon, M.J. Oxidation-reduction states of FMN and FAD in NADPH-cytochrome P-450 reductase during reduction by NADPH. J. Biol. Chem. 1982, 257, 8935–8944. [Google Scholar] [CrossRef]
- Procopio, M.; Link, J.; Engle, D.; Witczak, J.; Ritz, T.; Ahmad, M. Kinetic modeling of the Arabidopsis cryptochrome photocycle: FADH accumulation correlates with biological activity. Front. Plant Sci. 2016, 7, 888. [Google Scholar] [CrossRef] [PubMed]
- Folta, K.M.; Maruhnich, S.A. Green light: A signal to slow down or stop. J. Exp. Bot. 2007, 58, 3099–3111. [Google Scholar] [CrossRef] [PubMed]
- Christie, J.M. Phototropin blue-light receptors. Annu. Rev. Plant Biol. 2007, 58, 21–45. [Google Scholar] [CrossRef] [PubMed]
- Talbott, L.D.; Hammad, J.W.; Harn, L.C.; Nguyen, V.H.; Patel, J.; Zeiger, E. Reversal by green light of blue light-stimulated stomatal opening in intact, attached leaves of Arabidopsis operates only in the potassium-dependent, morning phase of movement. Plant Cell Physiol. 2006, 47, 332–339. [Google Scholar] [CrossRef] [PubMed]
- Sakamoto, K.; Briggs, W.R. Cellular and subcellular localization of phototropin 1. Plant Cell 2002, 14, 1723–1735. [Google Scholar] [CrossRef]
- Takemiya, A.; Inoue, S.I.; Doi, M.; Kinoshita, T.; Shimazaki, K.I. Phototropins promote plant growth in response to blue light in low light environments. Plant Cell 2005, 17, 1120–1127. [Google Scholar] [CrossRef] [PubMed]
- Kong, Y.; Zheng, Y. Phototropin is partly involved in blue-light-mediated stem elongation, flower initiation, and leaf expansion: A comparison of phenotypic responses between wild Arabidopsis and its phototropin mutants. Environ. Exp. Bot. 2020, 171, 103967. [Google Scholar] [CrossRef]
- Keller, M.M.; Jaillais, Y.; Pedmale, U.V.; Moreno, J.E.; Chory, J.; Ballaré, C.L. Cryptochrome 1 and phytochrome B control shade-avoidance responses in Arabidopsis via partially independent hormonal cascades. Plant J. 2011, 67, 195–207. [Google Scholar] [CrossRef]
- Wu, L.; Yang, H.Q. CRYPTOCHROME 1 is implicated in promoting R protein-mediated plant resistance to Pseudomonas syringae in Arabidopsis. Mol. Plant 2010, 3, 539–548. [Google Scholar] [CrossRef]
- Zhang, Y.C.; Gong, S.F.; Li, Q.H.; Sang, Y.; Yang, H.Q. Functional and signaling mechanism analysis of rice CRYPTOCHROME 1. Plant J. 2006, 46, 971–983. [Google Scholar] [CrossRef]
- Dougher, T.A.; Bugbee, B. Long-term blue light effects on the histology of lettuce and soybean leaves and stems. J. Am. Soc. Hortic. Sci. 2004, 129, 467–472. [Google Scholar] [CrossRef]
- Yano, S.; Terashima, I. Developmental process of sun and shade leaves in Chenopodium album L. Plant Cell Environ. 2004, 27, 781–793. [Google Scholar] [CrossRef]
- McCree, K.J. The action spectrum, absorptance and quantum yield of photosynthesis in crop plants. Agric. Meteorol. 1971, 9, 191–216. [Google Scholar] [CrossRef]
- Klassen, S.P.; Ritchie, G.; Frantz, J.M.; Pinnock, D.; Bugbee, B. Real-time imaging of ground cover: Relationships with radiation capture, canopy photosynthesis, and daily growth rate. In Digital Imaging and Spectral Techniques: Applications to Precision Agriculture and Crop Physiology; American Society of Agronomy, Inc.: Madison, WI, USA, 2004; Volume 66, pp. 1–14. [Google Scholar] [CrossRef]
- Sager, J.C.; Smith, W.O.; Edwards, J.L.; Cyr, K.L. Photosynthetic efficiency and phytochrome photoequilibria determination using spectral data. Trans. Am. Soc. Agric. Eng. 1988, 31, 1882–1889. [Google Scholar] [CrossRef]
- Kusuma, P.; Pattison, P.M.; Bugbee, B. From physics to fixtures to food: Current and potential LED efficacy. Hortic. Res. 2020, 7, 1–9. [Google Scholar] [CrossRef]
| White | RB | RBG | ||||||
|---|---|---|---|---|---|---|---|---|
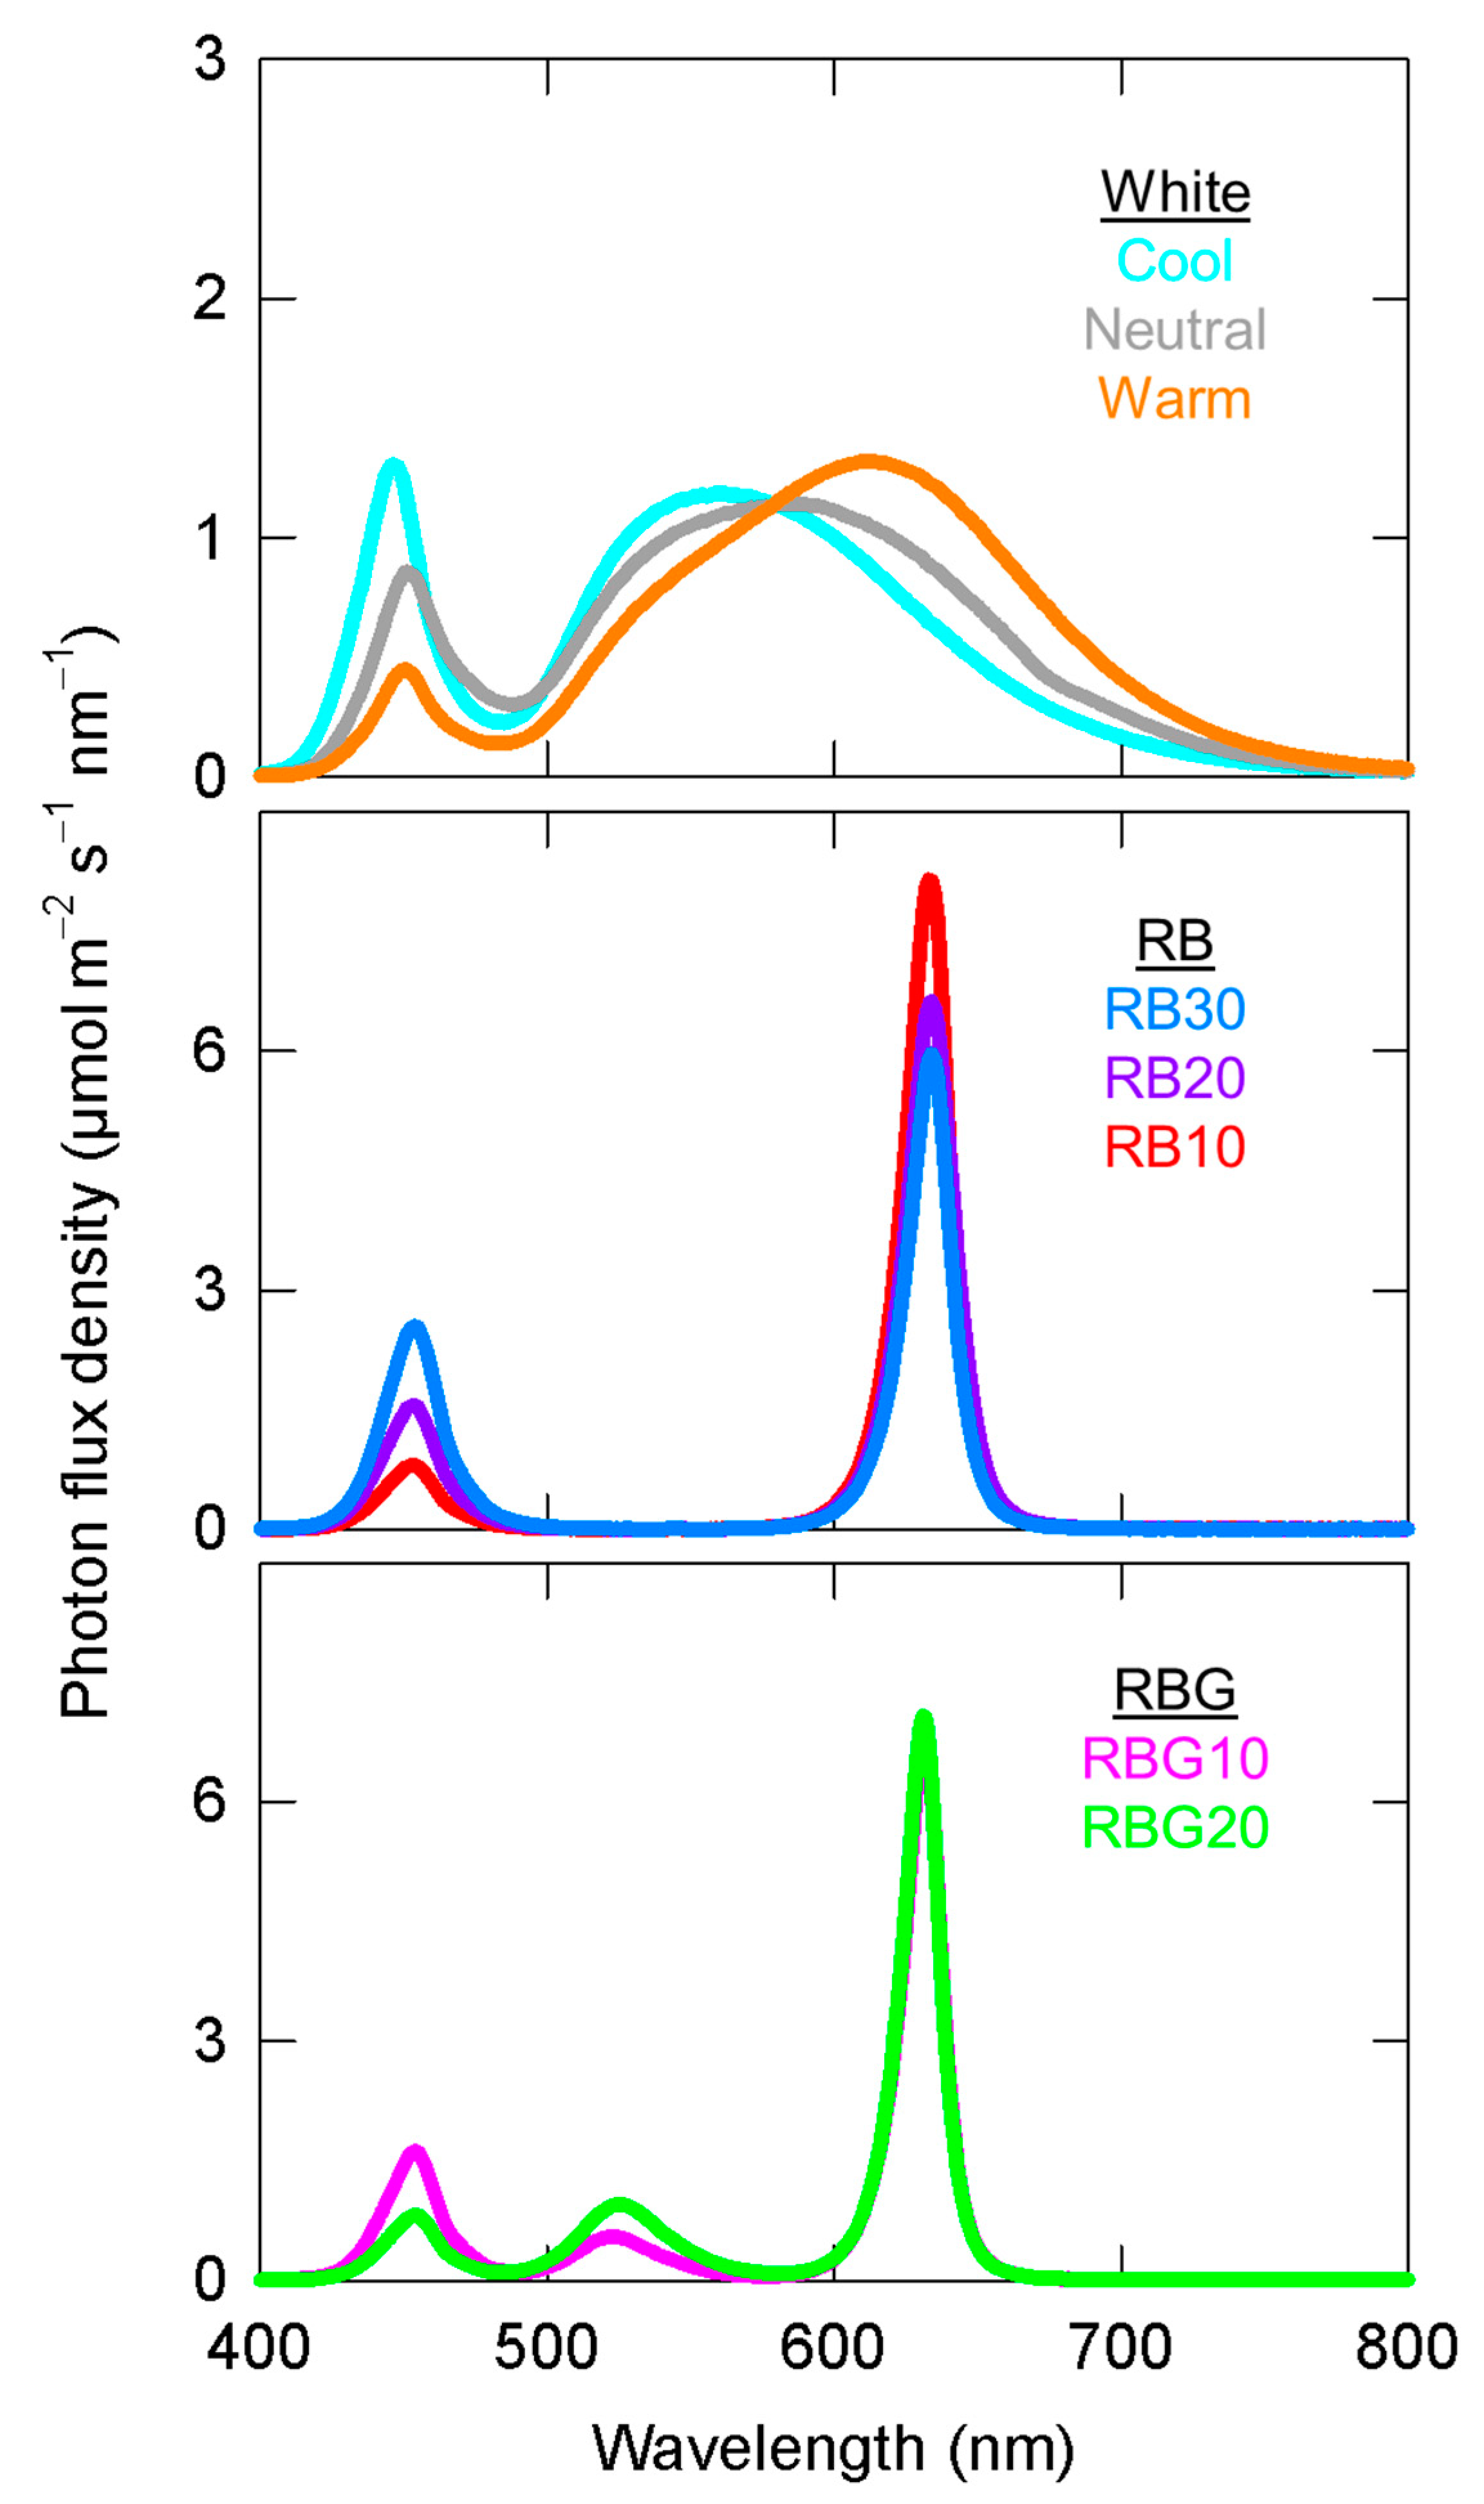
| Warm | Neutral | Cool | RB10 | RB20 | RB30 | RBG10 | RBG20 | |
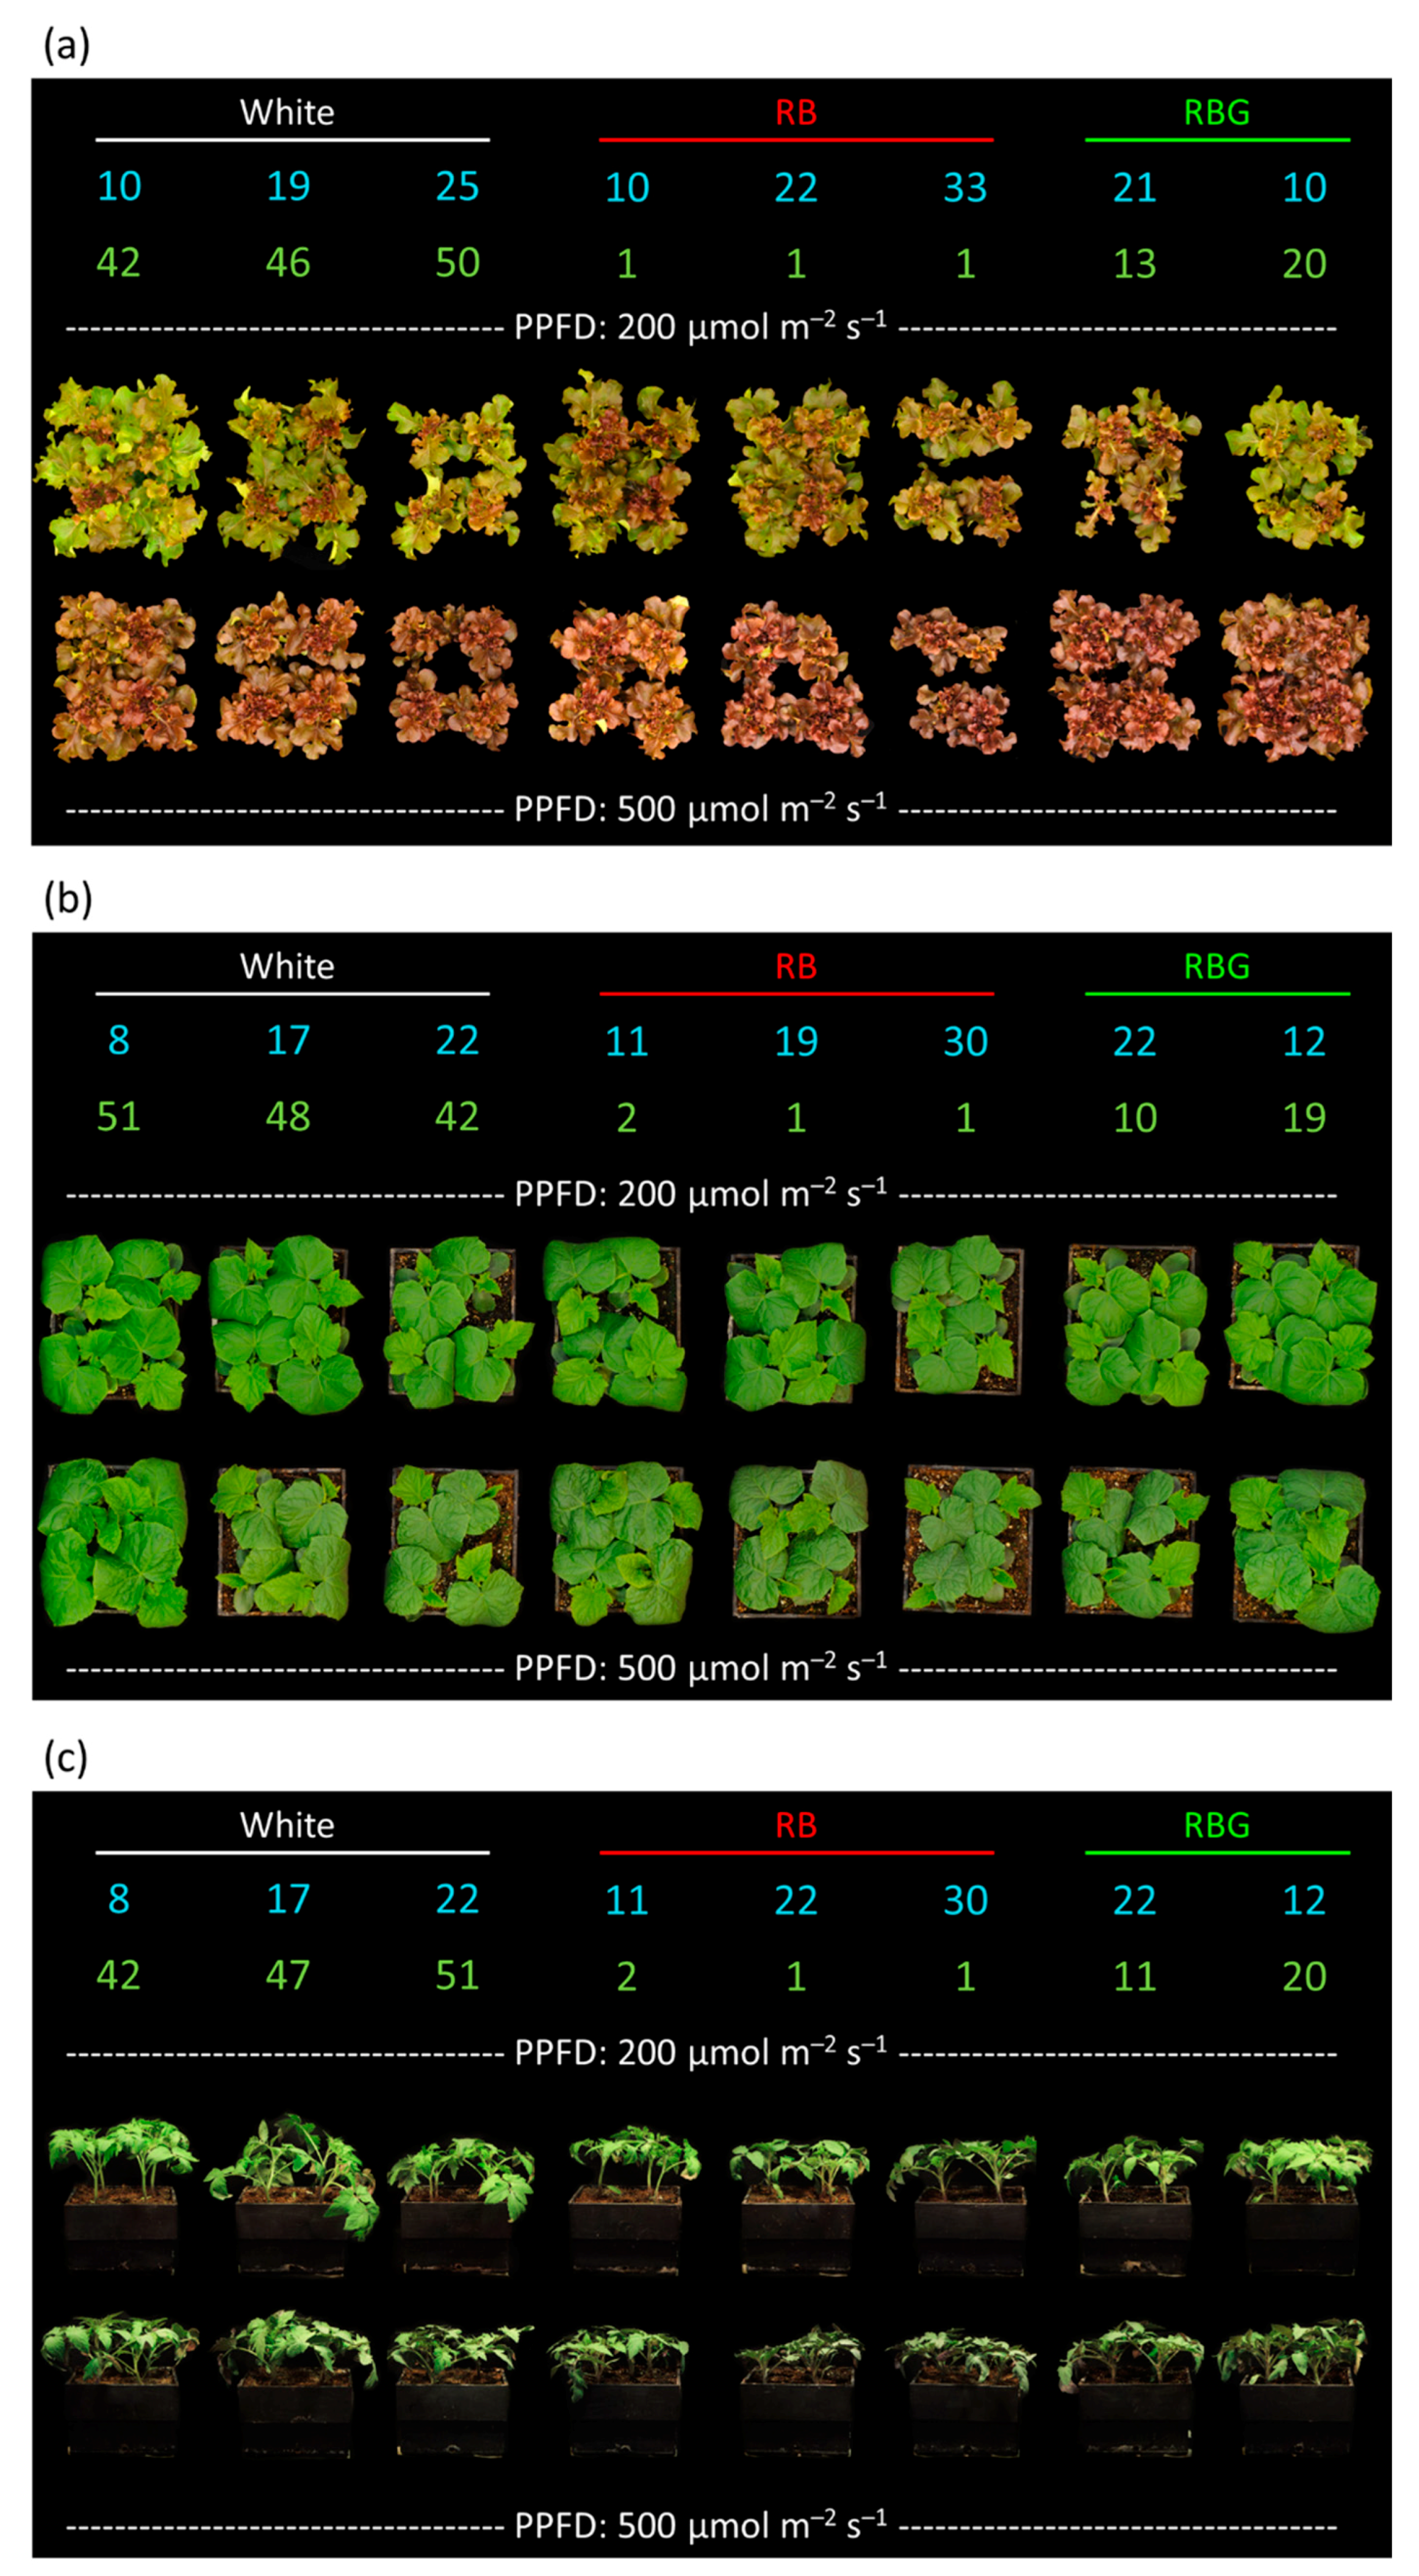
| % Blue (400 to 499) | 9 | 18 | 23 | 11 | 21 | 32 | 22 | 11 |
| % Green (500 to 599) | 42 | 47 | 51 | 1 | 1 | 1 | 11 | 20 |
| % Red (600 to 699) | 49 | 35 | 26 | 88 | 78 | 67 | 67 | 69 |
| Dry Mass | Leaf Area | Specific Leaf Mass | Height | Petiole | |||||||||
|---|---|---|---|---|---|---|---|---|---|---|---|---|---|
| Let | Cuc | Tom | Let | Cuc | Tom | Let | Cuc | Tom | Cuc | Tom | Cuc | Tom | |
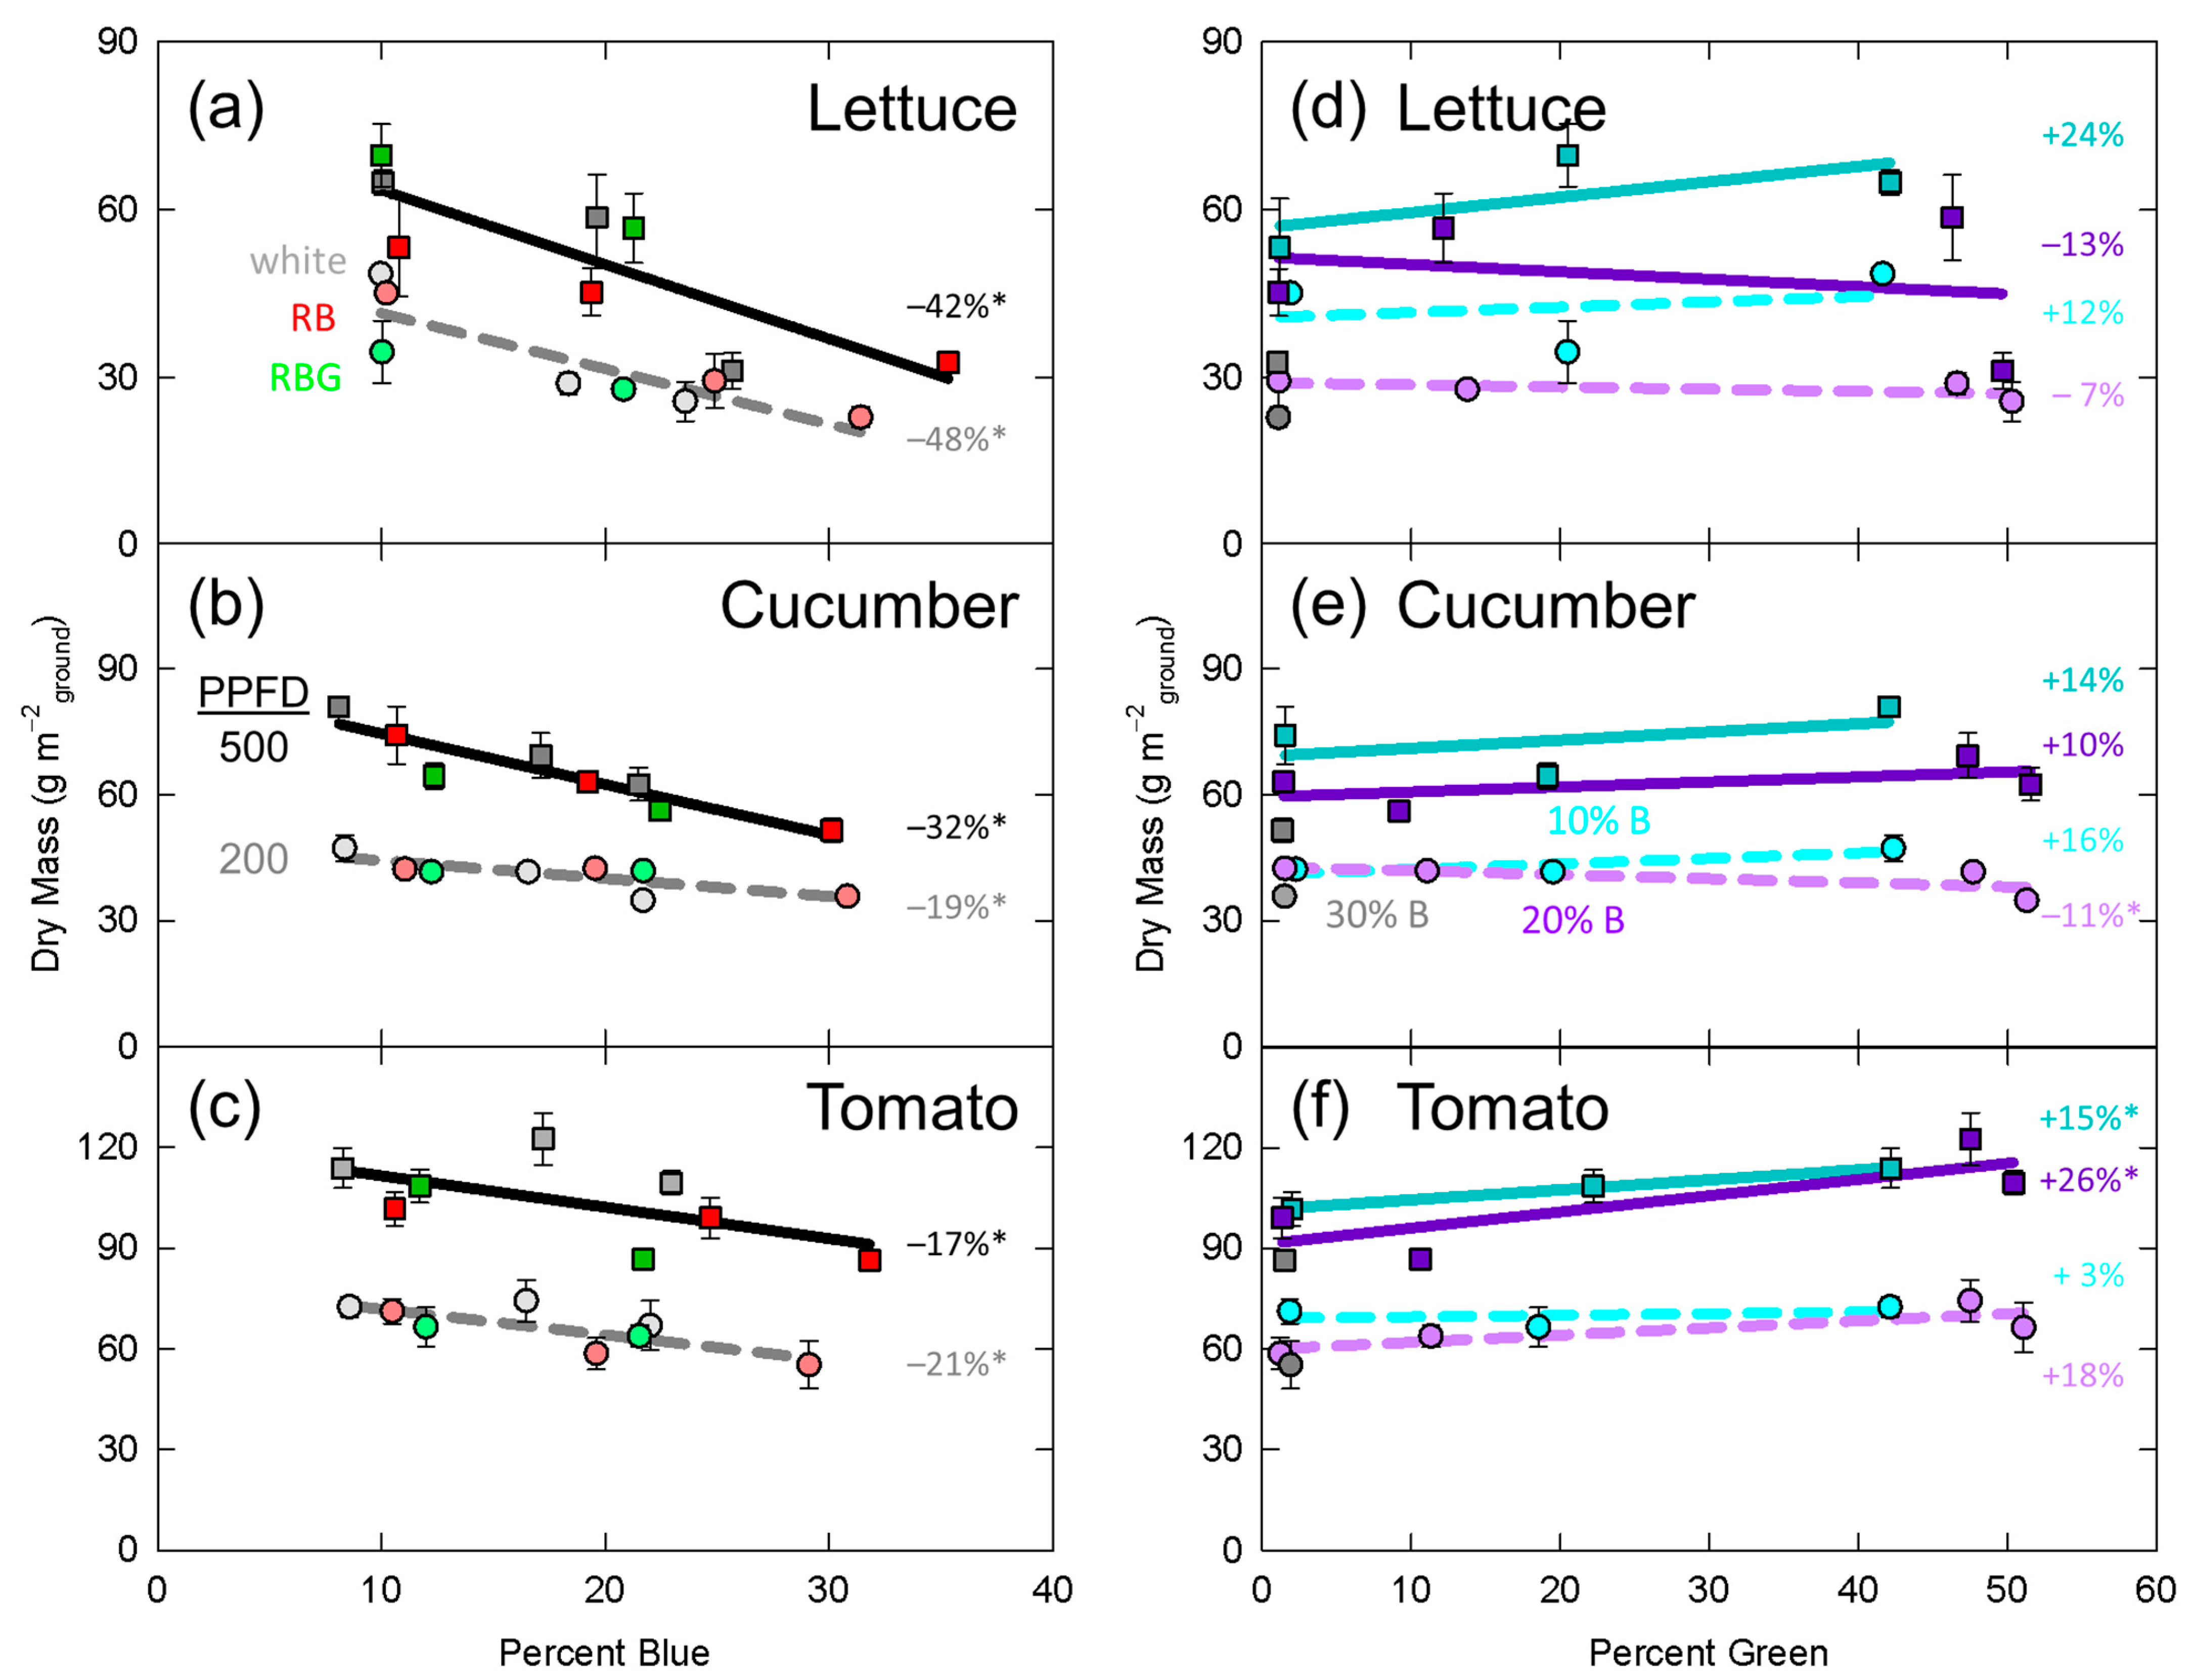
| %B | * | * | * | * | * | * | NS | * | * | * | * | * | * |
| %G | NS | NS | * | NS | NS | * | * | NS | * | * | * | * | * |
| PPFD | * | * | * | NS | * | NS | * | * | * | * | * | NS | * |
| %B*%G | * | NS | NS | * | * | NS | NS | NS | NS | NS | * | * | NS |
| %B*PPFD | NS | * | NS | NS | * | NS | NS | NS | * | NS | * | NS | NS |
| %G*PPFD | NS | NS | NS | NS | * | NS | * | NS | NS | NS | NS | NS | NS |
Publisher’s Note: MDPI stays neutral with regard to jurisdictional claims in published maps and institutional affiliations. |
© 2021 by the authors. Licensee MDPI, Basel, Switzerland. This article is an open access article distributed under the terms and conditions of the Creative Commons Attribution (CC BY) license (http://creativecommons.org/licenses/by/4.0/).
Share and Cite
Kusuma, P.; Swan, B.; Bugbee, B. Does Green Really Mean Go? Increasing the Fraction of Green Photons Promotes Growth of Tomato but Not Lettuce or Cucumber. Plants 2021, 10, 637. https://doi.org/10.3390/plants10040637
Kusuma P, Swan B, Bugbee B. Does Green Really Mean Go? Increasing the Fraction of Green Photons Promotes Growth of Tomato but Not Lettuce or Cucumber. Plants. 2021; 10(4):637. https://doi.org/10.3390/plants10040637
Chicago/Turabian StyleKusuma, Paul, Boston Swan, and Bruce Bugbee. 2021. "Does Green Really Mean Go? Increasing the Fraction of Green Photons Promotes Growth of Tomato but Not Lettuce or Cucumber" Plants 10, no. 4: 637. https://doi.org/10.3390/plants10040637
APA StyleKusuma, P., Swan, B., & Bugbee, B. (2021). Does Green Really Mean Go? Increasing the Fraction of Green Photons Promotes Growth of Tomato but Not Lettuce or Cucumber. Plants, 10(4), 637. https://doi.org/10.3390/plants10040637


