
QTL Analysis of Adult Plant Resistance to Stripe Rust in a Winter Wheat Recombinant Inbred Population

 ,
,  , and
, and
Abstract
1. Introduction
2. Results
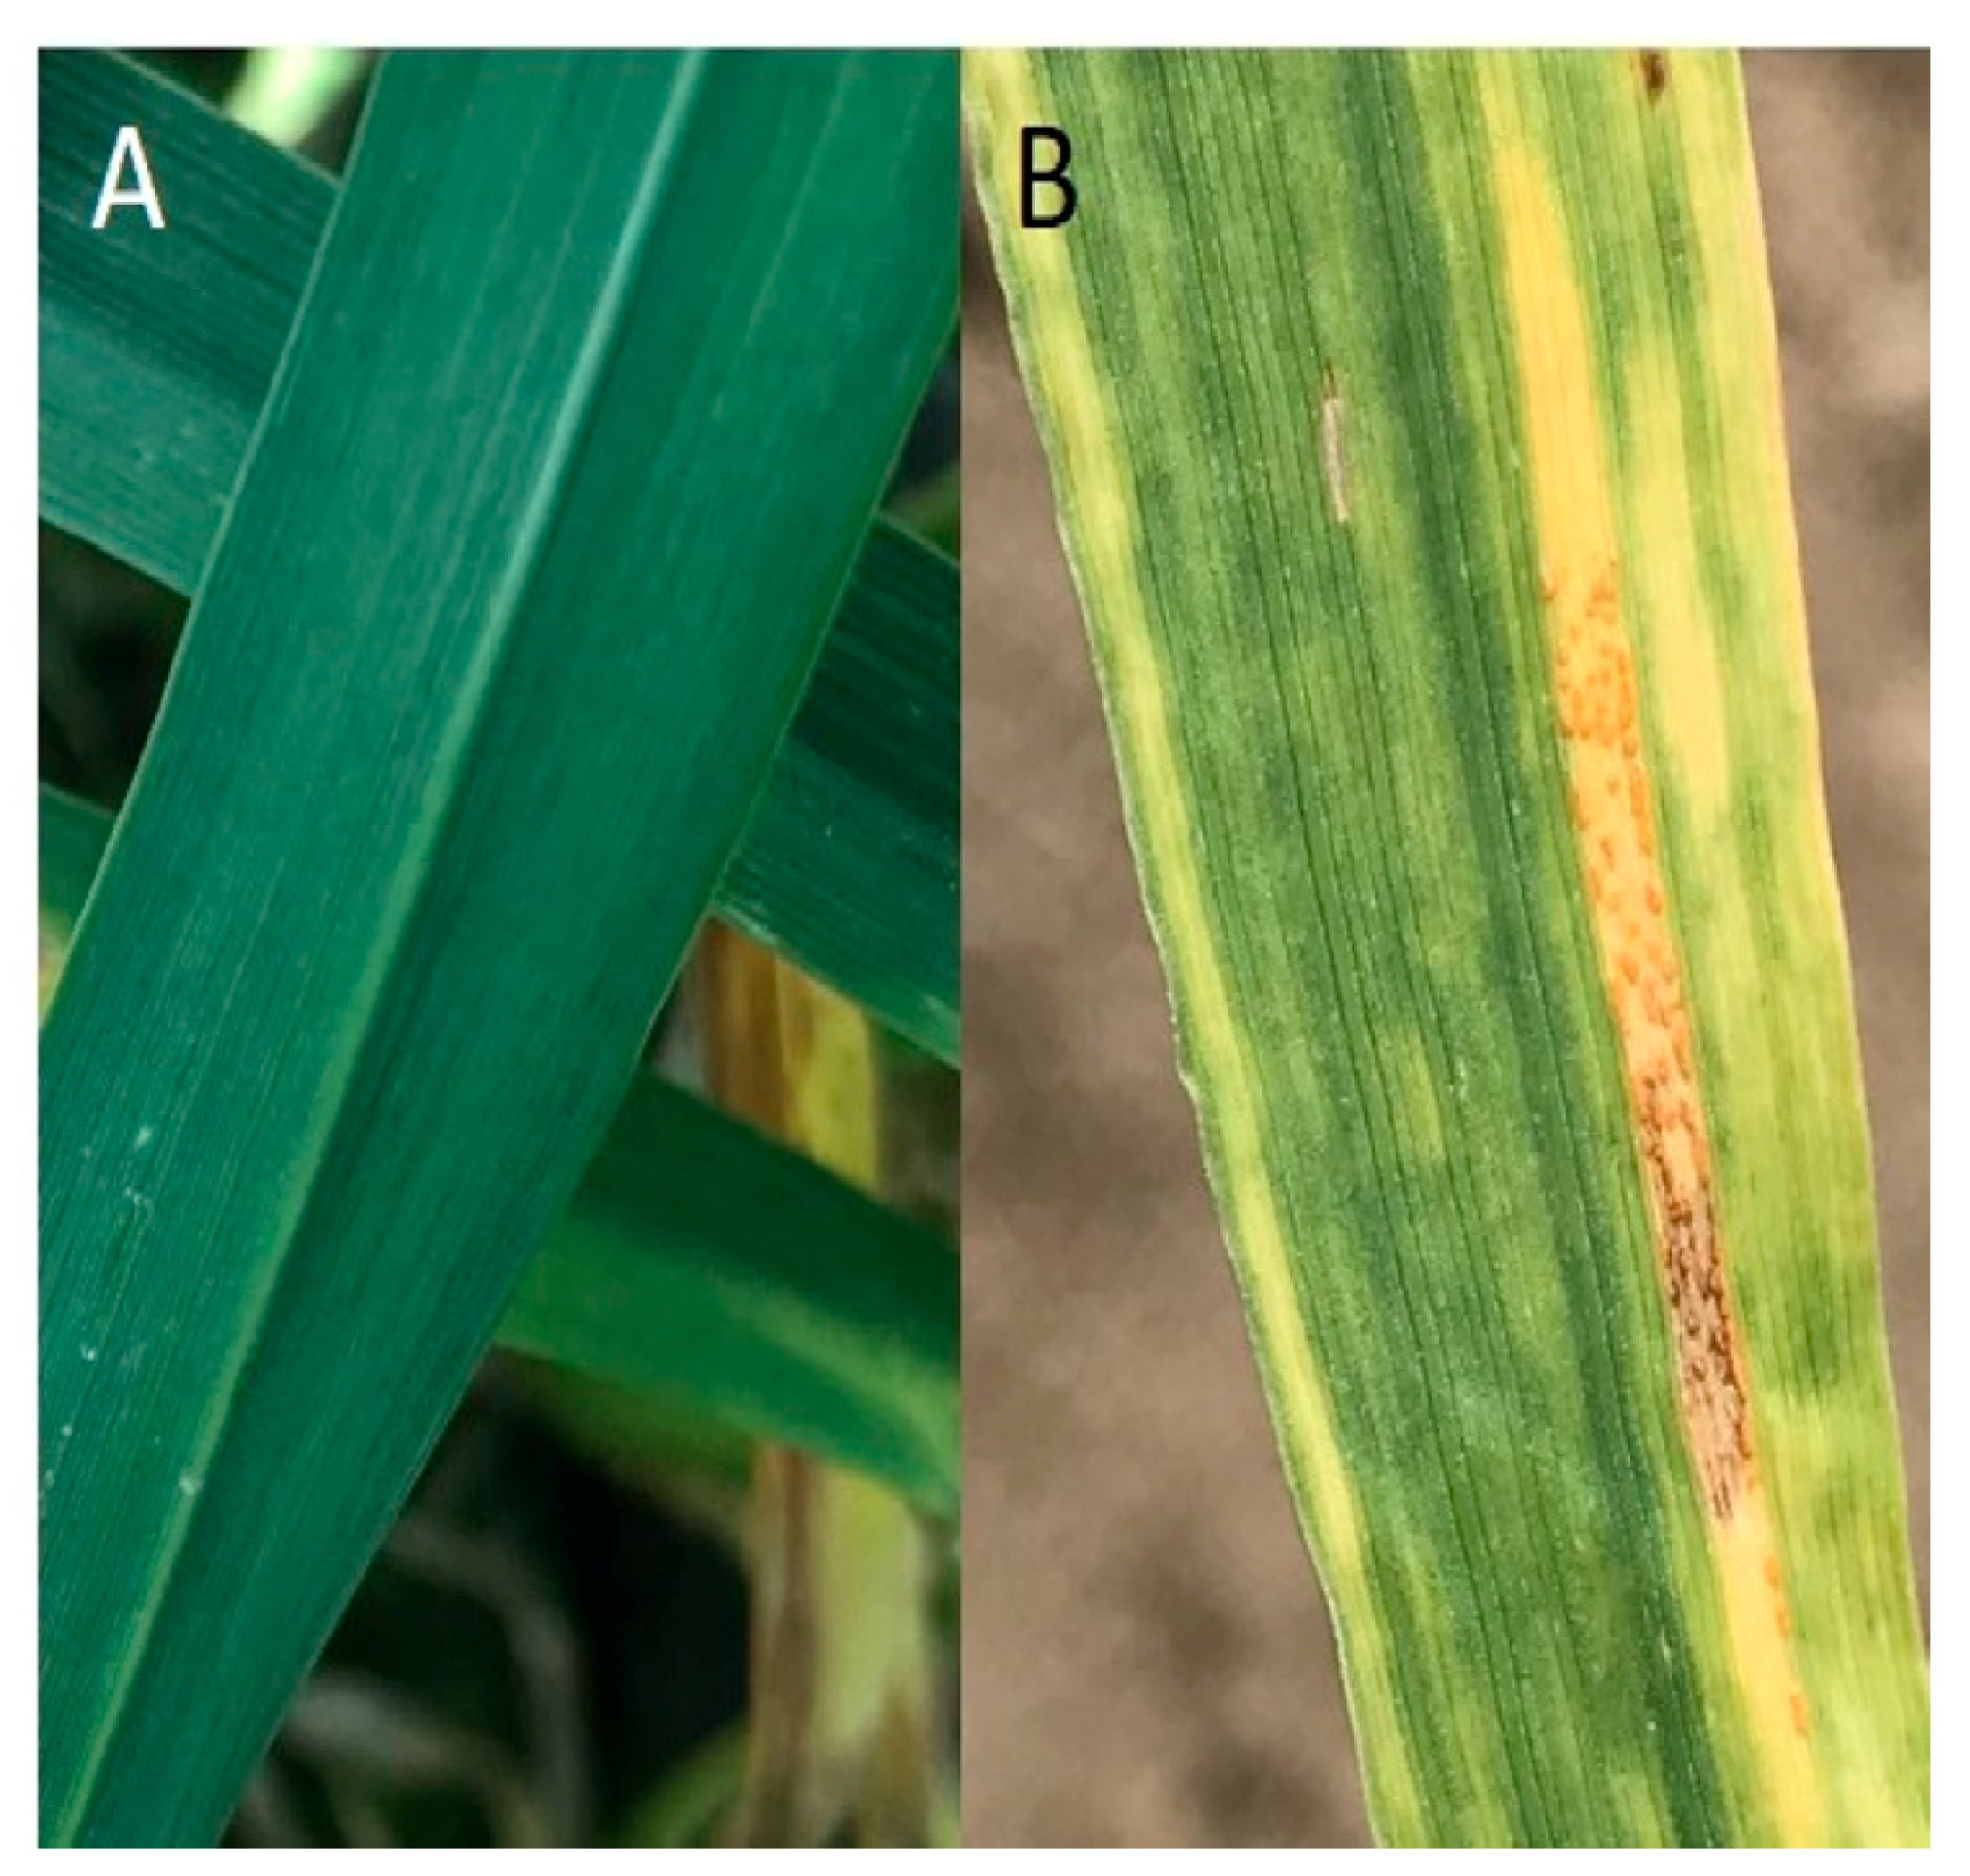
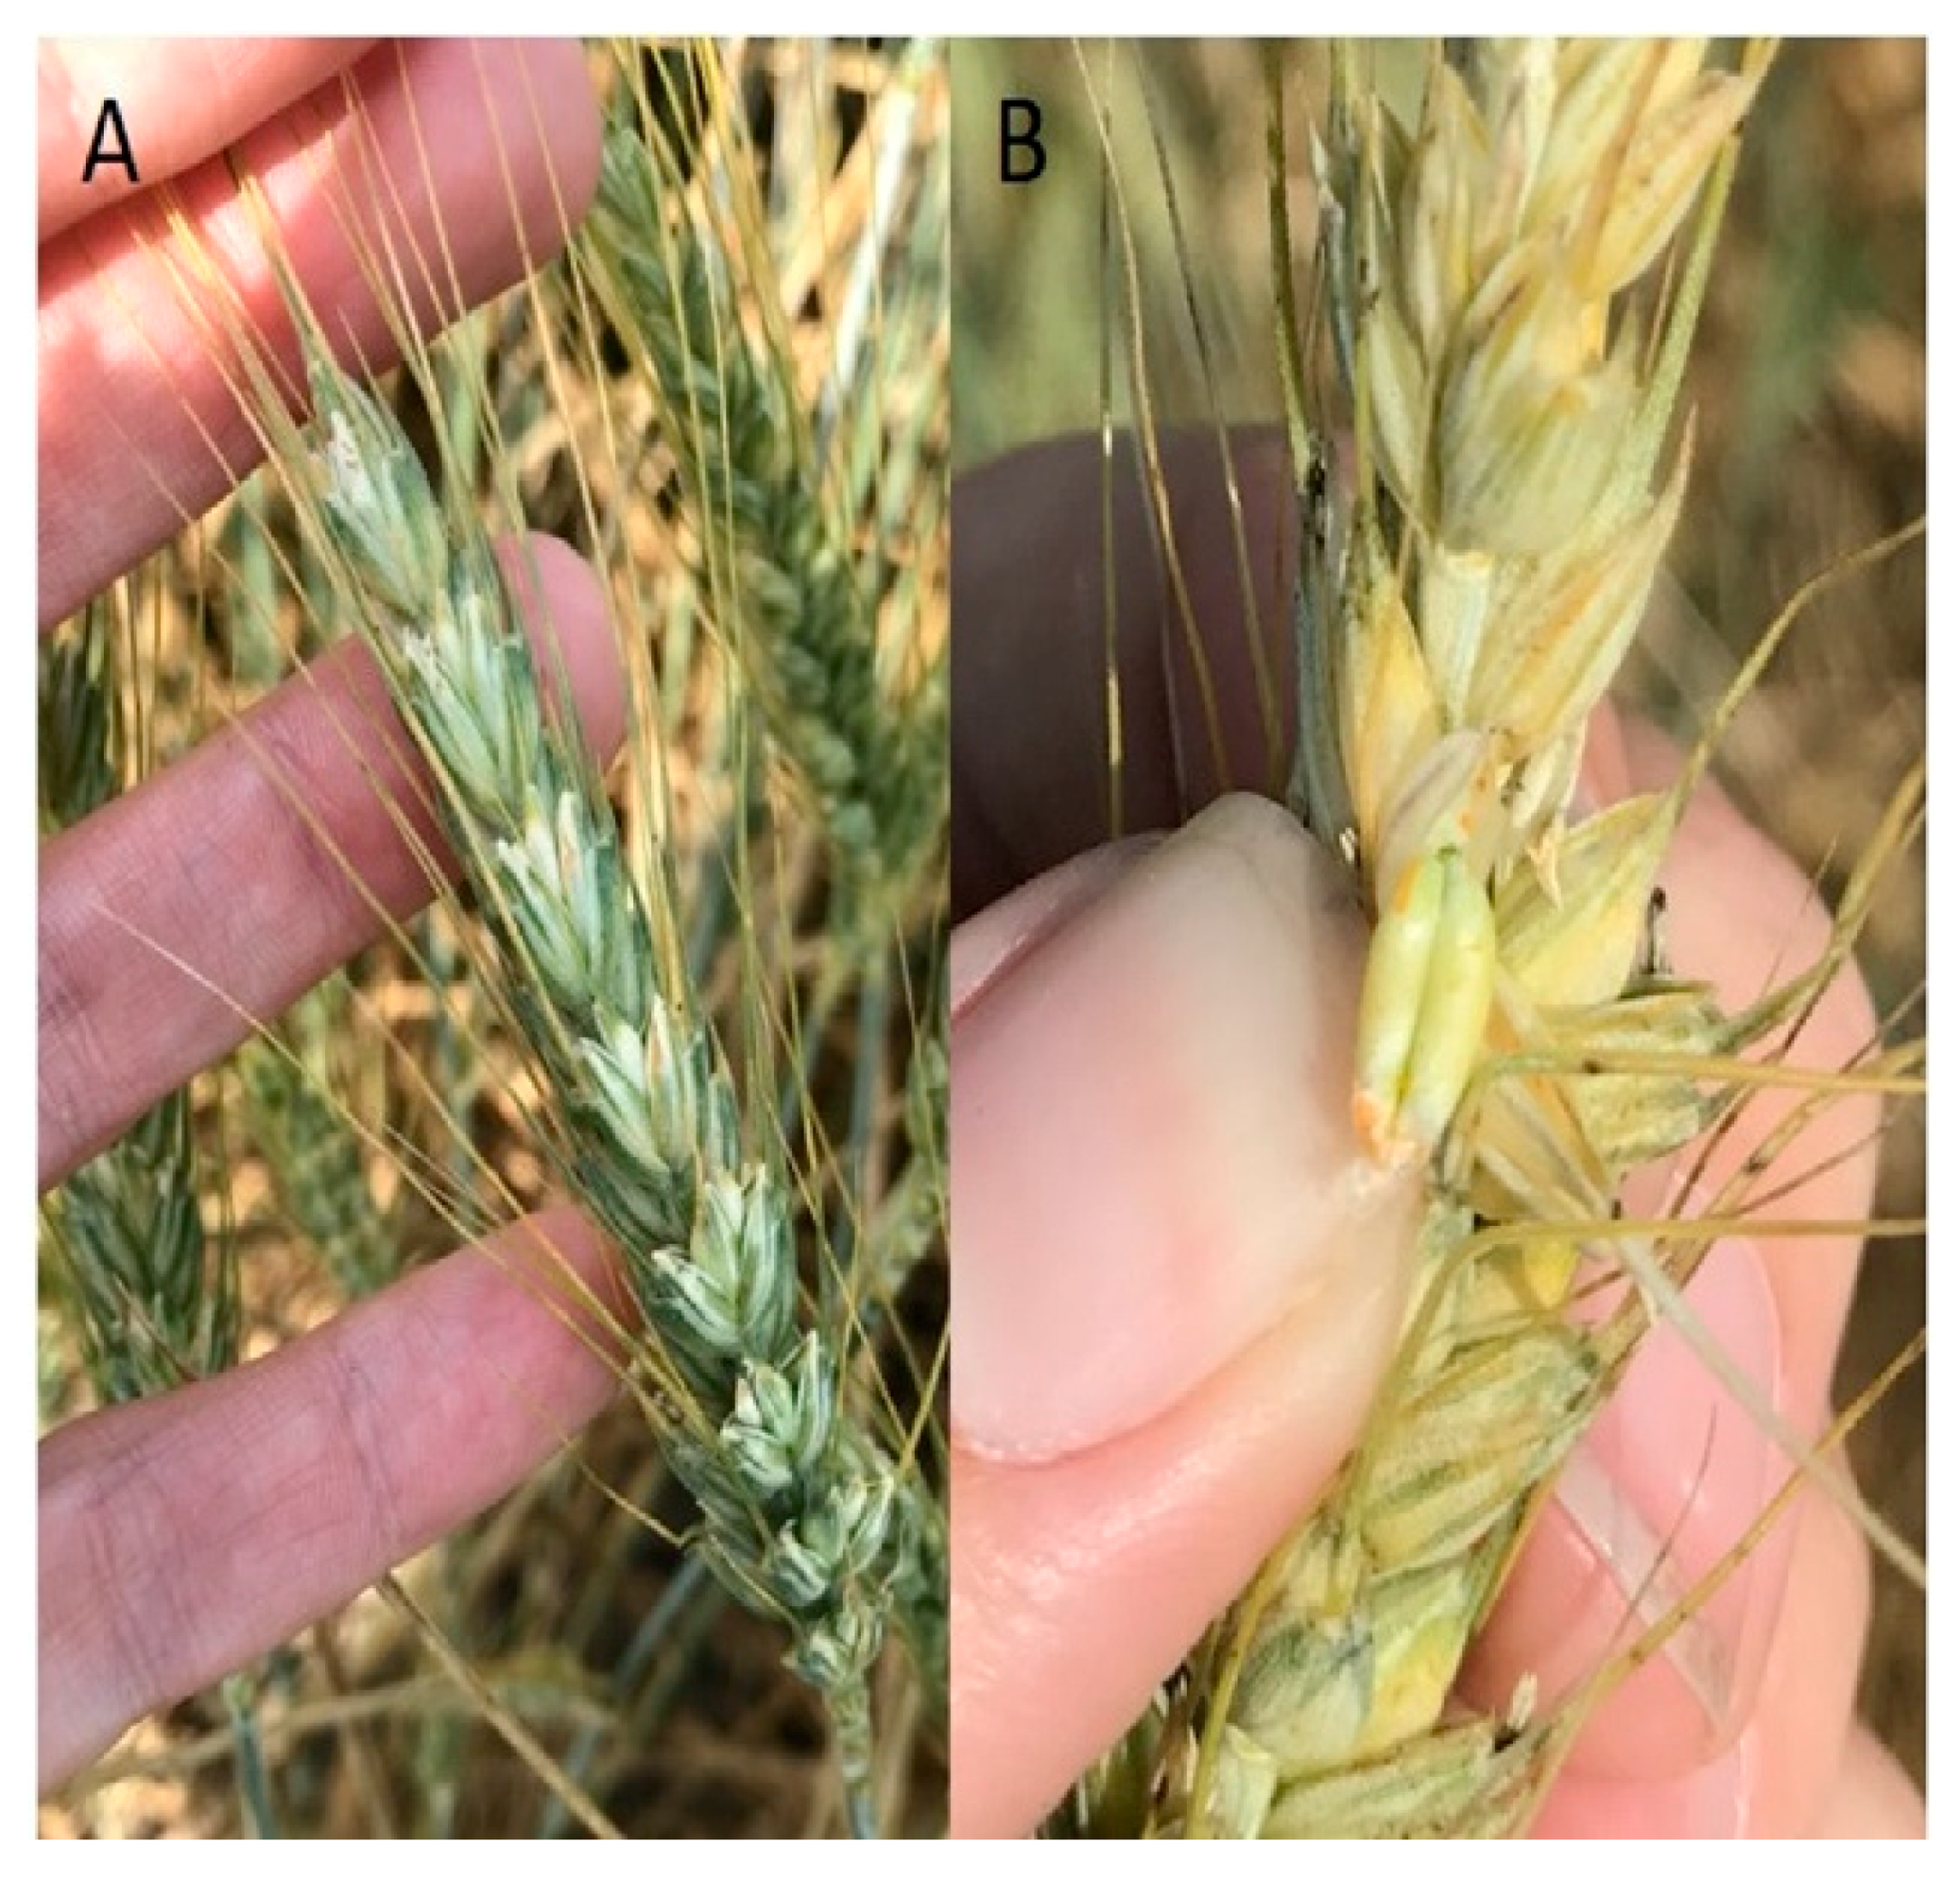
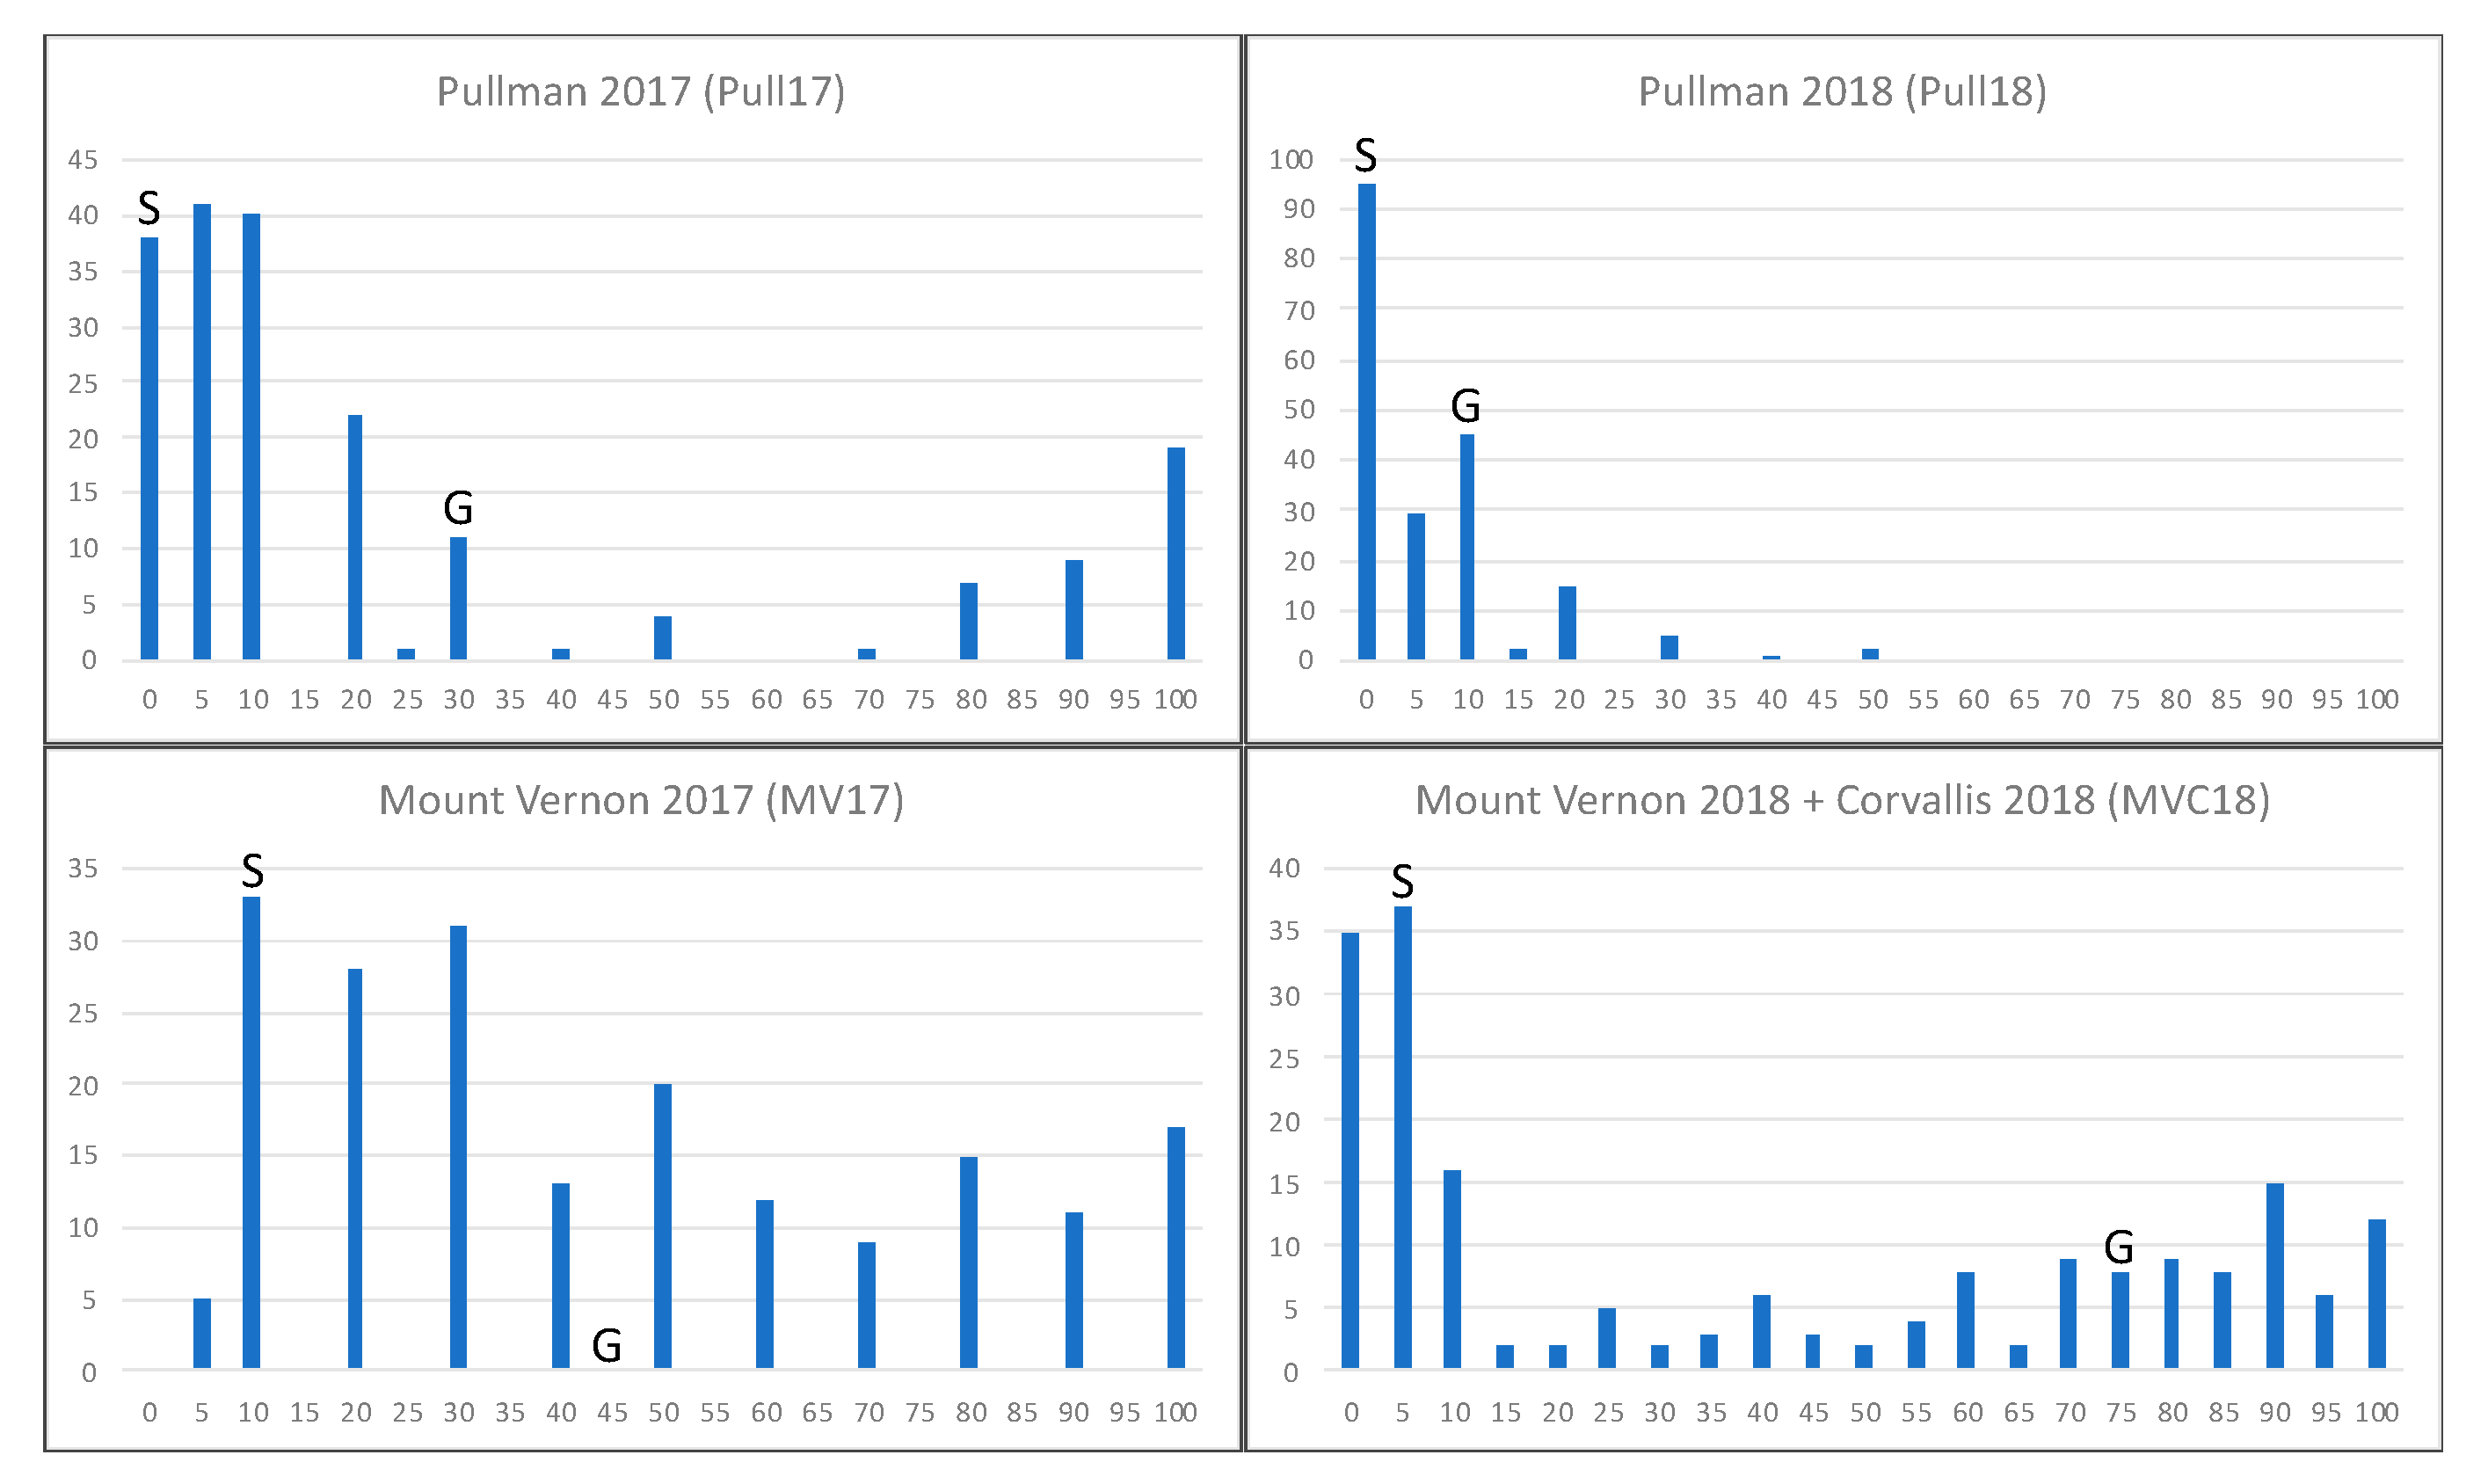
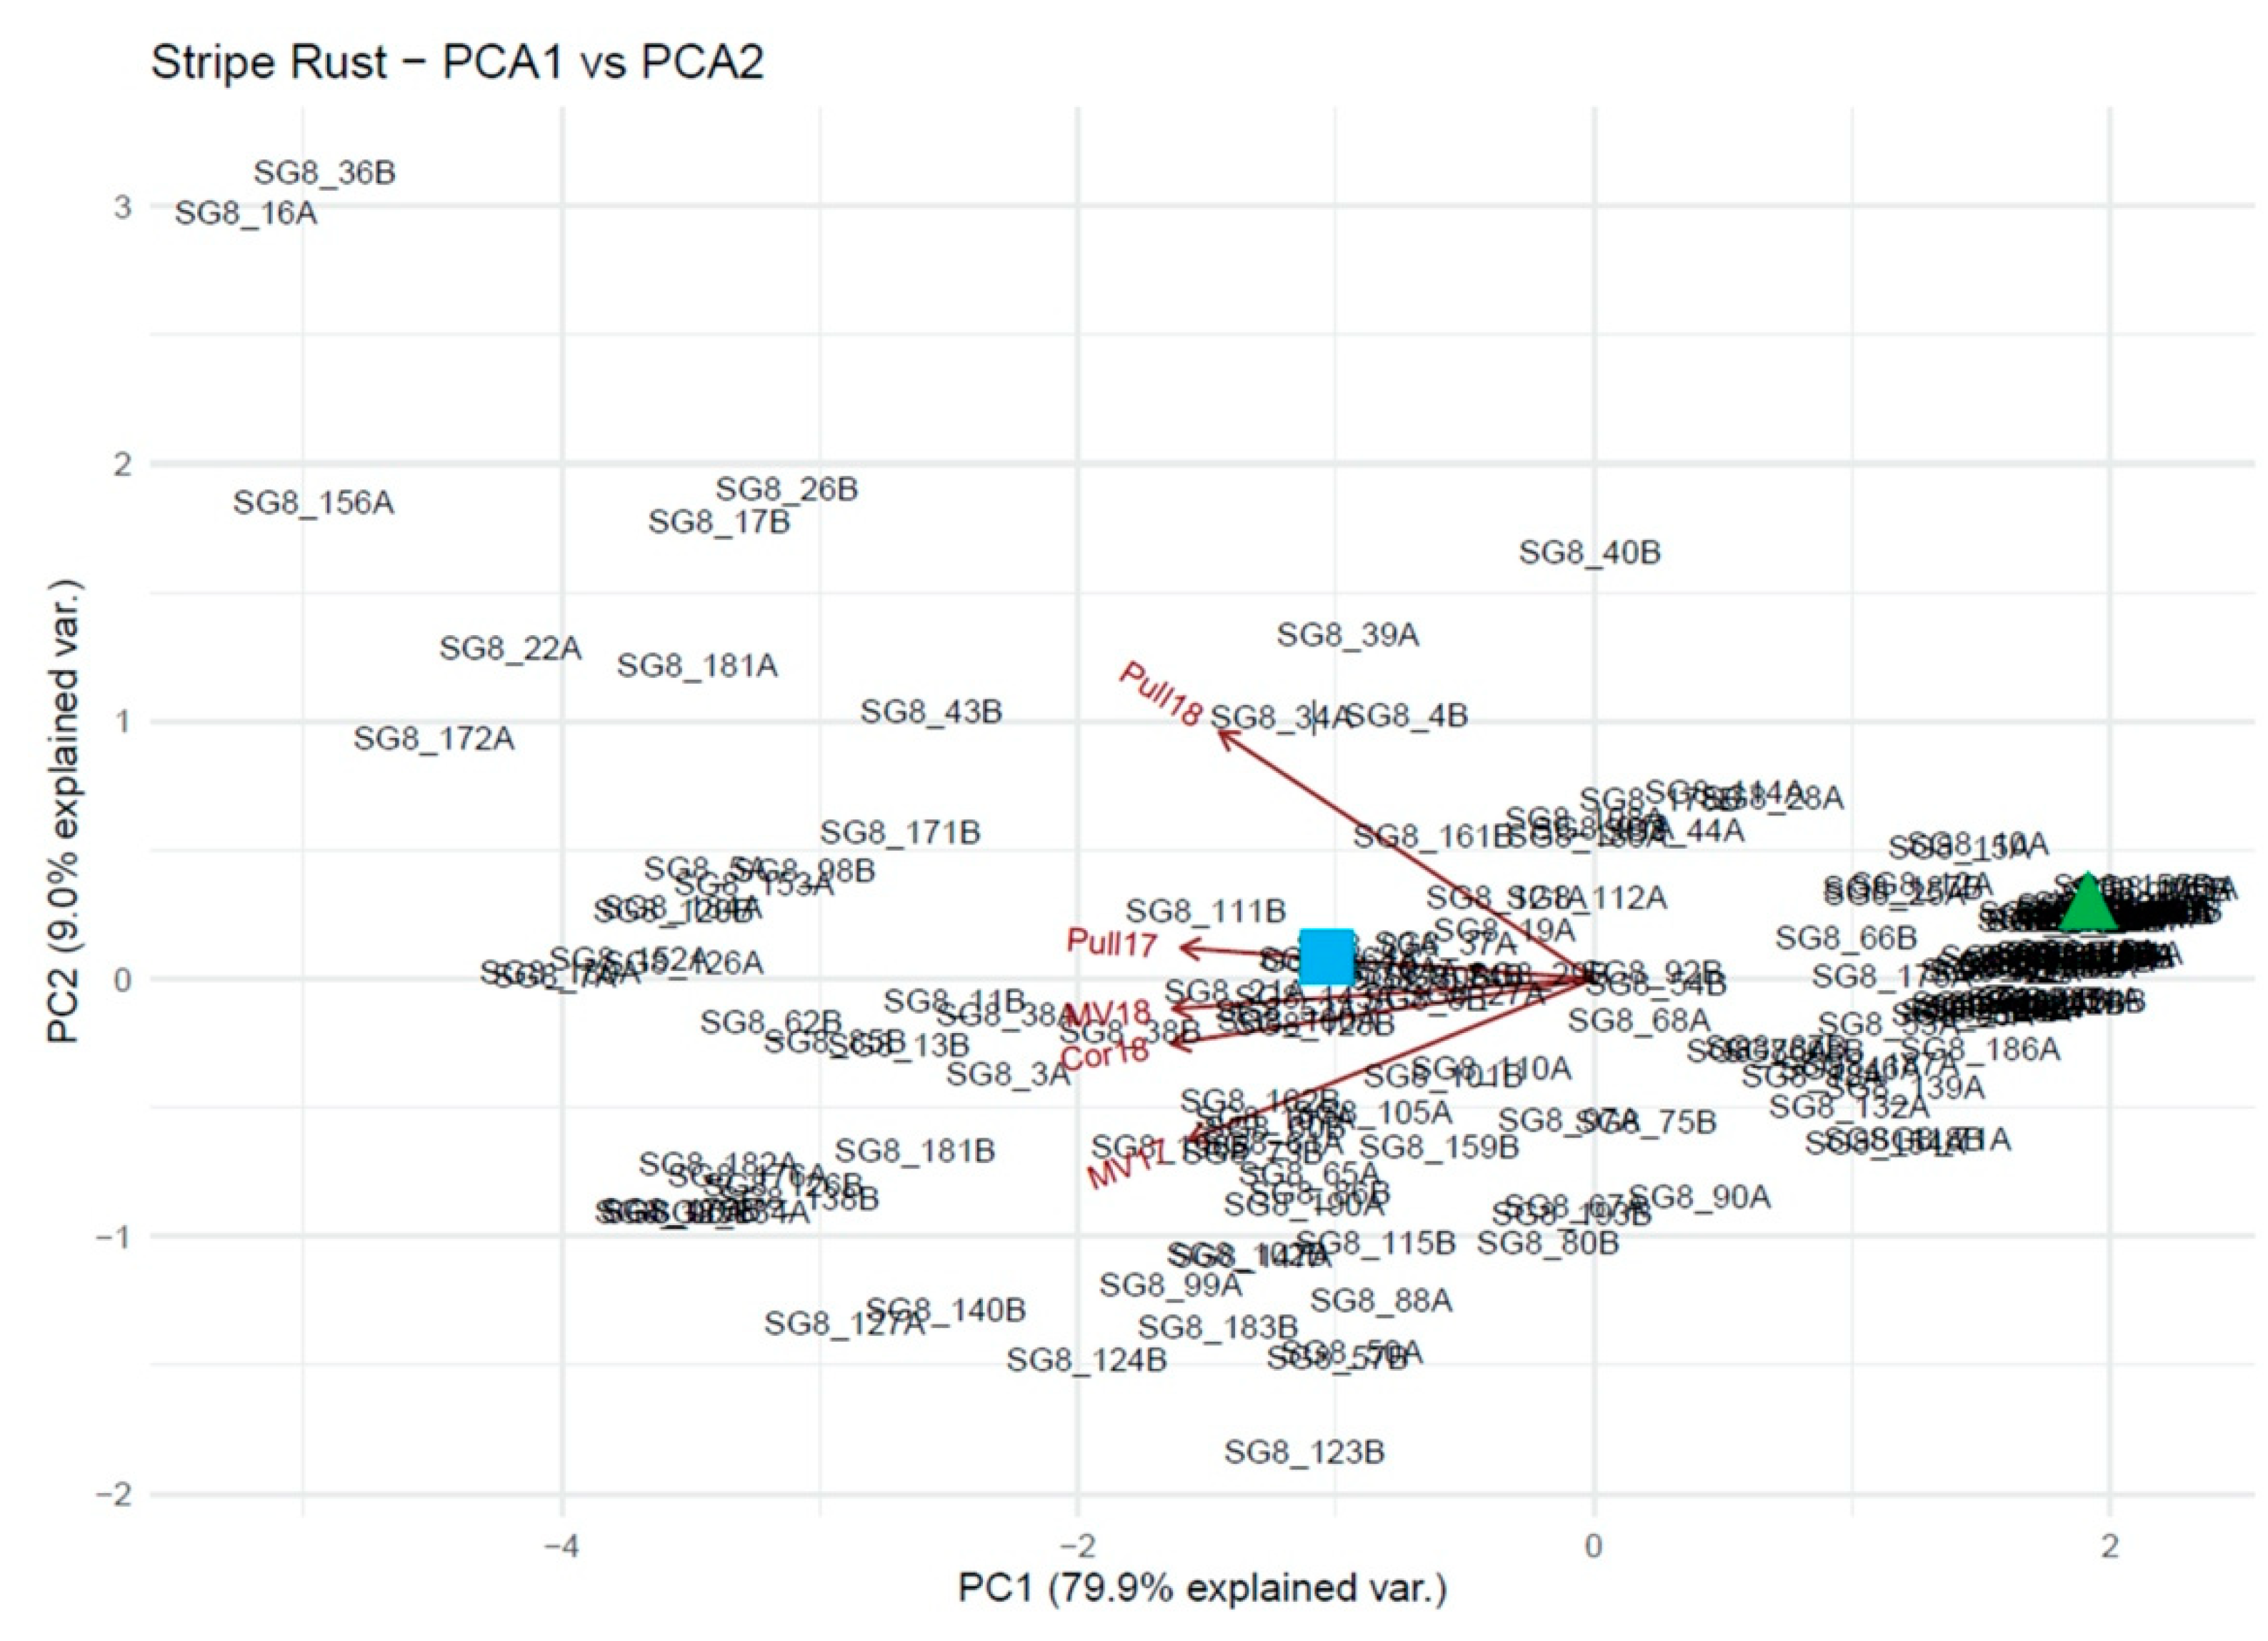
2.1. Stripe Rust Phenotyping
2.2. SNP Genotyping
2.3. Statistical Analyses
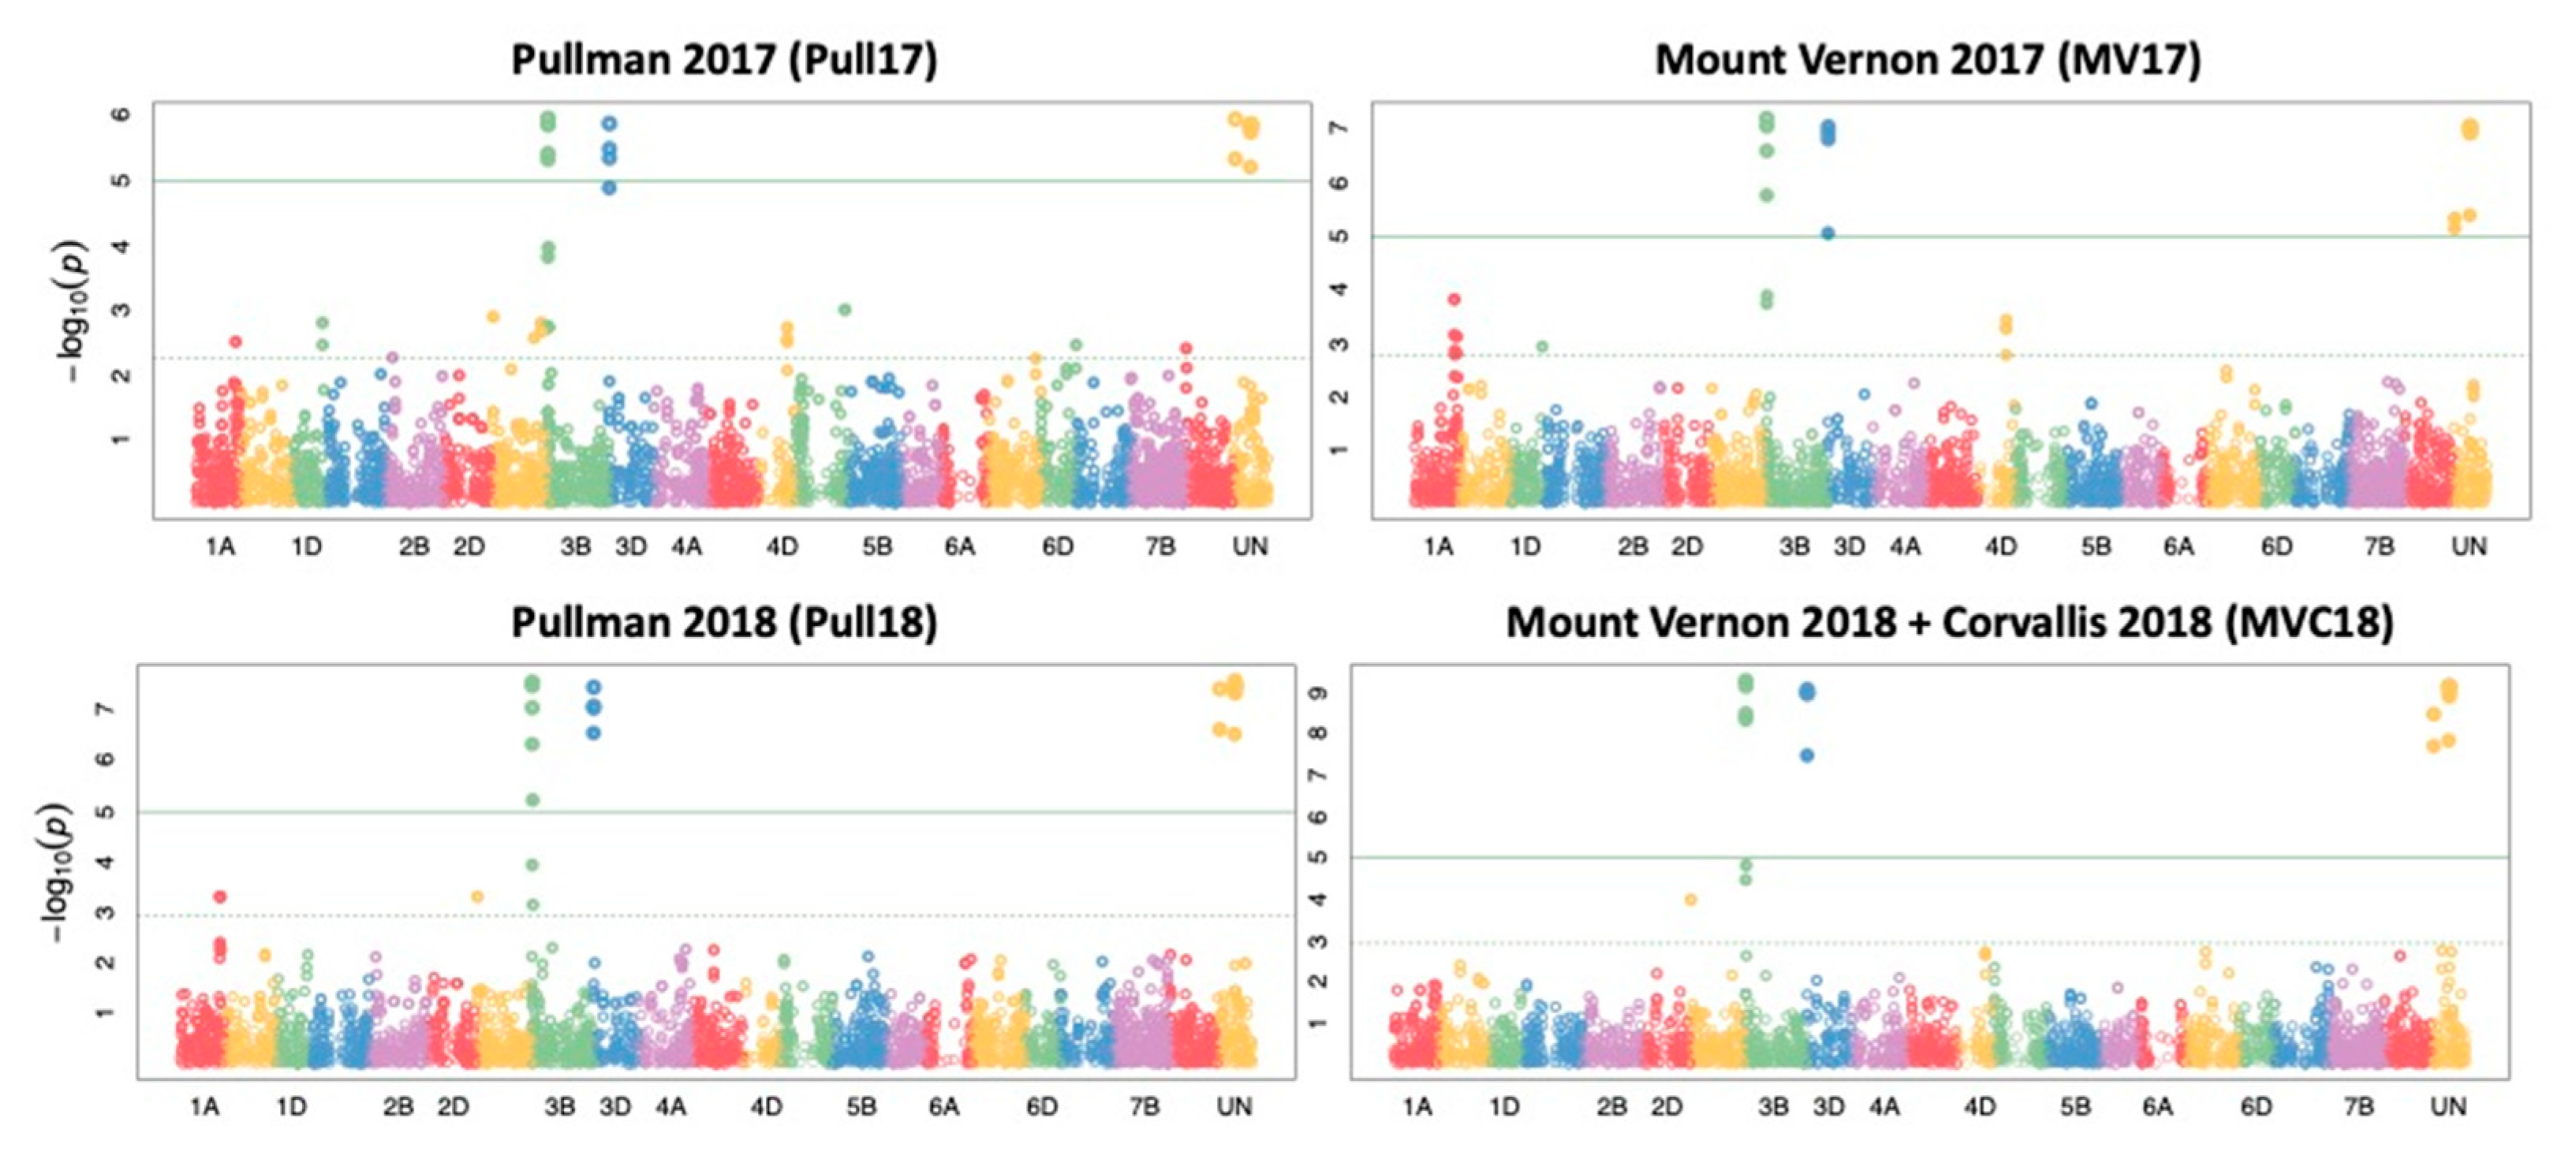
2.4. Genome Wide Association Study
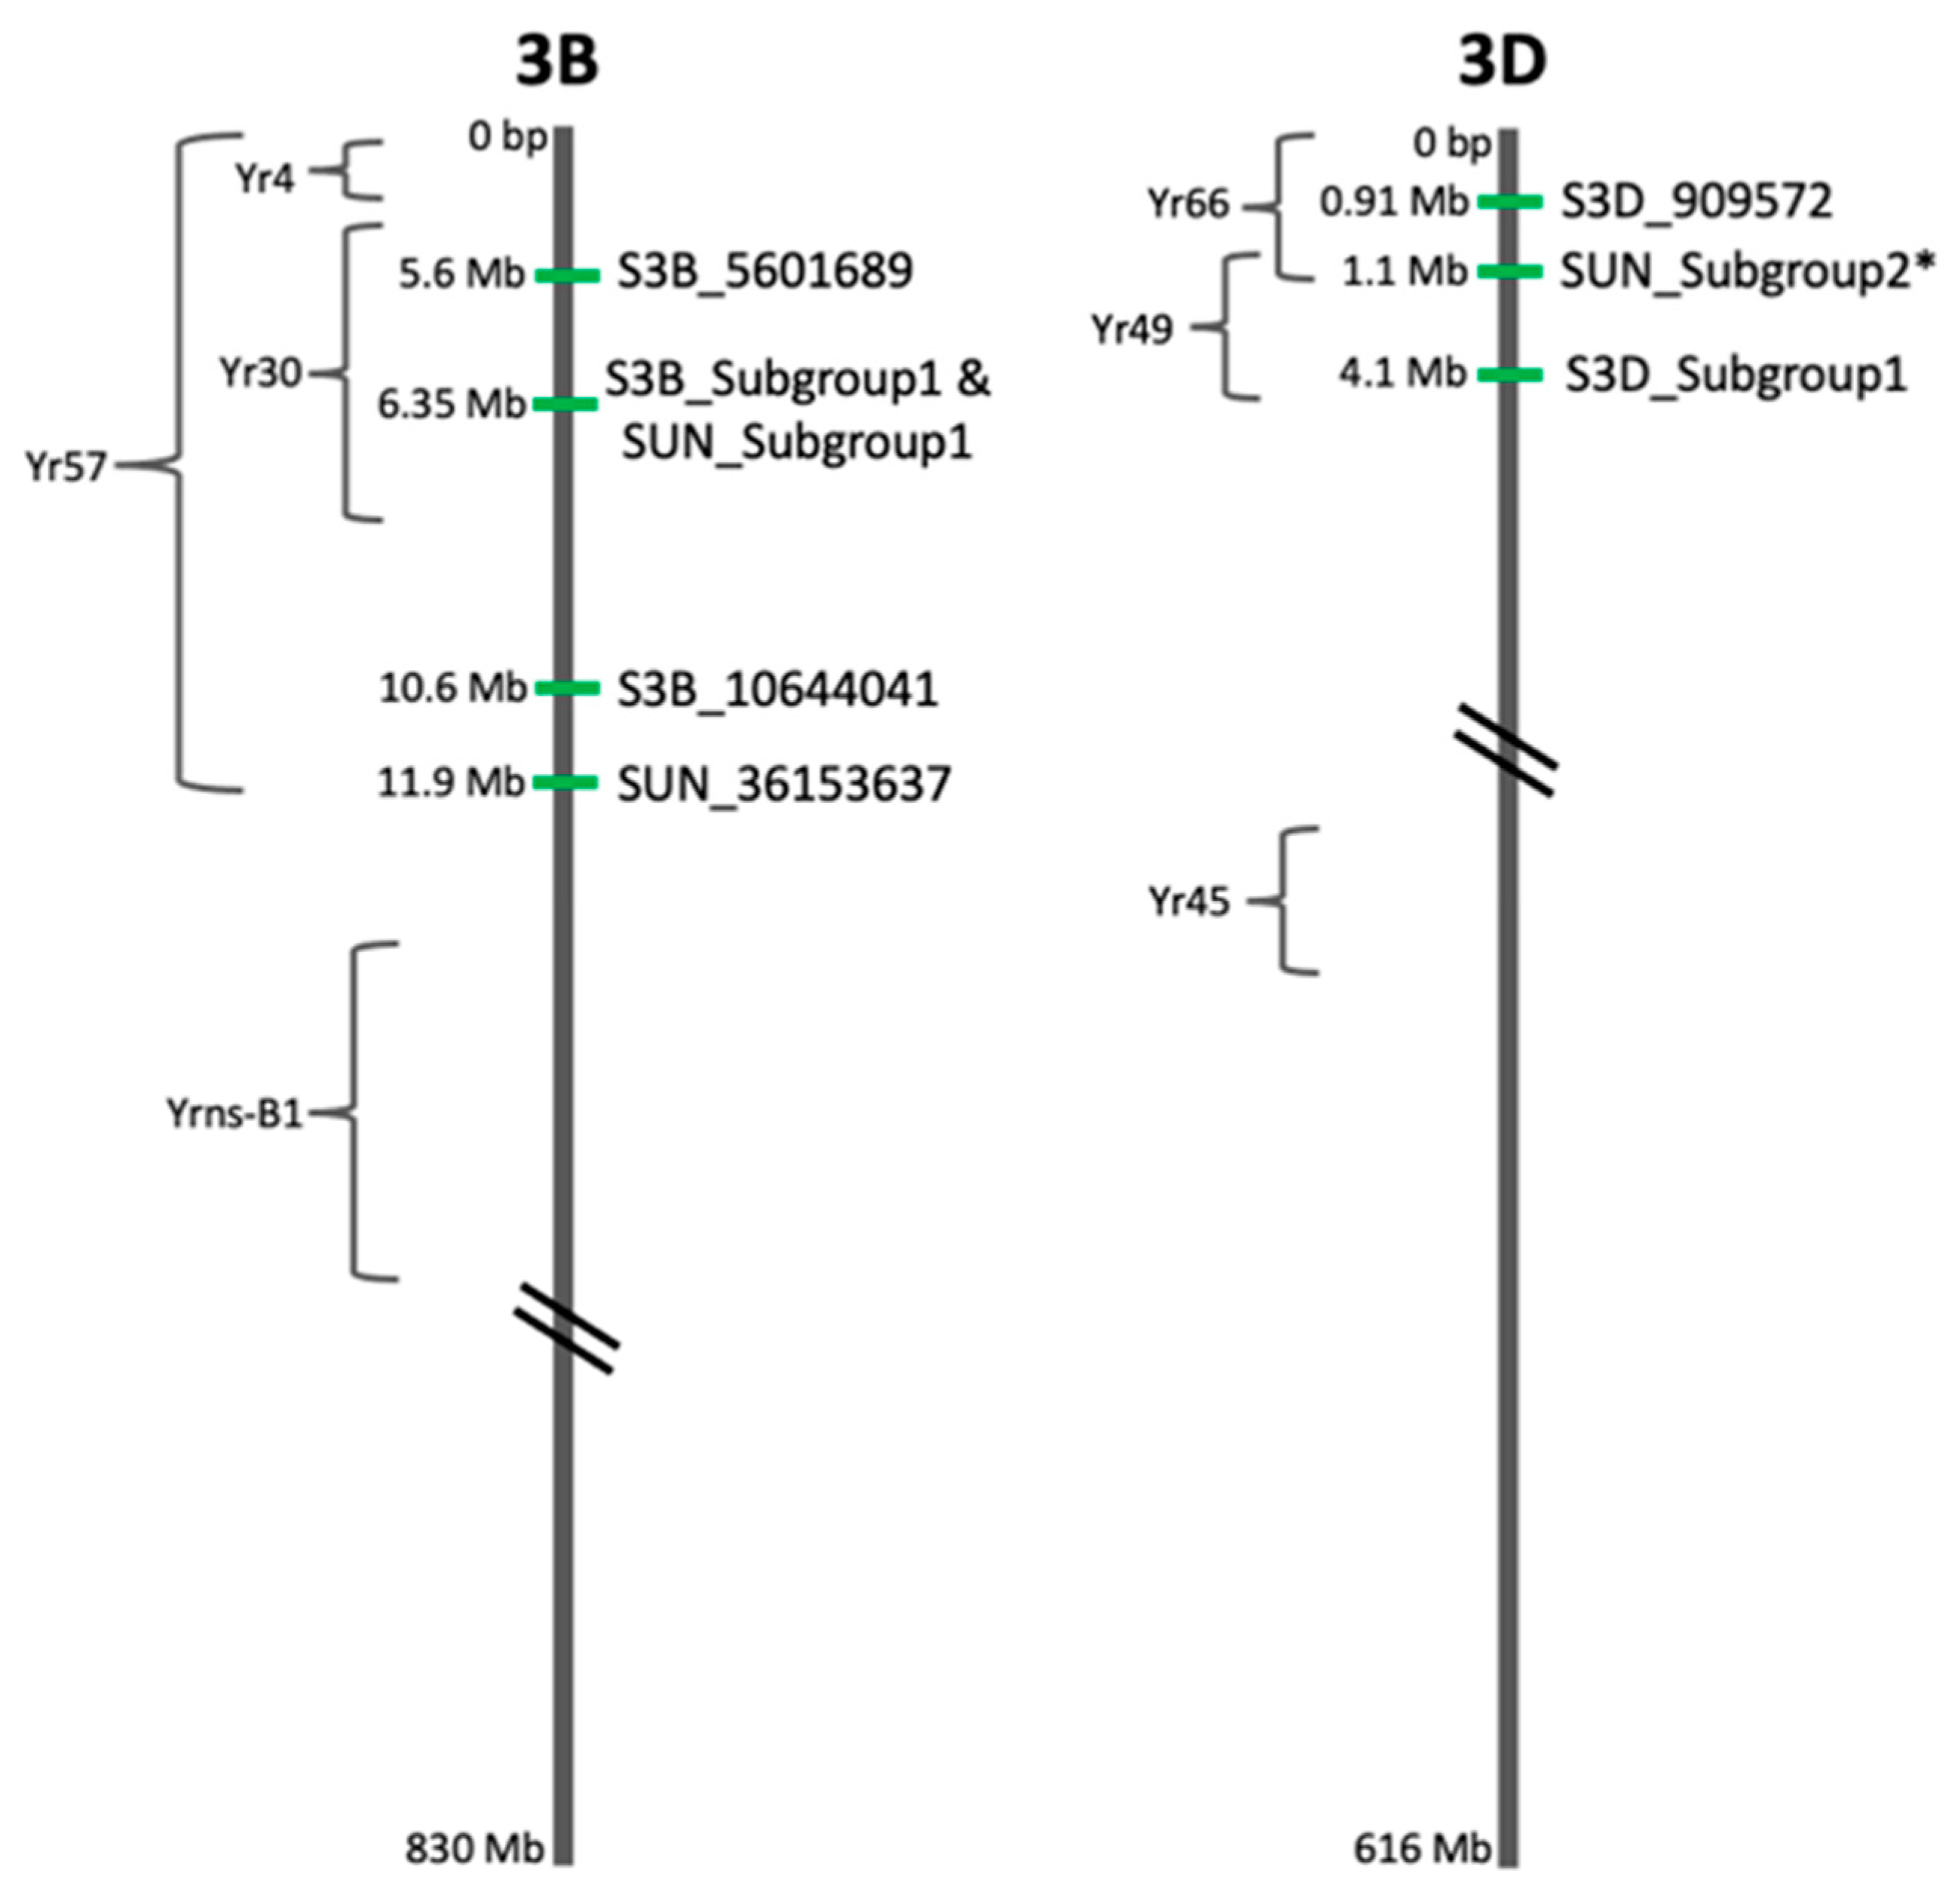
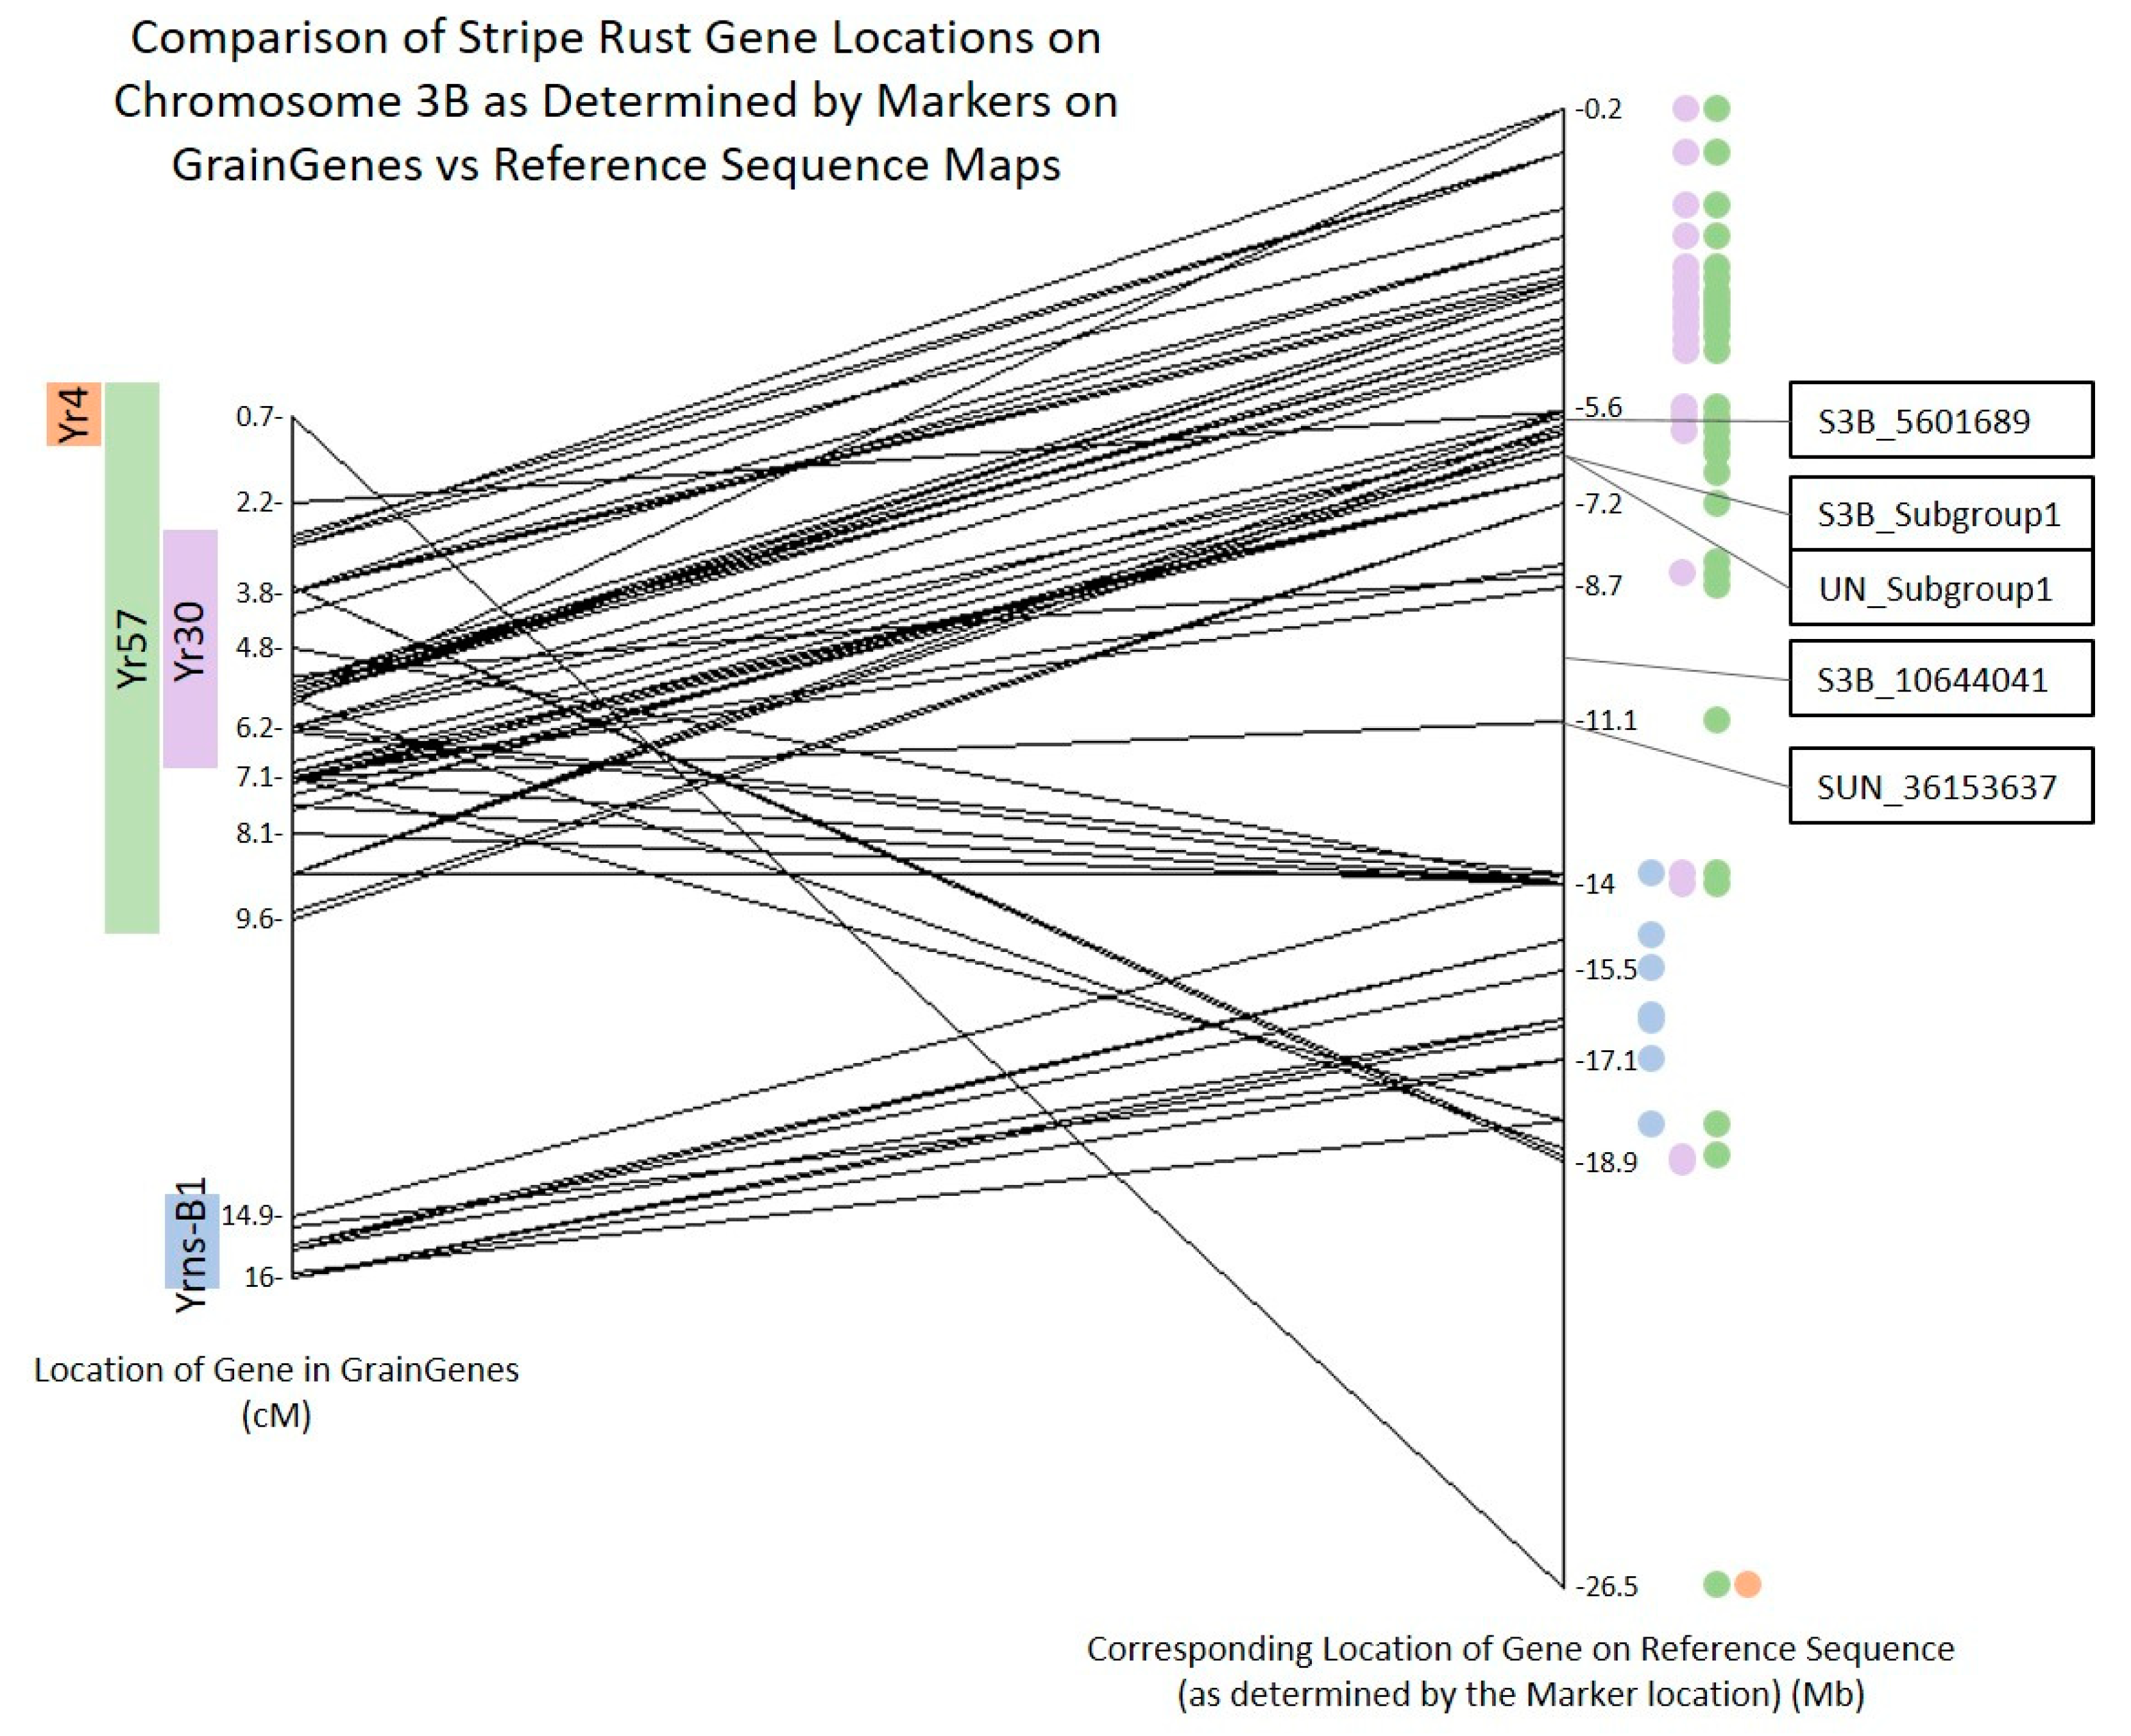
2.5. Candidate Gene Analysis
3. Discussion
4. Materials and Methods
4.1. Germplasm
4.2. Experimental Design and Phenotyping
4.3. DNA Extraction and Genotyping-By-Sequencing
4.4. Statistical Analyses
4.5. Genome Wide Association Study and Candidate Gene Analysis
5. Conclusions
Supplementary Materials
Author Contributions
Funding
Data Availability Statement
Acknowledgments
Conflicts of Interest
References
- Ren, R.S.; Wang, M.N.; Chen, X.M.; Zhang, Z.J. Characterization and molecular mapping of Yr52 for high-temperature adult-plant resistance to stripe rust in spring wheat germplasm PI 183527. Theor. Appl. Genet. 2012, 125, 847–857. [Google Scholar] [CrossRef] [PubMed]
- Chen, X. Review Article: High-Temperature Adult-Plant Resistance, Key for Sustainable Control of Stripe Rust. Am. J. Plant Sci. 2013, 4, 608–627. [Google Scholar] [CrossRef]
- Schwessinger, B. Fundamental wheat stripe rust research in the 21st century. New Phytol. 2017, 213, 1625–1631. [Google Scholar] [CrossRef] [PubMed]
- Chen, X. Integration of cultivar resistance and fungicide application for control of wheat stripe rust. Can. J. Plant Pathol. 2014, 36, 311–326. [Google Scholar] [CrossRef]
- Naruoka, Y.; Garland-Campbell, K.A.; Carter, A.H. Genome-wide association mapping for stripe rust (Puccinia striiformis F. sp. tritici) in US Pacific Northwest winter wheat (Triticum aestivum L.). Theor. Appl. Genet. 2015, 128, 1083–1101. [Google Scholar] [CrossRef]
- Chen, X. Epidemiology and control of stripe rust [Puccinia striiformis f. sp.tritici] on wheat. Can. J. Plant Pathol. 2005, 27, 314–337. [Google Scholar] [CrossRef]
- Maccaferri, M.; Zhang, J.; Bulli, P.; Abate, Z.; Chao, S.; Cantu, D.; Bossolini, E.; Chen, X.; Pumphrey, M.; Dubcovsky, J. A Genome-Wide Association Study of Resistance to Stripe Rust (Puccinia striiformis f. sp. tritici) in a Worldwide Collection of Hexaploid Spring Wheat (Triticum aestivum L.). G3 Genes Genomes Genet. 2015, 5, 449–465. [Google Scholar] [CrossRef]
- Vazquez, M.D.; Peterson, C.J.; Riera-Lizarazu, O.; Chen, X.; Heesacker, A.; Ammar, K.; Crossa, J.; Mundt, C.C. Genetic analysis of adult plant, quantitative resistance to stripe rust in wheat cultivar ‘Stephens’ in multi-environment trials. Theor. Appl. Genet. 2012, 124, 1–11. [Google Scholar] [CrossRef]
- Chen, J.; Chu, C.; Souza, E.J.; Guttieri, M.J.; Chen, X.; Xu, S.; Hole, D.; Zemetra, R. Genome-wide identification of QTL conferring high-temperature adult-plant (HTAP) resistance to stripe rust (Puccinia striiformis f. sp. tritici) in wheat. Mol. Breed. 2011, 29, 791–800. [Google Scholar] [CrossRef]
- Rosewarne, G.M.; Herrera-Foessel, S.A.; Singh, R.P.; Huerta-Espino, J.; Lan, C.X.; He, Z.H. Quantitative trait loci of stripe rust resistance in wheat. Theor. Appl. Genet. 2013, 126, 2427–2449. [Google Scholar] [CrossRef] [PubMed]
- Mundt, C.C. Pyramiding for Resistance Durability: Theory and Practice. Phytopathology 2018, 108, 792–802. [Google Scholar] [CrossRef] [PubMed]
- Bulli, P.; Zhang, J.; Chao, S.; Chen, X.; Pumphrey, M. Genetic Architecture of Resistance to Stripe Rust in a Global Winter Wheat Germplasm Collection. G3 Genes Genomes Genet. 2016, 6, 2237–2253. [Google Scholar] [CrossRef] [PubMed]
- Mu, J.; Liu, L.; Liu, Y.; Wang, M.; See, D.R.; Han, D.; Chen, X. Genome-Wide Association Study and Gene Specific Markers Identified 51 Genes or QTL for Resistance to Stripe Rust in U.S. Winter Wheat Cultivars and Breeding Lines. Front. Plant Sci. 2020, 11, 998. [Google Scholar] [CrossRef]
- Rosewarne, G.M.; Singh, R.P.; Huerta-Espino, J.; Herrera-Foessel, S.A.; Forrest, K.L.; Hayden, M.J.; Rebetzke, G.J. Analysis of leaf and stripe rust severities reveals pathotype changes and multiple minor QTLs associated with resistance in an Avocet × Pastor wheat population. Theor. Appl. Genet. 2012, 124, 1283–1294. [Google Scholar] [CrossRef] [PubMed]
- Liu, L.; Wang, M.; Feng, J.; See, D.R.; Chen, X. Whole-Genome Mapping of Stripe Rust Resistance Quantitative Trait Loci and Race Specificity Related to Resistance Reduction in Winter Wheat Cultivar Eltan. Phytopathology 2019, 109, 1226–1235. [Google Scholar] [CrossRef] [PubMed]
- Liu, L.; Yuan, C.Y.; Wang, M.N.; See, D.R.; Zemetra, R.S.; Chen, X.M. QTL analysis of durable stripe rust resistance in the North American winter wheat cultivar Skiles. Theor. Appl. Genet. 2019, 132, 1677–1691. [Google Scholar] [CrossRef]
- Flowers, M.; Peterson, C.J.; Hulting, A.; John Burns, S.G.; Kuehner, J. Skiles Soft White Winter Wheat; Extension Service, Oregon State University: Corvallis, OR, USA, 2010. [Google Scholar]
- Zeng, Q.; Wu, J.; Liu, S.; Huang, S.; Wang, Q.; Mu, J.; Yu, S.; Han, D.; Kang, Z. A major QTL co-localized on chromosome 6BL and its epistatic interaction for enhanced wheat stripe rust resistance. Theor. Appl. Genet. 2019, 132, 1409–1424. [Google Scholar] [CrossRef] [PubMed]
- Dong, Z.; Hegarty, J.M.; Zhang, J.; Zhang, W.; Chao, S.; Chen, X.; Zhou, Y.; Dubcovsky, J. Validation and characterization of a QTL for adult plant resistance to stripe rust on wheat chromosome arm 6BS (Yr78). Theor. Appl. Genet. 2017, 130, 2127–2137. [Google Scholar] [CrossRef] [PubMed]
- Zeng, Q.; Wu, J.; Liu, S.; Chen, X.; Yuan, F.; Su, P.; Wang, Q.; Huang, S.; Mu, J.; Han, D.; et al. Genome-wide Mapping for Stripe Rust Resistance Loci in Common Wheat Cultivar Qinnong 142. Plant Dis. 2019, 103, 439–447. [Google Scholar] [CrossRef] [PubMed]
- Mu, J.; Huang, S.; Liu, S.; Zeng, Q.; Dai, M.; Wang, Q.; Wu, J.; Yu, S.; Kang, Z.; Han, D. Genetic architecture of wheat stripe rust resistance revealed by combining QTL mapping using SNP-based genetic maps and bulked segregant analysis. Theor. Appl. Genet. 2018, 132, 443–455. [Google Scholar] [CrossRef]
- Ma, J.; Qin, N.; Cai, B.; Chen, G.; Ding, P.; Zhang, H.; Yang, C.; Huang, L.; Mu, Y.; Tang, H.; et al. Identification and validation of a novel major QTL for all-stage stripe rust resistance on 1BL in the winter wheat line 20828. Theor. Appl. Genet. 2019, 132, 1363–1373. [Google Scholar] [CrossRef] [PubMed]
- Juliana, P.; Singh, R.P.; Singh, P.K.; Poland, J.A.; Bergstrom, G.C.; Huerta-Espino, J.; Bhavani, S.; Crossa, J.; Sorrells, M.E. Genome-wide association mapping for resistance to leaf rust, stripe rust and tan spot in wheat reveals potential candidate genes. Theor. Appl. Genet. 2018, 131, 1405–1422. [Google Scholar] [CrossRef] [PubMed]
- Collard, B.C.; Mackill, D.J. Marker-assisted selection: An approach for precision plant breeding in the twenty-first century. Philos. Trans. R. Soc. B Biol. Sci. 2007, 363, 557–572. [Google Scholar] [CrossRef] [PubMed]
- Berkman, P.J.; Lai, K.; Lorenc, M.T.; Edwards, D. Next-generation sequencing applications for wheat crop improvement. Am. J. Bot. 2012, 99, 365–371. [Google Scholar] [CrossRef] [PubMed]
- Flowers, M.D.; Peterson, C.J. Goetze, Soft Winter Wheat; Extension Service, Oregon State University: Corvallis, OR, USA, 2008. [Google Scholar]
- The International Wheat Genome Sequencing Consortium, (IWGSC); Appels, R.; Eversole, K.; Stein, N.; Feuillet, C.; Keller, B.; Rogers, J.; Pozniak, C.J.; Choulet, F.; Distelfeld, A.; et al. Shifting the limits in wheat research and breeding using a fully annotated reference genome. Science 2018, 361, eaar7191. [Google Scholar] [CrossRef]
- GrainGenes Class Browser: Map. [Online]. Available online: https://wheat.pw.usda.gov/cgi-bin/GG3/browse.cgi?class=map (accessed on 10 February 2020).
- Verdeprado, H.; Kretzschmar, T.; Begum, H.; Raghavan, C.; Joyce, P.; Lakshmanan, P.; Cobb, J.N.; Collard, B.C. Association mapping in rice: Basic concepts and perspectives for molecular breeding. Plant Prod. Sci. 2018, 21, 159–176. [Google Scholar] [CrossRef]
- Famoso, A.N.; Zhao, K.; Clark, R.T.; Tung, C.-W.; Wright, M.H.; Bustamante, C.; Kochian, L.V.; McCouch, S.R. Genetic Architecture of Aluminum Tolerance in Rice (Oryza sativa) Determined through Genome-Wide Association Analysis and QTL Mapping. PLoS Genet. 2011, 7, e1002221. [Google Scholar] [CrossRef]
- Alqudah, A.M.; Sallam, A.; Baenziger, P.S.; Börner, A. GWAS: Fast-forwarding gene identification and characterization in temperate Cereals: Lessons from Barley—A review. J. Adv. Res. 2020, 22, 119–135. [Google Scholar] [CrossRef]
- Lv, G.; Dong, Z.; Wang, Y.; Geng, J.; Li, J.; Lv, X.; Sun, C.; Ren, Y.; Zhang, J.; Chen, F. Identification of Genetic Loci of Black Point in Chinese Common Wheat by Genome-Wide Association Study and Linkage Mapping. Plant Dis. 2020, 104, 2005–2013. [Google Scholar] [CrossRef]
- Shi, C.; Zheng, Y.; Geng, J.; Liu, C.; Pei, H.; Ren, Y.; Dong, Z.; Zhao, L.; Zhang, N.; Chen, F. Identification of herbicide resistance loci using a genome-wide association study and linkage mapping in Chinese common wheat. Crop. J. 2020, 8, 666–675. [Google Scholar] [CrossRef]
- Zhao, X.; Luo, L.; Cao, Y.; Liu, Y.; Li, Y.; Wu, W.; Lan, Y.; Jiang, Y.; Gao, S.; Zhang, Z.; et al. Genome-wide association analysis and QTL mapping reveal the genetic control of cadmium accumulation in maize leaf. BMC Genom. 2018, 19, 91. [Google Scholar] [CrossRef] [PubMed]
- Wan, A.; Chen, X. Virulence Characterization of Puccinia striiformis f. sp. tritici Using a New Set of Yr Single-Gene Line Differentials in the United States in 2010. Plant Dis. 2014, 98, 1534–1542. [Google Scholar] [CrossRef] [PubMed]
- Wan, A.; Chen, X.; Yuen, J. Races of Puccinia striiformis f. sp. tritici in the United States in 2011 and 2012 and Comparison with Races in 2010. Plant Dis. 2016, 100, 966–975. [Google Scholar] [CrossRef] [PubMed]
- Small, I.D.; Peeters, N. The PPR motif—A TPR-related motif prevalent in plant organellar proteins. Trends Biochem. Sci. 2000, 25, 45–47. [Google Scholar] [CrossRef]
- Padmanabhan, M.; Cournoyer, P.; Dinesh-Kumar, S.P. The leucine-rich repeat domain in plant innate immunity: A wealth of possibilities. Cell. Microbiol. 2009, 11, 191–198. [Google Scholar] [CrossRef] [PubMed]
- Wang, S.; Wong, D.; Forrest, K.; Allen, A.; Chao, S.; Huang, B.E.; Maccaferri, M.; Salvi, S.; Milner, S.G.; Cattivelli, L.; et al. Characterization of polyploid wheat genomic diversity using a high-density 90 000 single nucleotide polymorphism array. Plant Biotechnol. J. 2014, 12, 787–796. [Google Scholar] [CrossRef]
- Spielmeyer, W.; Sharp, P.J.; Lagudah, E.S. Identification and validation of markers linked to broad-spectrum stem rust resistance gene Sr2 in wheat (Triticum aestivum L.). Crop Sci. 2003, 43, 333–336. [Google Scholar] [CrossRef]
- Zheng, S.; Li, Y.; Lu, L.; Liu, Z.; Zhang, C.; Ao, D.; Li, L.; Zhang, C.; Liu, R.; Luo, C.; et al. Evaluating the contribution of Yr genes to stripe rust resistance breeding through marker-assisted detection in wheat. Euphytica 2017, 213, 50. [Google Scholar] [CrossRef]
- Bariana, H.; Forrest, K.; Qureshi, N.; Miah, H.; Hayden, M.; Bansal, U. Adult plant stripe rust resistance gene Yr71 maps close to Lr24 in chromosome 3D of common wheat. Mol. Breed. 2016, 36, 98. [Google Scholar] [CrossRef]
- McIntosh, R.A.; Dubcovsky, J.; Rogers, W.J.; Morris, C.; Appels, R.; Xia, X.C. Catalogue of Gene Symbols for Wheat: 2013–2014 Supplement; Komugi, 2013; Available online: https://wheat.pw.usda.gov/GG3/wgc (accessed on 17 March 2021).
- Ellis, J.G.; Lagudah, E.S.; Spielmeyer, W.; Dodds, P.N. The past, present and future of breeding rust resistant wheat. Front. Plant Sci. 2014, 5, 641. [Google Scholar] [CrossRef] [PubMed]
- Zadoks, J.C.; Chang, T.T.; Konzak, C.F. A decimal code for the growth stages of cereals. Weed Res. 1974, 14, 415–421. [Google Scholar] [CrossRef]
- Merriman, B.; Team, I.T.R.; Rothberg, J.M. Progress in Ion Torrent semiconductor chip based sequencing. Electrophoresis 2012, 33, 3397–3417. [Google Scholar] [CrossRef] [PubMed]
- Kohn, A.B.; Moroz, T.P.; Barnes, J.P.; Netherton, M.; Moroz, L.L. Single-cell semiconductor sequencing. Methods Mol. Biol. 2014, 1048, 247–284. [Google Scholar] [CrossRef]
- Glaubitz, J.C.; Casstevens, T.M.; Lu, F.; Harriman, J.; Elshire, R.J.; Sun, Q.; Buckler, E.S. TASSEL-GBS: A High Capacity Genotyping by Sequencing Analysis Pipeline. PLoS ONE 2014, 9, e90346. [Google Scholar] [CrossRef] [PubMed]
- Li, H.; Durbin, R. Fast and accurate short read alignment with Burrows-Wheeler transform. Bioinformatics 2009, 25, 1754–1760. [Google Scholar] [CrossRef] [PubMed]
- Swarts, K.; Li, H.; Navarro, J.A.R.; An, D.; Romay, M.C.; Hearne, S.; Acharya, C.; Glaubitz, J.C.; Mitchell, S.; Elshire, R.J.; et al. Novel Methods to Optimize Genotypic Imputation for Low-Coverage, Next-Generation Sequence Data in Crop Plants. Plant Genome 2014, 7, 1–12. [Google Scholar] [CrossRef]
- RStudio | Open Source & Professional Software for Data Science Teams. [Online]. Available online: https://rstudio.com/ (accessed on 10 February 2020).
- Pinheiro, J.; Bates, D.; DebRoy, S.; Sarkar, D.; the R Development Core Team. Nlme: Linear and Nonlinear Mixed Effects Models; R Package Version 3.1-108; R Development Core Team: Vienna, Austria, 2013. [Google Scholar]
- Vu, V.Q. ggbiplot: A ggplot2 Based Biplot; R Package Version 0.55. 2011. Available online: https://ggplot2.tidyverse.org (accessed on 10 February 2020).
- Lipka, A.E.; Tian, F.; Wang, Q.; Peiffer, J.; Li, M.; Bradbury, P.J.; Gore, M.A.; Buckler, E.S.; Zhang, Z. GAPIT: Genome association and prediction integrated tool. Bioinformatics 2012, 28, 2397–2399. [Google Scholar] [CrossRef]
- Zhang, Z.; Ersoz, E.; Lai, C.-Q.; Todhunter, R.J.; Tiwari, H.K.; A Gore, M.; Bradbury, P.J.; Yu, J.; Arnett, D.K.; Ordovas, J.M.; et al. Mixed linear model approach adapted for genome-wide association studies. Nat. Genet. 2010, 42, 355–360. [Google Scholar] [CrossRef] [PubMed]
- E Hunt, S.; McLaren, W.; Gil, L.; Thormann, A.; Schuilenburg, H.; Sheppard, D.; Parton, A.; Armean, I.M.; Trevanion, S.J.; Flicek, P.; et al. Ensembl variation resources. Database 2018, 2018, 1–12. [Google Scholar] [CrossRef] [PubMed]
- The UniProt Consortium UniProt: A worldwide hub of protein knowledge. Nucleic Acids Res. 2019, 47, D506–D515. [CrossRef] [PubMed]
- Marchler-Bauer, A.; Bo, Y.; Han, L.; He, J.; Lanczycki, C.J.; Lu, S.; Chitsaz, F.; Derbyshire, M.K.; Geer, R.C.; Gonzales, N.R.; et al. CDD/SPARCLE: Functional classification of proteins via subfamily domain architectures. Nucleic Acids Res. 2017, 45, D200–D203. [Google Scholar] [CrossRef] [PubMed]


| Loc/Year | SNP | Chr | Position (bp) | p-Value | MAF | R2 of Model without SNP | R2 of Model with SNP | Effect |
|---|---|---|---|---|---|---|---|---|
| Pull17 | S3B_5601689 | 3B | 5601689 | 4.92E-06 | 0.4897 | 0.0293 | 0.1417 | −14.4141 |
| S3B_6309966 | 3B | 6309966 | 1.14E-06 | 0.4948 | 0.0293 | 0.1578 | −15.5142 | |
| S3B_6309968 | 3B | 6309968 | 1.44E-06 | 0.4948 | 0.0293 | 0.1552 | 15.2734 | |
| S3B_6309973 | 3B | 6309973 | 3.97E-06 | 0.4923 | 0.0293 | 0.1441 | −14.7001 | |
| S3D_4068757 | 3D | 4068757 | 4.67E-06 | 0.4923 | 0.0293 | 0.1423 | −14.5157 | |
| S3D_4068759 | 3D | 4068759 | 1.37E-06 | 0.4948 | 0.0293 | 0.1558 | 15.3027 | |
| S3D_4068764 | 3D | 4068764 | 3.37E-06 | 0.5000 | 0.0293 | 0.1459 | −14.7276 | |
| SUN_234960006 | UN | 234960006 | 6.41E-06 | 0.4871 | 0.0293 | 0.1389 | 14.0261 | |
| SUN_242439365 | UN | 242439365 | 1.40E-06 | 0.4974 | 0.0293 | 0.1556 | 15.3145 | |
| SUN_242439370 | UN | 242439370 | 1.64E-06 | 0.4923 | 0.0293 | 0.1538 | −15.2480 | |
| SUN_242439372 | UN | 242439372 | 1.44E-06 | 0.4948 | 0.0293 | 0.1552 | 15.2734 | |
| SUN_242452400 | UN | 242452400 | 1.44E-06 | 0.4948 | 0.0293 | 0.1552 | 15.2734 | |
| SUN_242452405 | UN | 242452405 | 1.85E-06 | 0.4923 | 0.0293 | 0.1525 | −15.0780 | |
| SUN_242452407 | UN | 242452407 | 1.44E-06 | 0.4948 | 0.0293 | 0.1552 | 15.2734 | |
| SUN_34103779 | UN | 34103779 | 4.82E-06 | 0.4871 | 0.0293 | 0.1420 | −14.1982 | |
| SUN_36153637 | UN | 36153637 | 1.18E-06 | 0.4923 | 0.0293 | 0.1575 | 15.2504 | |
| Pull18 | S3B_10644041 | 3B | 10644041 | 6.31E-06 | 0.4948 | 0.0454 | 0.1533 | −3.6371 |
| S3B_5601689 | 3B | 5601689 | 9.62E-08 | 0.4897 | 0.0454 | 0.1993 | −4.5888 | |
| S3B_6309966 | 3B | 6309966 | 3.01E-08 | 0.4948 | 0.0454 | 0.2124 | −4.8326 | |
| S3B_6309968 | 3B | 6309968 | 3.53E-08 | 0.4948 | 0.0454 | 0.2106 | 4.7814 | |
| S3B_6309973 | 3B | 6309973 | 5.02E-07 | 0.4923 | 0.0454 | 0.1808 | −4.3634 | |
| S3D_4068757 | 3D | 4068757 | 9.81E-08 | 0.4923 | 0.0454 | 0.1990 | −4.6159 | |
| S3D_4068759 | 3D | 4068759 | 3.80E-08 | 0.4948 | 0.0454 | 0.2098 | 4.7628 | |
| S3D_4068764 | 3D | 4068764 | 8.89E-08 | 0.5000 | 0.0454 | 0.2001 | −4.6256 | |
| S3D_909572 | 3D | 909572 | 3.03E-07 | 0.4871 | 0.0454 | 0.1864 | 4.4075 | |
| SUN_234960006 | UN | 234960006 | 3.19E-07 | 0.4871 | 0.0454 | 0.1858 | 4.3198 | |
| SUN_242439365 | UN | 242439365 | 2.82E-08 | 0.4974 | 0.0454 | 0.2132 | 4.8227 | |
| SUN_242439370 | UN | 242439370 | 4.26E-08 | 0.4923 | 0.0454 | 0.2085 | −4.7693 | |
| SUN_242439372 | UN | 242439372 | 3.53E-08 | 0.4948 | 0.0454 | 0.2106 | 4.7814 | |
| SUN_242452400 | UN | 242452400 | 3.53E-08 | 0.4948 | 0.0454 | 0.2106 | 4.7814 | |
| SUN_242452405 | UN | 242452405 | 4.94E-08 | 0.4923 | 0.0454 | 0.2068 | −4.7150 | |
| SUN_242452407 | UN | 242452407 | 3.53E-08 | 0.4948 | 0.0454 | 0.2106 | 4.7814 | |
| SUN_34103779 | UN | 34103779 | 2.57E-07 | 0.4871 | 0.0454 | 0.1883 | −4.3396 | |
| SUN_36153637 | UN | 36153637 | 4.08E-08 | 0.4923 | 0.0454 | 0.2090 | 4.6933 | |
| MV17 | S3B_5601689 | 3B | 5601689 | 1.83E-06 | 0.4897 | 0.0399 | 0.1618 | −13.6630 |
| S3B_6309966 | 3B | 6309966 | 6.72E-08 | 0.4948 | 0.0399 | 0.1987 | −15.7371 | |
| S3B_6309968 | 3B | 6309968 | 9.41E-08 | 0.4948 | 0.0399 | 0.1948 | 15.4645 | |
| S3B_6309973 | 3B | 6309973 | 2.71E-07 | 0.4923 | 0.0399 | 0.1829 | −14.9769 | |
| S3D_4068757 | 3D | 4068757 | 1.64E-07 | 0.4923 | 0.0399 | 0.1886 | −15.1775 | |
| S3D_4068759 | 3D | 4068759 | 9.68E-08 | 0.4948 | 0.0399 | 0.1945 | 15.4336 | |
| S3D_4068764 | 3D | 4068764 | 1.25E-07 | 0.5000 | 0.0399 | 0.1917 | −15.3139 | |
| S3D_909572 | 3D | 909572 | 9.27E-06 | 0.4871 | 0.0399 | 0.1443 | 12.6911 | |
| SUN_234960006 | UN | 234960006 | 4.29E-06 | 0.4871 | 0.0399 | 0.1526 | 12.9439 | |
| SUN_242439365 | UN | 242439365 | 1.24E-07 | 0.4974 | 0.0399 | 0.1918 | 15.3257 | |
| SUN_242439370 | UN | 242439370 | 1.26E-07 | 0.4923 | 0.0399 | 0.1915 | −15.3581 | |
| SUN_242439372 | UN | 242439372 | 9.41E-08 | 0.4948 | 0.0399 | 0.1948 | 15.4645 | |
| SUN_242452400 | UN | 242452400 | 9.41E-08 | 0.4948 | 0.0399 | 0.1948 | 15.4645 | |
| SUN_242452405 | UN | 242452405 | 1.11E-07 | 0.4923 | 0.0399 | 0.1929 | −15.3378 | |
| SUN_242452407 | UN | 242452407 | 9.41E-08 | 0.4948 | 0.0399 | 0.1948 | 15.4645 | |
| SUN_34103779 | UN | 34103779 | 7.49E-06 | 0.4871 | 0.0399 | 0.1466 | −12.5548 | |
| SUN_36153637 | UN | 36153637 | 4.92E-06 | 0.4923 | 0.0399 | 0.1511 | 12.9378 | |
| MVC18 | S3B_5601689 | 3B | 5601689 | 4.87E-09 | 0.4897 | 0.1426 | 0.3115 | −22.4636 |
| S3B_6309966 | 3B | 6309966 | 5.65E-10 | 0.4948 | 0.1426 | 0.3344 | −24.5208 | |
| S3B_6309968 | 3B | 6309968 | 7.64E-10 | 0.4948 | 0.1426 | 0.3312 | 24.2253 | |
| S3B_6309973 | 3B | 6309973 | 3.51E-09 | 0.4923 | 0.1426 | 0.3150 | −23.3131 | |
| S3D_4068757 | 3D | 4068757 | 1.14E-09 | 0.4923 | 0.1426 | 0.3269 | −23.7960 | |
| S3D_4068759 | 3D | 4068759 | 1.17E-09 | 0.4948 | 0.1426 | 0.3266 | 23.7896 | |
| S3D_4068764 | 3D | 4068764 | 9.19E-10 | 0.5000 | 0.1426 | 0.3292 | −23.8661 | |
| S3D_909572 | 3D | 909572 | 3.61E-08 | 0.4871 | 0.1426 | 0.2908 | 20.9861 | |
| SUN_234960006 | UN | 234960006 | 1.57E-08 | 0.4871 | 0.1426 | 0.2993 | 21.2737 | |
| SUN_242439365 | UN | 242439365 | 9.10E-10 | 0.4974 | 0.1426 | 0.3293 | 24.0836 | |
| SUN_242439370 | UN | 242439370 | 1.14E-09 | 0.4923 | 0.1426 | 0.3269 | −24.0405 | |
| SUN_242439372 | UN | 242439372 | 7.64E-10 | 0.4948 | 0.1426 | 0.3312 | 24.2253 | |
| SUN_242452400 | UN | 242452400 | 7.64E-10 | 0.4948 | 0.1426 | 0.3312 | 24.2253 | |
| SUN_242452405 | UN | 242452405 | 1.35E-09 | 0.4923 | 0.1426 | 0.3251 | −23.7279 | |
| SUN_242452407 | UN | 242452407 | 7.64E-10 | 0.4948 | 0.1426 | 0.3312 | 24.2253 | |
| SUN_34103779 | UN | 34103779 | 2.13E-08 | 0.4871 | 0.1426 | 0.2962 | −20.8097 | |
| SUN_36153637 | UN | 36153637 | 3.62E-09 | 0.4923 | 0.1426 | 0.3146 | 22.5449 |
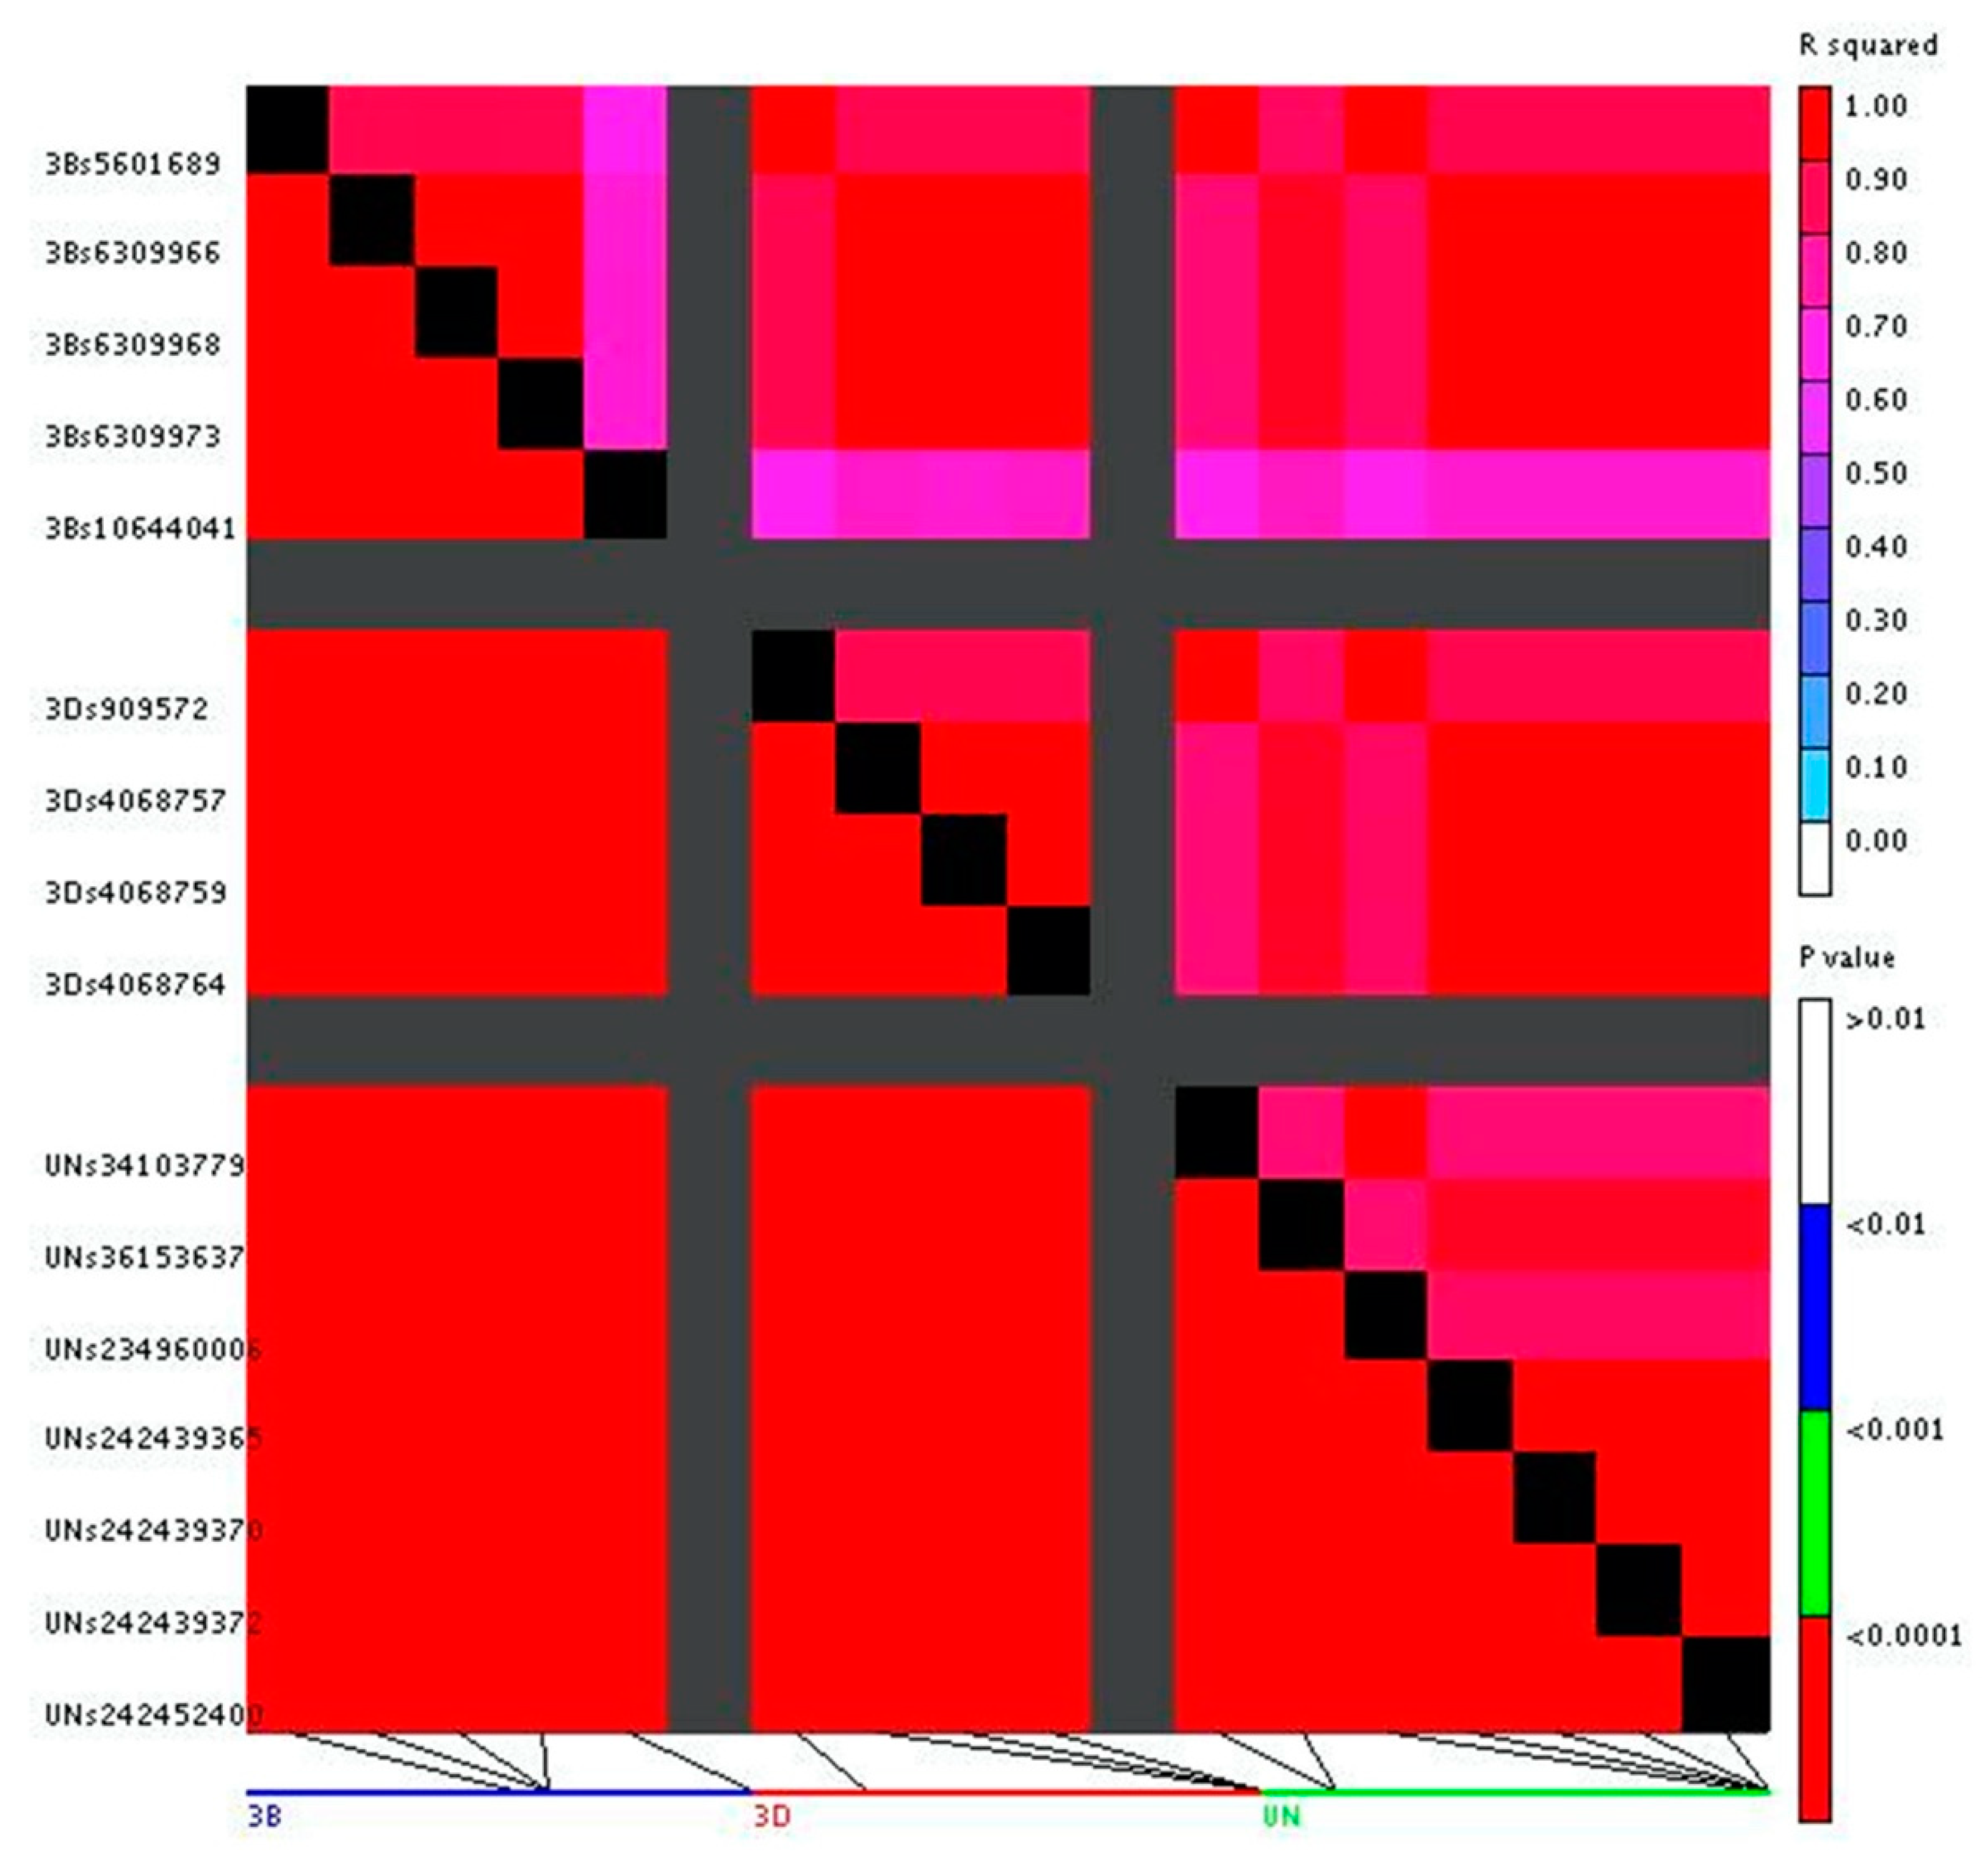
| Chromosome | Subgroup | Significant SNP | R2 Within Subgroup | R2 of 1.0 With Other Subgroups |
|---|---|---|---|---|
| 3B | Subgroup1 | S3B_6309966 | 1.0 | 3D Subgroup1 UN Subgroup1 |
| S3B_6309968 | ||||
| S3B_6309973 | ||||
| Subgroup2 | S3B_5601689 | 3D Subgroup2 UN Subgroup2 | ||
| Subgroup3 | S3B_10644041 | |||
| 3D | Subgroup1 | S3D_4068757 | 1.0 | 3B Subgroup1 UN Subgroup1 |
| S3D_4068759 | ||||
| S3D_4068764 | ||||
| Subgroup2 | S3D_909572 | 3B Subgroup2 UN Subgroup2 | ||
| UN | Subgroup1 | SUN_242439365 | 1.0 | 3B Subgroup1 3D Subgroup1 |
| SUN_242439370 | ||||
| SUN_242439372 | ||||
| SUN_242452400 | ||||
| SUN_242452405 | ||||
| SUN_242452407 | ||||
| Subgroup2 | SUN_34103779 | 1.0 | 3B Subgroup2 3D Subgroup2 | |
| SUN_234960006 | ||||
| Subgroup3 | SUN_36153637 |
| Line | SG8_163A | SG8_179B | SG8_195A | SG8_156A | SG8_172A | SG8_180A | SG8_7A | |
|---|---|---|---|---|---|---|---|---|
| Significant SNPs | 3B_5601689 | C | C | N | A | A | A | A |
| 3B_6309966 | G | G | G | C | C | C | C | |
| 3B_6309968 | A | A | A | G | G | G | G | |
| 3B_6309973 | G | G | G | C | C | C | C | |
| UN_242439365 | C | C | C | G | G | G | G | |
| UN_242439370 | C | C | C | G | G | G | G | |
| UN_242439372 | T | T | T | C | C | C | C | |
| UN_242452400 | C | C | C | G | G | G | G | |
| UN_242452405 | T | T | T | C | C | C | C | |
| UN_242452407 | C | C | C | G | G | G | G | |
| 3B_10644041 | T | T | T | A | A | A | A | |
| UN_36153637 | C | C | C | T | T | T | T | |
| 3D_909572 | G | G | N | T | T | T | T | |
| UN_34103779 | G | G | N | A | A | A | A | |
| UN_234960006 | C | C | N | T | T | T | T | |
| 3D_4068757 | G | G | G | C | C | C | C | |
| 3D_4068759 | A | A | A | G | G | G | G | |
| 3D_4068764 | G | G | G | C | C | C | C | |
| Disease Severity Scores | Pull17 | 0 | 0 | 0 | 100 | 100 | 100 | 100 |
| Pull18 | 0 | 0 | 0 | 40 | 30 | 20 | 20 | |
| MV17 | 5 | 5 | 5 | 100 | 100 | 100 | 100 | |
| MVC18 | 0 | 0 | 0 | 100 | 100 | 100 | 100 | |
| Top 3 resistant in every location | Bottom 4 susceptible in every location | |||||||
Publisher’s Note: MDPI stays neutral with regard to jurisdictional claims in published maps and institutional affiliations. |
© 2021 by the authors. Licensee MDPI, Basel, Switzerland. This article is an open access article distributed under the terms and conditions of the Creative Commons Attribution (CC BY) license (http://creativecommons.org/licenses/by/4.0/).
Share and Cite
Brandt, K.M.; Chen, X.; Tabima, J.F.; See, D.R.; Vining, K.J.; Zemetra, R.S. QTL Analysis of Adult Plant Resistance to Stripe Rust in a Winter Wheat Recombinant Inbred Population. Plants 2021, 10, 572. https://doi.org/10.3390/plants10030572
Brandt KM, Chen X, Tabima JF, See DR, Vining KJ, Zemetra RS. QTL Analysis of Adult Plant Resistance to Stripe Rust in a Winter Wheat Recombinant Inbred Population. Plants. 2021; 10(3):572. https://doi.org/10.3390/plants10030572
Chicago/Turabian StyleBrandt, Kali M., Xianming Chen, Javier F. Tabima, Deven R. See, Kelly J. Vining, and Robert S. Zemetra. 2021. "QTL Analysis of Adult Plant Resistance to Stripe Rust in a Winter Wheat Recombinant Inbred Population" Plants 10, no. 3: 572. https://doi.org/10.3390/plants10030572
APA StyleBrandt, K. M., Chen, X., Tabima, J. F., See, D. R., Vining, K. J., & Zemetra, R. S. (2021). QTL Analysis of Adult Plant Resistance to Stripe Rust in a Winter Wheat Recombinant Inbred Population. Plants, 10(3), 572. https://doi.org/10.3390/plants10030572