Abstract
We used the Air Pollution Tolerance Index (APTI), the amount of PM5 and PM10, and the elemental analysis of leaves to explore the sensitivity of tree species to air pollution. We assessed the tolerance of Robinia pseudoacacia, Acer saccharinum, Tilia × europaea, Acer platanoides, Fraxinus excelsior, Betula pendula, Celtis occidentalis, and Platanus × acerifolia to the amount of dust, APTI, and the elemental concentration of leaves. Leaves were collected in Debrecen (Hungary), which has a high intensity of vehicular traffic. The highest amount of PM (both PM10 and PM5) was found on the leaves of A. saccharinum and B. pendula. Our results demonstrated that A. saccharinum was moderately tolerant, while P. acerifolia was intermediate, based on the APTI value. There was a significant difference in the parameters of APTI and the elemental concentration of leaves among species. We found that tree leaves are reliable bioindicators of air pollution in urban areas. Based on the value of APTI, A. saccharinum and P. acerifolia, and based on PM, A. saccharinum and B. pendula are recommended as pollutant-accumulator species, while other studied species with lower APTI values are useful bioindicators of air pollution. The results support landscape engineers and urban developers in finding the best tree species that are tolerant to pollution and in using those as proxies of urban environmental health.
1. Introduction
Air pollution is an increasing problem worldwide. While in Europe air pollution decreases, it is still a problem, especially in cities; the urban and industrial areas are diverse sources of various pollutants that are a health risk for the human population [1,2]. Plants and the soil are primary sinks for air and soil pollution; the heavy metals translocated via atmospheric deposition negatively impact ecosystems [3]. Moreover, urban green spaces are vital in protecting biodiversity and improving the quality of urban life [4,5].
The accumulation of contaminants by plants is widely documented [6,7,8,9,10]. Trees are particularly efficient in trapping dust-reducing airborne particles deposited in tree leaves’ stomatal openings and waxy cuticles [11]. Leaves accumulate metals and other pollutants in high quantities, which is higher than the maximum limit based on WHO/FAO recommendations for vegetables [12,13]. Naturally, metals can also accumulate via the root system, but the intensity of translocation through plant parts depends on the given metal and plant species. Plants’ susceptibility and tolerance varies by species as a function of air pollution types, such as high concentration of carbon monoxide, nitrogen dioxide, sulphur dioxide, and particulate matter [14].
Atmospheric particulate matter (PM) consists of a complex mixture of substances and chemical compounds of natural and/or anthropogenic origin [15]. Generally, PMs are framed in terms of two health-relevant fractions, from which the first is referred to as PM2.5 and the other as PM10 [16]. PM is currently considered to be the best indicator for the health effects of ambient air pollution [17] because it is a typical pollutant in urban areas due to its ability to bind toxic organic components and heavy metals [18,19]. Accordingly, PM pollution causes serious health issues for the urban population [19,20]. Composite particulate matter is directly linked to asthma, eye and lung problems, and premature death. It can be emitted directly into the air and can be formed in the atmosphere. These particles are multicomponent aggregates comprising a wide range of substances [2]. PM10 and coarse particles refer to PM with an aerodynamic diameter of <10 µm, and fine particles refer to PM with a diameter of <2.5 μm, while ultrafine particles are those with a diameter of <0.1 um [21]. Small particles of 3.3–4.7 µm diameter can penetrate the trachea and primary bronchi; thus, studying PM5 is an important task in urbanised areas [21,22,23,24]. As a result of human activities, the background level of heavy metals is increasing and accumulates in the soil and vegetation due to their non-biodegradable nature [25]. Plants, especially trees and shrubs, play an important role in the adsorption and reduction of PM concentrations in the air because they are effective at accumulating PM on the surface of leaves, stems, and bark [26,27]. The physiological state of leaves provides a simple, cheap, but still useful indicator for biomonitoring [28,29,30]. An efficient indicator, APTI, expresses the ability of plants to counter the adverse effects of air pollution [28]. APTI was proposed by Singh and Rao [28] using the ascorbic acid content, total chlorophyll content, pH of leaf extract, and relative water content of leaves to quantify the reaction of plants to air pollution. Thus, the level of air pollution can be expressed by the index as an indirect reaction of plants. Furthermore, the index also made it possible to compare these reactions and to identify species with less sensitivity that can be optimally used in urban green infrastructure planning; high values of APTI indicate low sensitivity, while tree species of low APTI can be considered biological pollution indicators [6,7,28,29,30].
An earlier study demonstrated that correlations between the amount and elemental concentrations of dust deposited on tree leaves, and APTI values confirmed that APTI efficiently indicated the level of air pollution [29]. The tolerance and sensitivity vary among species. Accordingly, we aimed to analyse the sensitivity of eight frequent European tree species to air pollution based on the PM amount, APTI, and elemental concentration (Al, Ba, Ca, Cu, Fe, K, Li, Mg, Mn, Na, Ni, P, Pb, S, Sr, and Zn) of tree leaves.
2. Results
2.1. Particulate Material (PM) and Air Pollution Tolerance Index (APTI)
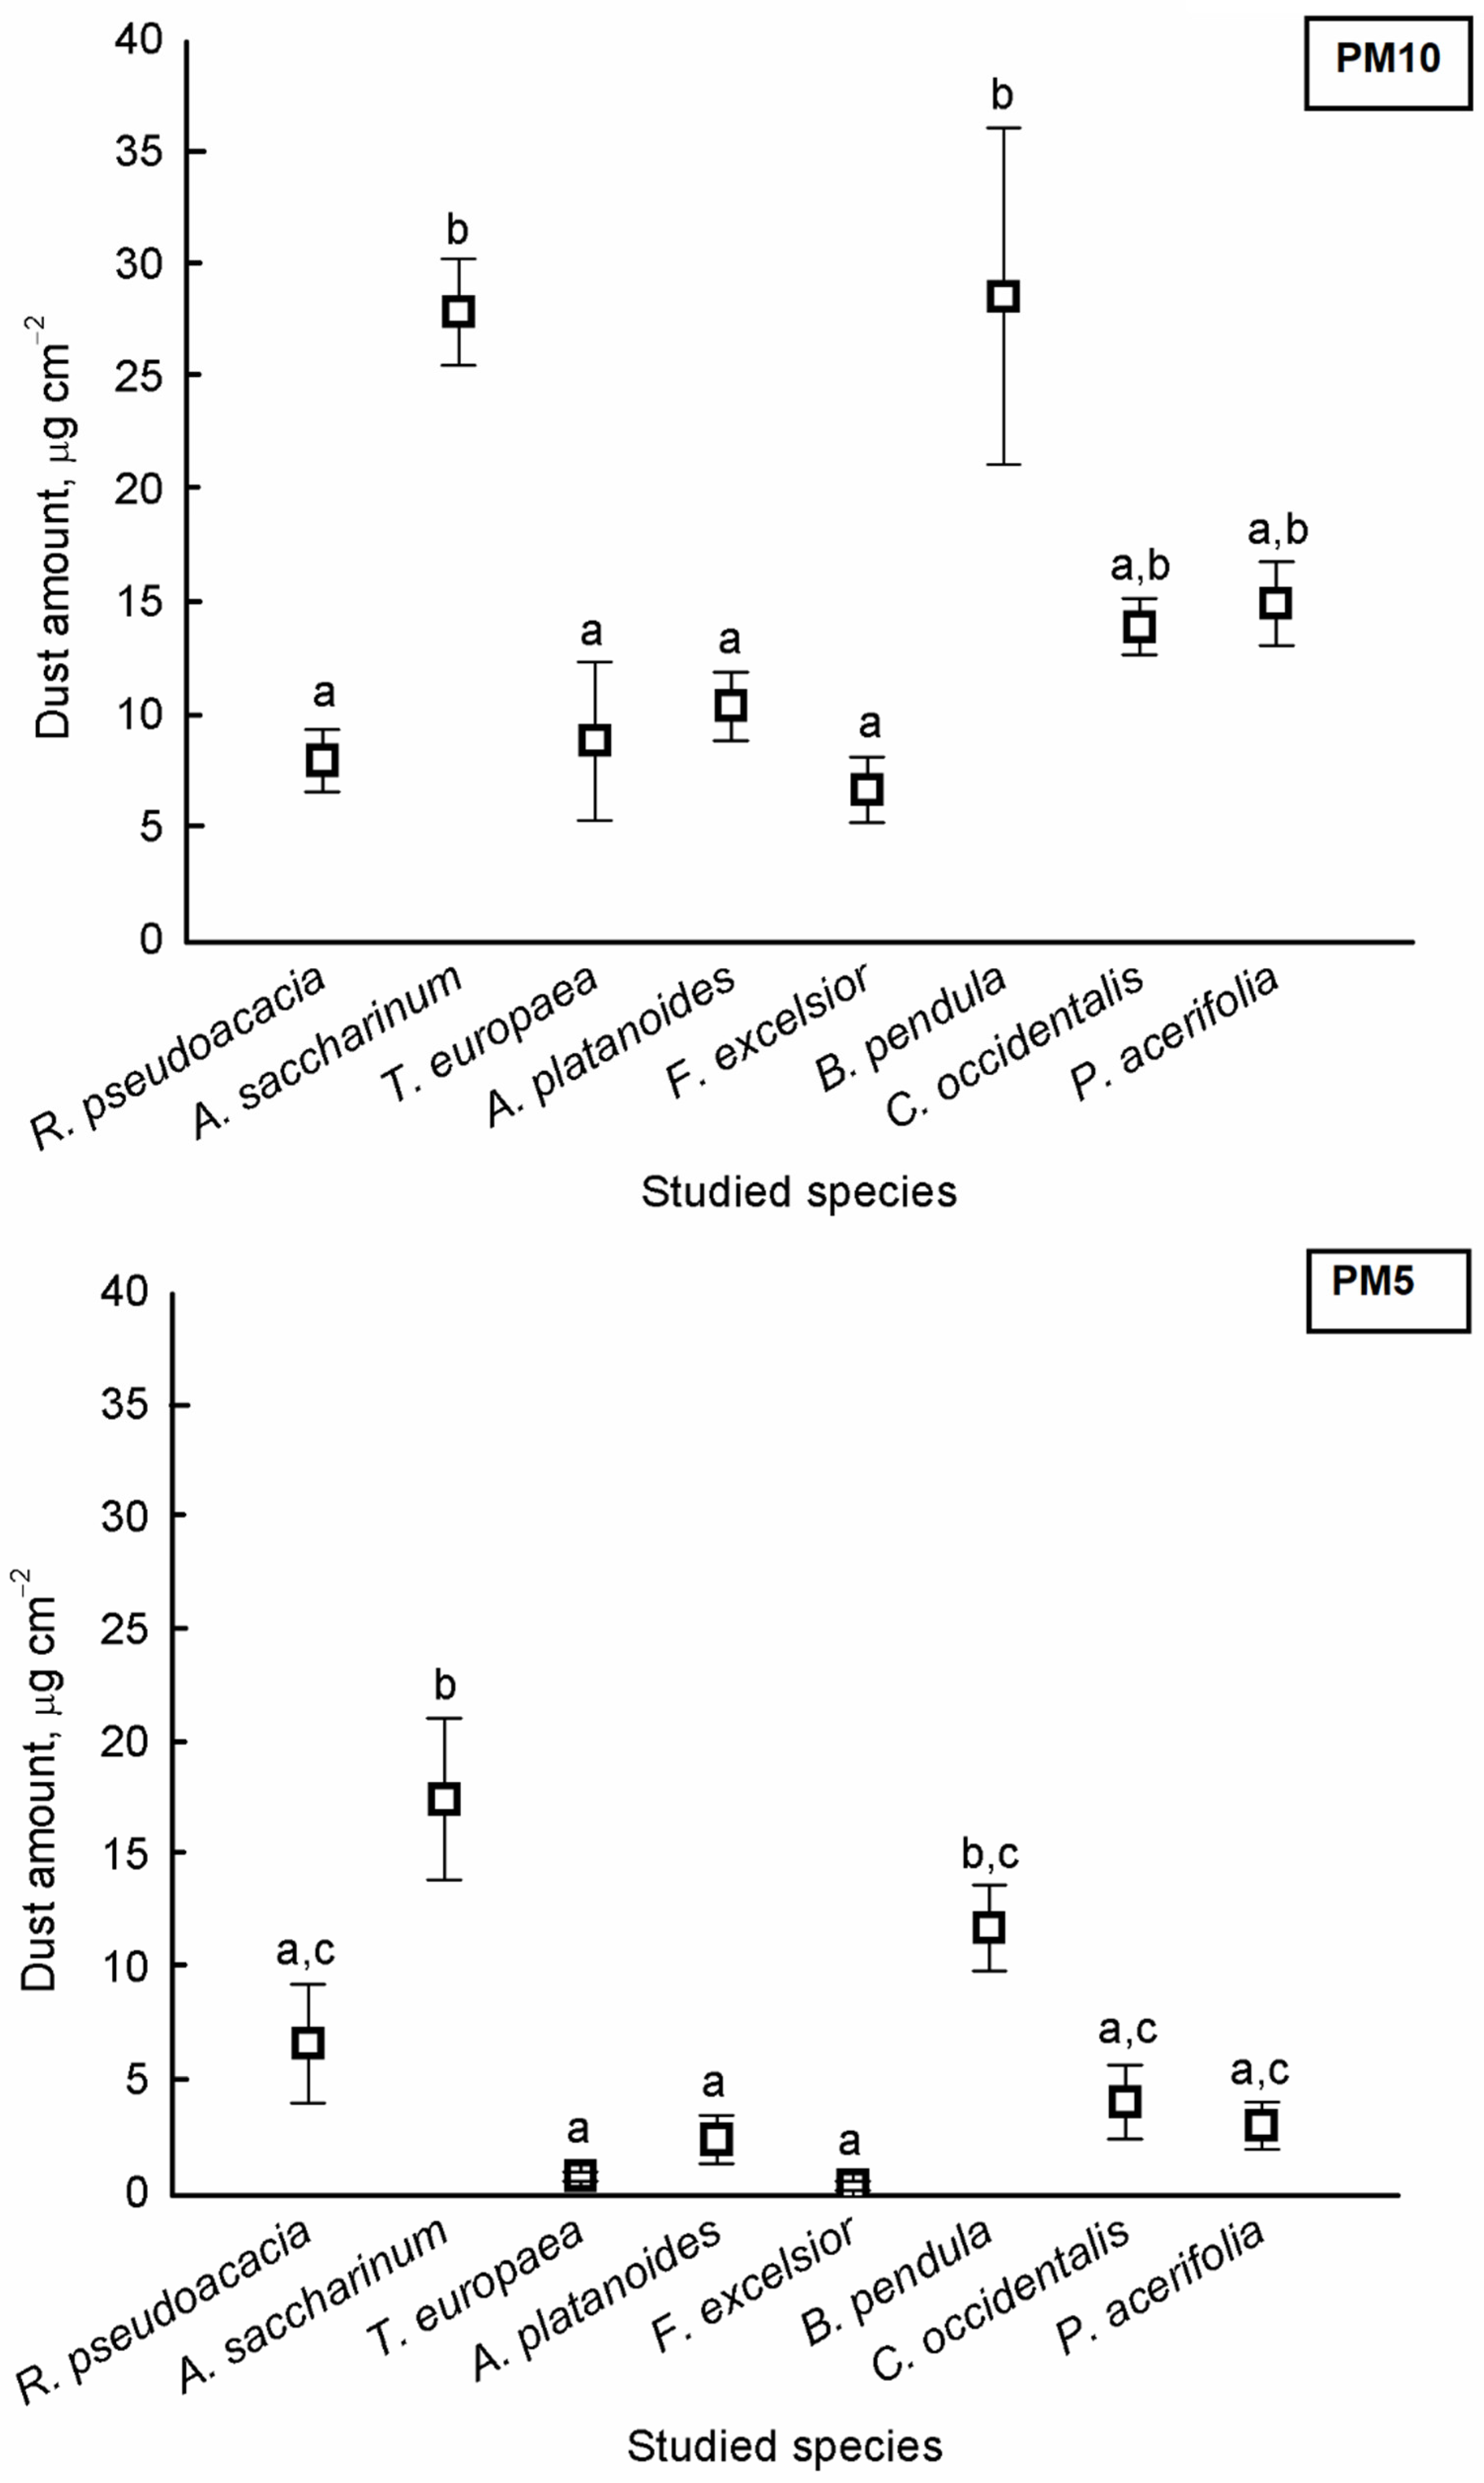
There were significant differences in the amount of PM5 and PM10 among the species (PM5: F = 247.312, p < 0.001; PM10: F = 48.937, p < 0.001). The highest dust amounts were found on the leaves of A. saccharinum and B. pendula for both PM10 and PM5 (Figure 1).
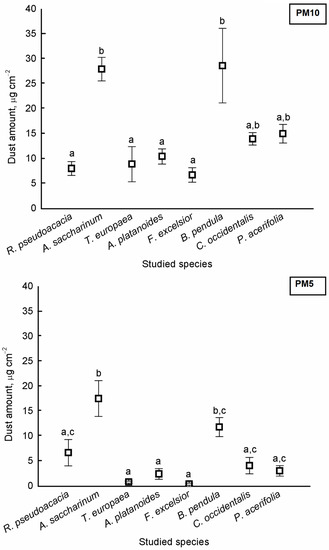
Figure 1.
Average amount of particulate matter (±standard error) of aerodynamic diameter smaller than 10 μm (PM10) and smaller than 5 μm (PM5) on the surface of studied tree species. Different letters indicate significant differences at p < 0.05 level.
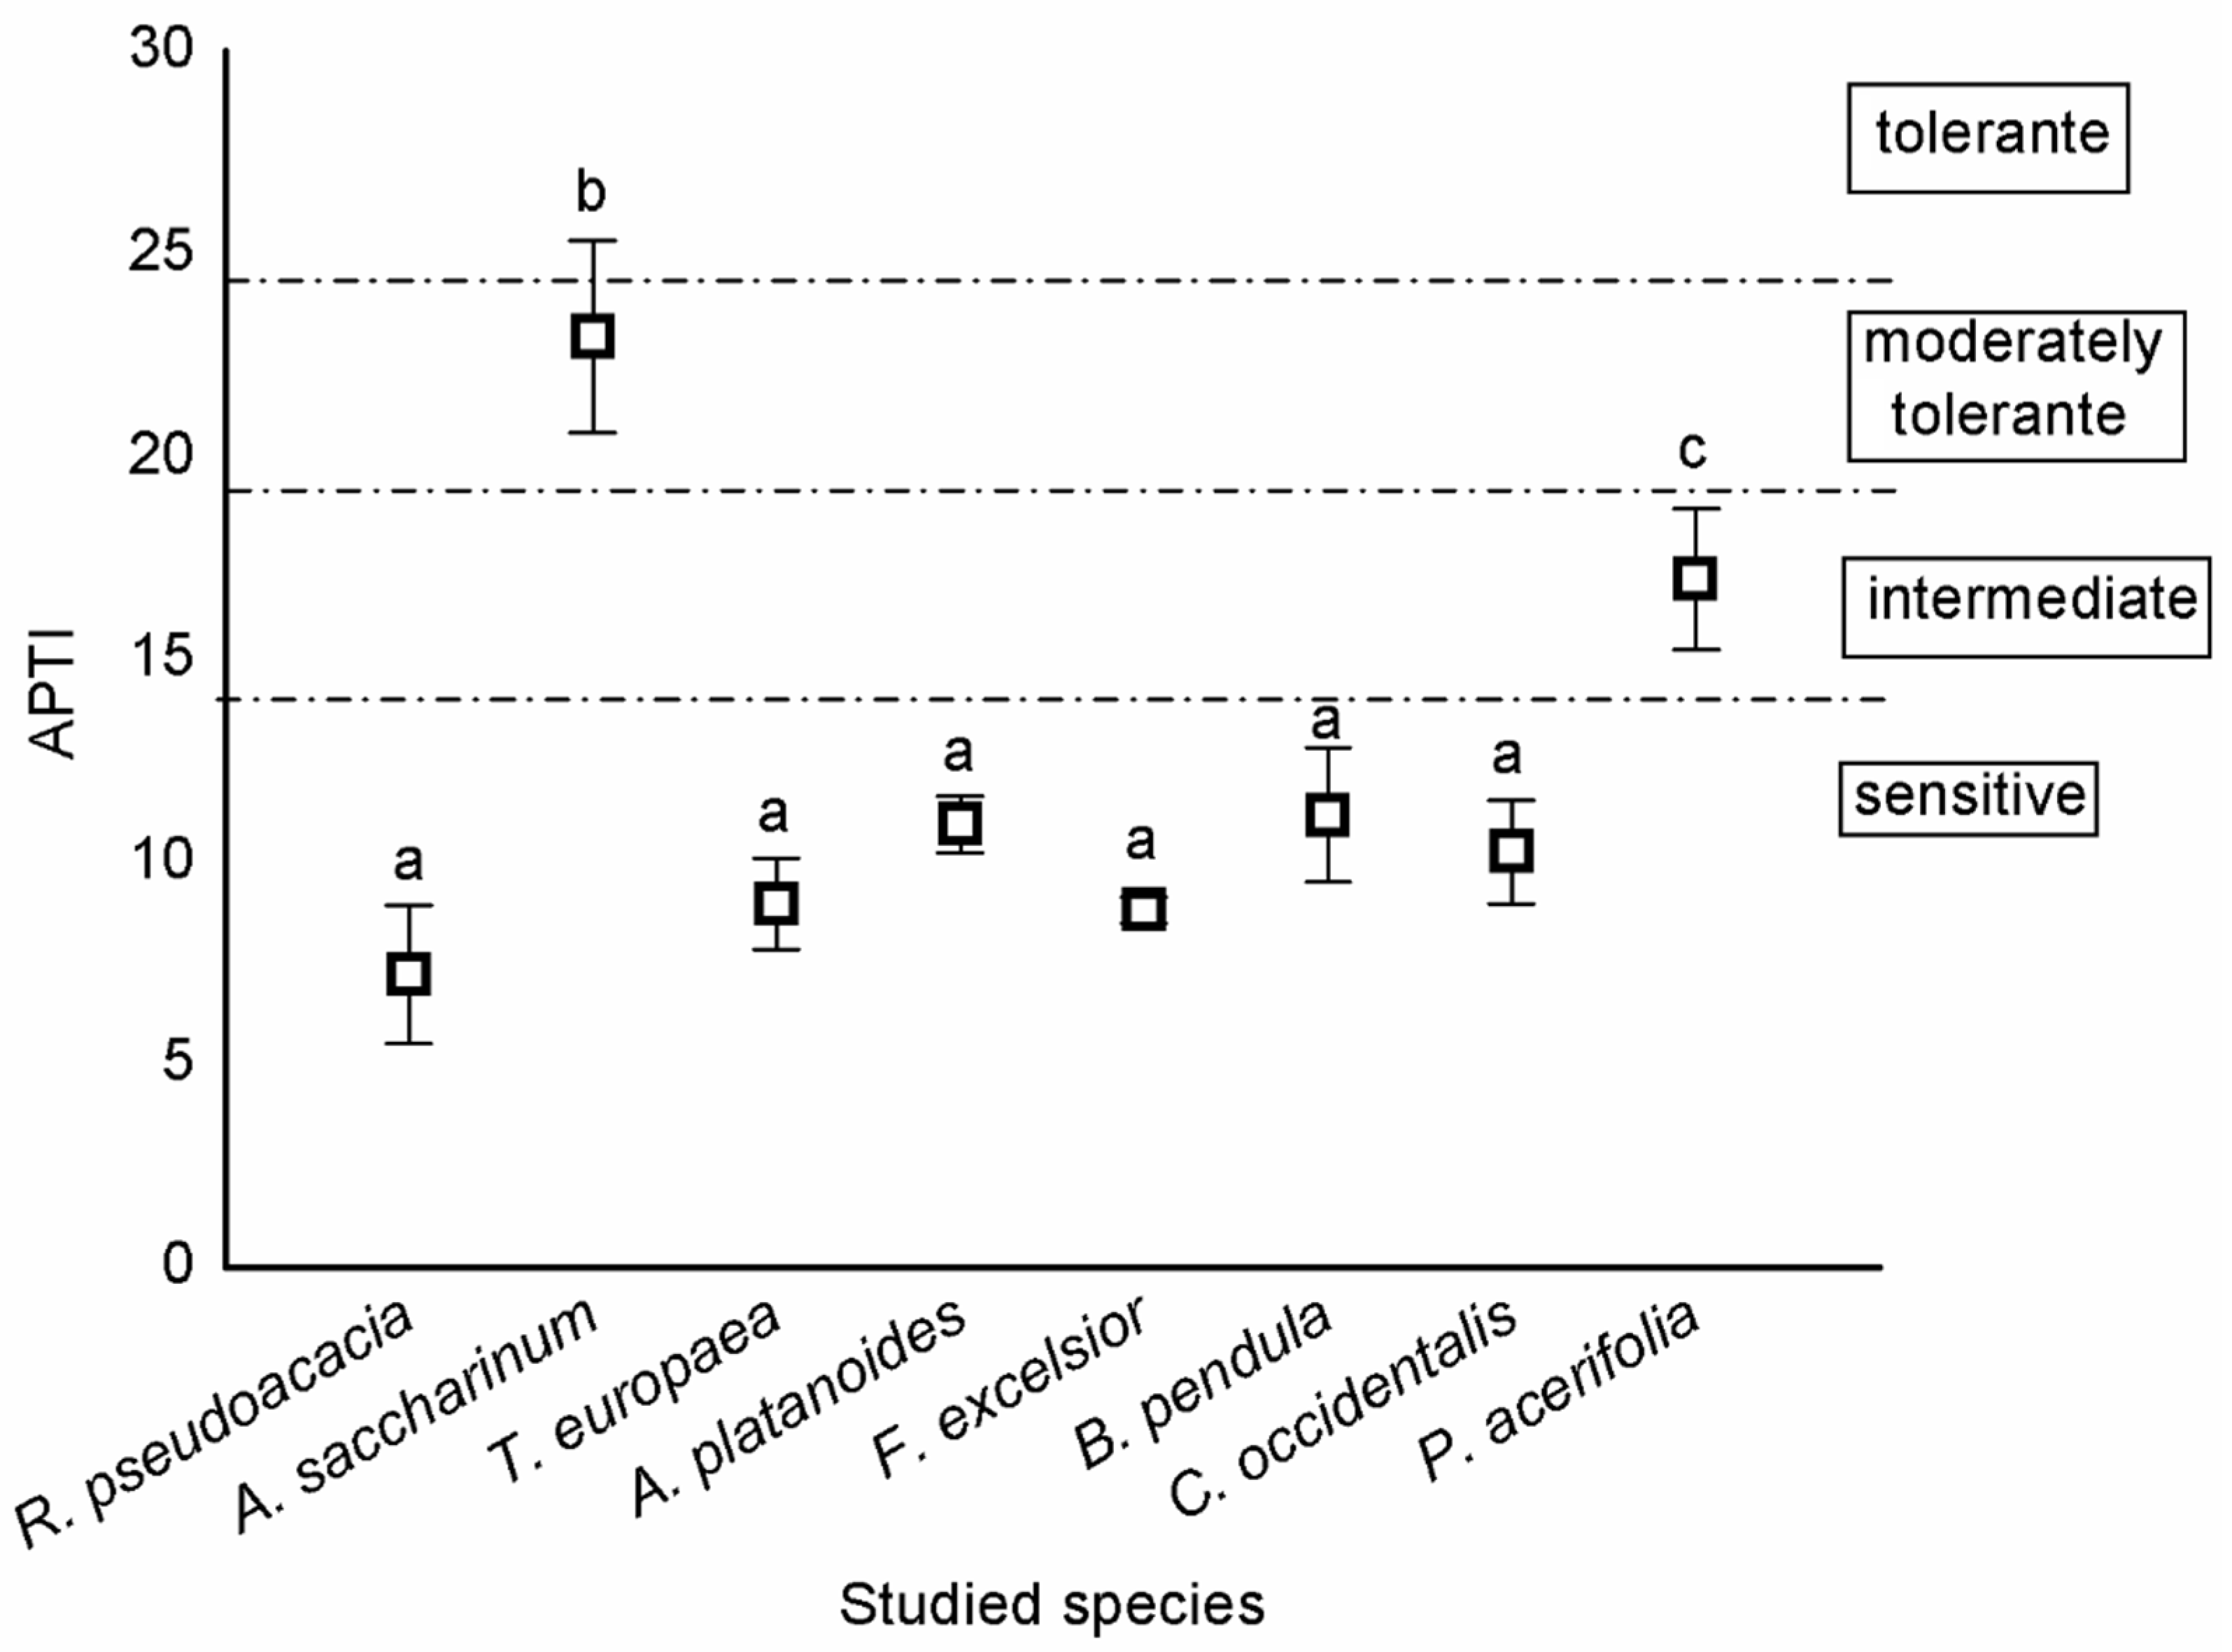
According to the categorisation of Singh et al. [26], most trees were sensitive, except A. saccharinum and P. acerifolia. A. saccharinum was moderately tolerant, while P. acerifolia was intermediate (Figure 2).
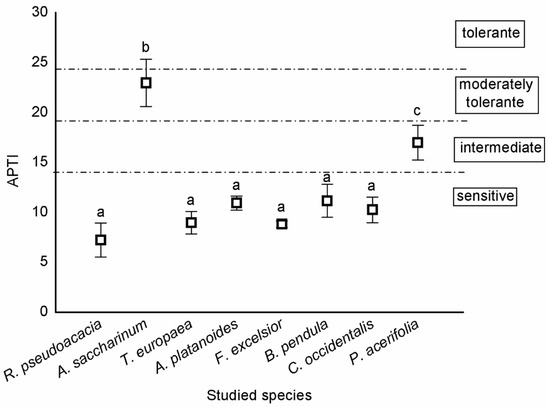
Figure 2.
Sensitivity of tree species based on APTI values (mean ± standard error). Different letters indicate significant differences at p < 0.05 level.
Differences in the means of parameters of APTI values (ascorbic acid, total chlorophyll content, pH of leaf extract, and relative water content) were tested among the species. There were significant differences among species based on leaves for the ascorbic acid content (F = 48.006, p < 0.001), for the pH of the leaf (F = 48.669, p < 0.001), and for the total chlorophyll content of leaves (F = 4.662, p = 0.006) (Figure 3a–c). There were no significant differences among species based on the relative water content of leaves (F = 2.250, p = 0.089) (Figure 3d).
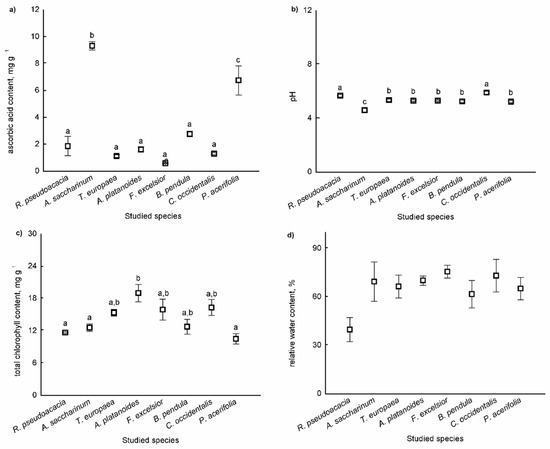
Figure 3.
Parameters of APTI values (ascorbic acid content (a), pH of the leaf (b), total chlorophyll content (c), and relative water content (d)) of leaves (mean ± standard error). Different letters indicate significant differences at p < 0.05 level.
The ascorbic acid content was the highest in B. pendula leaves, and the pH was highest in the dust adsorbed in the leaves of R. pseudoacacia and C. occidentalis. The total chlorophyll content was highest in the leaves of A. platanoides.
2.2. Elemental Concentration of Leaves
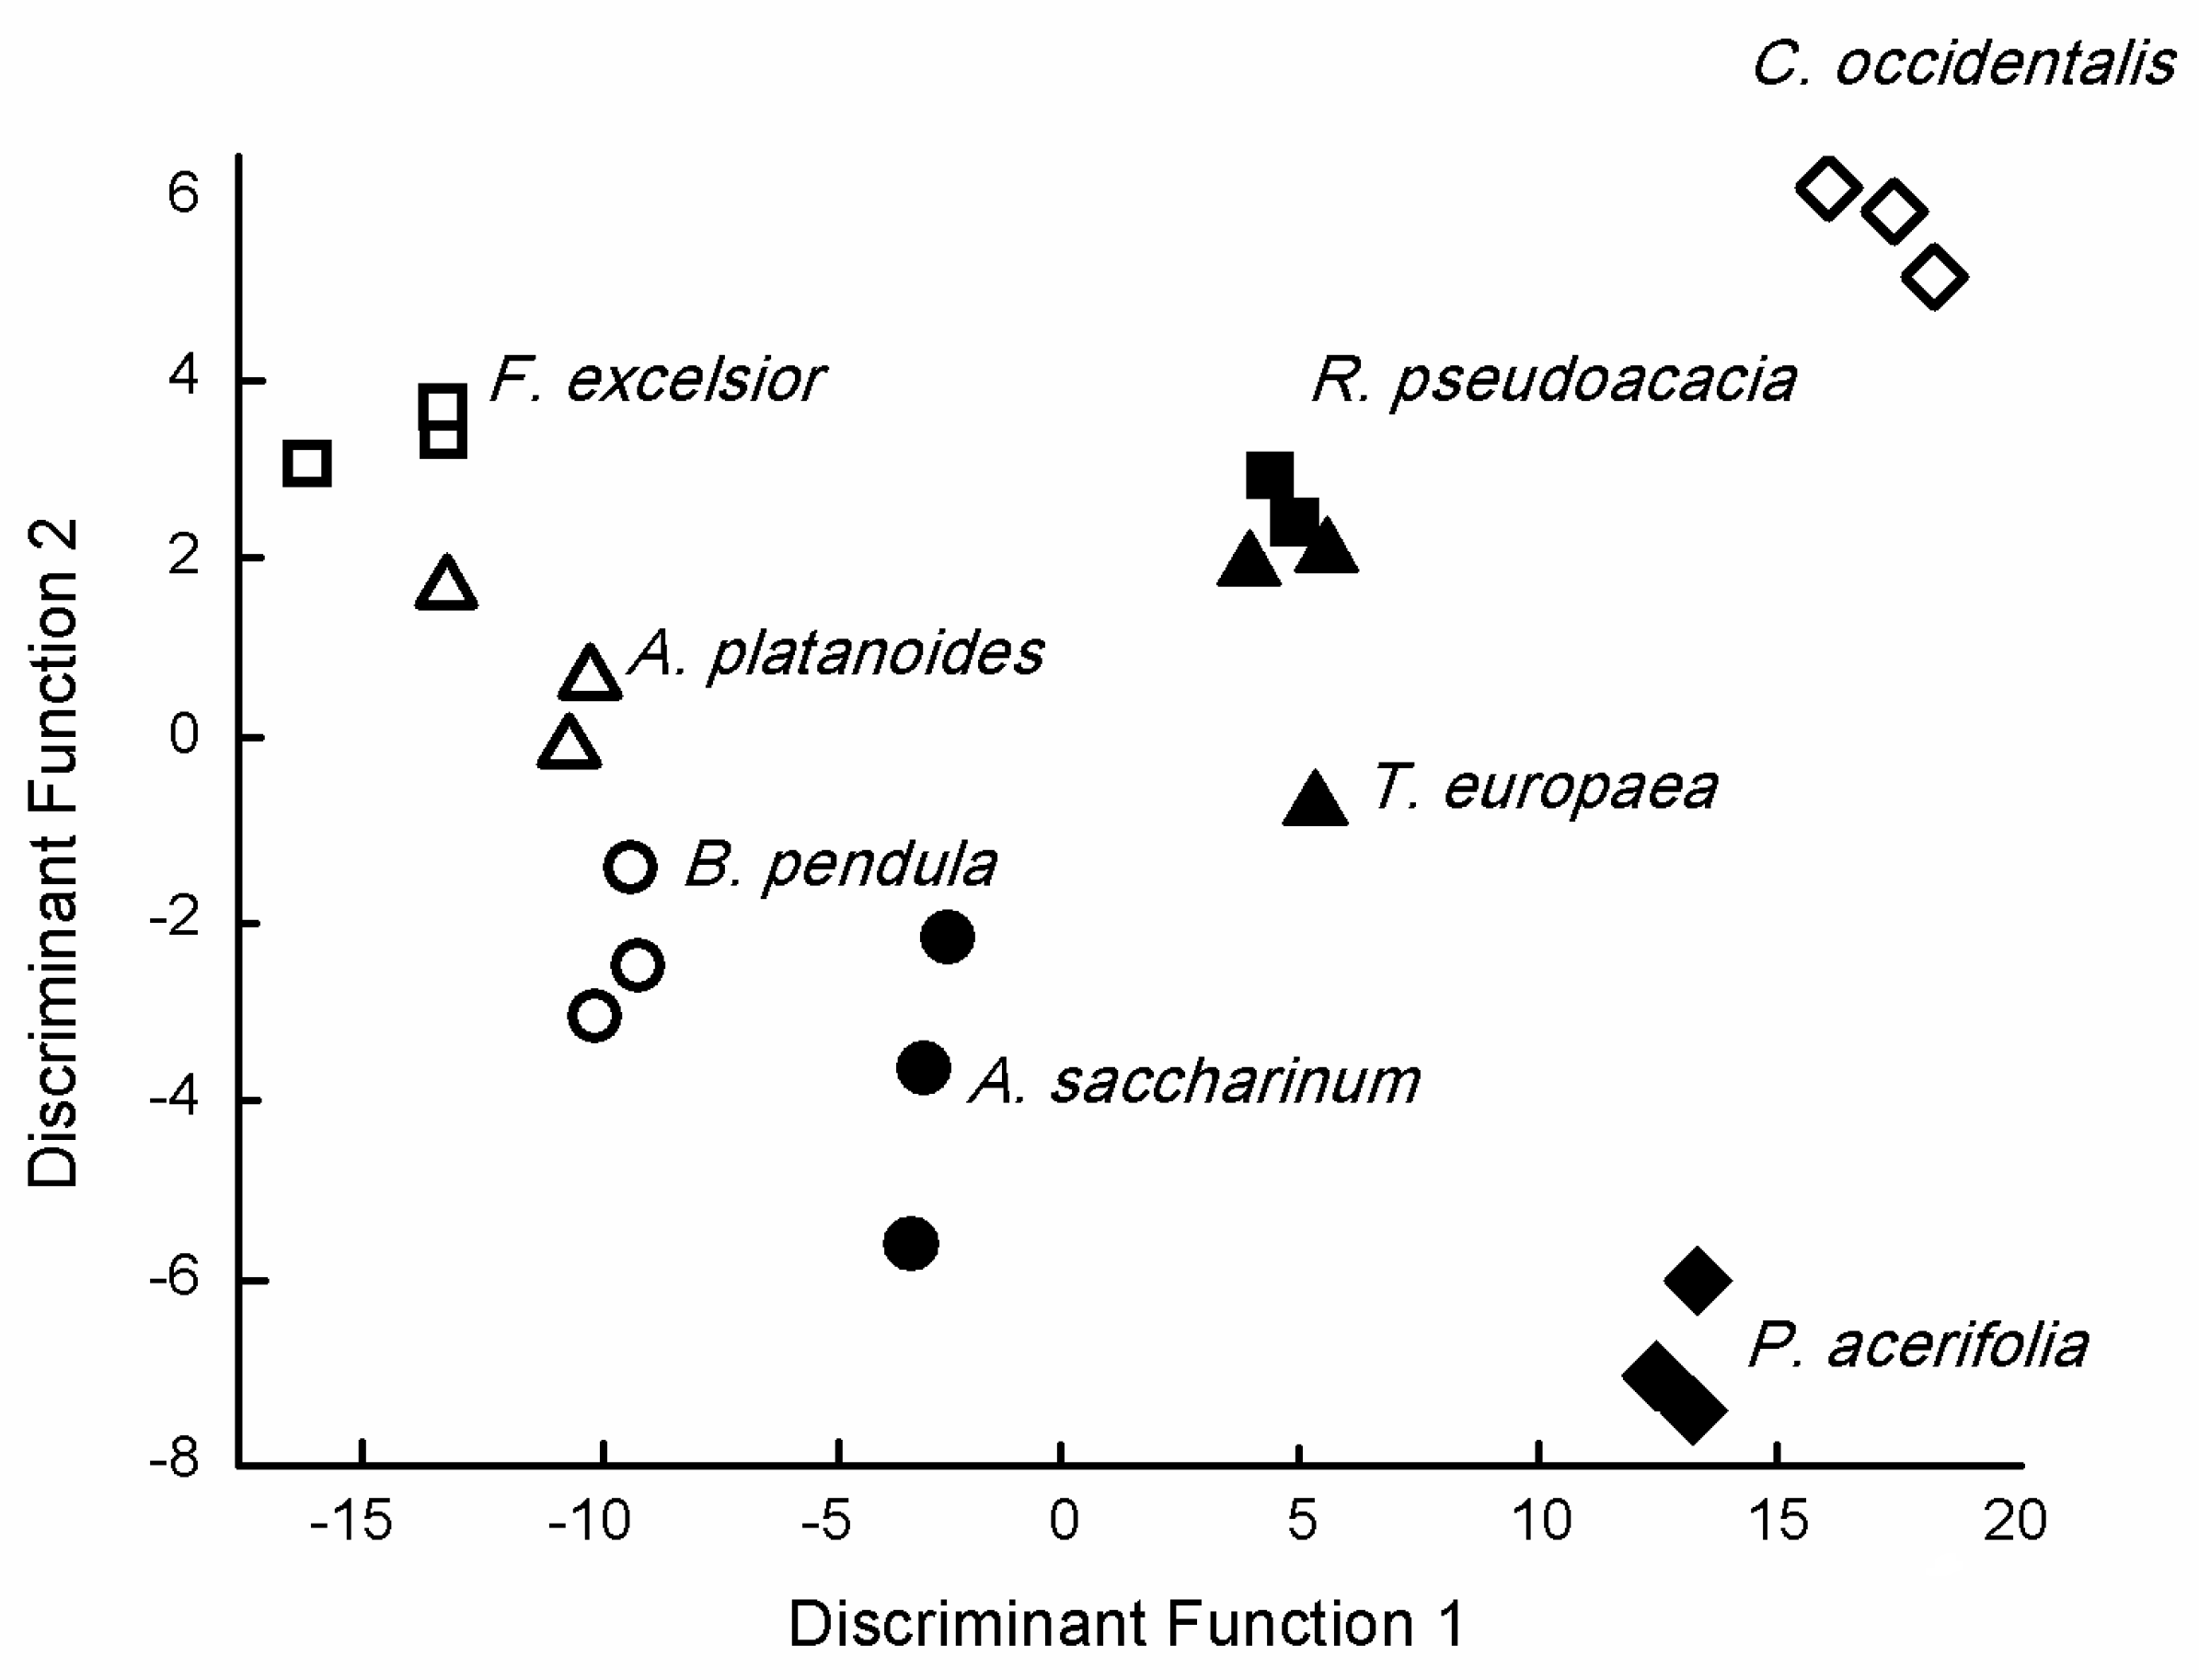
The first two Discriminant Functions of Canonical Discriminant Analysis had more than 10% explained variance (DF1 = 80.5%, DF2 = 10.2%) and provided a cumulative variance of 90.7%. Furthermore, canonical correlations were about 0.98 for these DFs, but, except for DF6 and DF7, correlations were >0.9 (Figure 4, Supplementary Material Table S1).
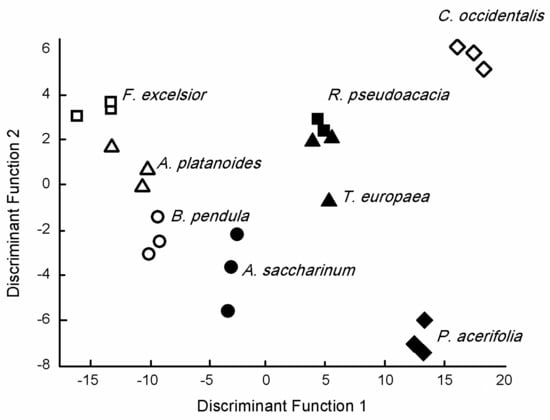
Figure 4.
Discriminant score plots of the species based on the elemental concentration of tree species leaves.
DF2 positively correlated with Ca (r = 0.483), Sr (r = 0.263), and Ba (r = 0.160), while we found a negative correlation with the p concentration and DF3 (r = −0.201). There was a negative correlation between DF4 and the Li concentration (r =− 0.322), while Zn (r = −0.571), K (r = −0.333), and Mg (r = 0.281) correlated with DF5. DF6 negatively correlated with S (r = −0.455), Ni (r = −0.338), and K (r = −0.150), while a positive correlation was found between Al (r = 0.594) and Pb (r = 0.312). There was a negative correlation between DF7 and Cu (r = −0.395) and Fe (r = −0.337), while Mn (r = 0.385) was positively correlated.
There were significant differences in the Al (F = 17.572, p < 0.001), Ba (F = 4.251, p = 0.009), Ca (F = 24.675, p < 0.001), Fe (F = 10.856, p < 0.001), Mg (F = 2.777, p = 0.046), Ni (F = 4.715, p = 0.006), S (F = 7.119, p = 0.001), Sr (F = 8.097, p < 0.001), and Zn (F = 5.353, p = 0.003) concentrations in leaves among the species (Table 1).

Table 1.
Elemental concentration of leaves in studied species (mean ± standard error).
The highest Al and Fe concentrations were found in the leaves of T. × europaea and A. platanoides. The Ba concentration was the highest in the leaves of R. pseudoacacia and C. occidentalis, similar to the Ca concentration. For Mg and Ni, P. acerifolia had the highest concentration. The highest S concentration was observed in C. occidentalis. The Sr concentration was the highest in A. platanoides, and the Zn concentration was the highest in F. excelsior leaves (Table 1).
3. Discussion
We demonstrated that urban tree leaves can be used effectively for monitoring urban air quality. Leaves act as dust and air pollutant traps due to specific factors in the anatomy of tissues, such as trichomes and stomata density. There were significant differences in the amounts of PM5 and PM10 among the species. The highest dust amount was found on the leaves of A. saccharinum and B. pendula for both PM10 and PM5. We demonstrated that most tree species were sensitive, except for A. saccharinum and P. acerifolia. A. saccharinum was moderately tolerant, while P. acerifolia was intermediate, based on the APTI value. There was a significant difference among species based on leaves for the ascorbic acid content, for the pH of the leaf, and for the total chlorophyll content of leaves. The ascorbic acid content was the highest in B. pendula leaves, and the pH was highest in the leaves of R. pseudoacacia and C. occidentalis. The total chlorophyll content was highest in the leaves of A. platanoides. There was a significant difference in the Al, Ba, Ca, Fe, Mg, Ni, S, Sr, and Zn concentrations in leaves among the species.
An increase in PM10 concentration was revealed in Lithuania and Romania, while a slighter reduction in PM10 emissions in Bulgaria and Hungary from 2000–2017 was observed by Sicard et al. [1]. Despite an earlier study [30], our results indicated that the leaves of A. saccharinum and B. pendula were useful for assessing the level of air pollution for PM10 and PM5. Kretinin and Selyanina [30] reported that T. × europaea had a very high dust retaining capacity (464 g m−2), F. excelsior had a moderate capacity (41.5 g m−2), while A. saccharinum had a reduced capacity (13.9 g m−2), and B. pendula had a low dust-retaining capacity (4.8 g m−2). The most advantageous characteristics are rough and tomentose tree leaves, which result in a very high dust-retaining capacity; thin waxy leaves ensure a high and moderate dust-retaining capacity, allowing dust particles to stick to the leaf surface. However, tree leaves with dense glossy surfaces are enough only for reduced and low dust-retaining capacity [30]. A. saccharinum is a tree species of great capacity to remove PM2.5 effectively from urban air [31]. P. acerifolia was considered a less sensitive species to SO2 and fluorides, and very tolerant to pollution [32]. Haynes et al. [33] studied the effect of urbanisation on the amount of PM using moss turf and a common native tree species with Pittosporum undulatum. Their results indicated that moss species are more sensitive to increasing urbanisation, based on the amount of PM, than trees. At the same time, the amount of PM on the leaf’s surface of P. undulatum was similar to our results for F. excelsior and T. × europaea. Similar to our findings in an earlier study on the foliage of B. pendula, its leaves collected the most PM, followed by Q. robur and T. cordata, regardless of the dust’s source [26]. Łukowski et al. [26] demonstrated that B. pendula, Q. robur, and T. cordata had a tendency for higher wax production when grown under higher PM pollution levels. The amount of PM was similar to our findings for B. pendula and T. cordata, which were reported by Łukowski et al. [26]. Popek et al. [27] also studied the difference between native and non-native tree species based on PM accumulation. Their results showed that both P. padus and P. serotina accumulated the most PM on the surface of the leaves rather than in the wax layer. Furthermore, the native P. padus accumulated higher amounts of PM than P. serotina. The results about the surface of leaves and the wax layer of leaves indicated that they play the most important role in the accumulation of PM. Based on the APTI values, we demonstrated that A. saccharinum was moderately tolerant, while P. acerifolia was intermediate. Alotaibi et al. [34] reported that the reduction of leaf area was significantly recorded in contaminated areas for P. acerifolia. These findings suggest that the differences in the reduction in leaf areas between tree species at different locations may be due to the availability of leaf surface area and the capacity of leaves for capturing air pollutants [35]. Our results were similar to Chen et al. [36], in which P. acerifolia was tolerant to pollution and should be given preference in plant selection for seriously polluted places. Nadgórska-Sochaet al. [37] demonstrated that based on APTI and the elemental concentration, B. pendula and Taraxacum officinale may be appropriate plants in urban areas with considerable soil and air contamination, especially with heavy metals. The value of APTI for B. pendula and R. pseudoacacia was higher in their study than in our results. A similar result was found by Rai et al. [38], who demonstrated that the tolerance of plants towards air pollution may be site-specific because Ficus bengalensis was found to be tolerant in industrial sites and Mangifera indica was tolerant in non-industrial sites. Ogunkunle et al. [39] also suggested that the integration of both plant tolerance and performance indices for the selection of tree species are very useful for the development of a green belt using APTI values. Their results demonstrated that based on APTI, Vitellaria paradoxa, Terminalia catappa, Acacia nilotica, and Prosopis africana are sensitive species to air pollution stress in Nigeria. Bharti et al. analysed the APTI values of 25 plant species, and Ficus bengalensis, Ficus religiosa, Eucalyptus globus, Azadirachta indica juss, and Heveabra brasiliensis were tolerant to air pollution, while Polythalia longifolia was found to be the most sensitive. They also demonstrated that species with an APTI < 11 may be used as a bioindicator of air quality, while those with an APTI ≥ 17 can be used for green belt design. Jyothi and Jaya [40] also reported that tolerant tree species can serve as sinks, and sensitive tree species can act as indicators for air pollution mitigation. Gholami et al. [41] also found that plants with higher APTI can be used as reducers of pollution, and plants with a lower APTI can be used to measure air pollution.
4. Materials and Methods
4.1. Study Sites and Sample Collection
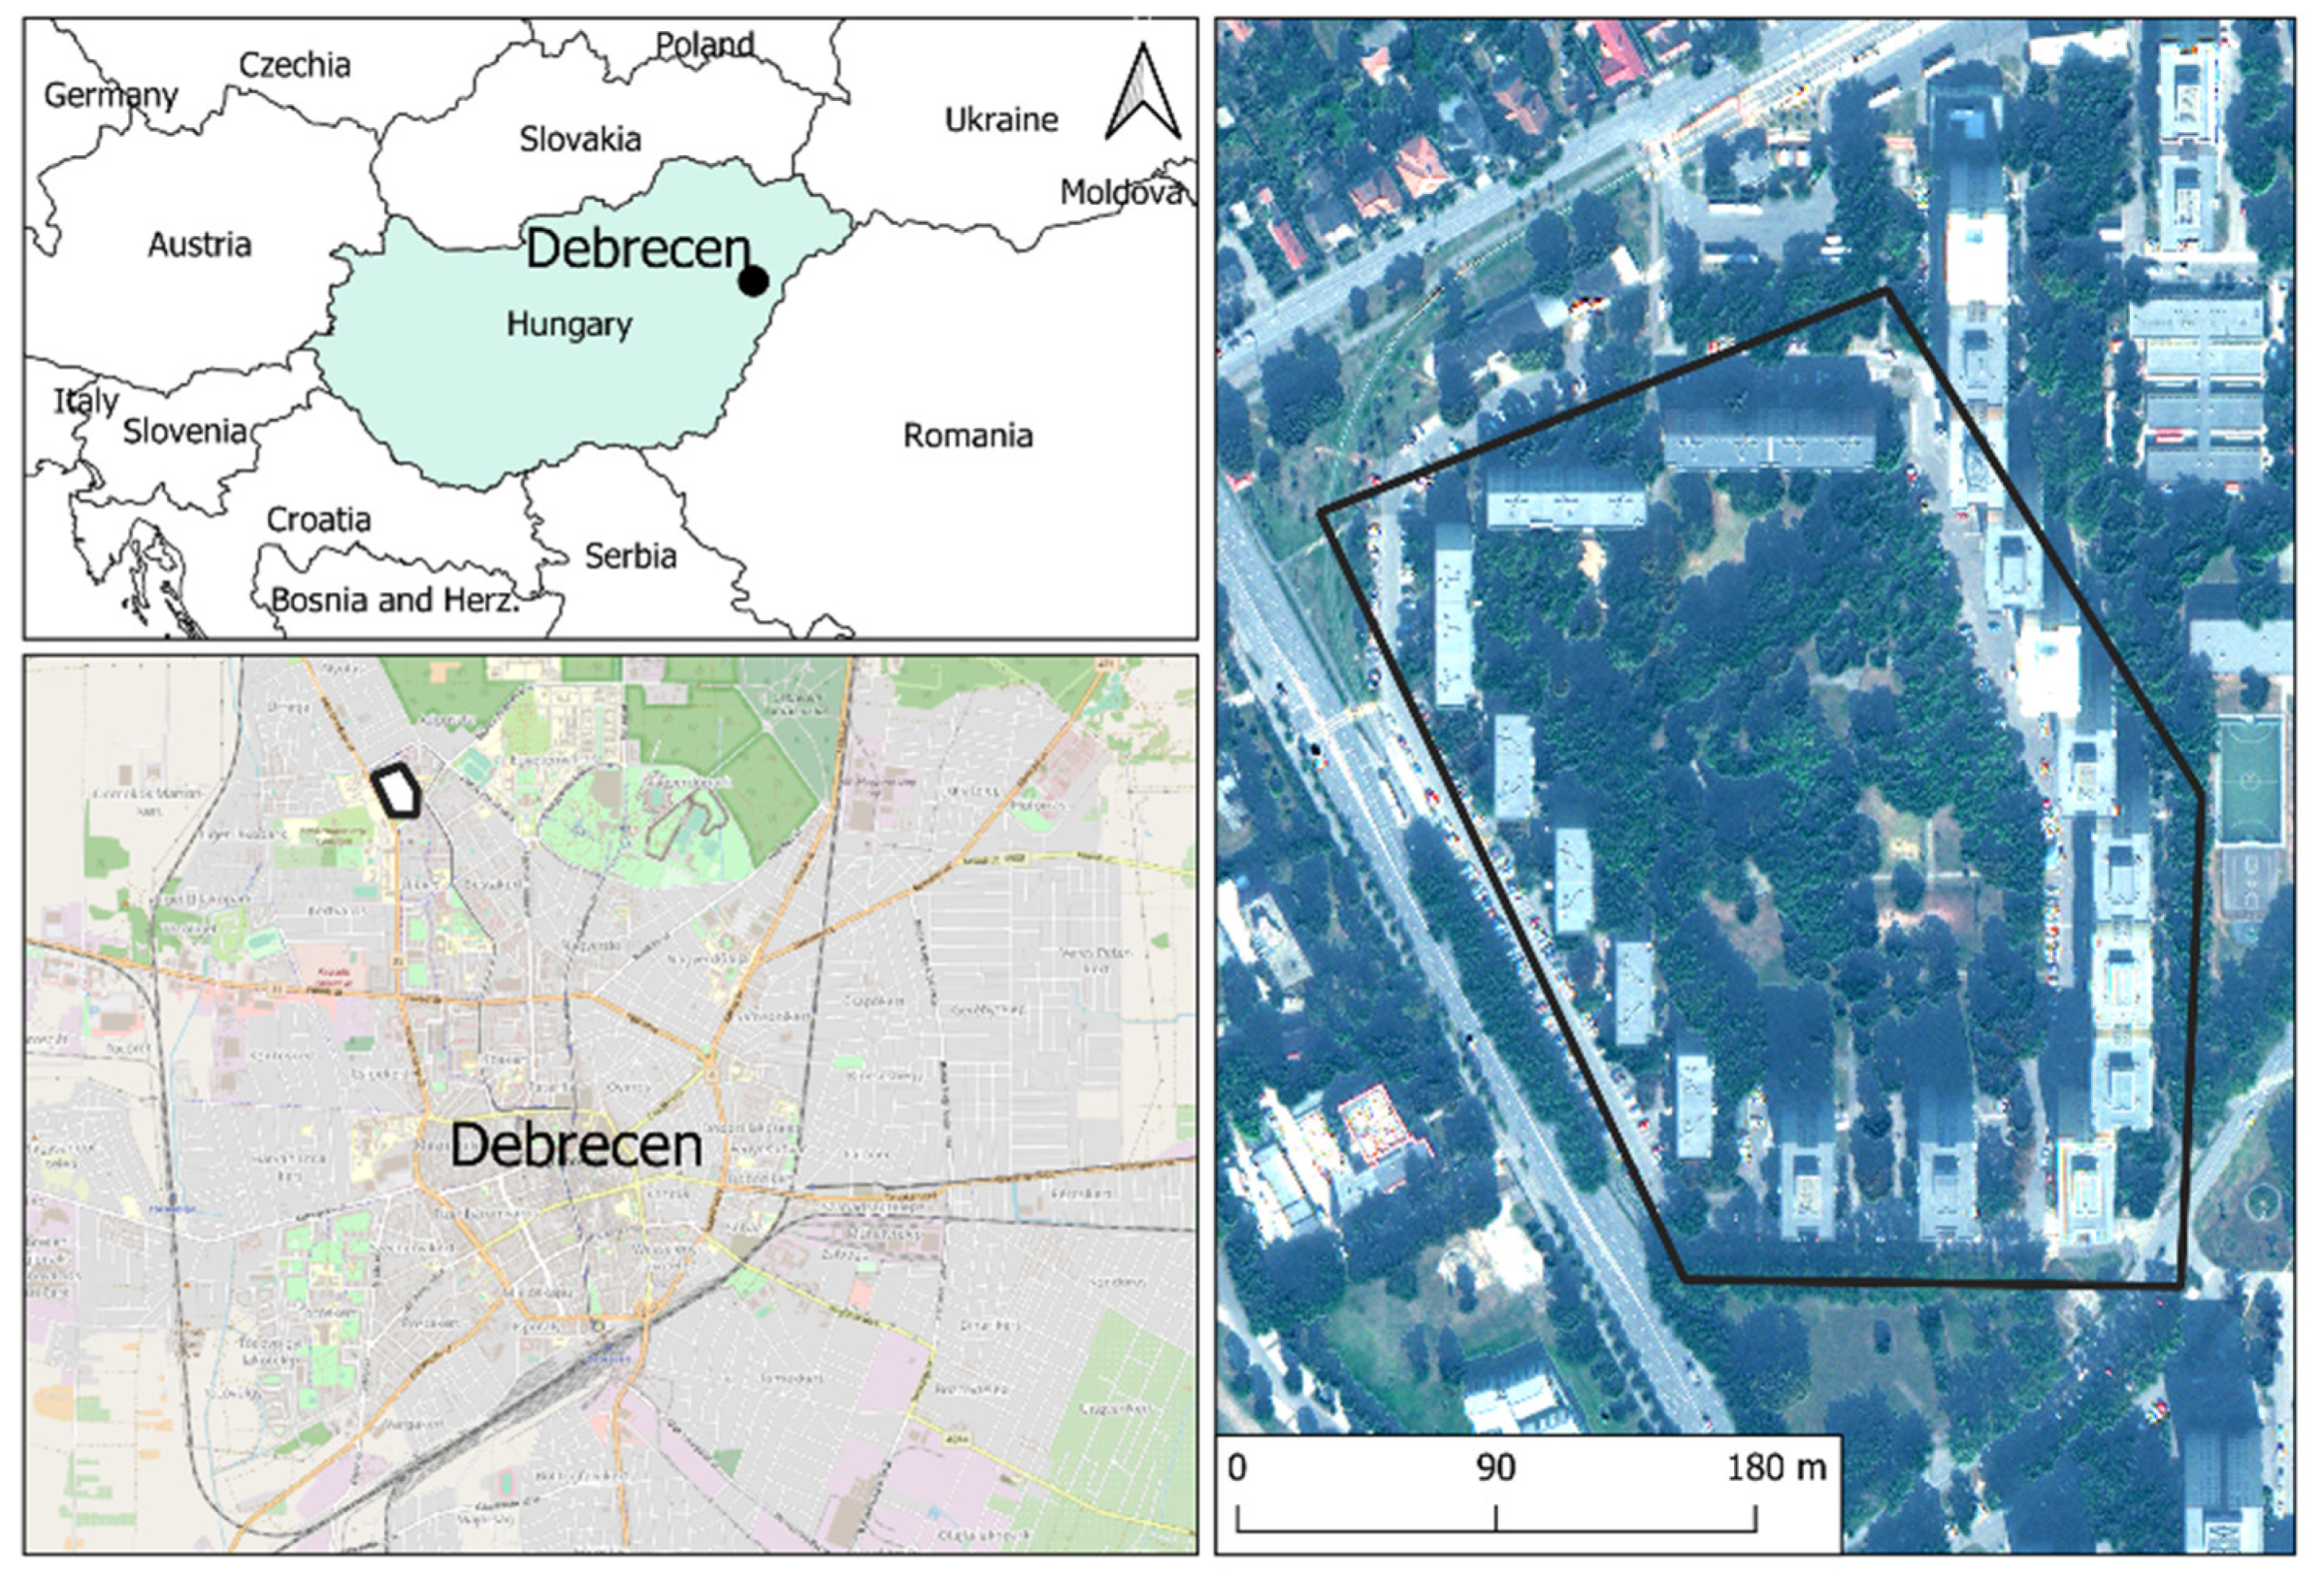
The sampling area was located in Debrecen (second largest city of Hungary), near the city centre, which is exposed to a high intensity of vehicular traffic (Figure 5). From 2000–2017, the average concentration of PM10 was lower (36 ± 4 µg m−3) and PM2.5 was higher (28 ± 3 µg m−3) than the threshold limit in Directive 2008/50/EC of the European Parliament (PM10 = 40 µg m−3 and PM2.5 = 25 µg m−3) [42,43]. We tested the usefulness of the following species as bioindicators of air pollution: R. pseudoacacia (Linné)., A. saccharinum (Linné), T. × europaea (Linné), A. platanoides (Linné), F. excelsior (Linné), B. pendula (Roth), C. occidentalis (Linné), and P. acerifolia (Münchhausen). These species were the most dominant in the studied area. The age of individuals was about 10–15 years, the state of trees was healthy, and the presence of pests and symptoms of disease were not found by visual examination. We randomly chose 3 individuals from each species and collected 15 leaves from each tree at a 1.5 m height.

Figure 5.
Sampling sites in Debrecen, Hungary.
4.2. Dust Amount Analysis
The area of the sampled leaf was determined by scanning the leaves in black and white, and the pictures were analysed using ImageJ software. During chemical analyses, the leaves were put into 500 mL plastic boxes. Then, 250 mL of deionised water was added to the leaves. The samples were shaken for 10 min on an orbital shaker. This suspension was filtered through a 150 μm sieve. Then, the leaves were again shaken in 50 mL deionised water, repeating the previous procedure. This 300 mL suspension was filtered through two types of filter paper using a vacuum filter machine (N 811 KN.18 Laboport). First, filter paper with a retention diameter of 5–8 µm was used (Munktell 392, Ahlstrom) so that the amount of coarse dust could be measured. Then, the filtrate was filtered again using a filter paper with a retention diameter of 2–3 µm (Munktell 391, Ahlstrom). The amount of fine dust was measured using the gravimetric method; filter papers were weighed before and after filtration to determine the amount of dust collected on the paper. The amount of dust was determined in µg cm−2, as in mass per area of the leaf’s surface [7,8,9].
4.3. Air Pollution Tolerance Index (APTI)
APTI values were calculated based on the ascorbic acid content in mg g−1 (A), total chlorophyll content in mg g−1 (T), pH of leaf extract (P), and relative water content (R) of the tree leaves. Using these parameters, we applied the equation proposed by Singh et al. [44] for APTI:
APTI = [A × (T + P) + R]/10
The ascorbic acid content was measured with the redox titration method, where 2 g of leaf tissue was crushed and homogenised in deionised water. After filtration, the samples were titrated using an iodine solution with starch as an indicator.
Chlorophyll was extracted from approximately 20 mg of fresh leaf tissue using 5 mL of 96% ethanol. The absorbances of the extracts were measured at wavelengths of 653, 666, and 750 nm, using spectrophotometric analysis. The total chlorophyll content (T) was calculated as follows:
where V is the volume (ml) of leaf extract, m is the fresh weight (g) of the leaf sample, and E666 and E653 are the absorbances at 666 nm and 653 nm minus the absorbance at 750 nm, respectively. For the pH measurement, 2 g of leaf tissue was crushed and homogenised in 100 mL deionised water. The leaf pH of this extract was measured using a digital pH meter. To determine the relative water content, the fresh weight of individual leaves (FW) was measured. Then, the leaves were immersed in water overnight before being weighed again to determine the turgid weight (TW). Finally, the leaves were dried in an oven at 70 °C to measure the dry weight (DW). The relative water content (R) was calculated as follows:
T (mg g−1) = (17.12 × E666 – 8.68 × E653) × V/m × 1000
R (%) = (FW – DW)/(TW – DW) × 100
Categorisation of tree species based on APTI values [45] are the following: APTI > 24, tolerant; 20–24, moderately tolerant; 15–19, intermediate; and ≤14, sensitive.
4.4. Elemental Analysis in Leaves
After the determination of dust amount and APTI, leaf samples were dried for 24 h at 60 °C, then the samples were homogenised and stored in plastic tubes until pre-treatment. For elemental analysis, 0.2 g of plant tissue was digested using 5 mL 65% (m/m) nitric acid and 1 mL 30% (m/m) hydrogen peroxide. Digested samples were diluted to 25 mL with deionised water [6,8,9,10]. Inductively coupled plasma optical emission spectrometry (ICP-OES 5110 Agilent Technologies) was used during the elemental analysis of leaf samples (Supplementary Material Table S2). We used six-point calibration procedures with a multi-element calibration solution (Merck ICP multi-element standard solution IV) and measured the concentration of Al, Ba, Ca, Cr, Cu, Fe, K, Mg, Mn, Na, Ni, Pb, and Zn. Road dust (BCR670) and Peach leaves (1547) CRM were used, and the recoveries were within 10% of the certified values for the elements.
4.5. Statistical Analyses
The normality of the distribution was tested using the Shapiro–Wilk test. The homogeneity of variances was tested with Levene’s test. The differences among samples were tested using analysis of variance (ANOVA) for each variable. Tukey’s test was used for pairwise comparison between the groups. Canonical discriminant analysis (CDA) was used to reduce dimensions and to identify those variables that most efficiently discriminated the study area as the dependent variable. Dust content, total chlorophyll content, ascorbic acid content, leaf pH, and relative water content were used as independent variables. We repeated the CDA with the elemental concentrations (aluminium, barium, calcium, chromium, cobalt, copper, iron, potassium, magnesium, manganese, sodium, nickel, lead, strontium, and zinc) in leaf tissues as independent variables to separate the study area as a dependent variable. We reported the properties of discriminant functions (DFs) and their correlations with the independent variables’ observed values (r). Statistical analyses were conducted with SPSS Statistics 20 (IBM) statistical software [44].
5. Conclusions
We aimed to assess the role of eight tree species in urban green area planning from the aspect of pollution tolerance and bioindication of air pollution using the APTI. We demonstrated that R. pseudoacacia, T. × europaea, A. platanoides, F. excelsior, B. pendula, and C. occidentalis were sensitive indicator species of air pollution. Tolerance was moderate for A. saccharinum, while P. acerifolia was intermediate, based on the APTI value. There was a significant difference among species based on leaves for the ascorbic acid content, for the pH of the leaf, and for the total chlorophyll content of leaves. The ascorbic acid content was the highest in B. pendula leaves, and the pH was the highest on the leaves of R. pseudoacacia and C. occidentalis. The total chlorophyll content was the highest on the leaves of A. platanoides. There were significant differences in the Al, Ba, Ca, Fe, Mg, Ni, S, Sr, and Zn concentrations of leaves among the species. We found that tree leaves are reliable bioindicators of urban air pollution. APTI is useful in selecting pollution-tolerant species and can be used for urban green infrastructure planning in the phase of species selection. Based on the APTI, A. saccharinum and P. acerifolia, and based on the PM, A. saccharinum and B. pendula, are recommended as pollutant-accumulator species, while other studied species, especially those with lower APTI values, are useful bioindicators of air pollution and proxies of urban health.
Supplementary Materials
The following are available online at https://www.mdpi.com/article/10.3390/plants10122797/s1, Table S1: The Canonical Discriminant Analysis output of studied tree species based on the elemental concentrations of leaves, Table S2: The instrumental conditions for ICP-OES for trace elemental analysis.
Author Contributions
Sampling, V.É.M.; laboratory analysis, V.É.M., D.L. and D.B.; data analysis, E.S.; writing—original draft preparation, E.S.; writing—review and editing, S.S. and B.T. All authors have read and agreed to the published version of the manuscript.
Funding
Research was funded by the TNN123457, OTKA K 116639, KH 126481, and KH 126477 grants. Our work was also supported by the ÚNKP-19-3 New National Excellence Program of the Hungarian Ministry for Innovation and Technology.
Institutional Review Board Statement
Not applicable.
Informed Consent Statement
Not applicable.
Data Availability Statement
Date is contained within the article and supplementary material.
Acknowledgments
We acknowledge Agilent Technologies and Novo-Lab Ltd. (Debrecen, Hungary) for providing the ICP-OES.
Conflicts of Interest
The authors declare no conflict of interest.
References
- Sicard, P.; Agathokleous, E.; De Marco, A.; Paoletti, E.; Calatayud, V. Urban population exposure to air pollution in Europe over the last decades. Environ. Sci. Eur. 2021, 33, 28–40. [Google Scholar] [CrossRef]
- Koolen, C.D.; Rothenberg, G. Air pollution in Europe. ChemSusChem 2019, 12, 164–172. [Google Scholar] [CrossRef]
- Feng, W.; Guo, Z.; Xiao, X.; Peng, C.; Shi, L.; Ran, H.; Xu, W. Atmospheric deposition as a source of cadmium and lead to soil-rice system and associated risk assessment. Ecotoxicol. Environ. Saf. 2019, 180, 160–170. [Google Scholar] [CrossRef] [PubMed]
- Breuste, J.; Artmann, M.; Ioja, C.; Qureshi, S. (Eds.) Making Green Cities: Concepts, Challenges and Practice; Springer: Berlin/Heidelberg, Germany, 2020. [Google Scholar]
- Hüse, B.; Szabó, S.; Deák, B.; Tóthmérész, B. Mapping an ecological network of green habitat patches and their role in maintaining urban biodiversity in and around Debrecen city (Eastern Hungary). Land Use Pol. 2016, 57, 574–581. [Google Scholar] [CrossRef]
- Ferrini, F.; Fini, A.; Mori, J.; Gori, A. Role of vegetation as a mitigating factor in the urban context. Sustainability 2020, 12, 4247. [Google Scholar] [CrossRef]
- Du, X.; Cheng, Y.; Liu, Z.; Hou, Z.; Wu, T.; Lei, R.; Shu, C. Study on the adsorption of CH4, CO2 and various CH4/CO2 mixture gases on shale. Alex. Eng. J. 2020, 17, 5165–5178. [Google Scholar] [CrossRef]
- Molnár, V.É.; Tőzsér, D.; Szabó, S.; Tóthmérész, B.; Simon, E. Use of leaves as bioindicator to assess air pollution based on composite proxy measure (APTI), dust amount and elemental concentration of metals. Plants 2020, 9, 1743. [Google Scholar] [CrossRef] [PubMed]
- Simon, E.; Baranyai, E.; Braun, M.; Cserhati, C.; Fabian, I.; Tóthmérész, B. Elemental concentrations in deposited dust on leaves along an urbanization gradient. Sci. Total. Environ. 2014, 490, 514–520. [Google Scholar] [CrossRef] [PubMed] [Green Version]
- Simon, E.; Harangi, S.; Baranyai, E.; Fábián, I.; Tóthmérész, B. Influence of past industry and urbanization on elemental concentrations in deposited dust and tree leaf tissue. Urban Forest. Urban Green. 2016, 20, 12–19. [Google Scholar] [CrossRef]
- Simon, E.; Molnár, V.É.; Tóthmérész, B.; Szabó, S. Ecological assessment of particulate material (PM5 and PM10) in urban habitats. Atmosphere 2020, 11, 559. [Google Scholar] [CrossRef]
- Gajbhiye, T.; Pandey, S.K.; Lee, S.S.; Kim, K.-H. Size fractionated phytomonitoring of airborne particulate matter (PM) and speciation of PM bound toxic metals pollution through Calotropis procera in an urban environment. Ecol. Indic. 2019, 104, 32–40. [Google Scholar] [CrossRef]
- Mirecki, N.; Agic, R.; Šunić, L.; Milenkovic, L.; Ilic, Z. Transfer factor as indicator of heavy metals content in plants. Fresen Environ. Bull. 2015, 24, 4212–4219. [Google Scholar]
- Prabasiwi, D.S.; Murniasih, S.S.; Rozana, K. Transfer factor as indicator of heavy metal content in plants around adipala steam power plant. IOP Conf. Ser. J. Physics. Conf. 2020, 1436, 12133–12144. [Google Scholar] [CrossRef]
- Sulistijorini; Mas’ud, Z.A.; Nasrullah, N.; Bey, A.; Tjitrosemito, S. Tolerance levels of roadside trees to air pollutants based on relative growth rate and Air Pollution Tolerance Index. Hayati J. Biosci. 2008, 15, 123–129. [Google Scholar] [CrossRef] [Green Version]
- Romano, S.; Perrone, M.R.; Becagli, S.; Pietrogrande, M.C.; Russo, M.; Caricato, R.; Lionetto, M.G. Ecotoxicity, genotoxicity, and oxidative potential tests of atmospheric PM10 particles. Atmos. Environ. 2020, 221, 117085–117096. [Google Scholar] [CrossRef]
- Harrison, R.M. Airborne particulate matter. Phil. Trans. R. Soc. A 2020, 378, 20190319. [Google Scholar] [CrossRef] [PubMed]
- Cohen, A.J.; Brauer, M.; Burnett, R.; Anderson, H.R.; Frostad, J.; Estep, K.; Balakrishnan, K.; Brunekreef, B.; Dandona, L.; Dandona, R.; et al. Estimates and 25-year trends of the global burden of disease attributable to ambient air pollution: An analysis of data from the Global Burden of Diseases Study 2015. Lancet 2017, 389, 1907–1918. [Google Scholar]
- Liacos, J.W.; Kam, W.; Delfino, R.J.; Schauer, J.J.; Sioutas, C. Characterization of organic, metal and trace element PM2.5 species and derivation of freeway-based emission rates in Los Angeles, CA. Sci. Total Environ. 2012, 435–436, 159–166. [Google Scholar] [CrossRef]
- Pascal, M.; Corso, M.; Chanel, O.; Declercq, C.; Badaloni, C.; Cesaroni, G.; Henschel, S.; Meister, K.; Haluza, D.; Martin-Olmedo, P.; et al. Assessing the public health impacts of urban air pollution in 25 European cities: Results of the Aphekom project. Sci. Total Environ. 2013, 449, 390–440. [Google Scholar] [CrossRef] [PubMed]
- Maeaba, W.; Prasad, S.; Chandra, S. First assessment of metals contamination in road dust and roadside soil of Suva City, Fiji. Arch. Environ. Contam. Toxicol. 2019, 77, 249–262. [Google Scholar] [CrossRef] [PubMed] [Green Version]
- Panyacosit, L. Health effects. In A Review of Particulate Matter and Health: Focus on Developing Countries; International Institute for Applied Systems Analysis (IIASA): Laxenburg, Austria, 2000; pp. 16–19. Available online: https://doi.org/10.2139/ssrn.235099 (accessed on 23 May 2000).
- Agnihotri, R.; Mishra, S.K.; Yadav, P.; Singh, S.; Rashmi, R.; Prasad, M.V.S.N.; Sharma, C.; Arya, B.C. Bulk level to individual particle level chemical composition of atmospheric dust aerosols (PM5) over a semi-arid urban zone of Western India (Rajasthan). Aeros. Air Qual. Res. 2015, 15, 58–71. [Google Scholar] [CrossRef] [Green Version]
- Hoseinzadeh, E.; Ebrahimi, N.; Safari, M.; Ghorbani, M. Airborne particulate matter (PM5) density in traditional bakeries of saveh, central of Iran, in 2020. J. Environ. Health Sus. Develop. 2020, 5, 1035–1042. [Google Scholar]
- Massey, D.; Kulshrestha, A.; Maish, J.; Taneja, A. Seasonal trends of PM10, PM5.0, PM2.5 & PM1.0 in indoor and outdoor environments of residential homes located in North-Central India. Build. Environ. 2012, 47, 223–231. [Google Scholar]
- Girish, L.; Krishnankutty, K.; Vaidya, S. Air pollution tolerance index of selected plants growing near road side of Navi Mumbai, Maharashtra. Int. J. Curr. Res. 2017, 9, 57807–57811. [Google Scholar]
- Łukowski, A.; Popek, R.; Karolewski, P. Particulate matter on foliage of Betula pendula, Quercus robur, and Tilia cordata: Deposition and ecophysiology. Environ. Sci. Poll. Res. 2020, 27, 10296–10307. [Google Scholar] [CrossRef] [PubMed] [Green Version]
- Popek, R.; Łukowski, A.; Karolewski, P. Particulate matter accumulation—Further differences between native Prunus padus and non-native P. serotina. Dendrobiology 2017, 78, 89–95. [Google Scholar]
- Singh, S.K.; Rao, D.N. Evaluation of plants for their tolerance to air pollution. In Proceedings of the International Symposium on Air Pollution Control, Delphi, Greece, 23–25 November 1983; pp. 218–224. [Google Scholar]
- Molnár, V.É.; Simon, E.; Tóthmérész, B.; Ninsawat, S.; Szabó, S. Air pollution induced vegetation stress—The Air Pollution Tolerance Index as a quick tool for city health evaluation. Ecol. Ind. 2020, 113, 106234–106242. [Google Scholar] [CrossRef]
- Kretinin, V.M.; Selyanina, Z.M. Dust retention by tree and shrub leaves and its accumulation in light chestnut soils under forest shelterbelts. Eurasian Soil Sci. 2006, 39, 334–338. [Google Scholar] [CrossRef]
- Yang, J.; Chang, Y.; Yan, P. Ranking the suitability of common urban tree species for controlling PM2.5 pollution. Atmos. Poll. Res. 2015, 6, 267–277. [Google Scholar] [CrossRef] [Green Version]
- Gregorová, B.; Černý, K.; Holub, V.; Strnadová, V. Effects of climatic factors and air pollution on damage of London plane (Platanus hispanica Mill.). Hort. Sci. 2010, 37, 109–117. [Google Scholar] [CrossRef] [Green Version]
- Haynes, A.; Popek, R.; Boles, M.; Paton-Walsh, C.; Robinson, S.A. Roadside Moss turfs in South East Australia capture more particulate matter along an urban gradient than a common native tree species. Atmosphere 2019, 10, 224. [Google Scholar] [CrossRef] [Green Version]
- Alotaibi, M.D.; Alharbi, B.H.; Al-Shamsi, M.A.; Alshahrani, T.S.; Al-Namazi, A.A.; Alharbi, S.F.; Alotaibi, F.S.; Qian, Y. Assessing the response of five tree species to air pollution in Riyadh City, Saudi Arabia, for potential green belt application. Environ. Sci. Poll. Res. 2020, 27, 29156–29170. [Google Scholar] [CrossRef] [PubMed]
- Weerakkody, U.; Dover, J.W.; Mitchell, P.; Reiling, K. Particulate matter pollution capture by leaves of seventeen living wall species with special reference to rail-traffic at a metropolitan station. Urban For. Urban Green. 2017, 27, 173–186. [Google Scholar] [CrossRef]
- Cheng, X.; Zhou, Z.; Teng, M.; Wang, P.; Zhou, L. Accumulation of three different sizes of particulate matter on plant leaf surfaces: Effect on leaf traits. Arch. Biol. Sci. 2015, 67, 1257–1267. [Google Scholar] [CrossRef]
- Nadgórska-Socha, A.; Kandziora-Ciupa, M.; Trzęsicki, M.; Barczyk, G. Air pollution tolerance index and heavy metal bioaccumulation in selected plant species from urban biotopes. Chemosphere 2017, 183, 471–482. [Google Scholar] [CrossRef] [PubMed]
- Rai, P.K.; Panda, L.L.S.; Chutia, B.M.C.; Singh, M.M. Comparative assessment of air pollution tolerance index (APTI) in the industrial (Rourkela) and non industrial area (Aizawl) of India: An ecomanagement approach. Afr. J. Environ. Sci. Technol. 2013, 7, 944–948. [Google Scholar]
- Ogunkunle, C.O.; Suleiman, L.B.; Oyedeji, S.; Awotoye, O.O.; Fatoba, P.O. Assessing the air pollution tolerance index and anticipated performance index of some tree species for biomonitoring environmental health. Agroforest. Syst. 2015, 89, 447–454. [Google Scholar] [CrossRef]
- Jyothi, S.J.; Jaya, D.S. Evaluation of air pollution tolerance index of selected plant species along roadsides in Thiruvananthapuram, Kerala. J. Environ. Biol. 2010, 31, 379–386. [Google Scholar] [PubMed]
- Gholami, A.; Mojiri, A.; Amini, H. Investigation of the air pollution tolerance index (APTI) using some plant species in Ahvaz region. J. Anim. Plant Sci. 2016, 26, 475–480. [Google Scholar]
- European Parliament. Directive 2008/50/EC of the European Parliament and of the Council of 21 May 2008 on ambient air quality and cleaner air for Europe. Off. J. Eur. Union 2008, 152, 1–44. [Google Scholar]
- De Sá, J.P.M. Applied Statistics Using SPSS, STATISTICA, MATLAB and R, 2nd ed.; Springer: Berlin/Heidelberg, Germany, 2007; ISBN 978-3-540-71971-7. [Google Scholar]
- Singh, S.; Rao, D.; Agrawal, M.; Pandey, J.; Naryan, D. Air pollution tolerance index of plants. J. Environ. Manag. 1991, 32, 45–55. [Google Scholar] [CrossRef]

Publisher’s Note: MDPI stays neutral with regard to jurisdictional claims in published maps and institutional affiliations. |
© 2021 by the authors. Licensee MDPI, Basel, Switzerland. This article is an open access article distributed under the terms and conditions of the Creative Commons Attribution (CC BY) license (https://creativecommons.org/licenses/by/4.0/).