
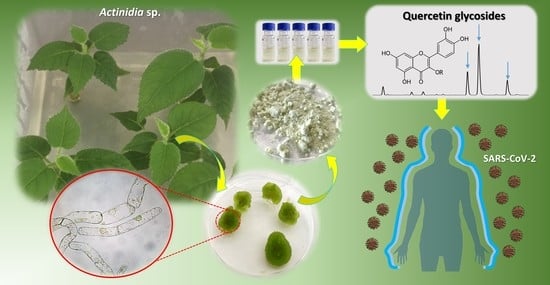
Undifferentiated In Vitro Cultured Actinidia deliciosa as Cell Factory for the Production of Quercetin Glycosides

 ,
,  ,
,  ,
,  and
and
Abstract
1. Introduction
2. Results
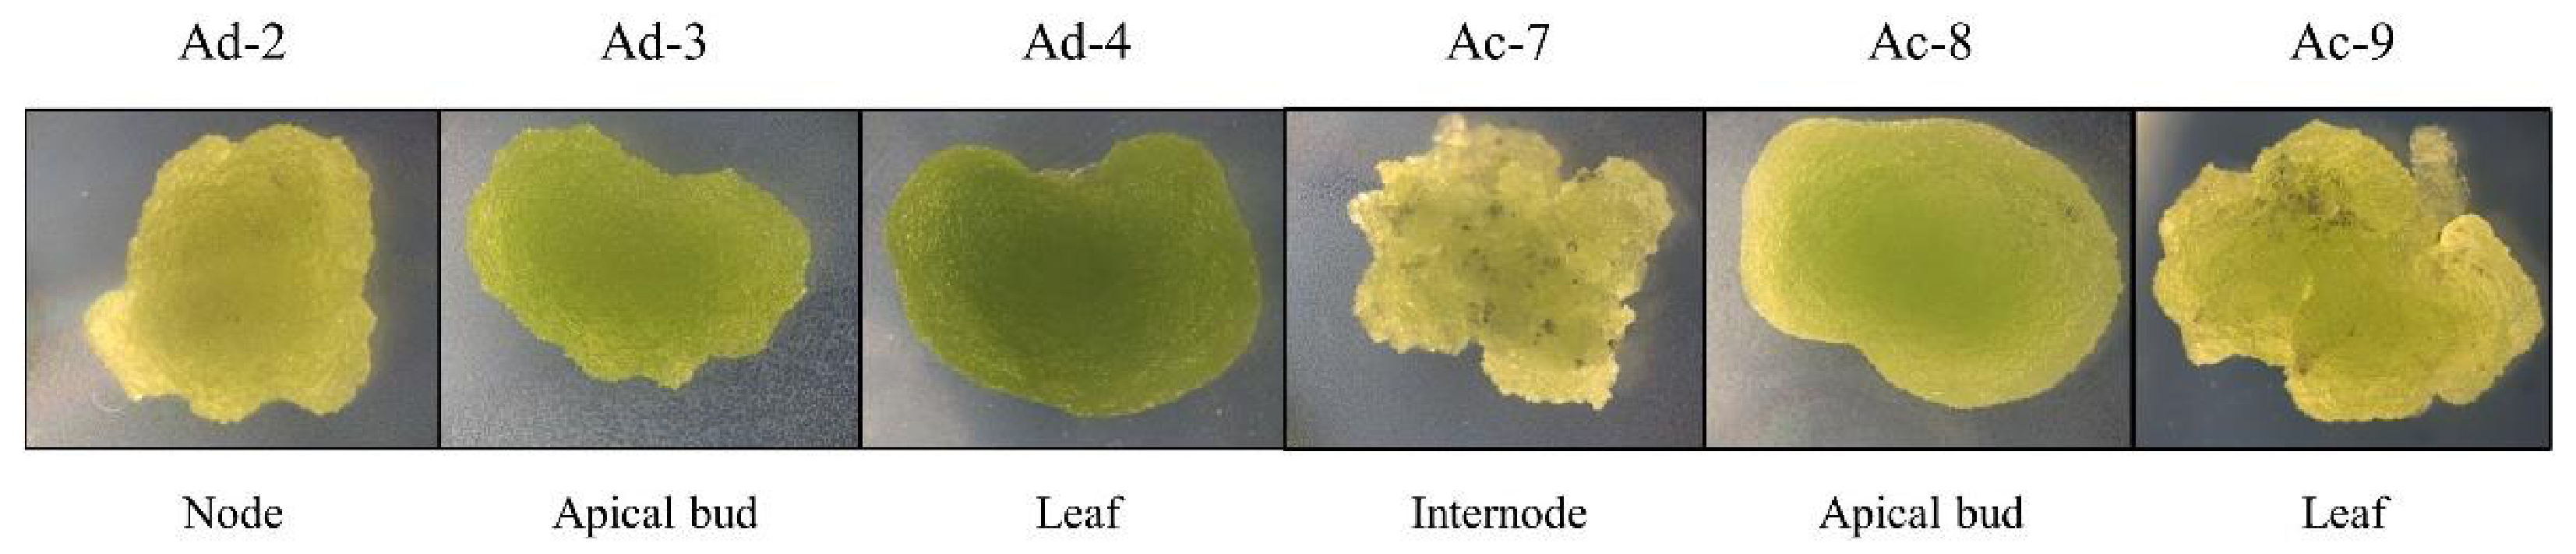
2.1. Establishment of Actinidia Cell Lines
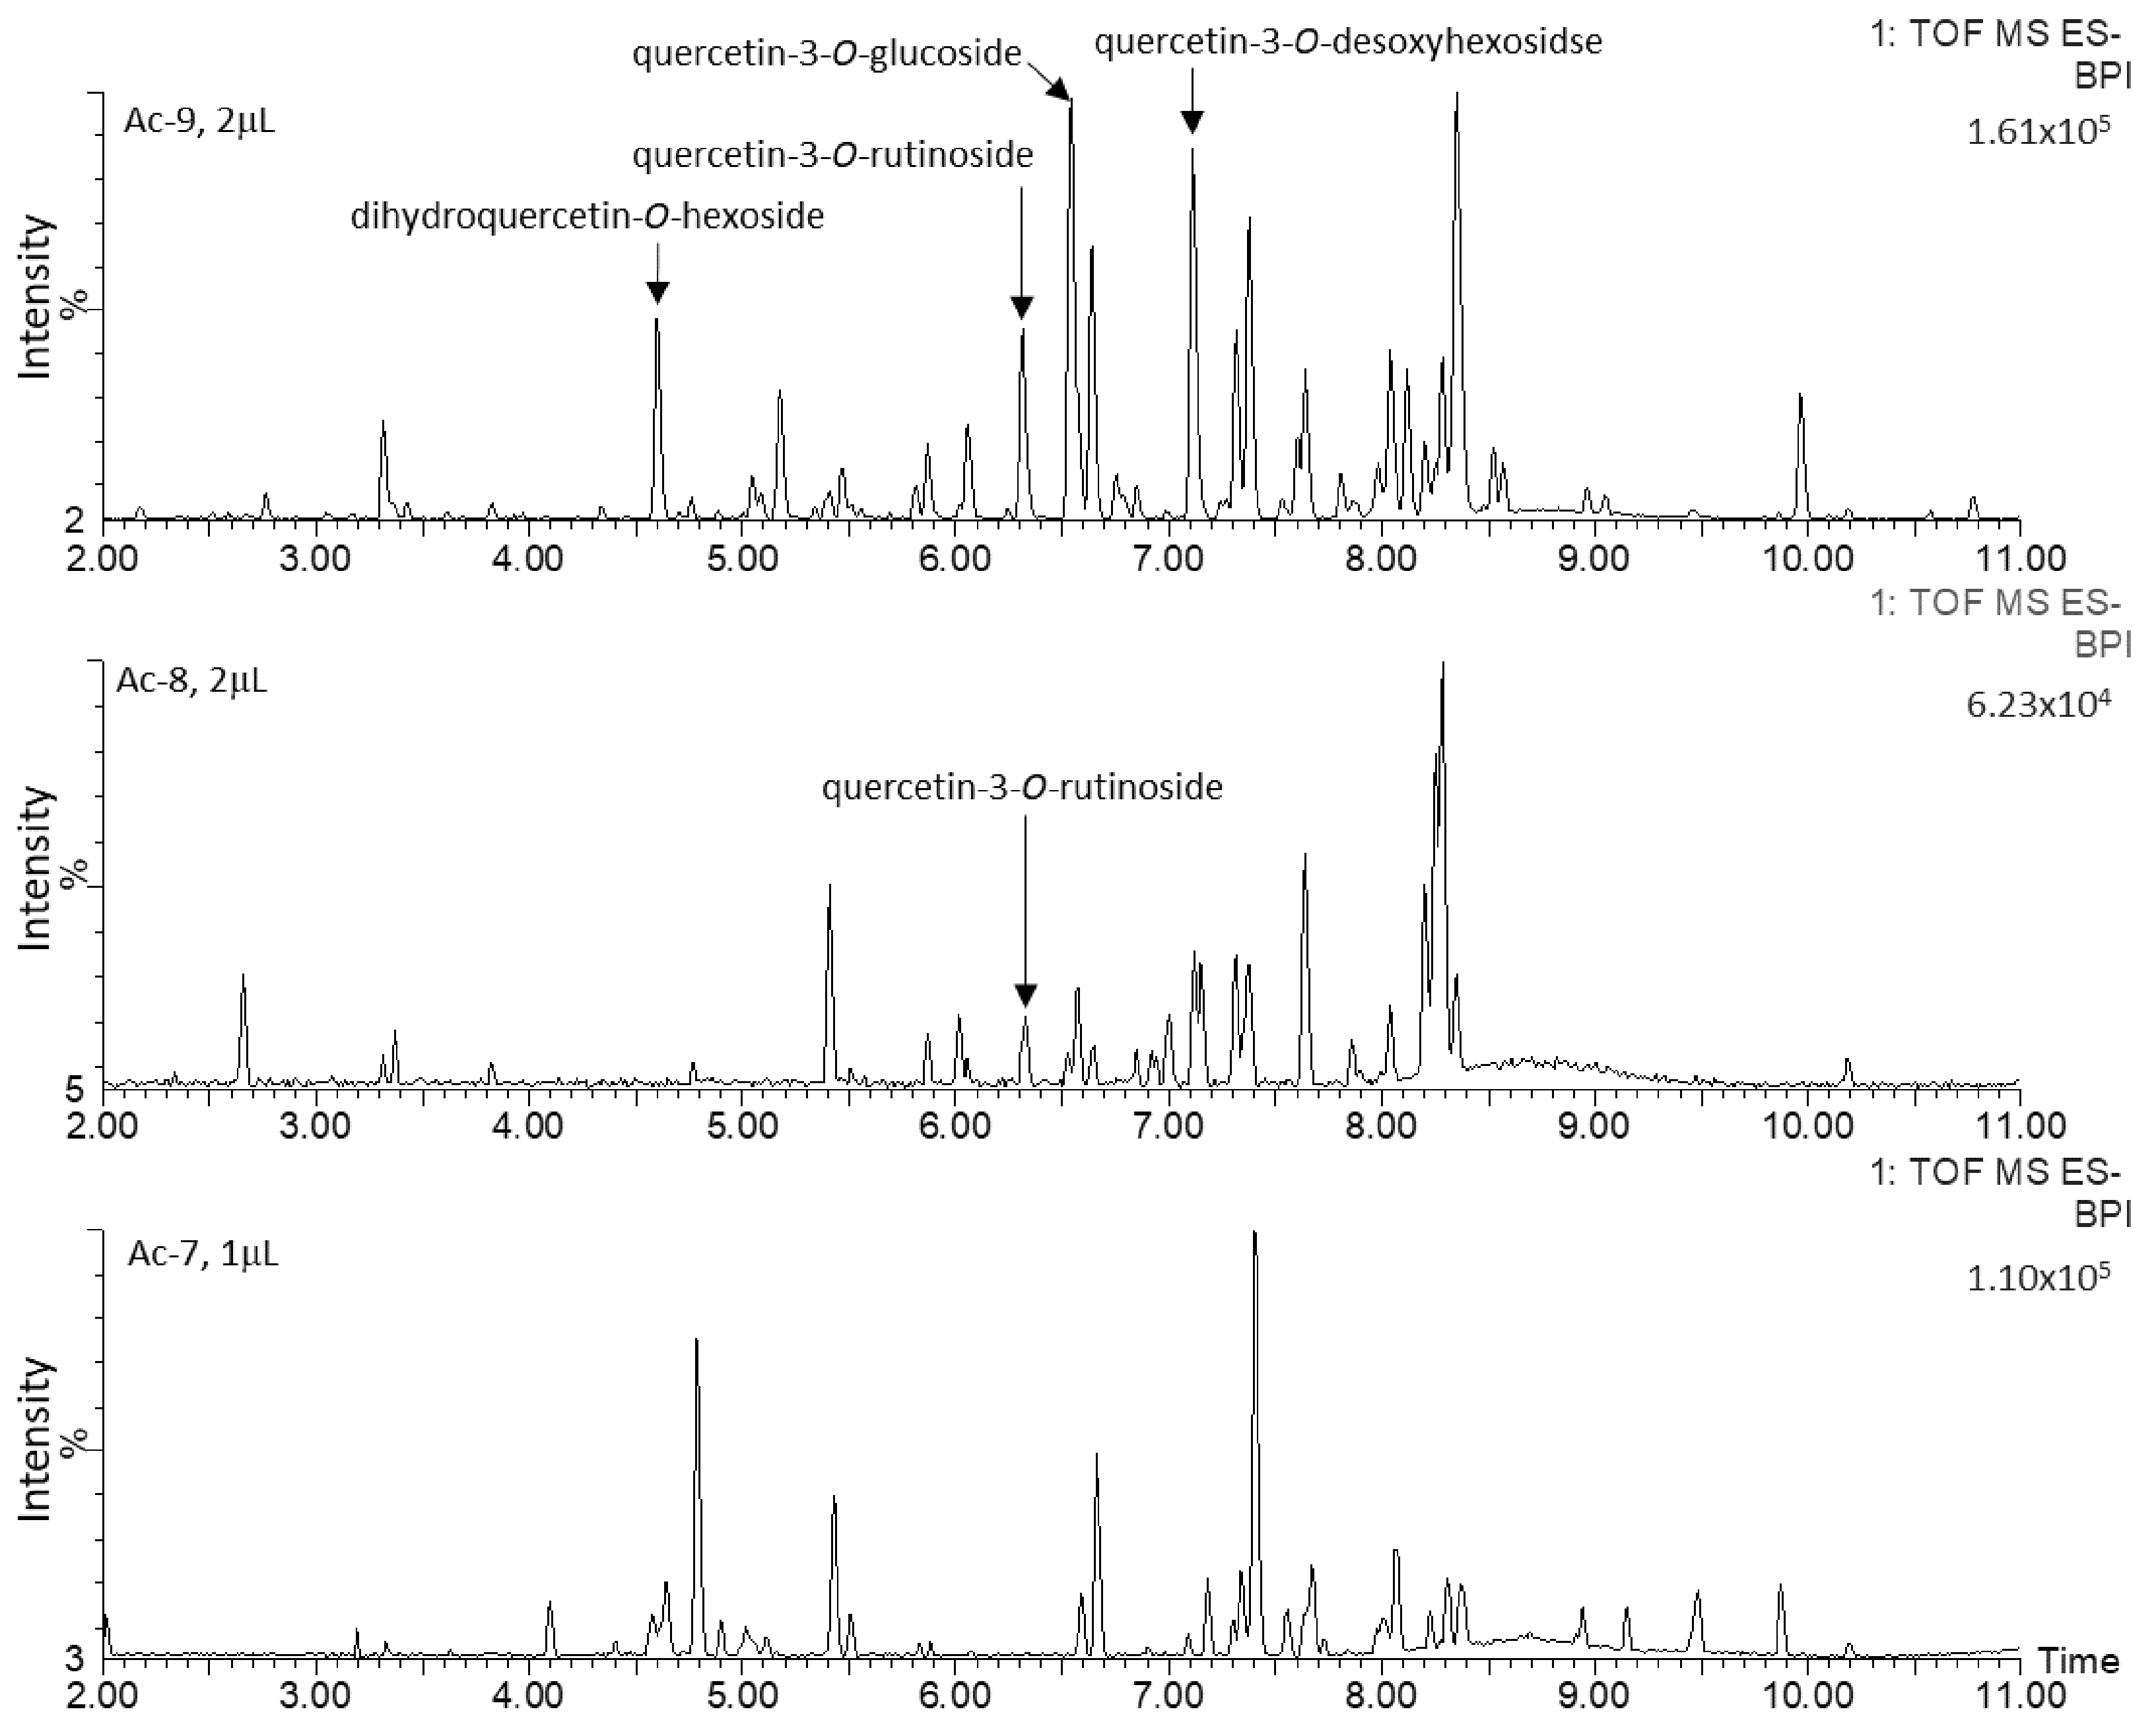
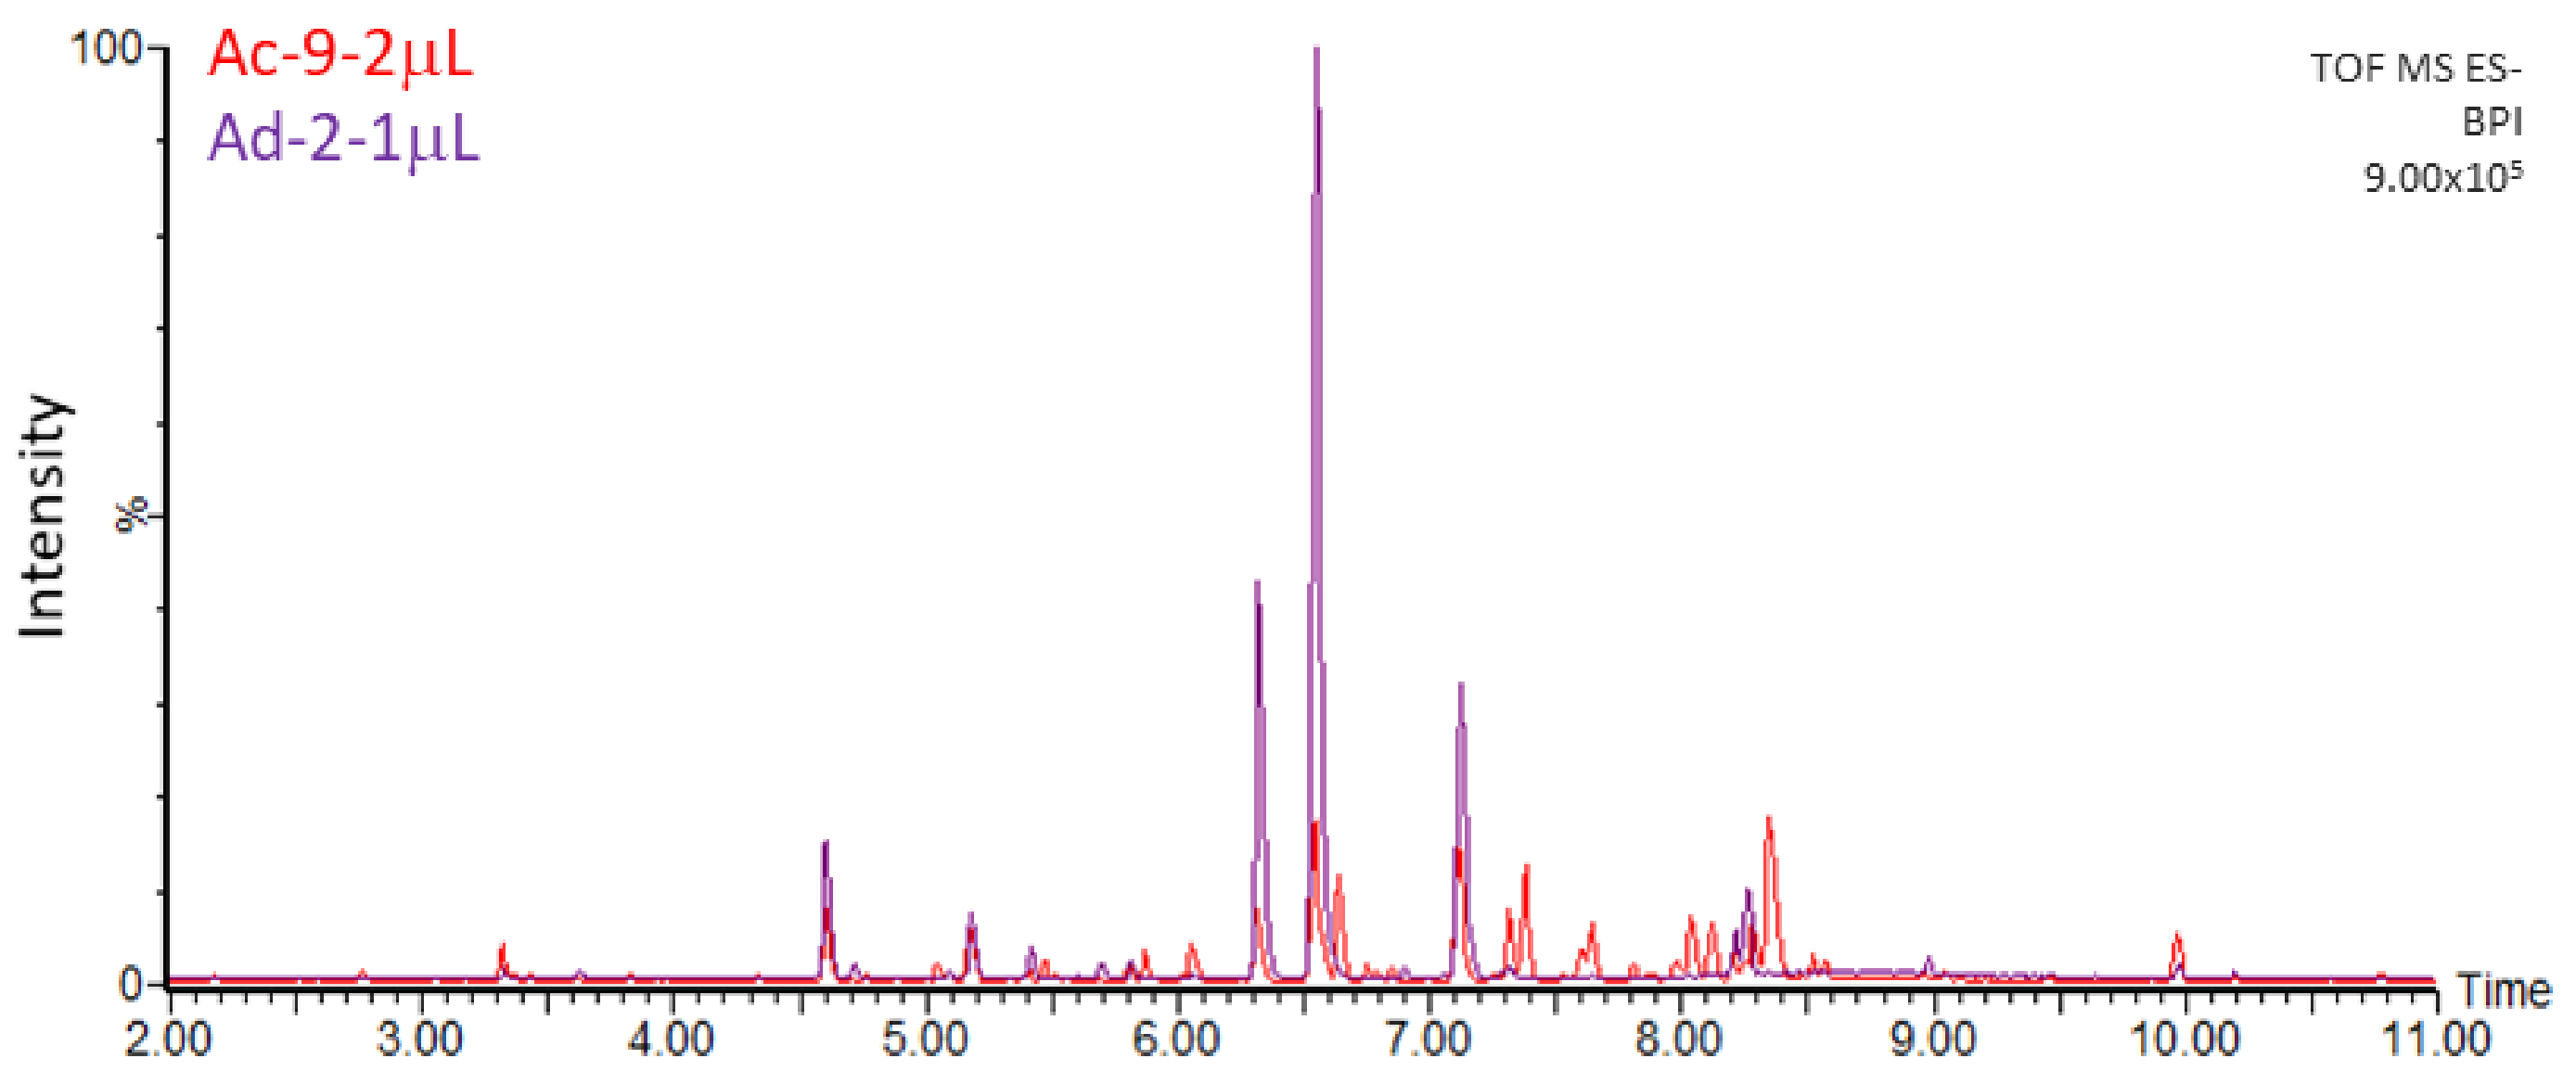
2.2. Untargeted Metabolomics Analysis
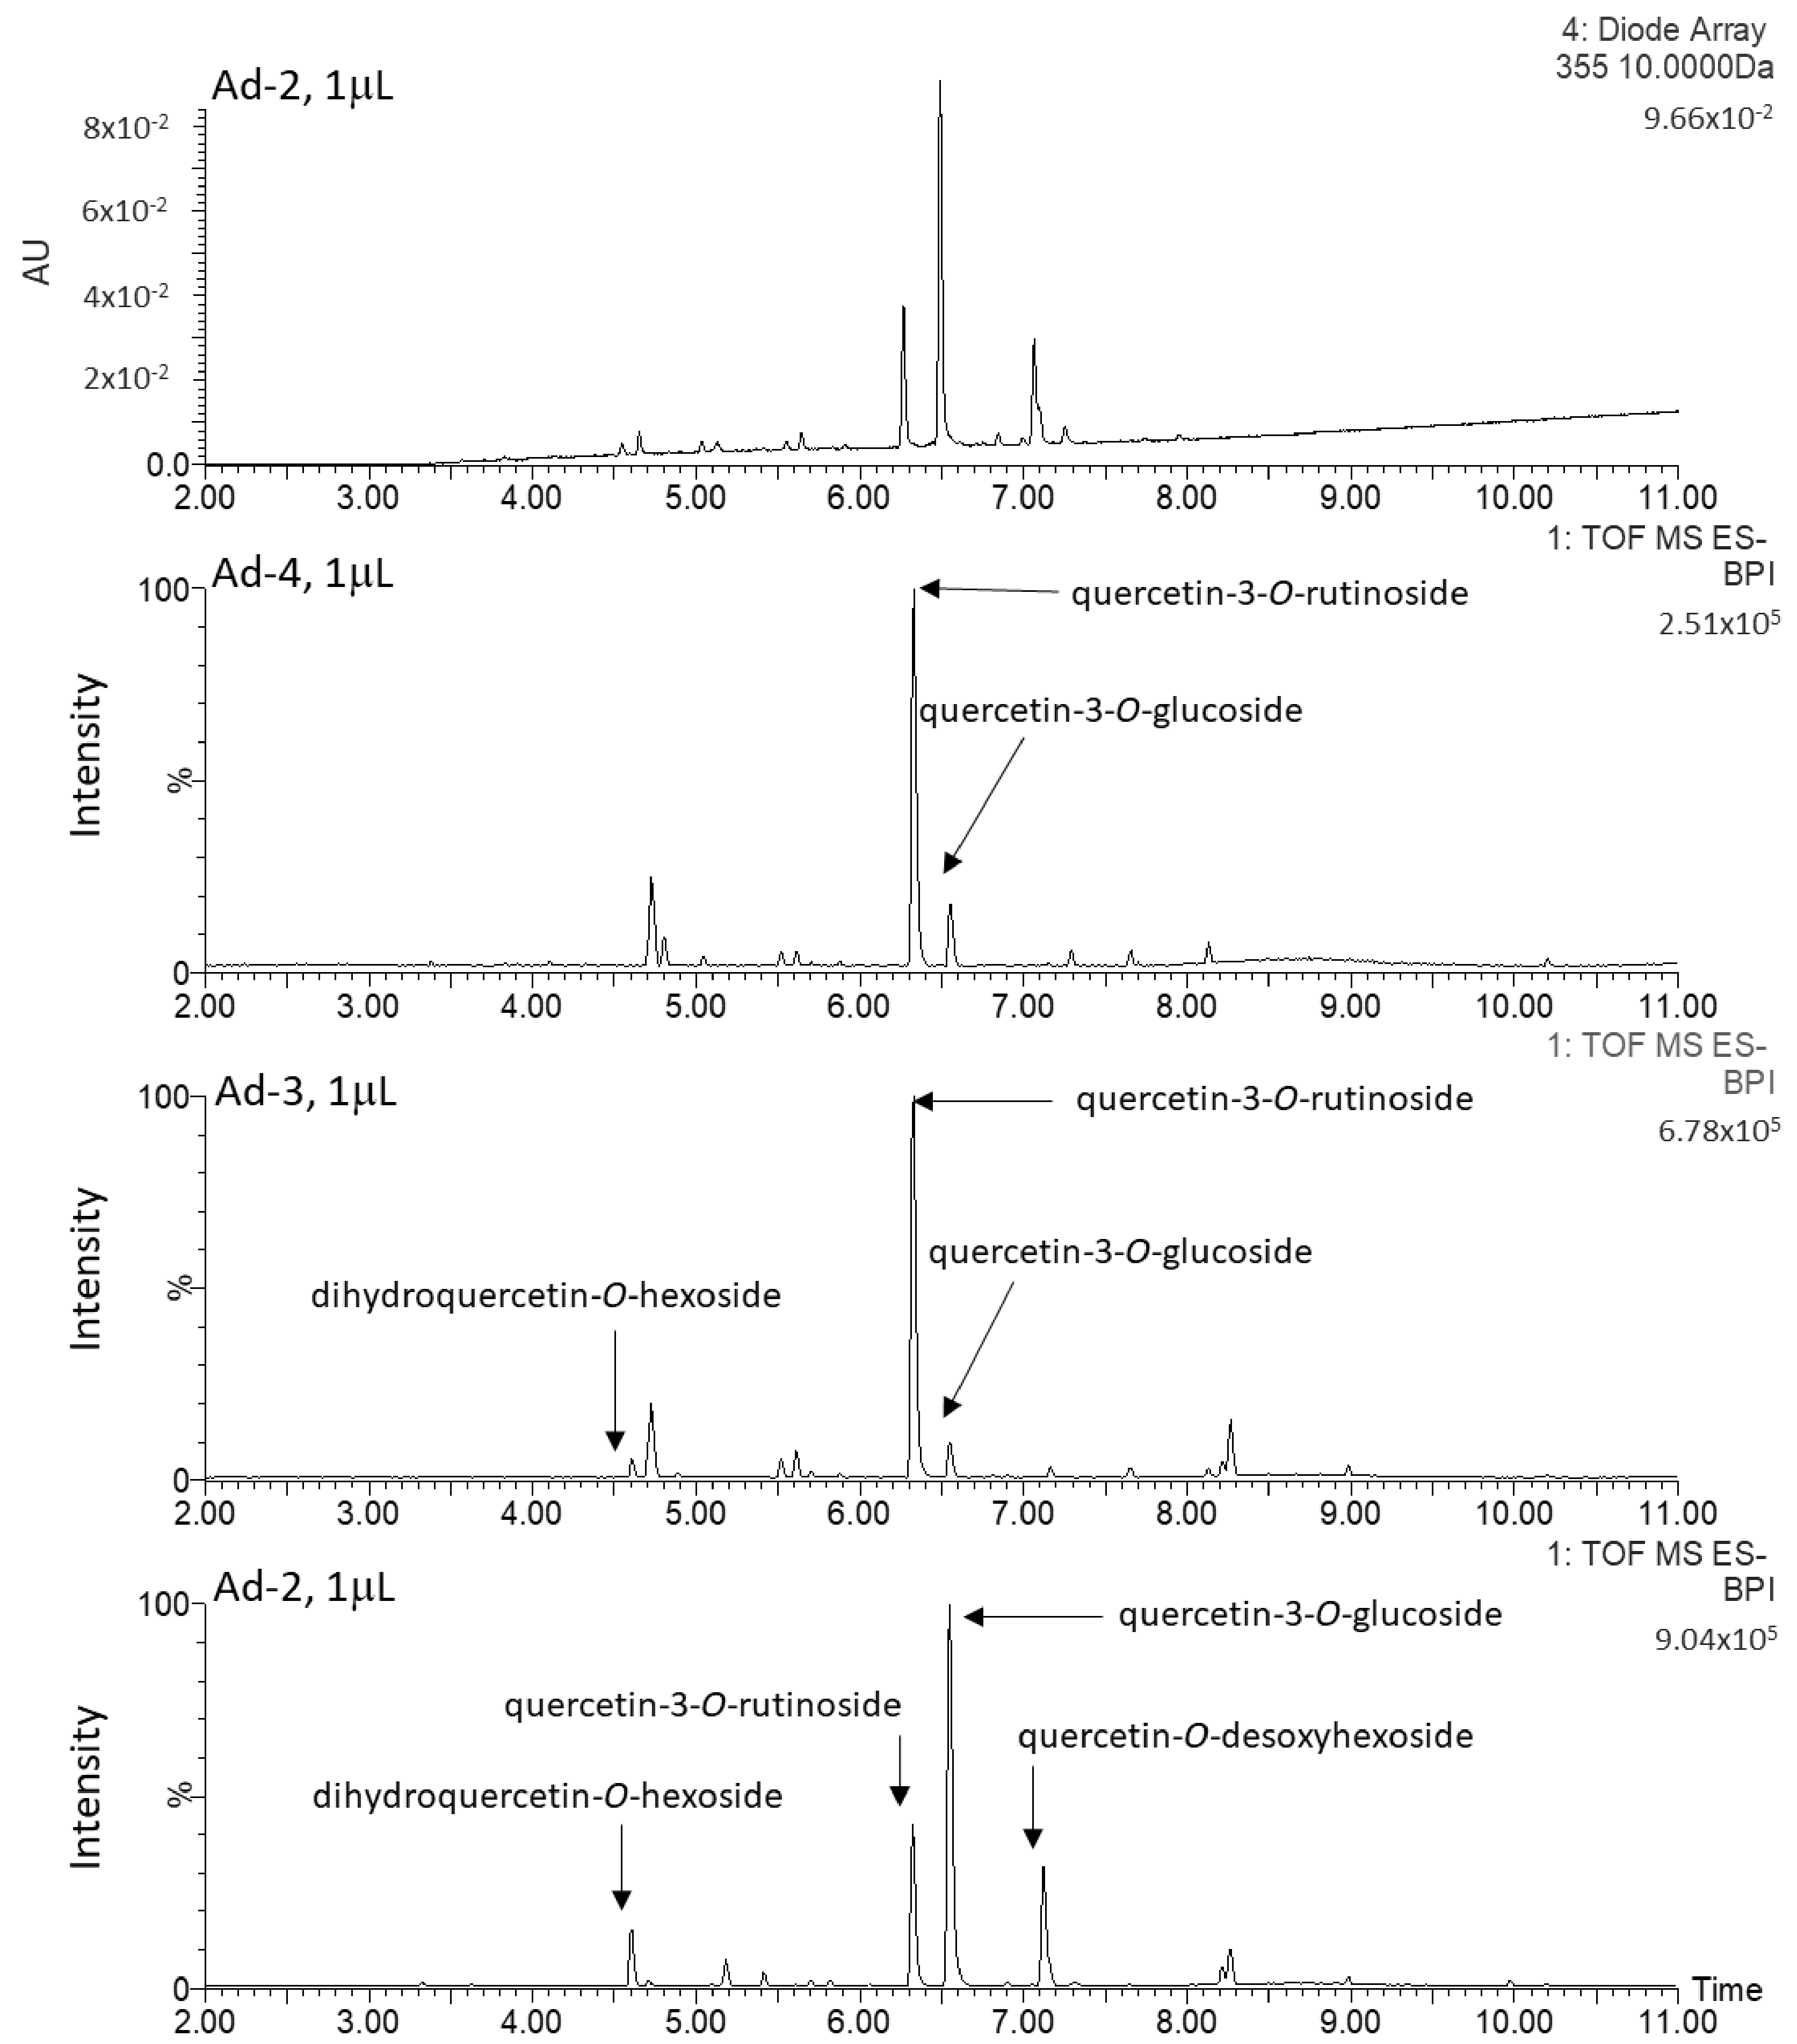
2.3. Characterization and Quantification of Quercetin Derivatives in Ad Cell Lines
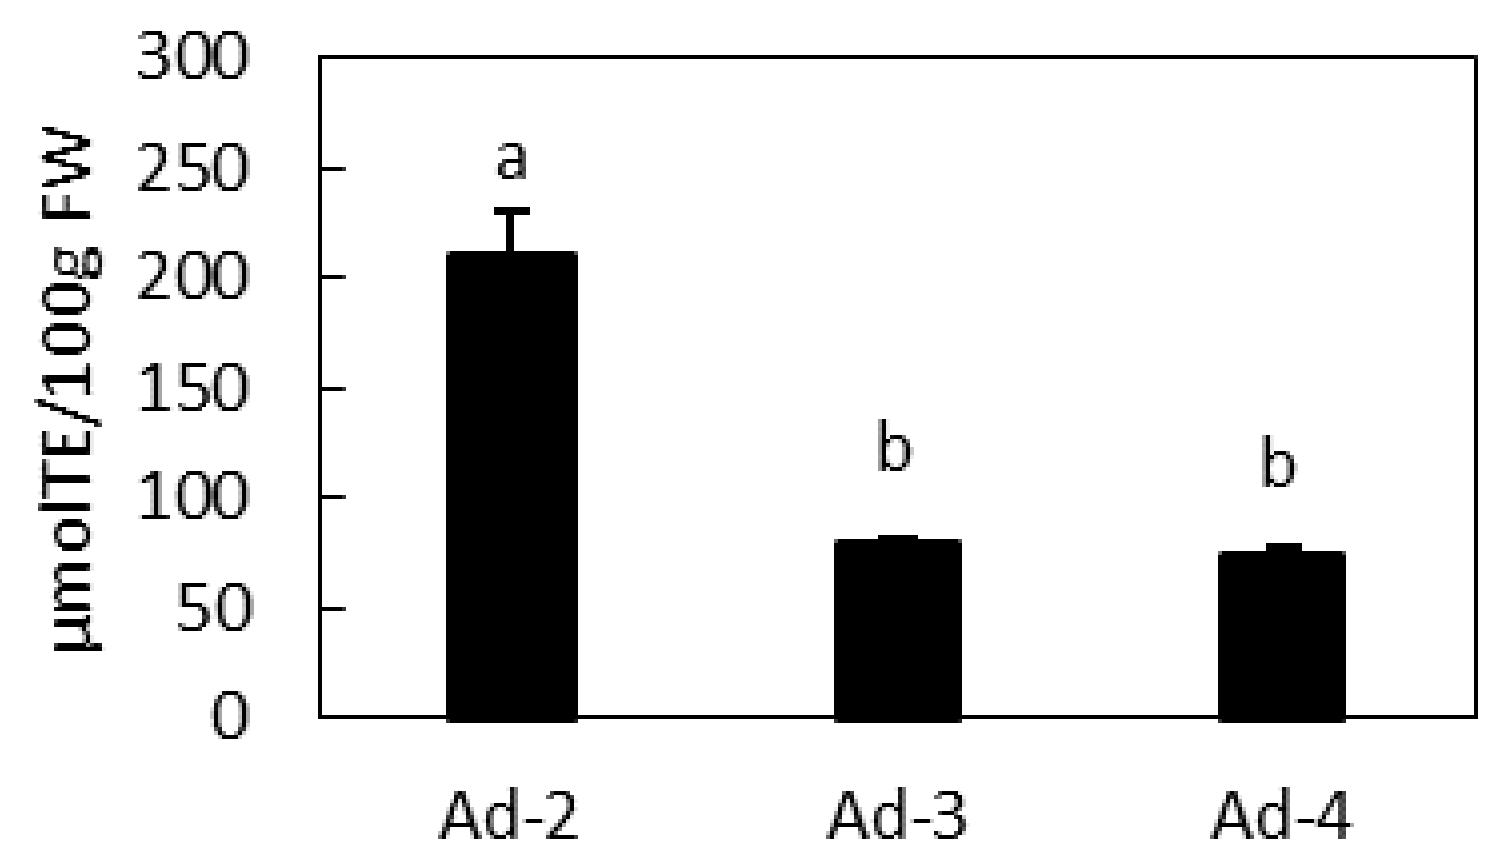
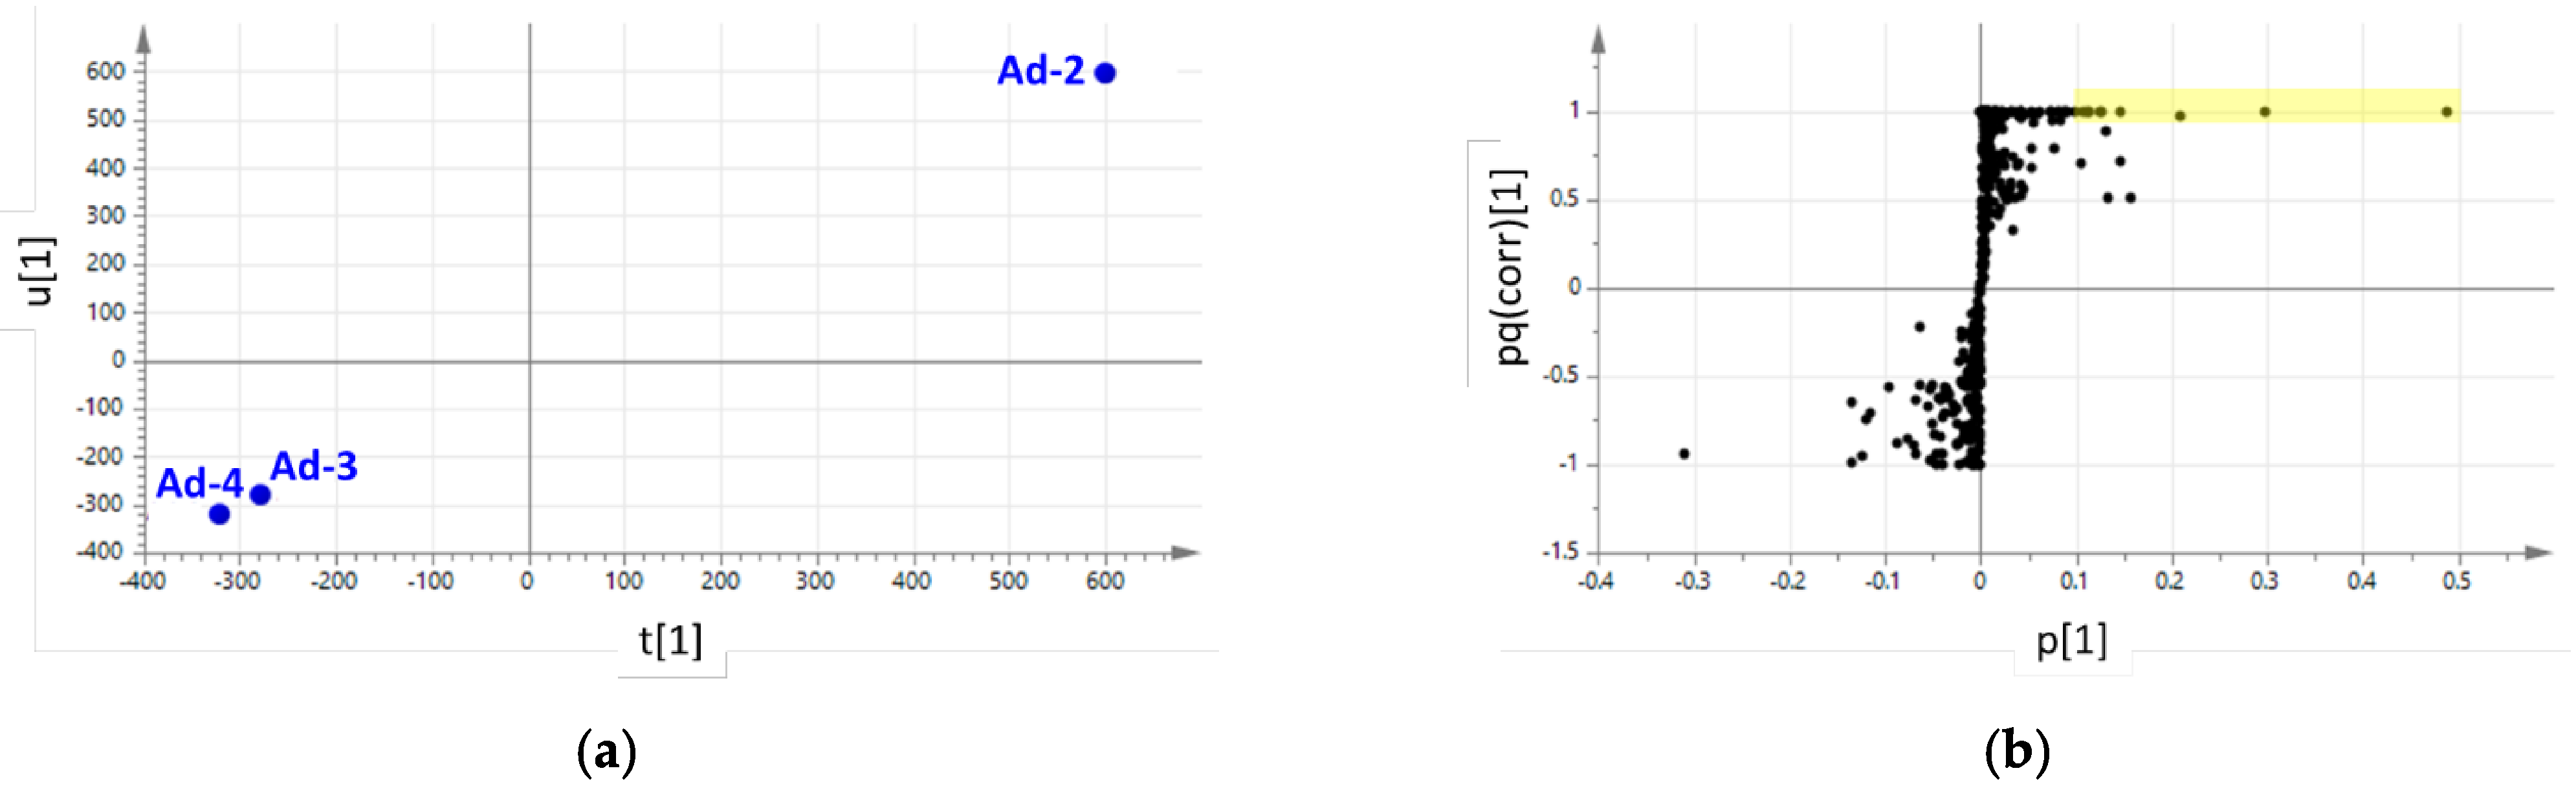
2.4. Antioxidant Activity of Ad Lines and Correlation with Their Metabolic Profile
3. Discussion
4. Materials and Methods
4.1. Generation of the Actinidia Cell Lines
4.2. Metabolite Extraction
4.3. Metabolite Analysis by UPLC-PDA-ESI-QqTOF
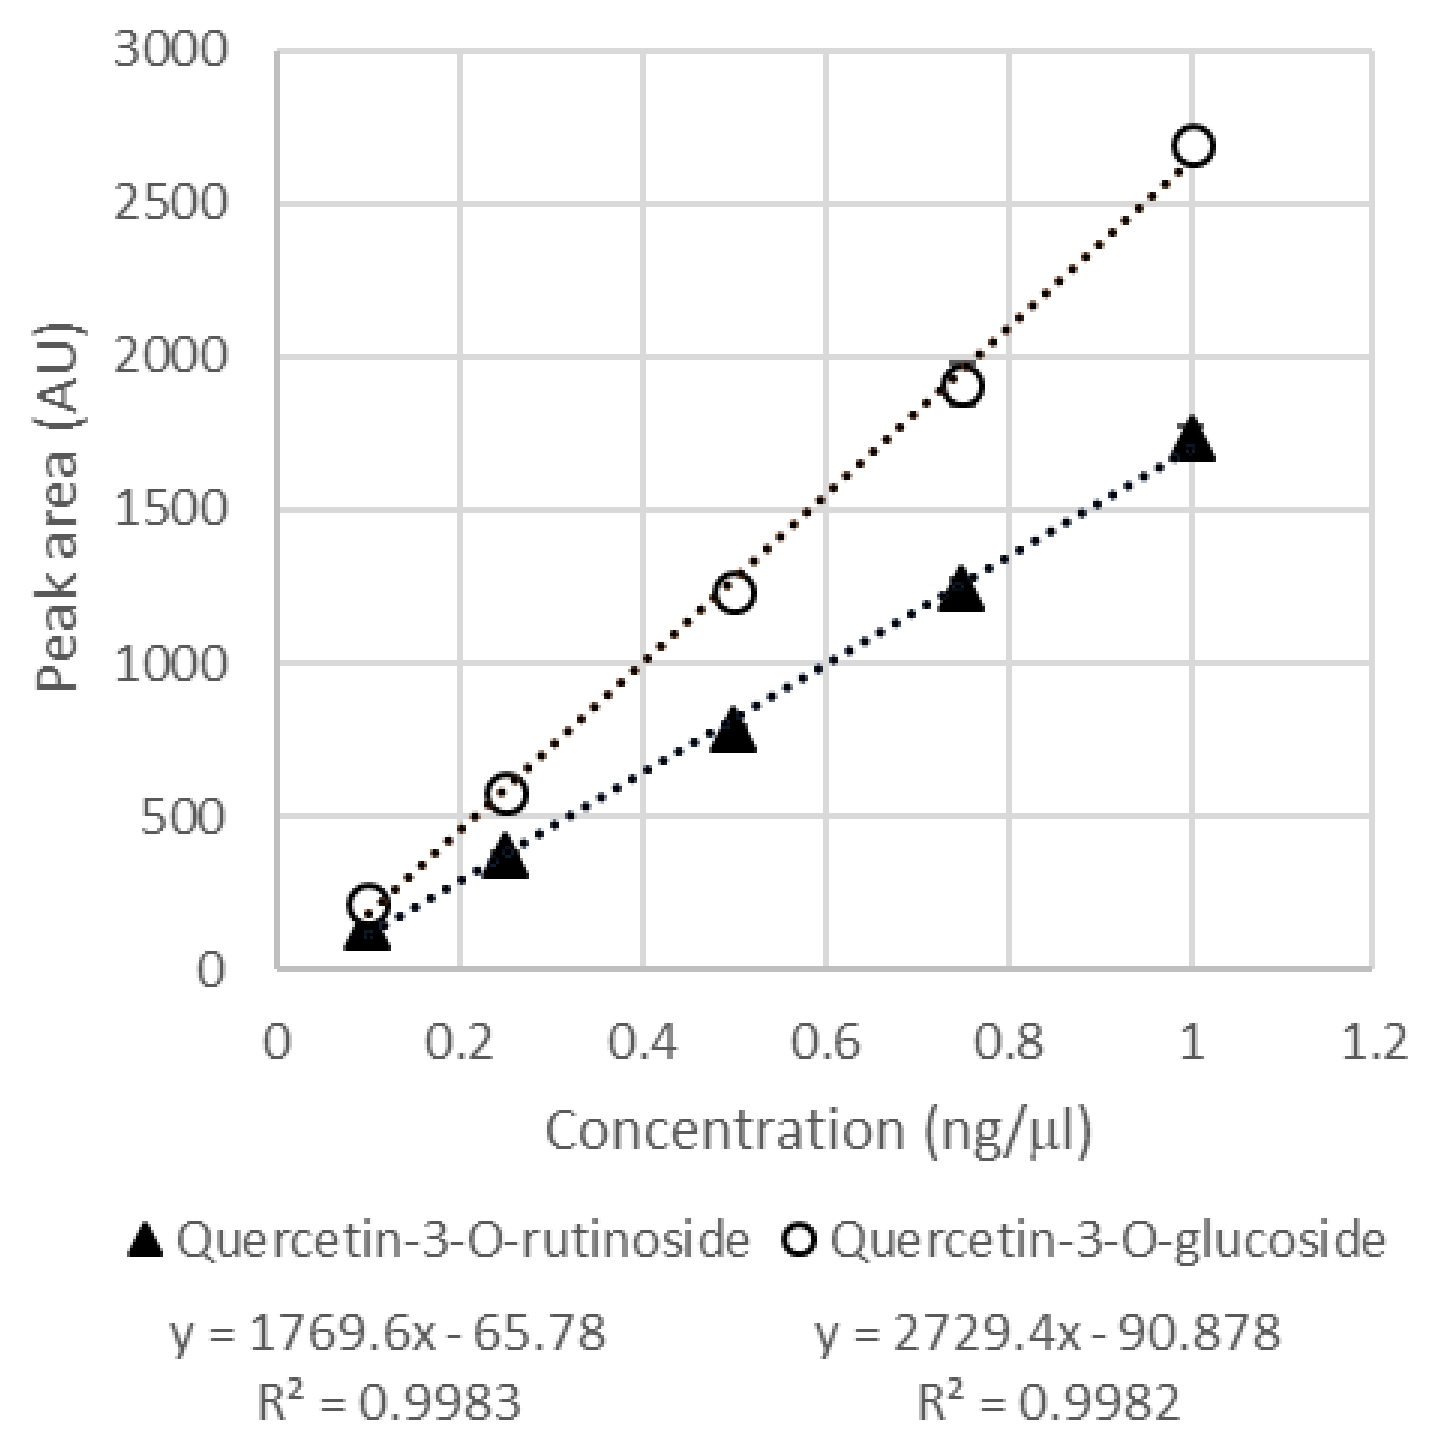
4.4. Metabolite Quantification
4.5. FRAP Antioxidant Assay
4.6. OPLS Correlation Analysis
Author Contributions
Funding
Institutional Review Board Statement
Informed Consent Statement
Conflicts of Interest
References
- Bianconi, M.; Ceriotti, L.; Cuzzocrea, S.; Esposito, E.; Pressi, G.; Sgaravatti, E.; Bertaiola, O.; Guarnerio, C.; Barbieri, E.; Semenzato, A.; et al. Red carrot cells cultured in vitro are effective, stable, and safe ingredients for skin care, nutraceutical, and food applications. Front. Bioeng. Biotechnol. 2020, 8, 575079. [Google Scholar] [CrossRef]
- Cragg, G.M.; Schepartz, S.A.; Suffness, M.; Grever, M.R. The taxol supply crisis. New NCI policies for handling the large-scale production of novel natural product anticancer and anti-HIV agents. J. Nat. Prod. 1993, 56, 1657–1668. [Google Scholar] [CrossRef]
- Fraga, C.G.; Croft, K.D.; Kennedy, D.O.; Tomás-Barberán, F.A. The effects of polyphenols and other bioactives on human health. Food Funct. 2019, 10, 514–528. [Google Scholar] [CrossRef]
- Li, Y.; Yao, J.; Han, C.; Yang, J.; Chaudhry, M.T.; Wang, S.; Liu, H.; Yin, Y. Quercetin, inflammation and immunity. Nutrients 2016, 8, 167. [Google Scholar] [CrossRef] [PubMed]
- Wang, W.; Sun, C.; Mao, L.; Ma, P.; Liu, F.; Yang, J.; Gao, Y. The biological activities, chemical stability, metabolism and delivery systems of quercetin: A review. Trends Food Sci. Technol. 2016, 56, 21–38. [Google Scholar] [CrossRef]
- Patel, R.V.; Mistry, B.M.; Shinde, S.K.; Syed, R.; Singh, V.; Shin, H.-S. Therapeutic potential of quercetin as a cardiovascular agent. Eur. J. Med. Chem. 2018, 155, 889–904. [Google Scholar] [CrossRef]
- Elumalai, P.; Lakshmi, S. Role of quercetin benefits in neurodegeneration. In The Benefits of Natural Products for Neurodegenerative Diseases; Springer: Berlin/Heidelberg, Germany, 2016; pp. 229–245. [Google Scholar]
- Khan, H.; Ullah, H.; Aschner, M.; Cheang, W.S.; Akkol, E.K. Neuroprotective effects of quercetin in Alzheimer’s disease. Biomolecules 2020, 10, 59. [Google Scholar] [CrossRef]
- Zhang, X.-W.; Chen, J.-Y.; Ouyang, D.; Lu, J.-H. Quercetin in animal models of Alzheimer’s disease: A systematic review of preclinical studies. Int. J. Mol. Sci. 2020, 21, 493. [Google Scholar] [CrossRef] [PubMed]
- Rauf, A.; Imran, M.; Khan, I.A.; ur-Rehman, M.; Gilani, S.A.; Mehmood, Z.; Mubarak, M.S. Anticancer potential of quercetin: A comprehensive review. Phytother. Res. 2018, 32, 2109–2130. [Google Scholar] [CrossRef]
- David, A.V.A.; Arulmoli, R.; Parasuraman, S. Overviews of biological importance of quercetin: A bioactive flavonoid. Pharmacogn. Rev. 2016, 10, 84. [Google Scholar]
- Shi, G.-J.; Li, Y.; Cao, Q.-H.; Wu, H.-X.; Tang, X.-Y.; Gao, X.-H.; Yu, J.-Q.; Chen, Z.; Yang, Y. In vitro and in vivo evidence that quercetin protects against diabetes and its complications: A systematic review of the literature. Biomed. Pharmacother. 2019, 109, 1085–1099. [Google Scholar] [CrossRef] [PubMed]
- Abian, O.; Ortega-Alarcon, D.; Jimenez-Alesanco, A.; Ceballos-Laita, L.; Vega, S.; Reyburn, H.T.; Rizzuti, B.; Velazquez-Campoy, A. Structural stability of SARS-CoV-2 3CLpro and identification of quercetin as an inhibitor by experimental screening. Int. J. Biol. Macromol. 2020, 164, 1693–1703. [Google Scholar] [CrossRef]
- Liu, X.; Raghuvanshi, R.; Ceylan, F.D.; Bolling, B.W. Quercetin and its metabolites inhibit recombinant human angiotensin-converting enzyme 2 (ACE2) activity. J. Agric. Food Chem. 2020, 68, 13982–13989. [Google Scholar] [CrossRef]
- Aucoin, M.; Cooley, K.; Saunders, P.R.; Cardozo, V.; Remy, D.; Cramer, H.; Abad, C.N.; Hannan, N. The effect of quercetin on the prevention or treatment of COVID-19 and other respiratory tract infections in humans: A rapid review. Adv. Integr. Med. 2020, 7, 247–251. [Google Scholar] [CrossRef]
- Derosa, G.; Maffioli, P.; D’Angelo, A.; Di Pierro, F. A role for quercetin in coronavirus disease 2019 (COVID-19). Phytother. Res. 2021, 35, 1230–1236. [Google Scholar] [CrossRef] [PubMed]
- Colunga Biancatelli, R.M.L.; Berrill, M.; Catravas, J.D.; Marik, P.E. Quercetin and vitamin C: An experimental, synergistic therapy for the prevention and treatment of SARS-CoV-2 related disease (COVID-19). Front. Immunol. 2020, 11, 1451. [Google Scholar] [CrossRef]
- Di Pierro, F.; Derosa, G.; Maffioli, P.; Bertuccioli, A.; Togni, S.; Riva, A.; Allegrini, P.; Khan, A.; Khan, S.; Khan, B.A. Possible therapeutic effects of adjuvant quercetin supplementation against early-stage COVID-19 infection: A prospective, randomized, controlled, and open-label study. Int. J. Gen. Med. 2021, 14, 2359. [Google Scholar] [CrossRef]
- De Bruyn, F.; Van Brempt, M.; Maertens, J.; Van Bellegem, W.; Duchi, D.; De Mey, M. Metabolic engineering of Escherichia coli into a versatile glycosylation platform: Production of bio-active quercetin glycosides. Microb. Cell Factories 2015, 14, 1–12. [Google Scholar] [CrossRef] [PubMed]
- Marín, L.; Gutiérrez-del-Río, I.; Entrialgo-Cadierno, R.; Villar, C.J.; Lombó, F. De novo biosynthesis of myricetin, kaempferol and quercetin in Streptomyces albus and Streptomyces coelicolor. PLoS ONE 2018, 13, e0207278. [Google Scholar] [CrossRef]
- Rodriguez, A.; Strucko, T.; Stahlhut, S.G.; Kristensen, M.; Svenssen, D.K.; Forster, J.; Nielsen, J.; Borodina, I. Metabolic engineering of yeast for fermentative production of flavonoids. Bioresour. Technol. 2017, 245, 1645–1654. [Google Scholar] [CrossRef] [PubMed]
- Xia, T.; Eiteman, M.A. Quercetin glucoside production by engineered Escherichia coli. Appl. Biochem. Biotechnol. 2017, 182, 1358–1370. [Google Scholar] [CrossRef]
- Neveu, V.; Perez-Jiménez, J.; Vos, F.; Crespy, V.; du Chaffaut, L.; Mennen, L.; Knox, C.; Eisner, R.; Cruz, J.; Wishart, D. Phenol-Explorer: An online comprehensive database on polyphenol contents in foods. Database 2010, 2010, bap024. [Google Scholar] [CrossRef] [PubMed]
- Rothwell, J.; Pérez-Jiménez, J.; Neveu, V.; Medina-Ramon, A.; M’Hiri, N.; Garcia Lobato, P.; Manach, C.; Knox, K.; Eisner, R.; Wishart, D. Phenol-Explorer 3.0: A major update of the phenol-explorer database to incorporate data on the effects of food processing on polyphenol content. Database 2013, 2013, bat070. [Google Scholar] [CrossRef]
- Rothwell, J.A.; Urpi-Sarda, M.; Boto-Ordonez, M.; Knox, C.; Llorach, R.; Eisner, R.; Cruz, J.; Neveu, V.; Wishart, D.; Manach, C. Phenol-Explorer 2.0: A major update of the Phenol-Explorer database integrating data on polyphenol metabolism and pharmacokinetics in humans and experimental animals. Database 2012, 2012, bas031. [Google Scholar] [CrossRef] [PubMed]
- Gubser, G.; Vollenweider, S.; Eibl, D.; Eibl, R. Food ingredients and food made with plant cell and tissue cultures: State-of-the art and future trends. Eng. Life Sci. 2021, 21, 87–98. [Google Scholar] [CrossRef] [PubMed]
- Pressi, G.; Bertaiola, O.; Guarnerio, C.; Barbieri, E.; Guzzo, F.; Durand, C.; Peno-Mazzarino, L.; Cocetta, V.; Giacomini, I.; Semenzato, A. In vitro cultured Melissa officinalis cells as effective ingredient to protect skin against oxidative stress, blue light, and infrared irradiations damages. Cosmetics 2021, 8, 23. [Google Scholar] [CrossRef]
- Cisneros-Torres, D.; Cruz-Sosa, F.; González-Cortazar, M.; Martínez-Trujillo, A.; Nicasio-Torres, P. Enhancing the production of scopoletin and quercetin 3-O-β-d-glucoside from cell suspension cultures of Tilia americana var. mexicana by modulating the copper and nitrate concentrations. Plant Cell Tissue Organ Cult. 2019, 139, 305–316. [Google Scholar] [CrossRef]
- Bong, F.J.; Chear, N.J.Y.; Ramanathan, S.; Mohana-Kumaran, N.; Subramaniam, S.; Chew, B.L. The development of callus and cell suspension cultures of Sabah Snake Grass (Clinacanthus nutans) for the production of flavonoids and phenolics. Biocatal. Agric. Biotechnol. 2021, 33, 101977. [Google Scholar] [CrossRef]
- Arya, D.; Patni, V.; Kant, U. In vitro propagation and quercetin quantification in callus cultures of Rasna (Pluchea lanceolata Oliver & Hiern.). Indian J. Biotechnol. 2008, 7, 383–387. [Google Scholar]
- Tan, S.; Radzali, M.; Arbakariya, A.; Mahmood, M. Effect of plant growth regulators on callus, cell suspension and cell line selection for flavonoid production from pegaga (Centella asiatica L. urban). Am. J. Biochem. Biotechnol. 2010, 6, 284–299. [Google Scholar] [CrossRef]
- Yang, X.; Lei, Z.; Yu, Y.; Xiao, L.; Cheng, D.; Zhang, Z. Phytochemical characteristics of callus suspension culture of Helicteres angustifolia L. and its in vitro antioxidant, antidiabetic and immunomodulatory activities. S. Afr. J. Bot. 2019, 121, 178–185. [Google Scholar] [CrossRef]
- El-Ashry, A.A.E.-L.; Gabr, A.M.M.; Arafa, N.M.; El-Bahr, M.K. Rutin accumulation in gardenia calli cultures as a response to phenyl alanine and salicylic acid. Bull. Natl. Res. Cent. 2019, 43, 1–14. [Google Scholar] [CrossRef]
- Thiruvengadam, M.; Rekha, K.; Rajakumar, G.; Lee, T.-J.; Kim, S.-H.; Chung, I.-M. Enhanced production of anthraquinones and phenolic compounds and biological activities in the cell suspension cultures of Polygonum multiflorum. Int. J. Mol. Sci. 2016, 17, 1912. [Google Scholar] [CrossRef]
- Sajjalaguddam, R.R.; Paladugu, A. Phenylalanine enhances Quercetin content in in vitro cultures of Abutilon indicum L. J. Appl. Pharm. Sci. 2015, 5, 080–084. [Google Scholar] [CrossRef]
- Iqbal, M.S.; Iqbal, Z.; Ansari, M.I. Enhancement of total antioxidants and flavonoid (quercetin) by methyl jasmonate elicitation in tissue cultures of onion (Allium cepa L.). Acta Agrobot. 2019, 72, 1784. [Google Scholar] [CrossRef]
- Karuppaiya, P.; Tsay, H.S. Enhanced production of podophyllotoxin, kaempferol, and quercetin from callus culture of Dysosma pleiantha (Hance) Woodson: An endangered medicinal plant. Biotechnol. Appl. Biochem. 2020, 67, 95–104. [Google Scholar] [CrossRef]
- Meena, M.C.; Meena, R.K.; Patni, V. Effect of elicitor on quercetin production in cell cultures of Citrullus colocynthis (Linn.). Schrad. Pharma. Innov. 2014, 3, 18. [Google Scholar]
- Madanakumar, A.J.; Murukan, G.; Lawarence, B.; Kumaraswamy, M. Isolation, purification of quercetin from in vitro cell suspension culture of Caesalpinia pulcherrima and its analysis by HPLC-DAD and NMR. Pharmacogn. J. 2017, 9, s44–s51. [Google Scholar] [CrossRef]
- Goda, S.; Ahmed, S.; El Sherif, F.; Hassanean, H.; Ibrahim, A. Genetically stable plants with boosted flavonoids content after in vitro regeneration of the endangered Capparis spinosa L. Glob. Drugs Ther. 2017, 2, 1–7. [Google Scholar]
- Commisso, M.; Negri, S.; Bianconi, M.; Gambini, S.; Avesani, S.; Ceoldo, S.; Avesani, L.; Guzzo, F. Untargeted and targeted metabolomics and tryptophan decarboxylase in vivo characterization provide novel insight on the development of kiwi fruits (Actinidia deliciosa). Int. J. Mol. Sci. 2019, 20, 897. [Google Scholar] [CrossRef]
- Commisso, M.; Bianconi, M.; Di Carlo, F.; Poletti, S.; Bulgarini, A.; Munari, F.; Negri, S.; Stocchero, M.; Ceoldo, S.; Avesani, L. Multi-approach metabolomics analysis and artificial simplified phytocomplexes reveal cultivar-dependent synergy between polyphenols and ascorbic acid in fruits of the sweet cherry (Prunus avium L.). PLoS ONE 2017, 12, e0180889. [Google Scholar]


| Rt (min) | λ Max (nm) | m/z (-) Detected | m/z (-) Expected | Elemental Formula | Putative Identification | ms/ms Fragments |
|---|---|---|---|---|---|---|
| 4.64 | 284.53; 355 | 463.088 | 463.088 | C21H20O12 | Quercetin-O-hexoside | 301.034 |
| 4.64 | 284.53; 355 | 465.103 | 465.103 | C21H22O12 | Dihydroquercetin-O-hexoside (taxifolin-O-hexoside) | 285.036; 303.050 |
| 4.73 | 249.53; 355.53 | 625.140 | 625.140 | C27H30O17 | Quercetin-O-dihexoside | 301.034 |
| 4.74 | 253.53; 354.53 | 771, 1976 | 771.198 | C33H40O21 | Quercetin-O-hexoside desoxyhexoside O-hexoside | 299.019; 301.034; 463.086; 609.145; 625.140; |
| 4.74 | 253.53; 354.53 | 817.204 | 817.204 | C33H40O21+ HCOOH | Quercetin-O-hexoside-desoxyhexoside O-hexoside, formic adduct | 301.034; 463.086; 609.145; 625.140; |
| 4.83 | 278.066 | 278.066 | C13H13NO6 | Coumaric acid-aspartic acid | 163.038 (coumaric acid); | |
| 5.06 | 278.066 | 278.066 | C13H13NO6 | (Coumaric acid-aspartic acid) | - | |
| 5.13 | 249.53; 355.53 | 609.143 | 609.146 | C27H30O16 | Quercetin-O-hexoside-O-desoxyhexoside | 299.019; 301.034; 463.084 |
| 5.13 | 249.53; 355.53 | 577.134 | 577.134 | C30H25O12 | Procyanidin dimer P2-type | 289.070 |
| 5.21 | 284.532; 355.53 | 449.109 | 449.108 | C21H22O11 | Dihydrokaempferol-O-hexoside | 287.055; 301.071 |
| 5.21 | 249.53; 355.53 | 639.156 | 639.156 | C28H32O17 | Methyl quercetin-O-dihexoside (isorhamnetin-O-dihexoside) | 315.0504; 463.087 |
| 5.45 | 289.071 | 289.071 | C15H14O6 | Epicatechin * | - | |
| 5.55 | 461.165 | Ui | - | |||
| 5.62 | 249.53; 355.53 | 771.974 | 771.198 | C33H40O21 | Quercetin-O-hexoside-O-hexoside-desoxyhexoside | 301.034; 463.086; 609.454 |
| 5.712 | 249.53; 355 | 625.140 | 625.140 | C27H30O17 | Quercetin-O-dihexoside | 299.019; 300.026; 301.034; 463.086 |
| 6.29 | 249.53; 354.53 | 609.147 | 609.146 | C27H30O16 | Quercetin-O-hexoside desoxyhexoside | 300.026; 301.033 |
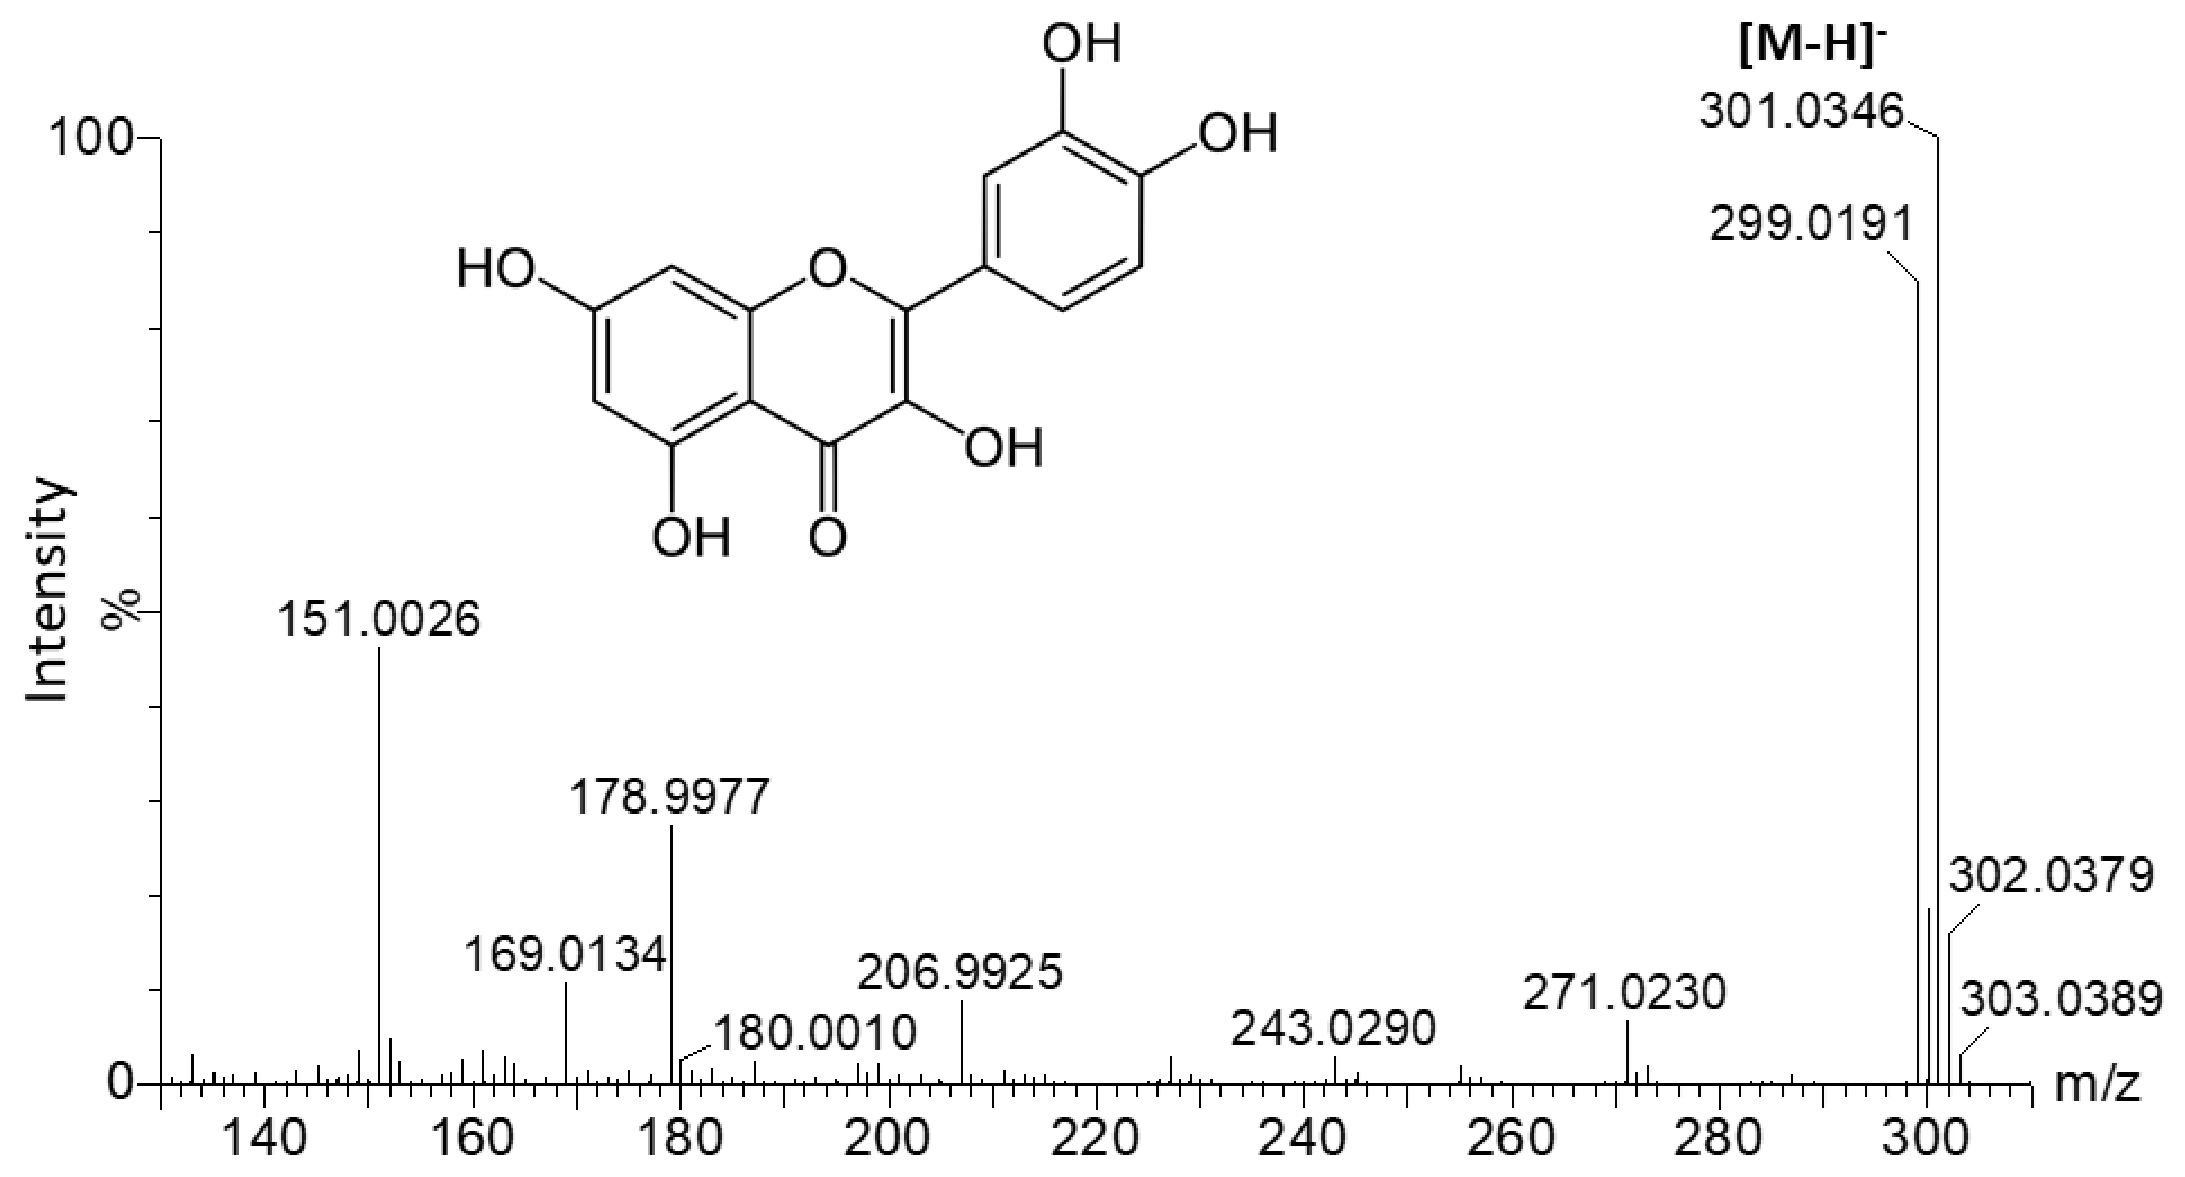
| 6.35 | 253.53; 355.53 | 609.147 | 609.146 | C27H30O16 | Quercetin-3-O-rutinoside * | 151.003; 178.997; 299.019; 300.027; 301.033; 609.145 |
| 6.51 | 249.53; 355 | 463.088 | 463.088 | C21H20O12 | Quercetin-O-hexoside | 300.026; 301.033 |
| 6.57 | 254.53; 355.53 | 463.088 | 463.088 | C21H20O12 | Quercetin-3-O-glucoside * | 151.003; 178.997; 299.019; 300.027; 301.033 |
| 6.82 | 248.53; 355.53 | 593.151 | 593.150 | C27H30O15 | Quercetin-O-di desoxyhexoside | 285.038, 301.032 |
| 6.93 | 249.53; 355 | 623.160 | 623.161 | C28H32O16 | Methyl quercetin-O-hexoside desoxyhexoside | 299.019; 315.049 |
| 7.09 | 249.53; 355.53 | 447.092 | 447.092 | C21H20O11 | Kaempferol-O-hexoside | 255.029; 284.031; 285.038 |
| 7.15 | 253.53; 355.53 | 447.093 | 447.092 | C21H20O11 | Quercetin-O-desoxyhexoside | 151.003; 178.997; 299.019; 300.026; 301.033 |
| 7.19 | 249.53; 330.53; 355 | 477.103 | 477.066 | C21H18O13 | Quercetin-O-glucuronide | 300.026; 301.033; 314.042; 315.047 |
| 7.19 | 249.53; 330.53; 355 | 709.380 | Ui | 300.026; 301.033; 314.042; 315.047 | ||
| 7.32 | 327.35? | 515.072 | Ui | 160.956; 162.950 | ||
| 7.38 | 249.53; 355 | 433.113 | 433.113 | C20H18O11 | Trihydroxyflavanone-O-hexoside (naringenin) | 271.060; 301.034 |
| 7.38 | 249.53; 355 | 463.088 | Quercetin-O-hexoside | 151.003; 178.997; 301.034 | ||
| 7.38 | 249.53; 355 | 415.073 | Ui | 271.060; 301.034 | ||
| 7.67 | 663,373; 709,379 | Ui | 160.956; 162.950; 439.320; | |||
| 8.14 | 663,373; 709,379 | Ui | 160.956; 162.950; 439.320; | |||
| 8.24 | 711.395 | 711.408 | C34H65O13P | Phosphatidylinositol (25,0) | 503.366 | |
| 8.28 | 711.395 | 711.408 | C34H65O13P | Phosphatidylinositol (25, 0) | 503.367 |
| mg/100 g FW | mg/100 g DW | |||||
|---|---|---|---|---|---|---|
| Metabolite | Ad-2 | Ad-3 | Ad-4 | Ad-2 | Ad-3 | Ad-4 |
| Quercetin-3-O-rutinoside | 3.11 ± 0.15 | 4.87 ± 0.23 | 2.67 ± 0.14 | 94.48 ± 4.88 | 140.54 ± 6.50 | 76.01 ± 4.12 |
| Quercetin-3-O-glucoside | 5.75 ± 0.21 | 0.81 ± 0.01 | 0.69 ± 0.09 | 181.99 ± 6.52 | 23.58 ± 0.31 | 19.77 ± 2.46 |
| Other quercetin derivatives | 4.40 ± 0.18 | 4.20 ± 0.13 | 1.78 ± 0.87 | 139.29 ± 5.72 | 121.14 ± 3.62 | 50.60 ± 24.93 |
| Total quercetin derivatives | 13.26 ± 0.23 | 9.90 ± 0.36 | 5.14 ± 0.64 | 419.76 ± 7.37 | 285.26 ± 10.44 | 146.38 ± 18.35 |
| P[1] | pq(corr)[1] | Correlating Metabolites |
|---|---|---|
| 0.12 | 0.999 | Epicatechin |
| 0.11 | 1.000 | Quercetin-3-O-rutinoside |
| 0.11 | 1.000 | Ui. |
| 0.11 | 1.000 | Procyanidin P2 type |
| 0.49 | 1.000 | Quercetin-O-hexoside |
| 0.30 | 0.999 | Quercetin-O-desoxyhexoside |
| 0.13 | 0.999 | Ui. |
| 0.15 | 0.999 | Quercetin-O-glucuronide |
| 0.21 | 0.979 | Taxifolin-O-hexoside |
| Ingredients | Medium A | Medium B | Medium C |
|---|---|---|---|
| salts | MS | MS | MS |
| sucrose | 25 g/L | 25 g/L | 25 g/L |
| 2.4 D | 1 mg/L | - | - |
| 6-BAP | 0.5 mg/L | 0.5 mg/L | 0.25 mg/L |
| IBA | - | 1 mg/L | 0.5 mg/L |
| agar | 0.7% | 0.7% | 0.7% |
| pH | 5.8 | 5.8 | 5.8 |
Publisher’s Note: MDPI stays neutral with regard to jurisdictional claims in published maps and institutional affiliations. |
© 2021 by the authors. Licensee MDPI, Basel, Switzerland. This article is an open access article distributed under the terms and conditions of the Creative Commons Attribution (CC BY) license (https://creativecommons.org/licenses/by/4.0/).
Share and Cite
Negri, S.; Gambini, S.; Ceoldo, S.; Avesani, L.; Commisso, M.; Guzzo, F. Undifferentiated In Vitro Cultured Actinidia deliciosa as Cell Factory for the Production of Quercetin Glycosides. Plants 2021, 10, 2499. https://doi.org/10.3390/plants10112499
Negri S, Gambini S, Ceoldo S, Avesani L, Commisso M, Guzzo F. Undifferentiated In Vitro Cultured Actinidia deliciosa as Cell Factory for the Production of Quercetin Glycosides. Plants. 2021; 10(11):2499. https://doi.org/10.3390/plants10112499
Chicago/Turabian StyleNegri, Stefano, Sofia Gambini, Stefania Ceoldo, Linda Avesani, Mauro Commisso, and Flavia Guzzo. 2021. "Undifferentiated In Vitro Cultured Actinidia deliciosa as Cell Factory for the Production of Quercetin Glycosides" Plants 10, no. 11: 2499. https://doi.org/10.3390/plants10112499
APA StyleNegri, S., Gambini, S., Ceoldo, S., Avesani, L., Commisso, M., & Guzzo, F. (2021). Undifferentiated In Vitro Cultured Actinidia deliciosa as Cell Factory for the Production of Quercetin Glycosides. Plants, 10(11), 2499. https://doi.org/10.3390/plants10112499