
Comparative Investigation of Combined Metabolomics-Flavoromics during the Ripening of Mango (Mangifera indica L.) cv. ‘Nam Dok Mai Si Thong’ and ‘Nam Dok Mai No. 4’


Abstract
:1. Introduction
2. Results and Discussion
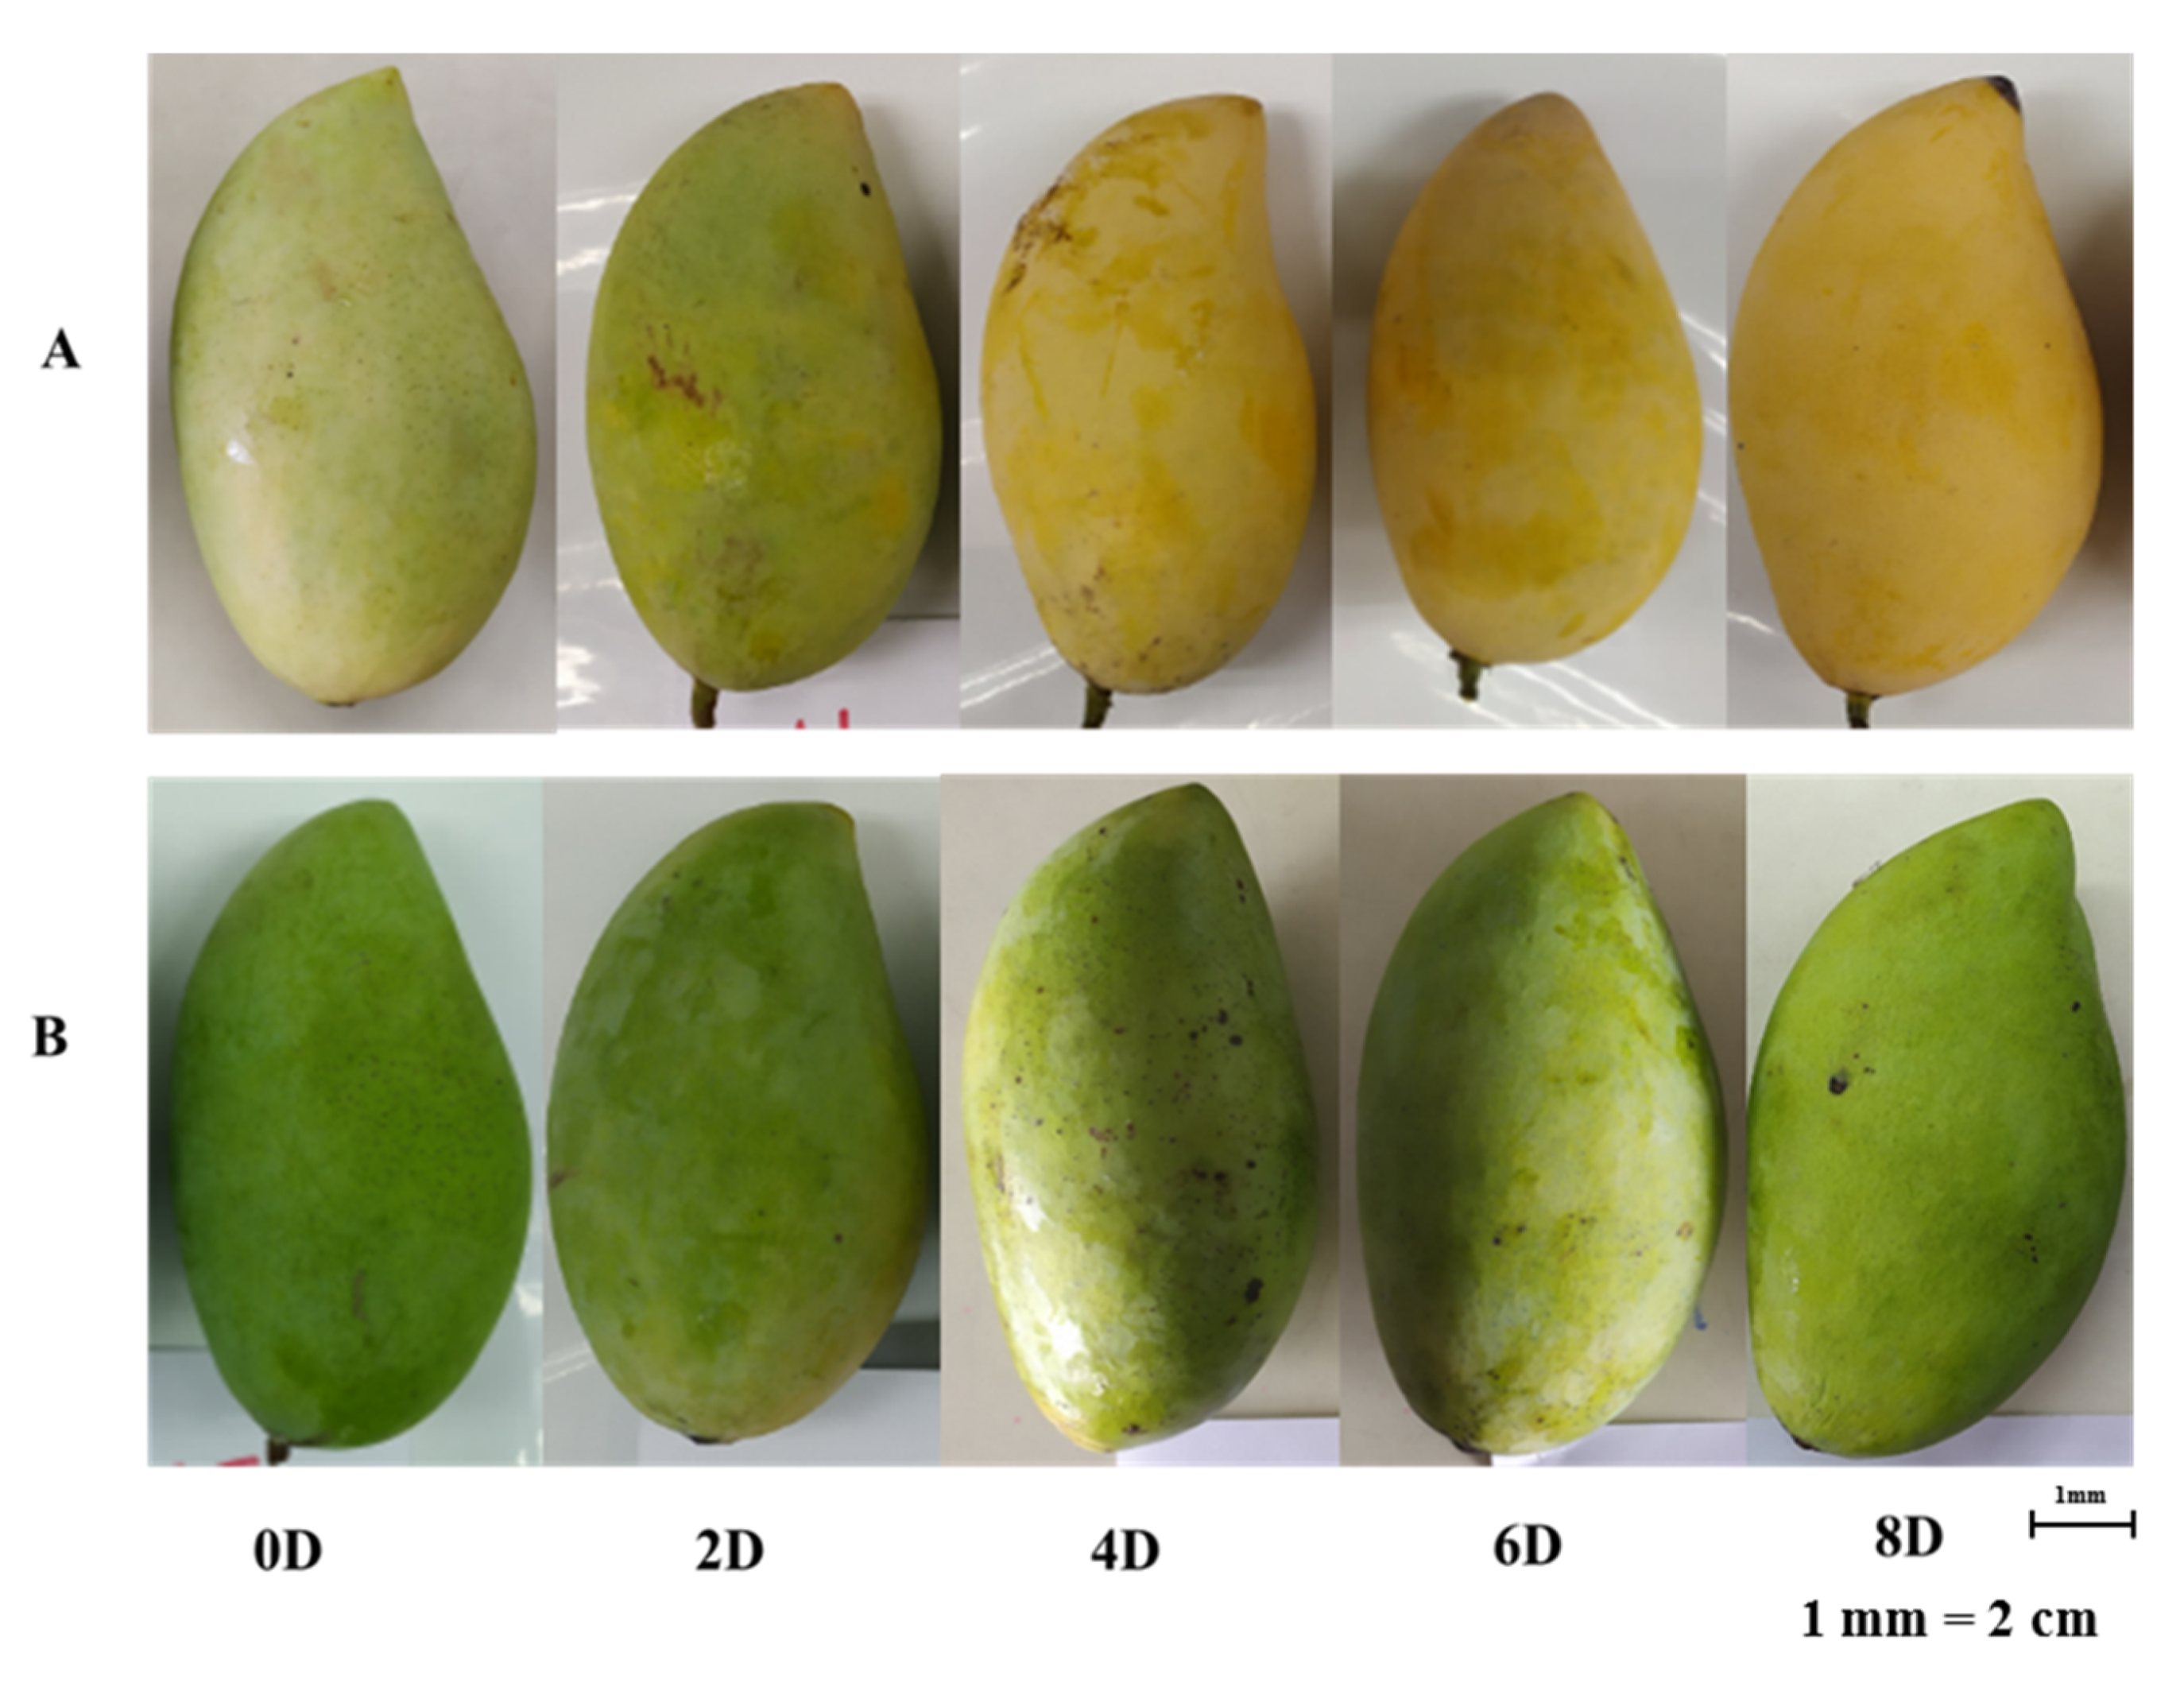
2.1. Ripening Appearance of ‘Nam Dok Mai’ Cultivars
2.2. Metabolite and Volatile Flavor Content of Ripening ‘Nam Dok Mai’ Mango Cultivars
2.2.1. Lipid Fractions
2.2.2. Polar Fractions
2.2.3. Volatile Organic Compounds (VOCs)
2.3. PCA
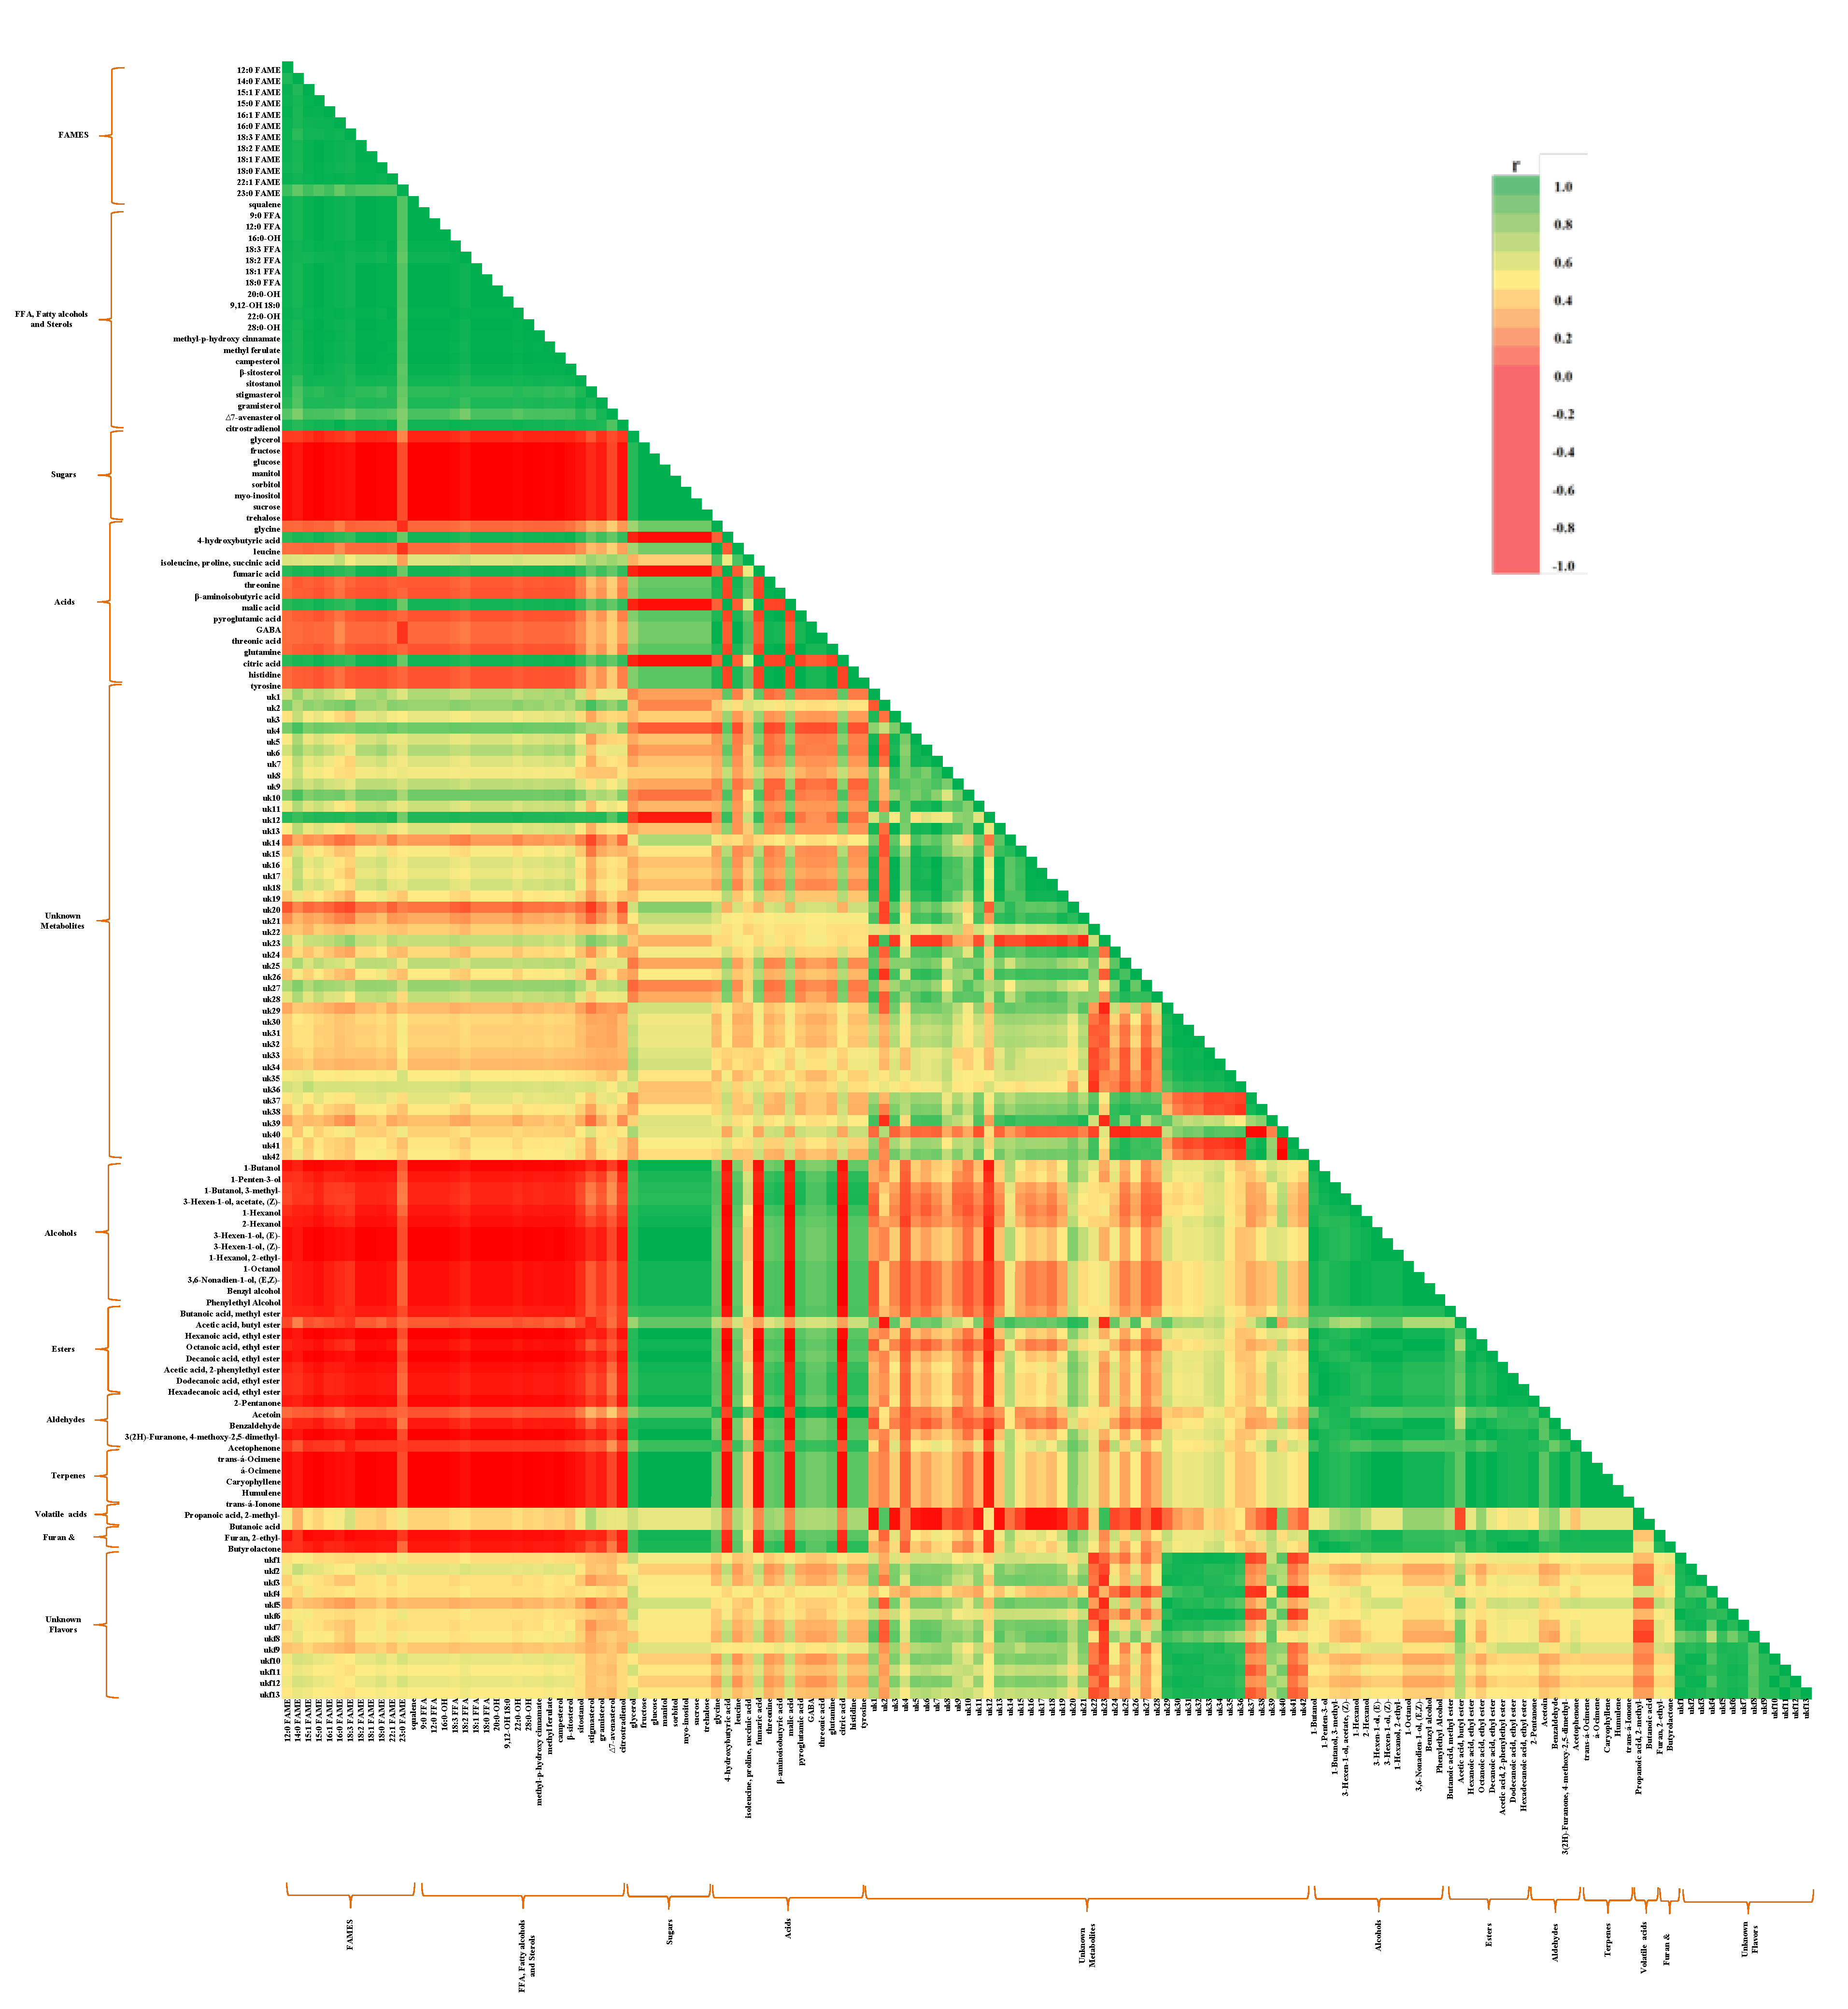
2.4. Correlation Analysis
3. Materials and Methods
3.1. Chemicals and Reagents
3.2. Fruit Selection and Ripening Condition
3.3. Sample Preparation
3.4. Metabolomics
3.4.1. Sample Extraction and Phase Separation
3.4.2. GC-FID Analysis
3.5. Flavoromics
3.5.1. Sample Extraction
3.5.2. GC-ToF-MS Analysis
3.6. Statistical Analysis
4. Conclusions
Author Contributions
Funding
Institutional Review Board Statement
Informed Consent Statement
Data Availability Statement
Acknowledgments
Conflicts of Interest
References
- FAO. Food and Agriculture Organization of the United Nations; FAO Statistics: Rome, Italy, 2013; Available online: http//faostat.fao.org/ (accessed on 24 June 2016).
- Dar, M.S.; Oak, P.; Chidley, H.; Deshpande, A.; Giri, A.; Gupta, V. Nutrient and Flavor Content of Mango (Mangifera Indica L.) Cultivars: An Appurtenance to the List of Staple Foods. In Nutritional Composition of Fruit Cultivars; Academic press: London, UK; Elsevier: Amsterdam, The Netherlands, 2016; pp. 445–467. [Google Scholar]
- Rimkeeree, K.; Charoenrein, S. Effect of Cultivar and Ripening Stage on Quality and Microstructure of Frozen Mangoes (Mangifera indica Linn). Int. J. Food Prop. 2014, 17, 1093–1108. [Google Scholar] [CrossRef]
- Chanasut, U.; Jindaluang, J.; Techakaew, S.; Kumpoun, W. Cell Death Due to Chilling Injury of Mango Cultivars′ Nam Dok Mai No. 4′,′Nam Dok Mai Si Thong’and’Mahachanok’during Low Temperature Storage. In VIII International Postharvest Symposium: Enhancing Supply Chain and Consumer Benefits-Ethical and Technological Issues 1194; International Society for Horticultural Science: Leuven, Belgium, 2016; pp. 405–410. [Google Scholar]
- Pandit, S.S.; Mitra, S.; Giri, A.P.; Pujari, K.H.; Patil, B.P.; Jambhale, N.D.; Gupta, V.S. Genetic diversity analysis of mango cultivars using inter simple sequence repeat markers. Curr. Sci. 2007, 93, 1135–1141. [Google Scholar]
- Karihaloo, J.L.; Dwivedi, Y.K.; Archak, S.; Gaikwad, A.B. Analysis of genetic diversity of Indian mango cultivars using RAPD markers. J. Hortic. Sci. Biotechnol. 2003, 78, 285–289. [Google Scholar] [CrossRef]
- Pandit, S.S.; Chidley, H.G.; Kulkarni, R.S.; Pujari, K.H.; Giri, A.P.; Gupta, V.S. Cultivar relationships in mango based on fruit volatile profiles. Food Chem. 2009, 114, 363–372. [Google Scholar] [CrossRef]
- Chin, C.F.; Teoh, E.Y.; Chee, M.J.Y.; Al-Obaidi, J.R.; Rahmad, N.; Lawson, T. Comparative proteomic analysis on fruit ripening processes in two varieties of tropical mango (Mangifera indica). Protein J. 2019, 38, 704–715. [Google Scholar] [CrossRef] [PubMed]
- Prasanna, V.; Prabha, T.; Tharanathan, R. Fruit ripening phenomena–An overview. J. Crit. Rev. Food Sci. 2007, 47, 1–19. [Google Scholar] [CrossRef]
- Pacchiarotta, T.; Nevedomskaya, E.; Carrasco-Pancorbo, A.; Deelder, A.M.; Mayboroda, O.A. Evaluation of GC-APCI/MS and GC-FID as a complementary platform. J. Biomol. Tech. JBT 2010, 21, 205. [Google Scholar]
- Jumhawan, U.; Putri, S.P.; Yusianto; Bamba, T.; Fukusaki, E. Application of gas chromatography/flame ionization detector-based metabolite fingerprinting for authentication of Asian palm civet coffee (Kopi Luwak). J. Biosci. Bioeng 2015, 120, 555–561. [Google Scholar] [CrossRef]
- Hübschmann, H.-J. Handbook of GC-MS: Fundamentals and Applications; John Wiley & Sons: Hoboken, NJ, USA, 2015. [Google Scholar]
- Shiga, K.; Yamamoto, S.; Nakajima, A.; Kodama, Y.; Imamura, M.; Sato, T.; Uchida, R.; Obata, A.; Bamba, T.; Fukusaki, E. Metabolic Profiling Approach To Explore Compounds Related to the Umami Intensity of Soy Sauce. J. Agric. Food Chem. 2014, 62, 7317–7322. [Google Scholar] [CrossRef]
- Taguchi, K.; Fukusaki, E.; Bamba, T. Simultaneous analysis for water- and fat-soluble vitamins by a novel single chromatography technique unifying supercritical fluid chromatography and liquid chromatography. J. Chromatogr. A 2014, 1362, 270–277. [Google Scholar] [CrossRef] [Green Version]
- Jumhawan, U.; Putri, S.P.; Yusianto; Marwani, E.; Bamba, T.; Fukusaki, E. Selection of Discriminant Markers for Authentication of Asian Palm Civet Coffee (Kopi Luwak): A Metabolomics Approach. J. Agric. Food Chem. 2013, 61, 7994–8001. [Google Scholar] [CrossRef] [PubMed]
- Miklaszewska, M.; Banaś, A.; Królicka, A. Metabolic engineering of fatty alcohol production in transgenic hairy roots of Crambe abyssinica. J. Biotechnol. Bioeng. 2017, 114, 1275–1282. [Google Scholar] [CrossRef] [PubMed]
- Rowland, O.; Domergue, F. Plant fatty acyl reductases: Enzymes generating fatty alcohols for protective layers with potential for industrial applications. J. Plant Sci. 2012, 193, 28–38. [Google Scholar] [CrossRef] [PubMed]
- Reineccius, G. Flavor Chemistry and Technology; CRC Press: Boca Raton, FL, USA, 2005. [Google Scholar]
- Song, J.; Bangerth, F. Fatty acids as precursors for aroma volatile biosynthesis in pre-climacteric and climacteric apple fruit. J. Postharvest Biol. Technol. 2003, 30, 113–121. [Google Scholar] [CrossRef]
- Sweetman, C.; Deluc, L.G.; Cramer, G.R.; Ford, C.M.; Soole, K.L. Regulation of malate metabolism in grape berry and other developing fruits. Phytochemistry 2009, 70, 1329–1344. [Google Scholar] [CrossRef]
- Bernardes-Silva, A.P.F.; Lajolo, F.M.; Cordenunsi, B.R. Evolução dos teores de amido e açúcares solúveis durante o desenvolvimento e amadurecimento de diferentes cultivares de manga. J. Food Sci.Technol. 2003, 23, 116–120. [Google Scholar] [CrossRef] [Green Version]
- Batista-Silva, W.; Nascimento, V.L.; Medeiros, D.B.; Nunes-Nesi, A.; Ribeiro, D.M.; Zsögön, A.; Araújo, W.L. Modifications in Organic Acid Profiles During Fruit Development and Ripening: Correlation or Causation? J. Front. Plant Sci. 2018, 9, 1689. [Google Scholar] [CrossRef]
- Saha, P.; Singh, J.P.; Sourav, S.; Humayun, A. Optimization of citric acid and malic acid to enhance flavour and shelf life of mango juice. J. Chem. Pharm. Res. 2013, 5, 90–95. [Google Scholar]
- Durrani, Y.; Zeb, A.; Ayub, M.; Ullah, W.; Muhammad, A. Sensory evaluation of mango (Chaunsa) pulp preserved with addition of selected chemical preservatives and antioxidant during storage. Sarhad J. Agric. 2011, 27, 471–475. [Google Scholar]
- Génard, M.; Lescourret, F.; Gomez, L.; Li, S.-H. Influence of assimilate and water supply on seasonal variation of acids in peach (cv Suncrest). J. Sci. Food Agric. 2002, 82, 1829–1836. [Google Scholar]
- Thakur, A.; Singh, Z. Responses of ‘Spring Bright’and ‘Summer Bright’nectarines to deficit irrigation: Fruit growth and concentration of sugars and organic acids. J. Sci. Hortic. 2012, 135, 112–119. [Google Scholar] [CrossRef]
- Spironello, A.; Quaggio, J.A.; Teixeira, L.A.J.; Furlani, P.R.; Sigrist, J.M.M. Pineapple yield and fruit quality effected by NPK fertilization in a tropical soil. Rev. Bras. Frutic. 2004, 26, 155–159. [Google Scholar] [CrossRef] [Green Version]
- Kumar, A.R.; Kumar, N. Sulfate of potash foliar spray effects on yield, quality, and post-harvest life of banana. J. Better Crop. 2007, 91, 22–24. [Google Scholar]
- Léchaudel, M.; Joas, J.; Caro, Y.; Génard, M.; Jannoyer, M. Leaf:fruit ratio and irrigation supply affect seasonal changes in minerals, organic acids and sugars of mango fruit. J. Sci. Food Agric. 2004, 85, 251–260. [Google Scholar] [CrossRef]
- Wang, S.Y.; Camp, M.J. Temperatures after bloom affect plant growth and fruit quality of strawberry. J. Sci. Hortic. 2000, 85, 183–199. [Google Scholar] [CrossRef]
- Gautier, H.; Rocci, A.; Buret, M.; Grasselly, D.; Causse, M. Fruit load or fruit position alters response to temperature and subsequently cherry tomato quality. J. Sci. Food Agric. 2005, 85, 1009–1016. [Google Scholar] [CrossRef]
- Burdon, J.; Lallu, N.; Yearsley, C.; Osman, S.; Billing, D.; Boldingh, H. Postharvest conditioning of Satsuma mandarins for reduction of acidity and skin puffiness. J. Postharvest Biol. Technol. 2007, 43, 102–114. [Google Scholar] [CrossRef]
- Hui, Y.H.; Chen, F.; Nollet, L.M.; Guiné, R.P.; Martín-Belloso, O.; Mínguez-Mosquera, M.I.; Paliyath, G.; Pessoa, F.L. Handbook of Fruit and Vegetable Flavors; Wiley Online Library: Hoboken, NJ, USA, 2010; Volume 64. [Google Scholar]
- Li, L.; Ma, X.W.; Zhan, R.L.; Wu, H.X.; Yao, Q.S.; Xu, W.T.; Luo, C.; Zhou, Y.G.; Liang, Q.Z.; Wang, S.B. Profiling of volatile fragrant components in a mini-core collection of mango germplasms from seven countries. PLoS ONE 2017, 12, e0187487. [Google Scholar] [CrossRef] [PubMed]
- Jiang, Y.; Song, J. Fruits and Fruit Flavor: Classification and Biological Characterization. In Handbook of Fruit and Vegetable Flavors; John Wiley & Sons: Hoboken, NJ, USA, 2010; pp. 1–23. [Google Scholar]
- Brückner, B.; Wyllie, S.G. Fruit and Vegetable Flavour: Recent Advances and Future Prospects; Woodhead Publishing: Sawston, UK; Elsevier: Philadelphia, PA, USA, 2008. [Google Scholar]
- Jolliffe, I.T.; Cadima, J. Principal component analysis: A review and recent developments. J. Philos. Trans. R. Soc. A Math. Phys. Eng.Sci. 2016, 374, 20150202. [Google Scholar] [CrossRef] [PubMed]
- Wattanakul, N.; Morakul, S.; Lorjaroenphon, Y.; Na Jom, K. Integrative metabolomics-flavoromics to monitor dynamic changes of ′Nam Dok Mai′ mango (Mangifera indica Linn) wine during fermentation and storage. J. Food Biosci. 2020, 35, 100549. [Google Scholar] [CrossRef]
- Sriwimon, W.; Boonsupthip, W. Utilization of partially ripe mangoes for freezing preservation by impregnation of mango juice and sugars. J. LWT-Food Sci.Technol. 2011, 44, 375–383. [Google Scholar] [CrossRef]
- Na Jom, K.; Chanput, W.; Ngampongsai, S. Effect of genetic and climatic variability on the metabolic profiles of black gram (Vigna mungo L.) seeds and sprouts. J. Sci. Food Agric. 2015, 95, 1662–1669. [Google Scholar] [CrossRef] [PubMed]
- Charve, J.; Chen, C.; Hegeman, A.D.; A Reineccius, G. Evaluation of instrumental methods for the untargeted analysis of chemical stimuli of orange juice flavour. J. Flavour Fragr. 2011, 26, 429–440. [Google Scholar] [CrossRef]

 ); STR, rainy season ‘Nam Dok Mai Si Thong’ (
  ); NFD, dry season ‘Nam Dok Mai No. 4’ (
  ); NFR, rainy season ‘Nam Dok Mai No. 4’ (
  ).
); STR, rainy season ‘Nam Dok Mai Si Thong’ ( ); NFD, dry season ‘Nam Dok Mai No. 4’ ( ); NFR, rainy season ‘Nam Dok Mai No. 4’ ( ).
).
); STR, rainy season ‘Nam Dok Mai Si Thong’ ( ); NFD, dry season ‘Nam Dok Mai No. 4’ ( ); NFR, rainy season ‘Nam Dok Mai No. 4’ ( ).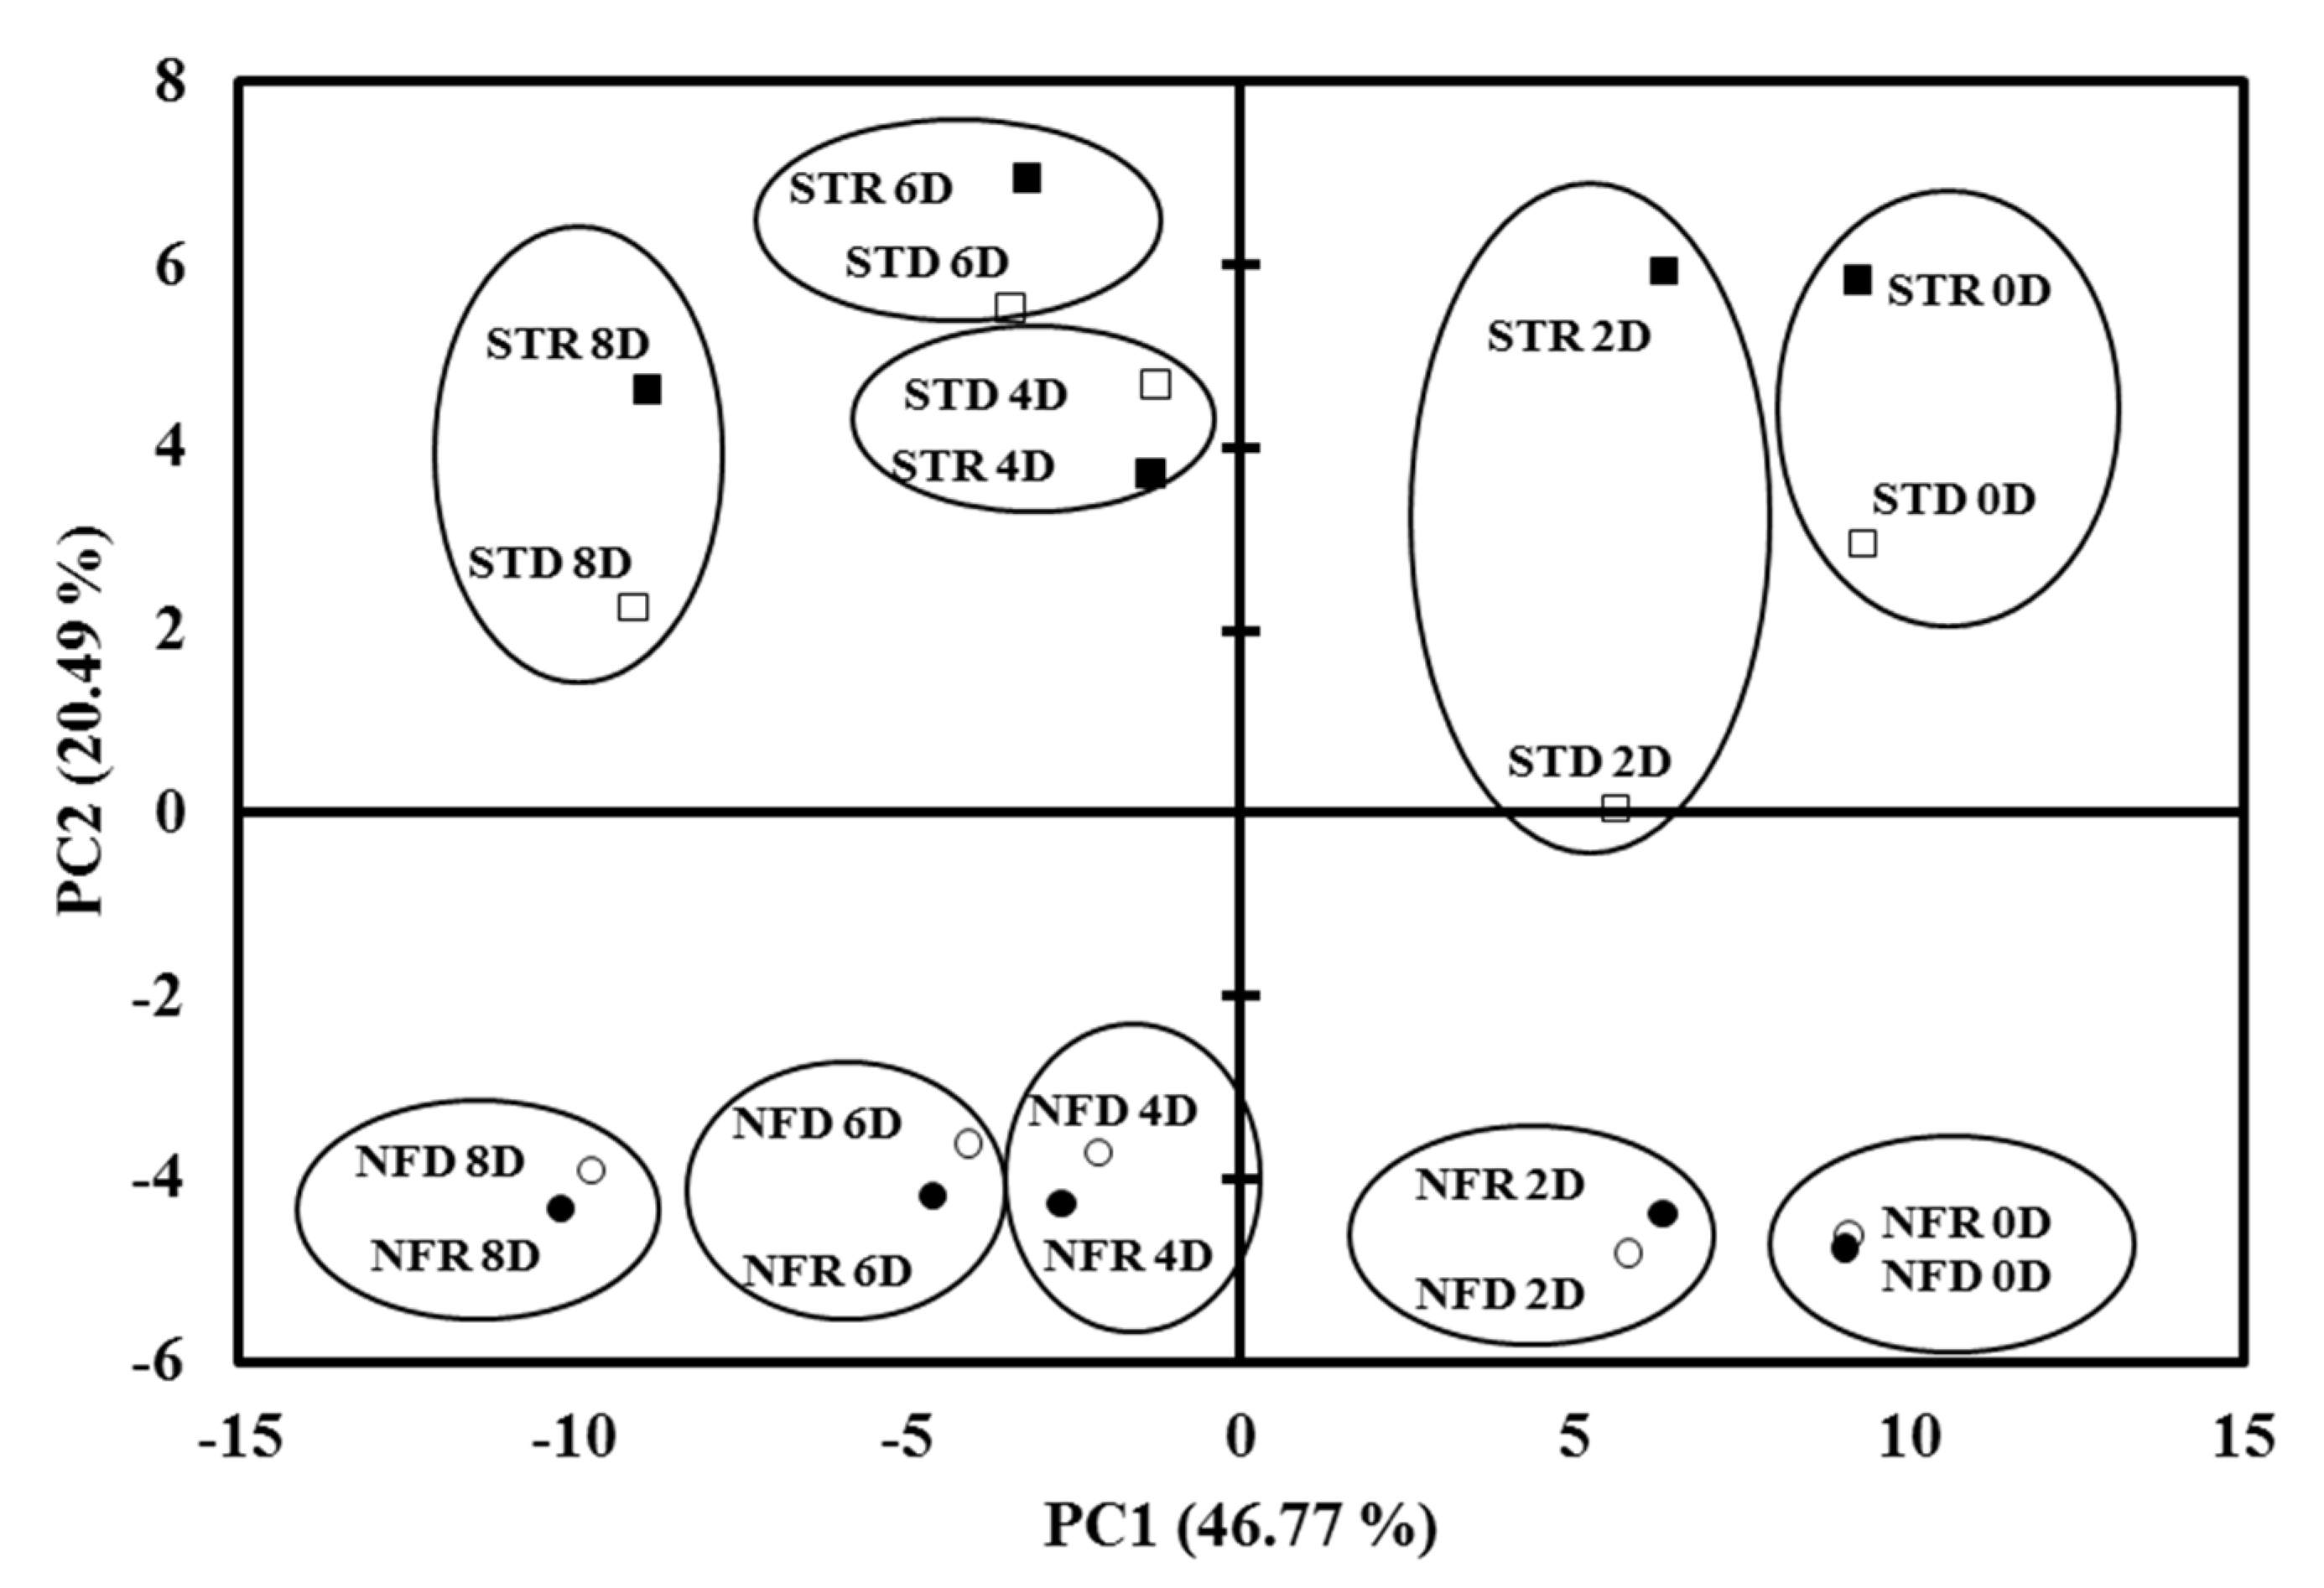
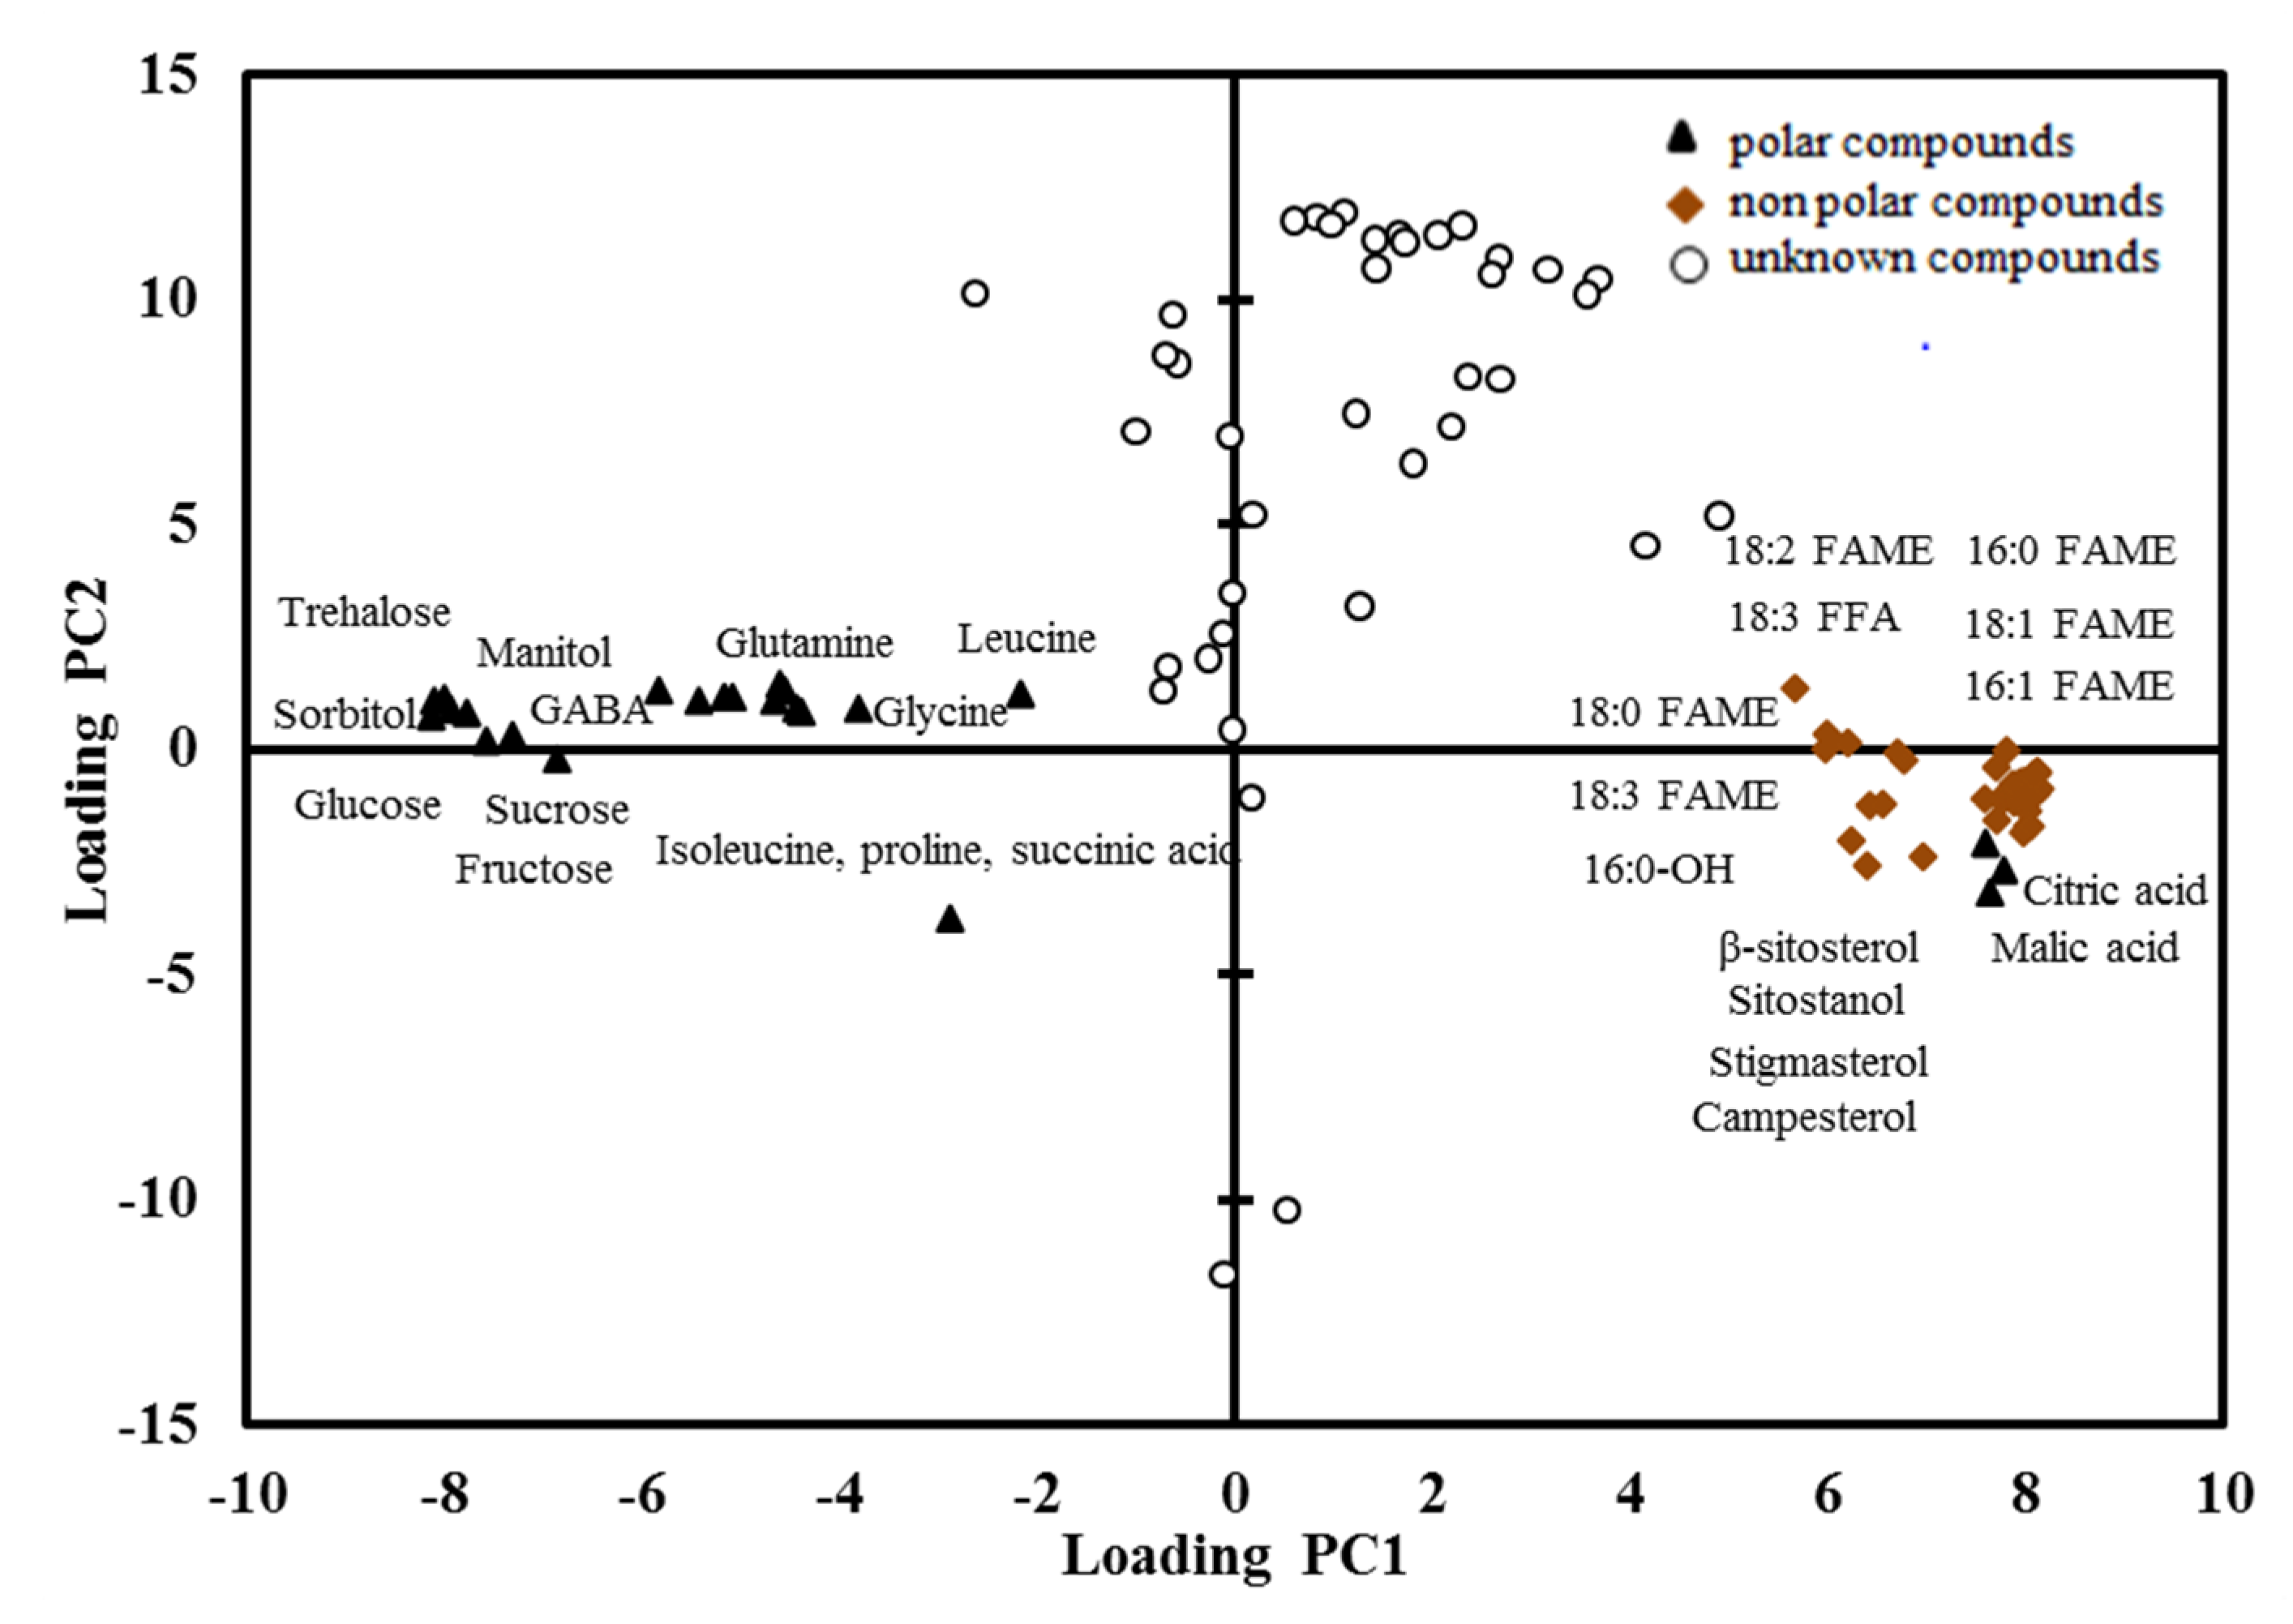
 ); non-polar compounds (
  ); unknown compounds ( ). FAME, fatty acid methyl ester; FFA, free fatty acid; GABA, gamma aminobutyric acid.
); non-polar compounds ( ); unknown compounds ( ). FAME, fatty acid methyl ester; FFA, free fatty acid; GABA, gamma aminobutyric acid.
); unknown compounds ( ). FAME, fatty acid methyl ester; FFA, free fatty acid; GABA, gamma aminobutyric acid.
); non-polar compounds ( ); unknown compounds ( ). FAME, fatty acid methyl ester; FFA, free fatty acid; GABA, gamma aminobutyric acid. ); STR, rainy season ‘Nam Dok Mai Si Thong’ ( ); NFD, dry season ‘Nam Dok Mai No. 4’ ( ); NFR, rainy season ‘Nam Dok Mai No. 4’ ( ).
); STR, rainy season ‘Nam Dok Mai Si Thong’ ( ); NFD, dry season ‘Nam Dok Mai No. 4’ ( ); NFR, rainy season ‘Nam Dok Mai No. 4’ ( ).
); STR, rainy season ‘Nam Dok Mai Si Thong’ ( ); NFD, dry season ‘Nam Dok Mai No. 4’ ( ); NFR, rainy season ‘Nam Dok Mai No. 4’ ( ).
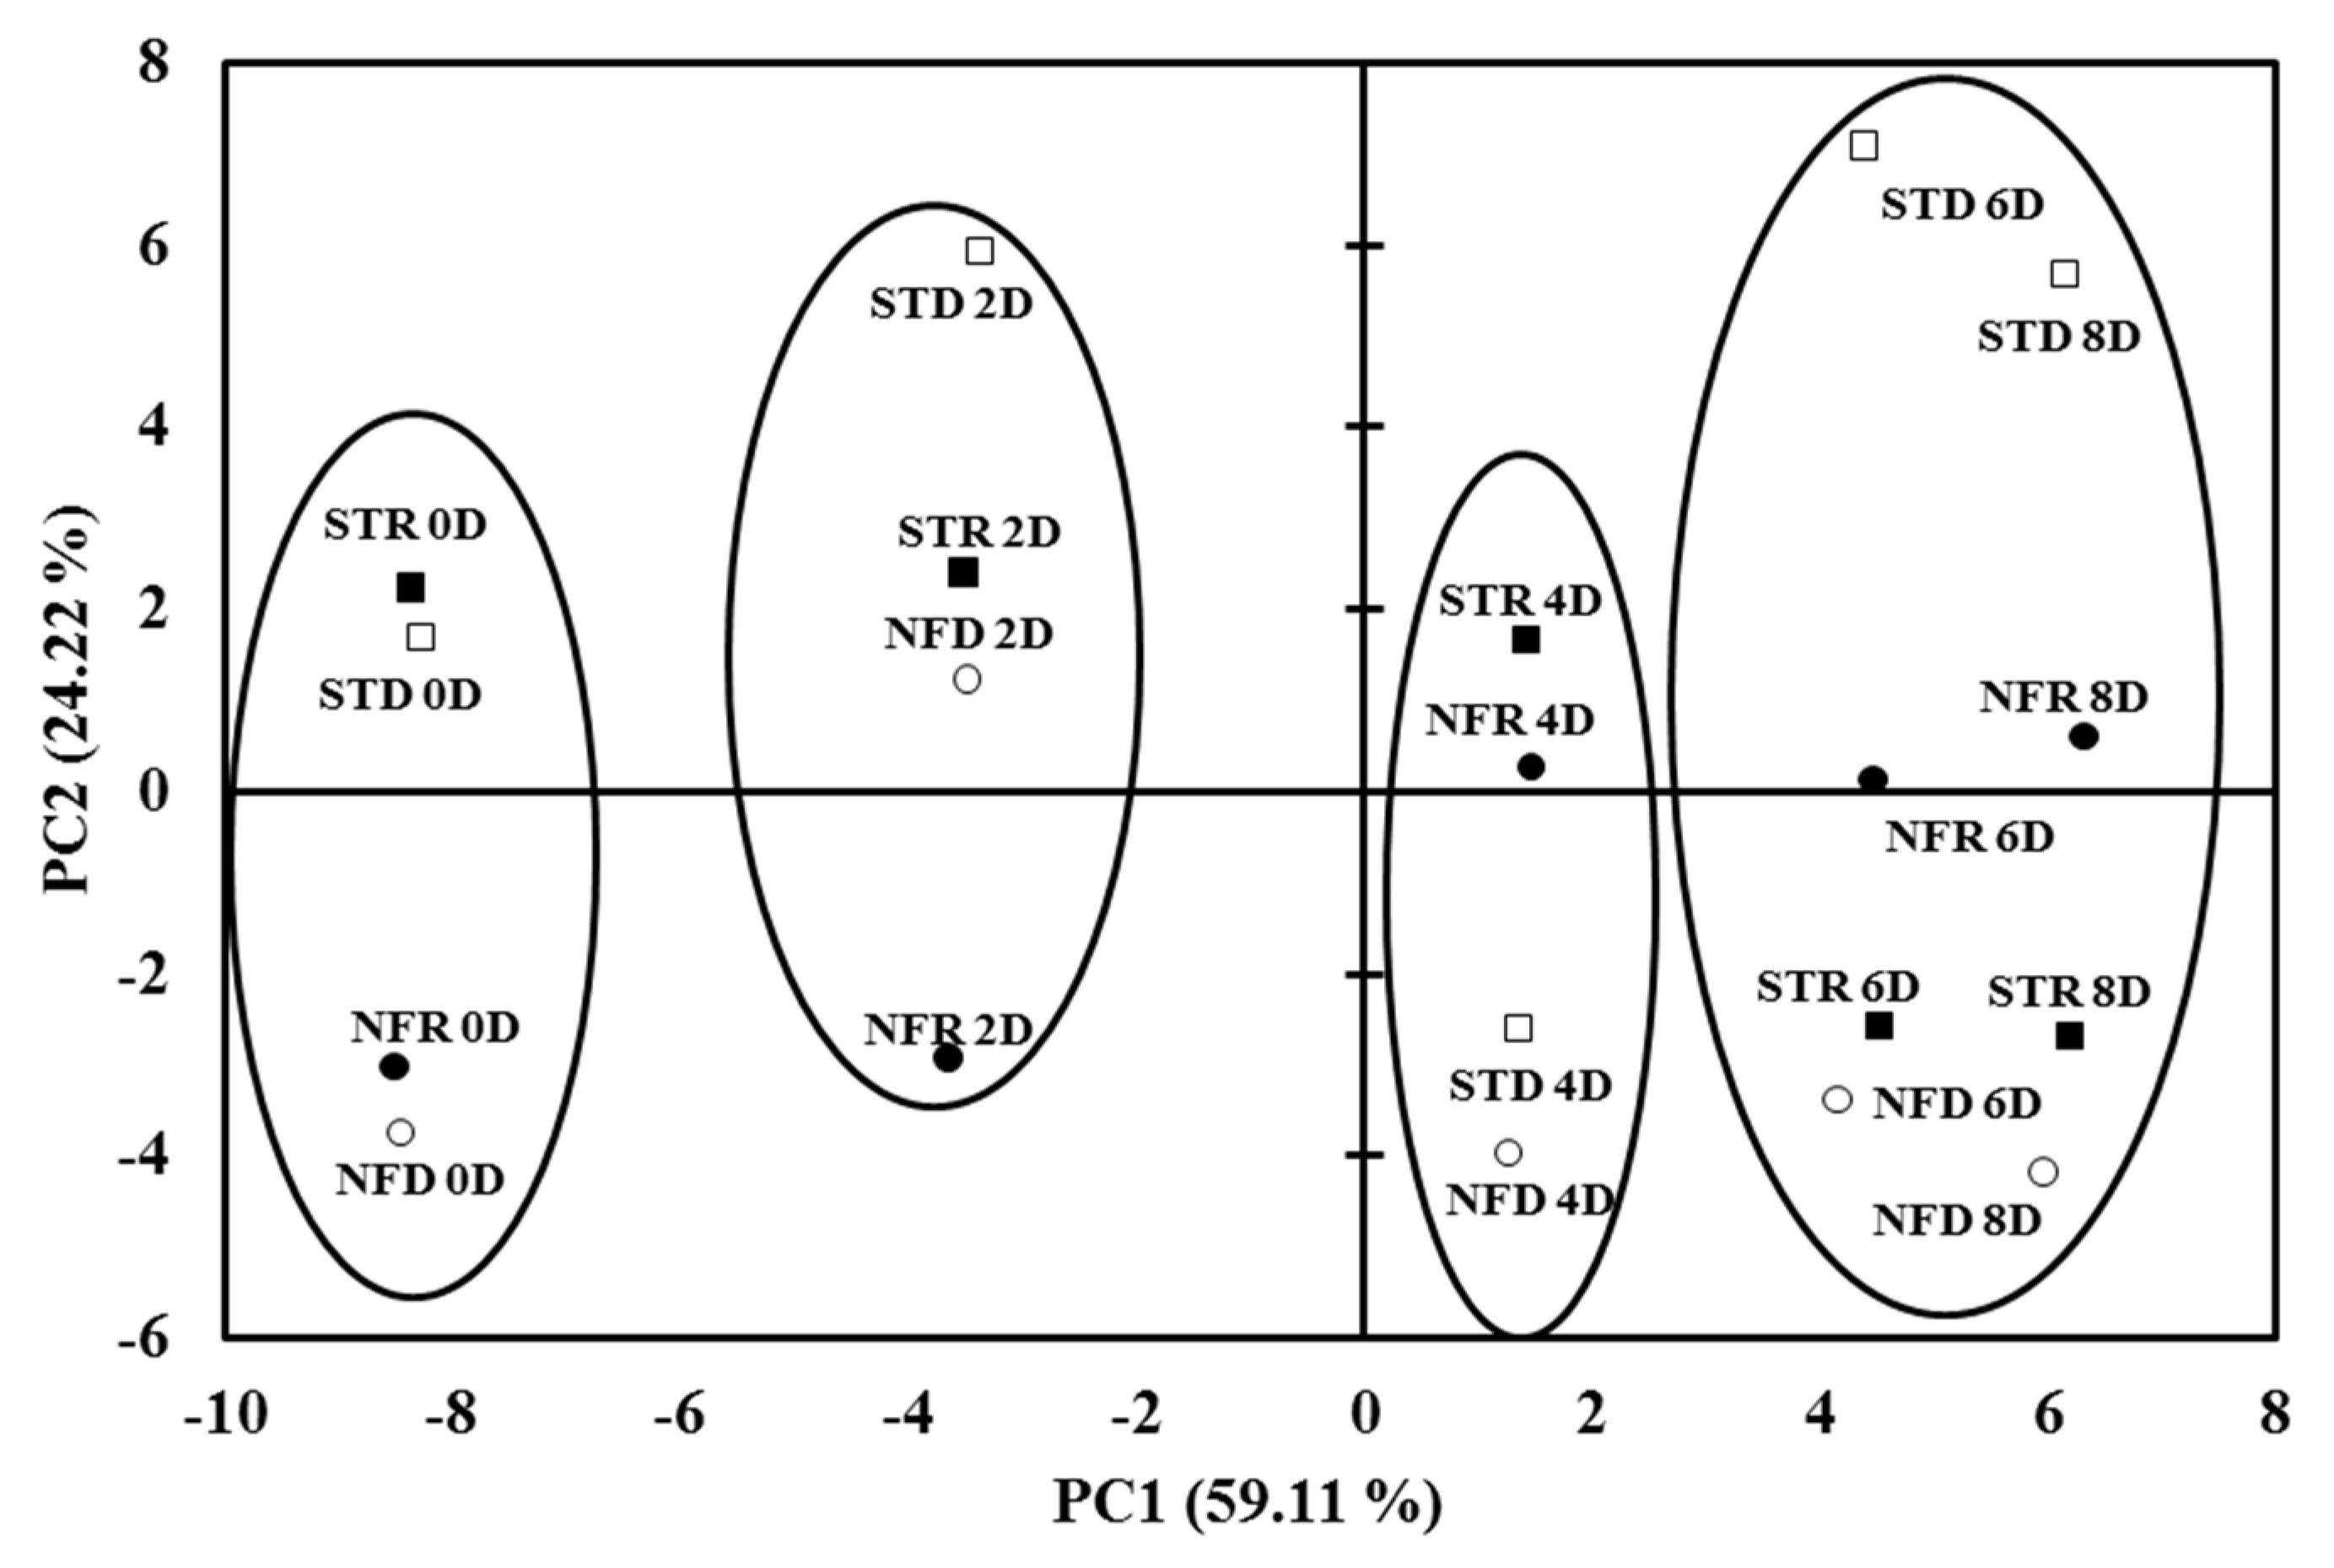
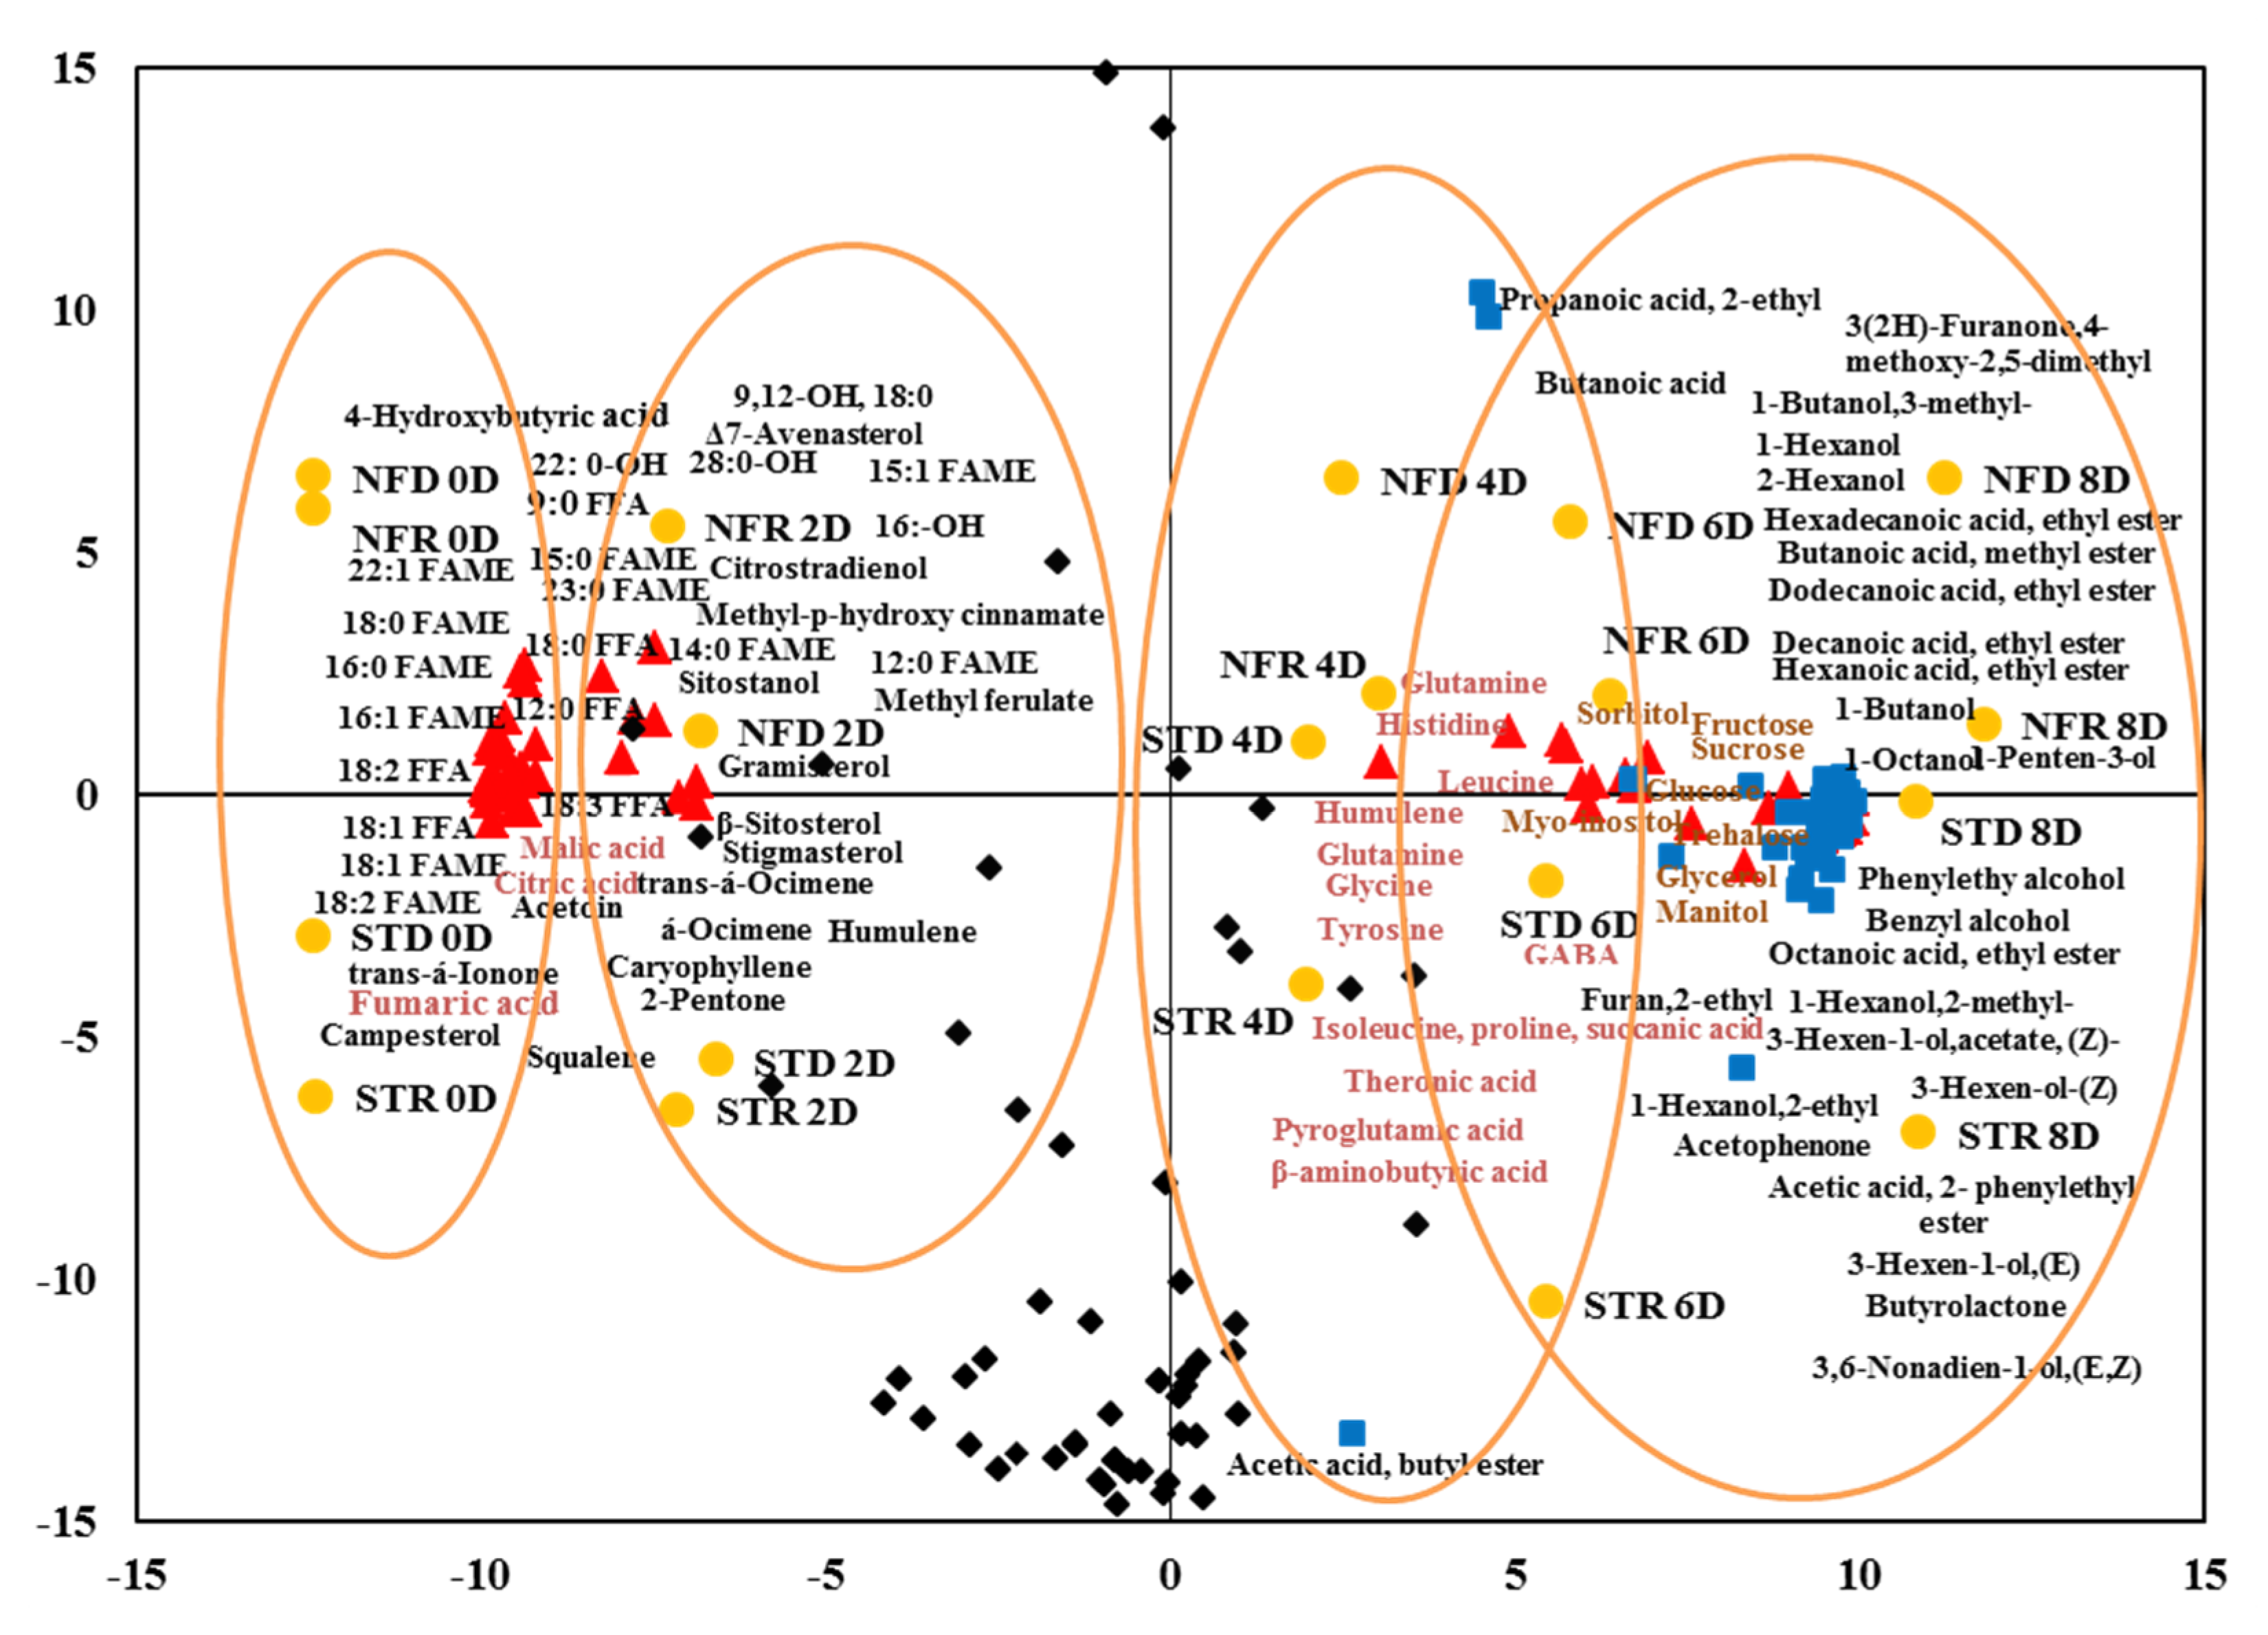
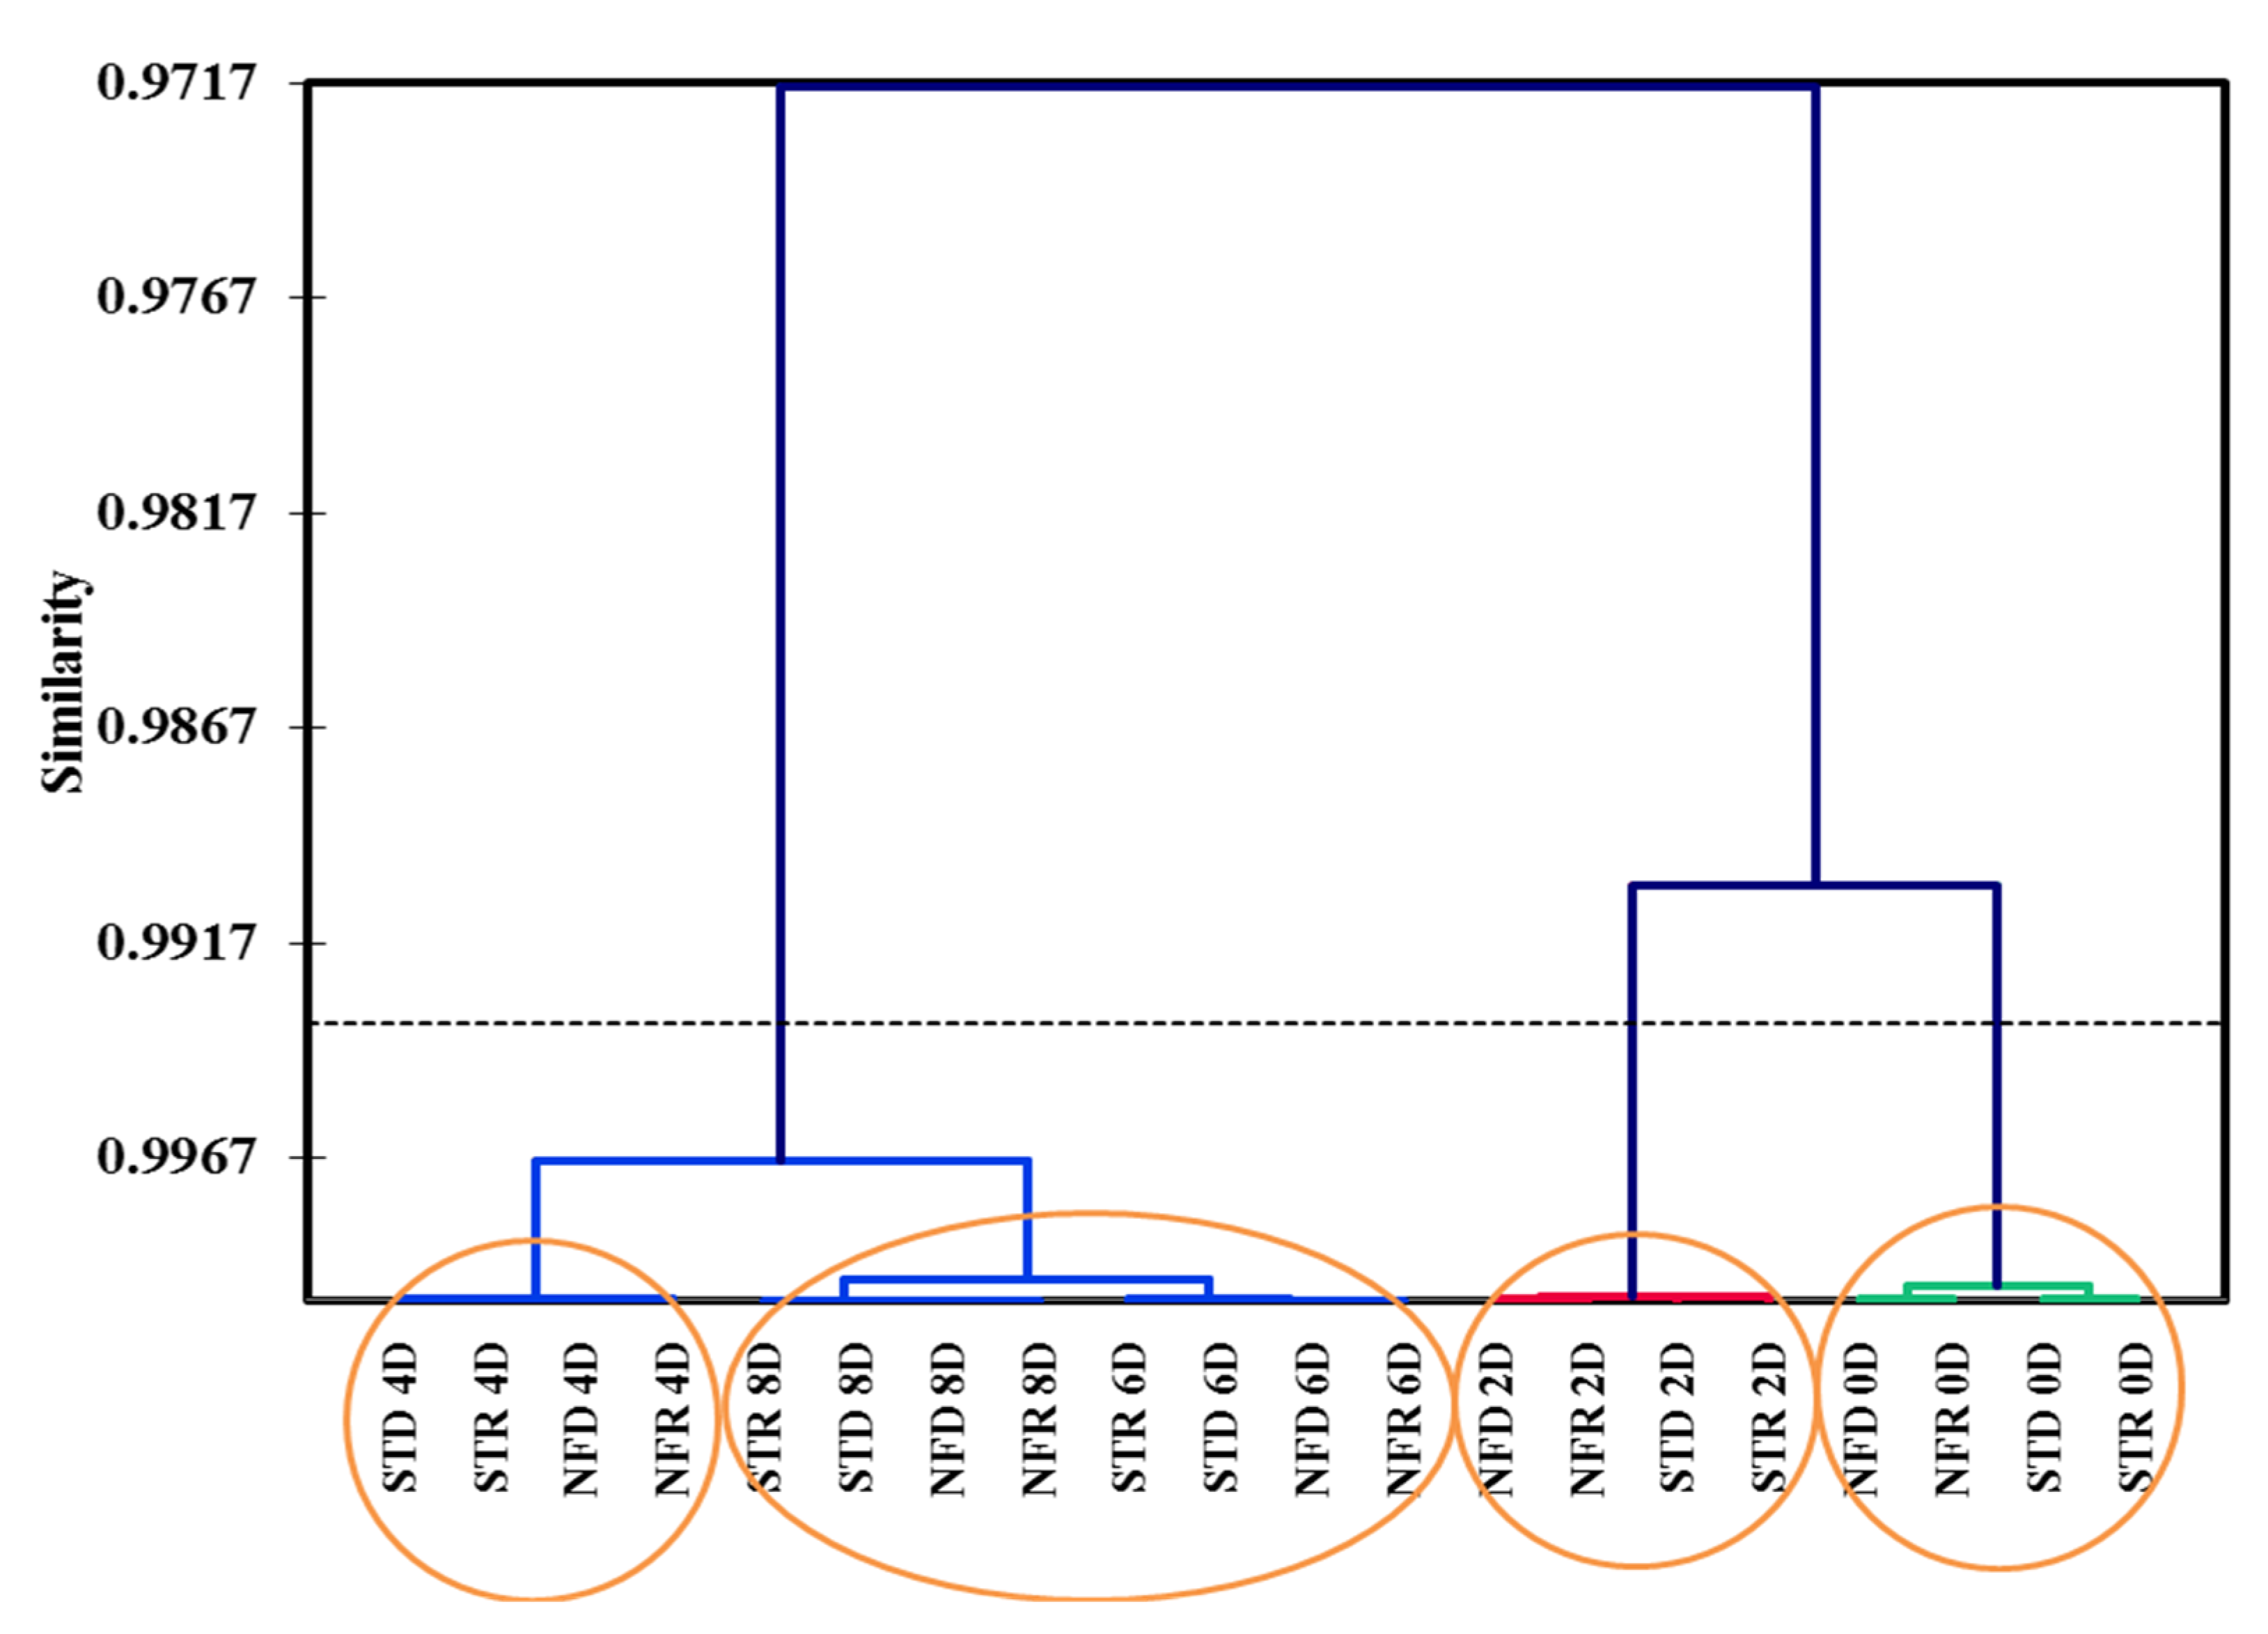
 ); unknown compounds ( ); ripening stages ( ).
); unknown compounds ( ); ripening stages ( ).
); unknown compounds ( ); ripening stages ( ).
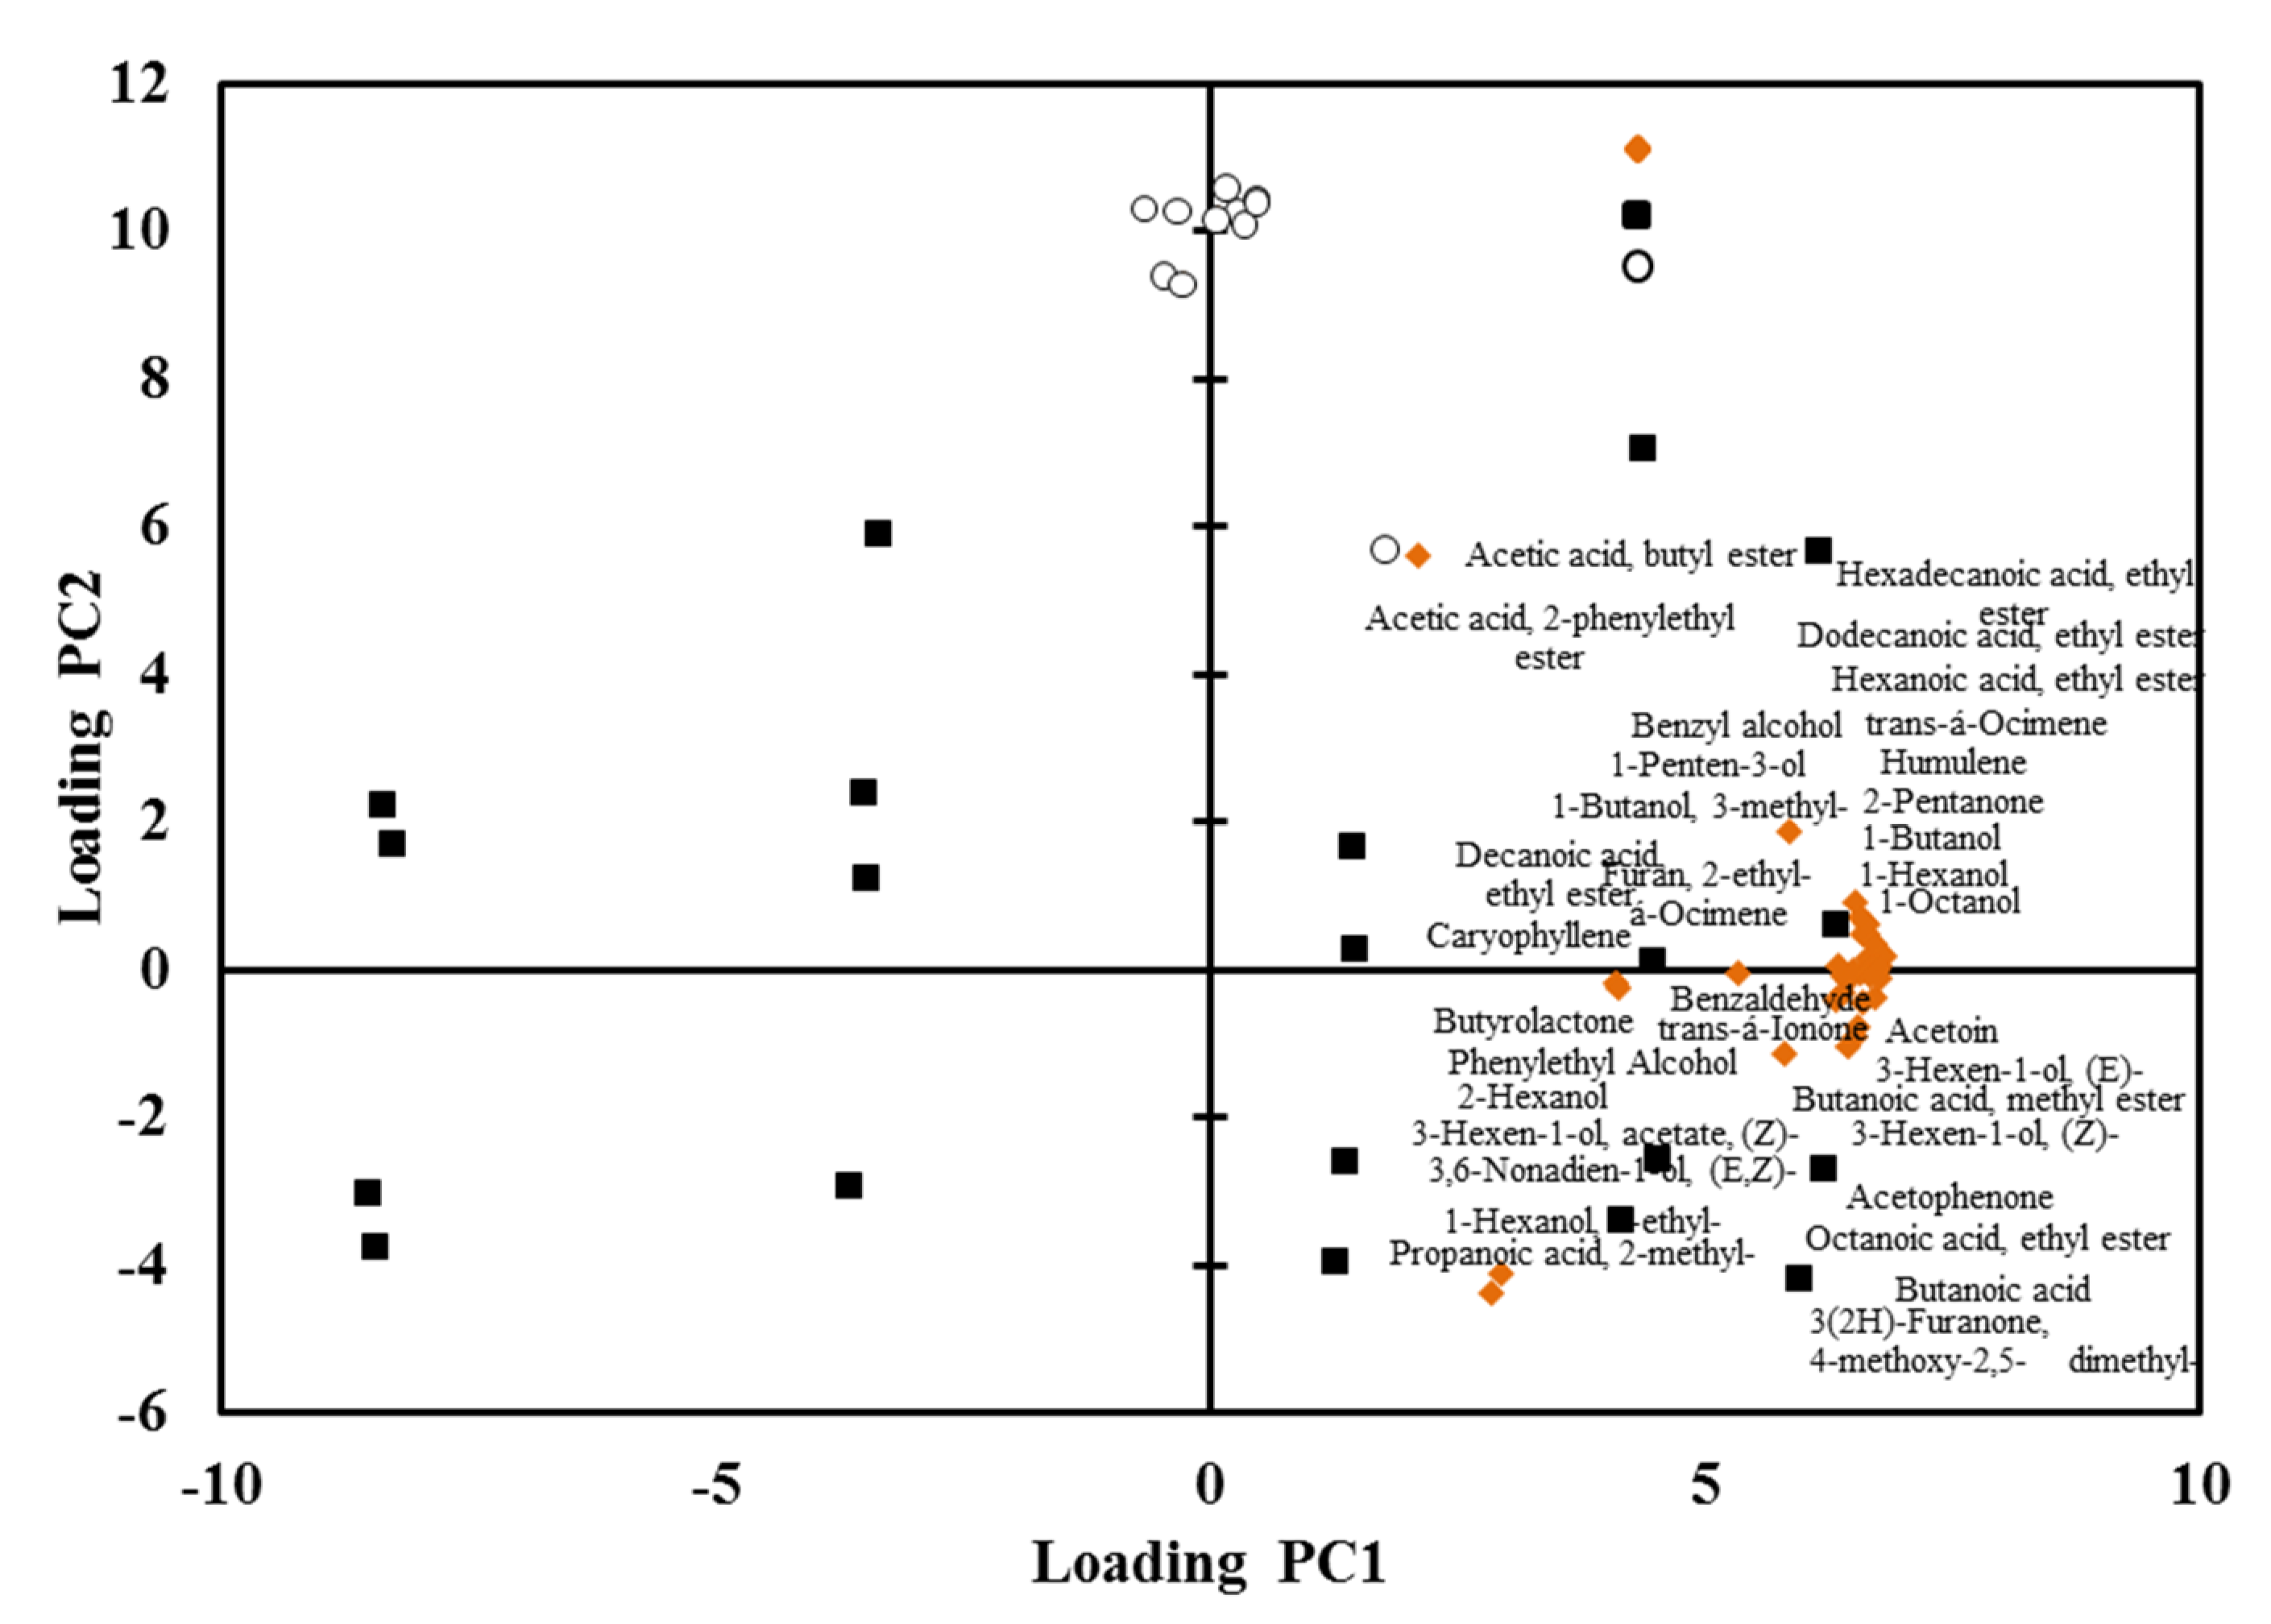
 ) and volatile organic compounds (
  ), unknown metabolites and volatiles (
  ) in ‘Nam Dok Mai’ mango cultivars (STD, dry season ‘Nam Dok Mai Si Thong’; STR, dry season ‘Nam Dok Mai Si Thong’; NFD, dry season ‘Nam Dok Mai No. 4’; NFR, rainy season ‘Nam Dok Mai No. 4’) (
  ). FAME, fatty acid methyl ester; FFA, free fatty acid; 0–8 D, 0–8 days of ripening.
) and volatile organic compounds ( ), unknown metabolites and volatiles ( ) in ‘Nam Dok Mai’ mango cultivars (STD, dry season ‘Nam Dok Mai Si Thong’; STR, dry season ‘Nam Dok Mai Si Thong’; NFD, dry season ‘Nam Dok Mai No. 4’; NFR, rainy season ‘Nam Dok Mai No. 4’) ( ). FAME, fatty acid methyl ester; FFA, free fatty acid; 0–8 D, 0–8 days of ripening.
). FAME, fatty acid methyl ester; FFA, free fatty acid; 0–8 D, 0–8 days of ripening.
) and volatile organic compounds ( ), unknown metabolites and volatiles ( ) in ‘Nam Dok Mai’ mango cultivars (STD, dry season ‘Nam Dok Mai Si Thong’; STR, dry season ‘Nam Dok Mai Si Thong’; NFD, dry season ‘Nam Dok Mai No. 4’; NFR, rainy season ‘Nam Dok Mai No. 4’) ( ). FAME, fatty acid methyl ester; FFA, free fatty acid; 0–8 D, 0–8 days of ripening.

Publisher’s Note: MDPI stays neutral with regard to jurisdictional claims in published maps and institutional affiliations. |
© 2021 by the authors. Licensee MDPI, Basel, Switzerland. This article is an open access article distributed under the terms and conditions of the Creative Commons Attribution (CC BY) license (https://creativecommons.org/licenses/by/4.0/).
Share and Cite
Lin Aung, Y.; Lorjaroenphon, Y.; Rumpagaporn, P.; Sae-tan, S.; Na Jom, K. Comparative Investigation of Combined Metabolomics-Flavoromics during the Ripening of Mango (Mangifera indica L.) cv. ‘Nam Dok Mai Si Thong’ and ‘Nam Dok Mai No. 4’. Plants 2021, 10, 2198. https://doi.org/10.3390/plants10102198
Lin Aung Y, Lorjaroenphon Y, Rumpagaporn P, Sae-tan S, Na Jom K. Comparative Investigation of Combined Metabolomics-Flavoromics during the Ripening of Mango (Mangifera indica L.) cv. ‘Nam Dok Mai Si Thong’ and ‘Nam Dok Mai No. 4’. Plants. 2021; 10(10):2198. https://doi.org/10.3390/plants10102198
Chicago/Turabian StyleLin Aung, Ye, Yaowapa Lorjaroenphon, Pinthip Rumpagaporn, Sudathip Sae-tan, and Kriskamol Na Jom. 2021. "Comparative Investigation of Combined Metabolomics-Flavoromics during the Ripening of Mango (Mangifera indica L.) cv. ‘Nam Dok Mai Si Thong’ and ‘Nam Dok Mai No. 4’" Plants 10, no. 10: 2198. https://doi.org/10.3390/plants10102198
APA StyleLin Aung, Y., Lorjaroenphon, Y., Rumpagaporn, P., Sae-tan, S., & Na Jom, K. (2021). Comparative Investigation of Combined Metabolomics-Flavoromics during the Ripening of Mango (Mangifera indica L.) cv. ‘Nam Dok Mai Si Thong’ and ‘Nam Dok Mai No. 4’. Plants, 10(10), 2198. https://doi.org/10.3390/plants10102198