
The Damage Caused by Decline Disease in Bayberry Plants through Changes in Soil Properties, Rhizosphere Microbial Community Structure and Metabolites


Abstract

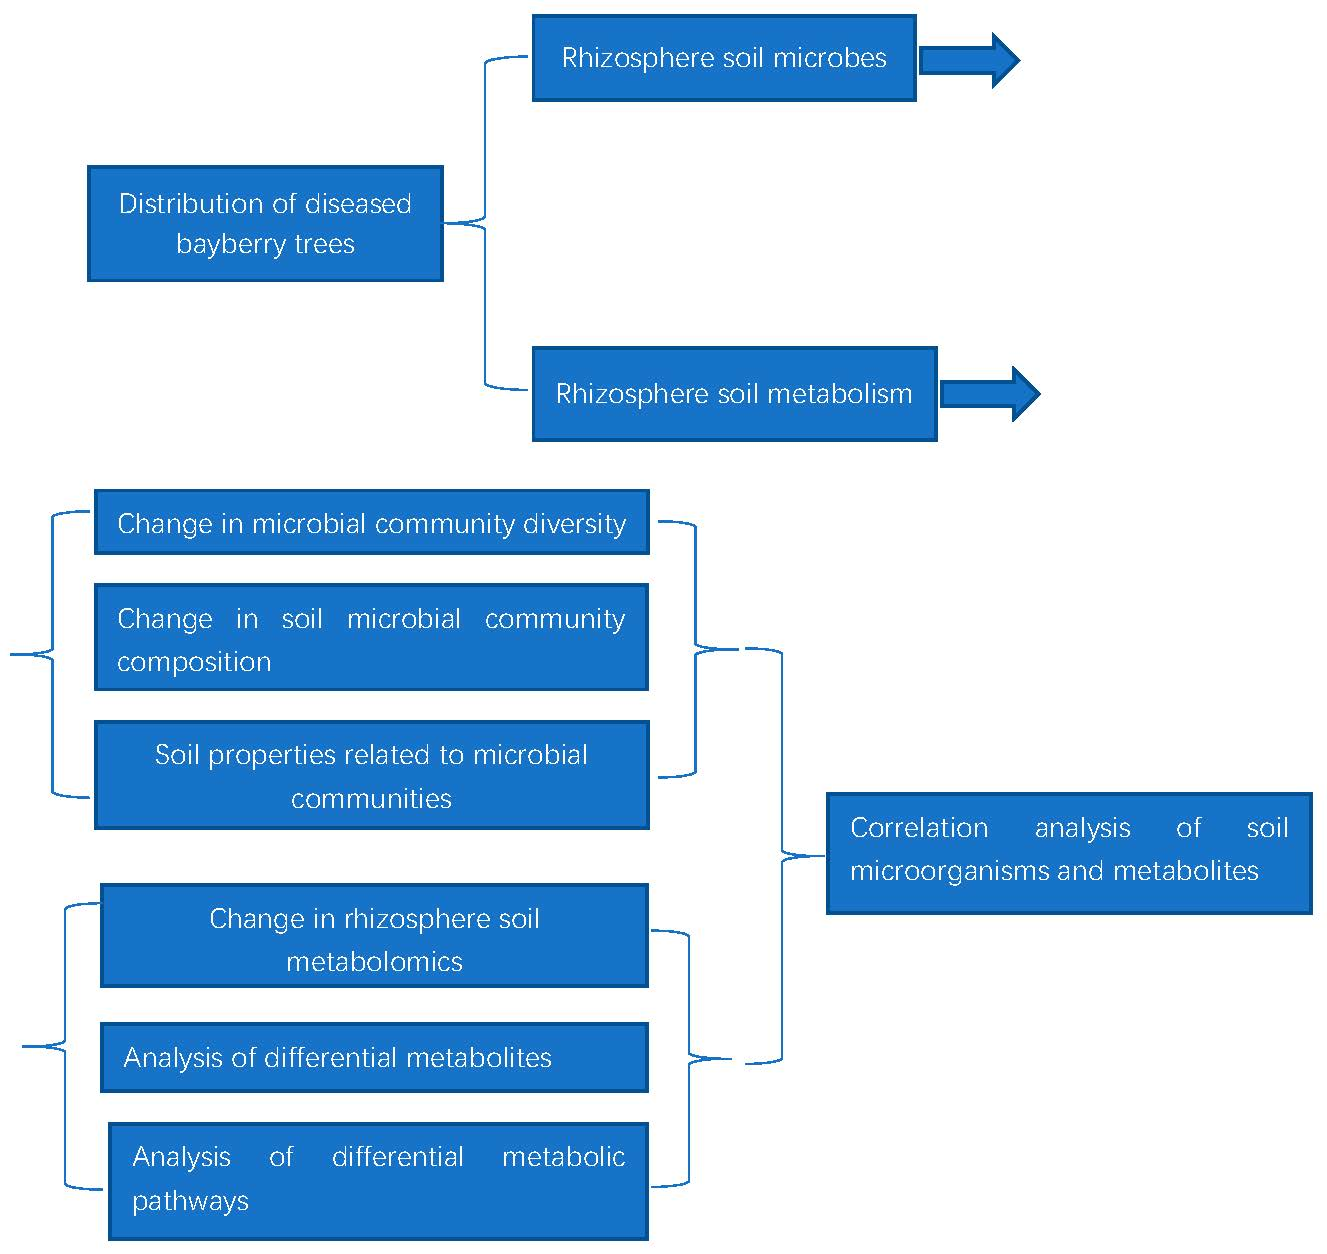
1. Introduction
2. Materials and Methods
2.1. Investigated Orchard and Bayberry Trees
2.2. Soil Sample Collection
2.3. Soil Genome Sequencing
2.4. Soil Properties
2.5. GC–MS Metabolomics Analysis
2.6. Statistical Analysis
3. Results and Discussion
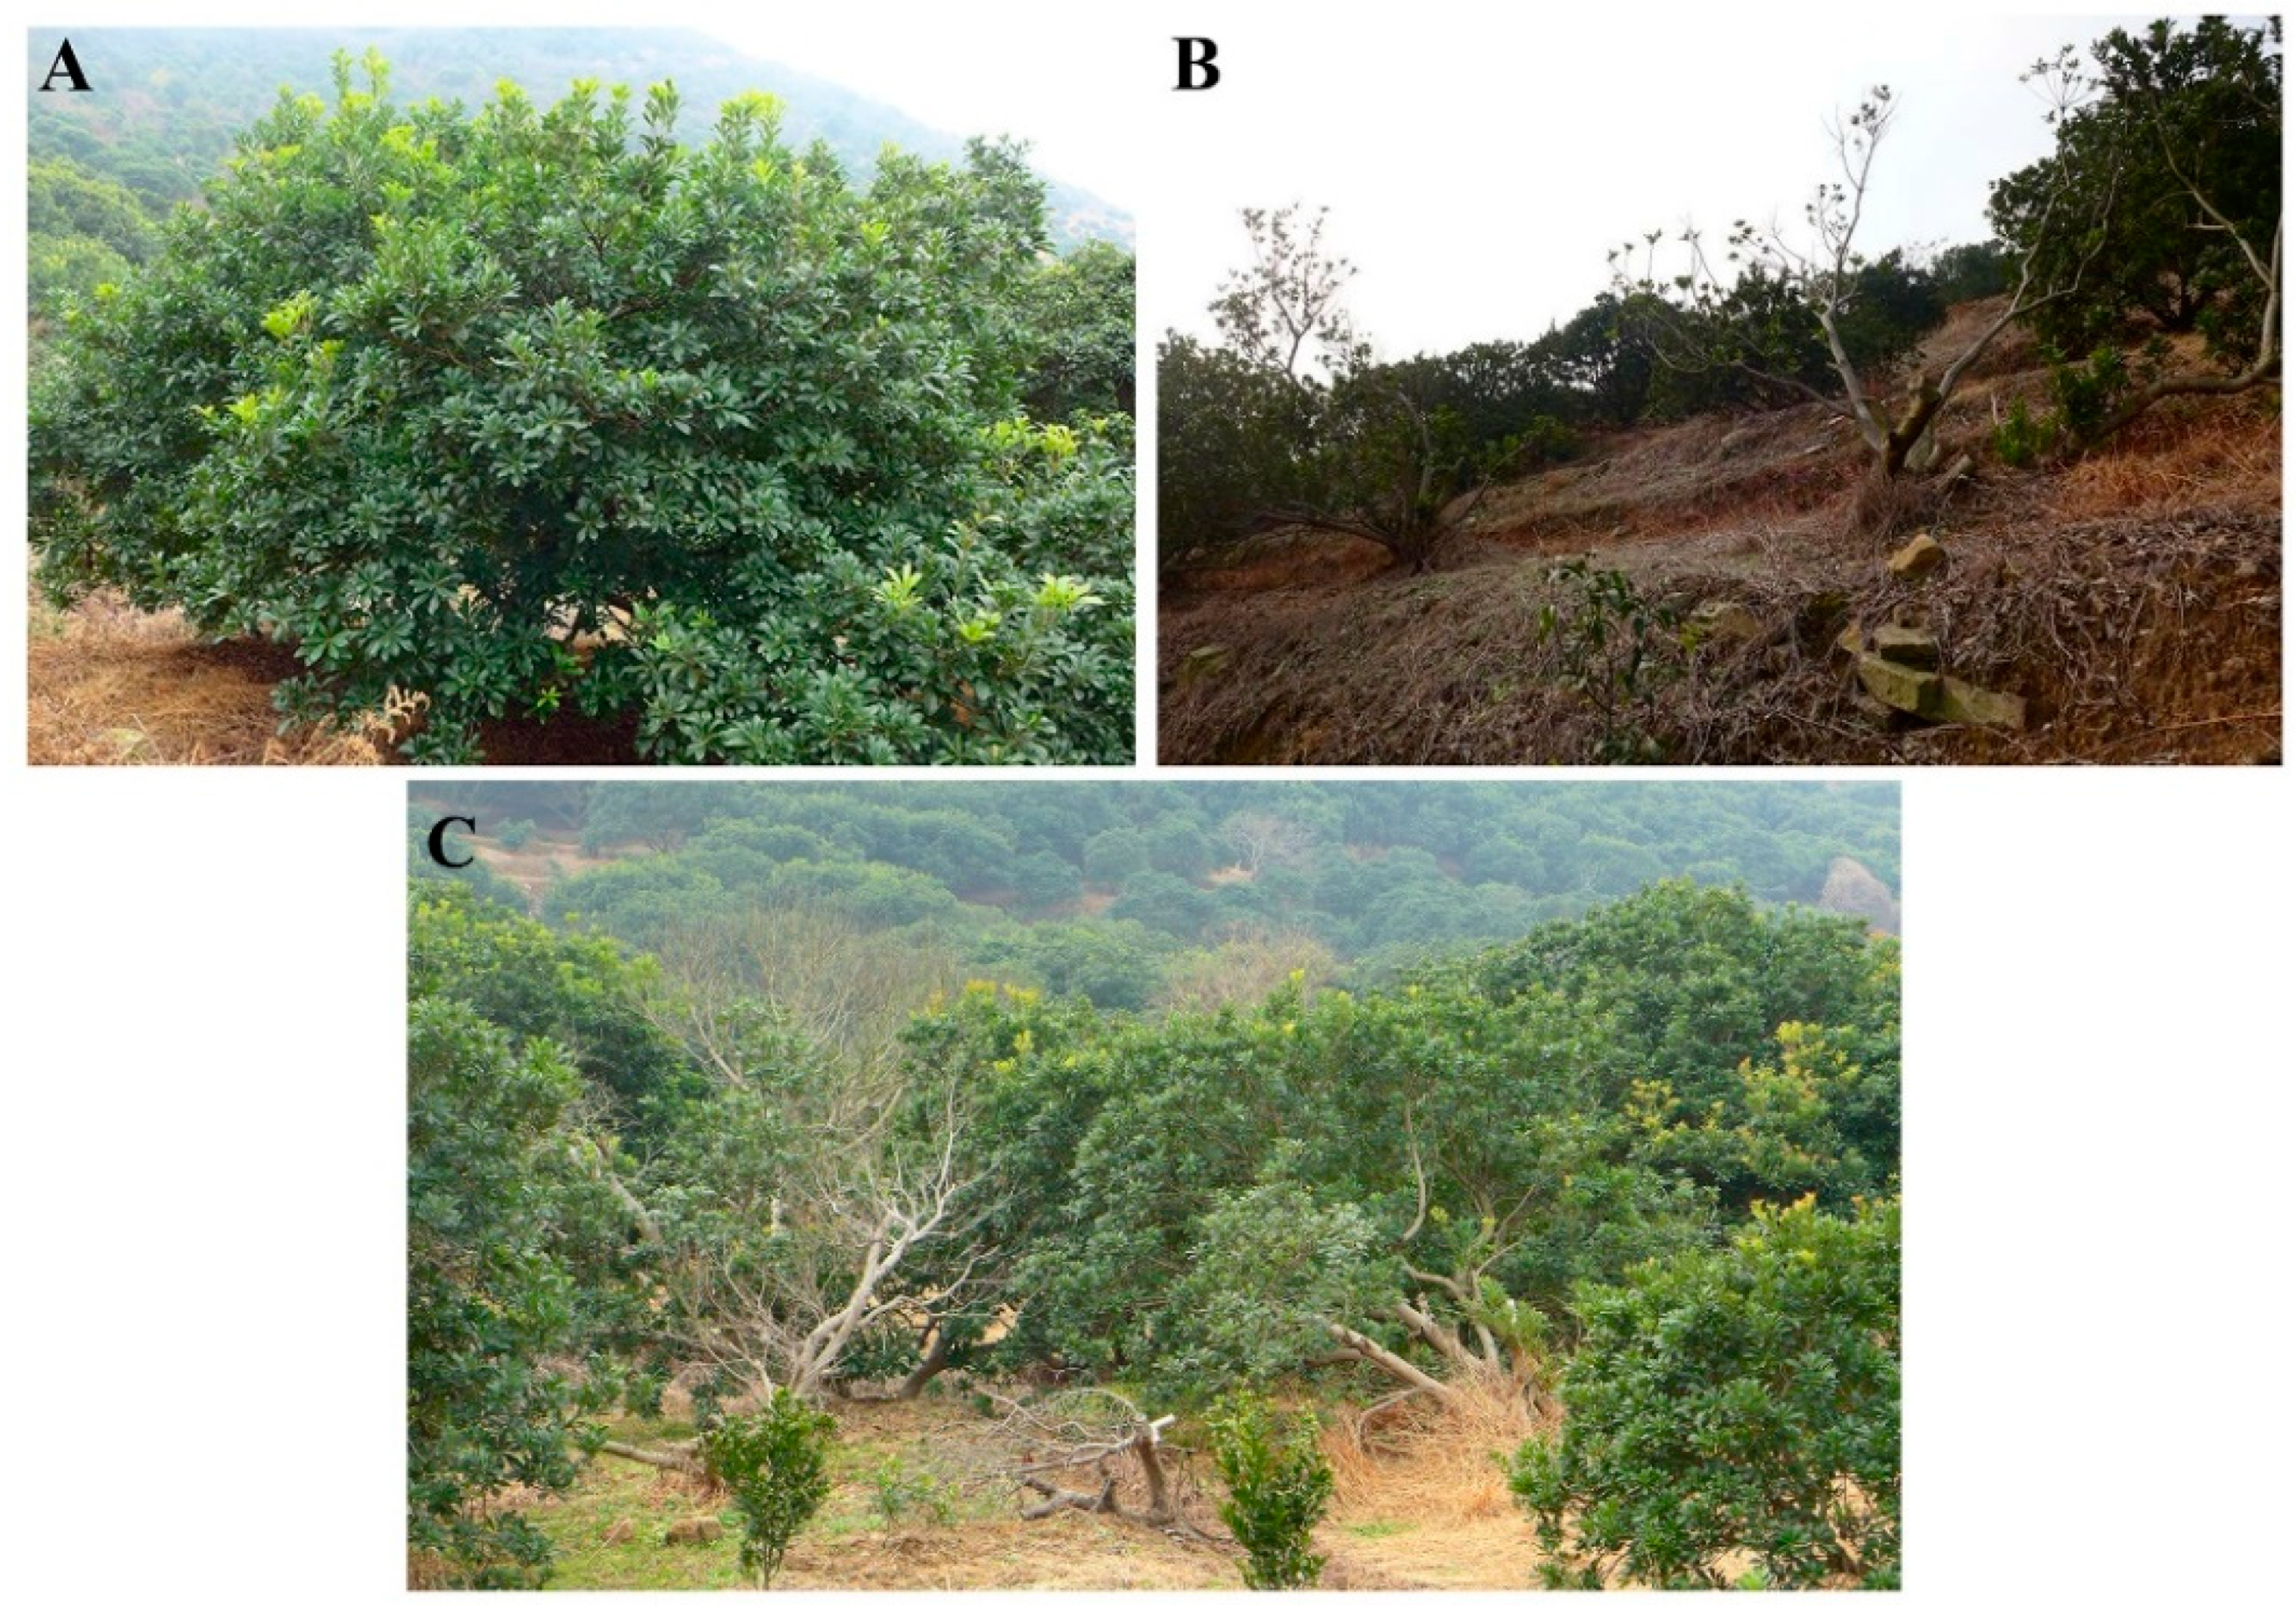
3.1. Distribution of Diseased Bayberry Trees
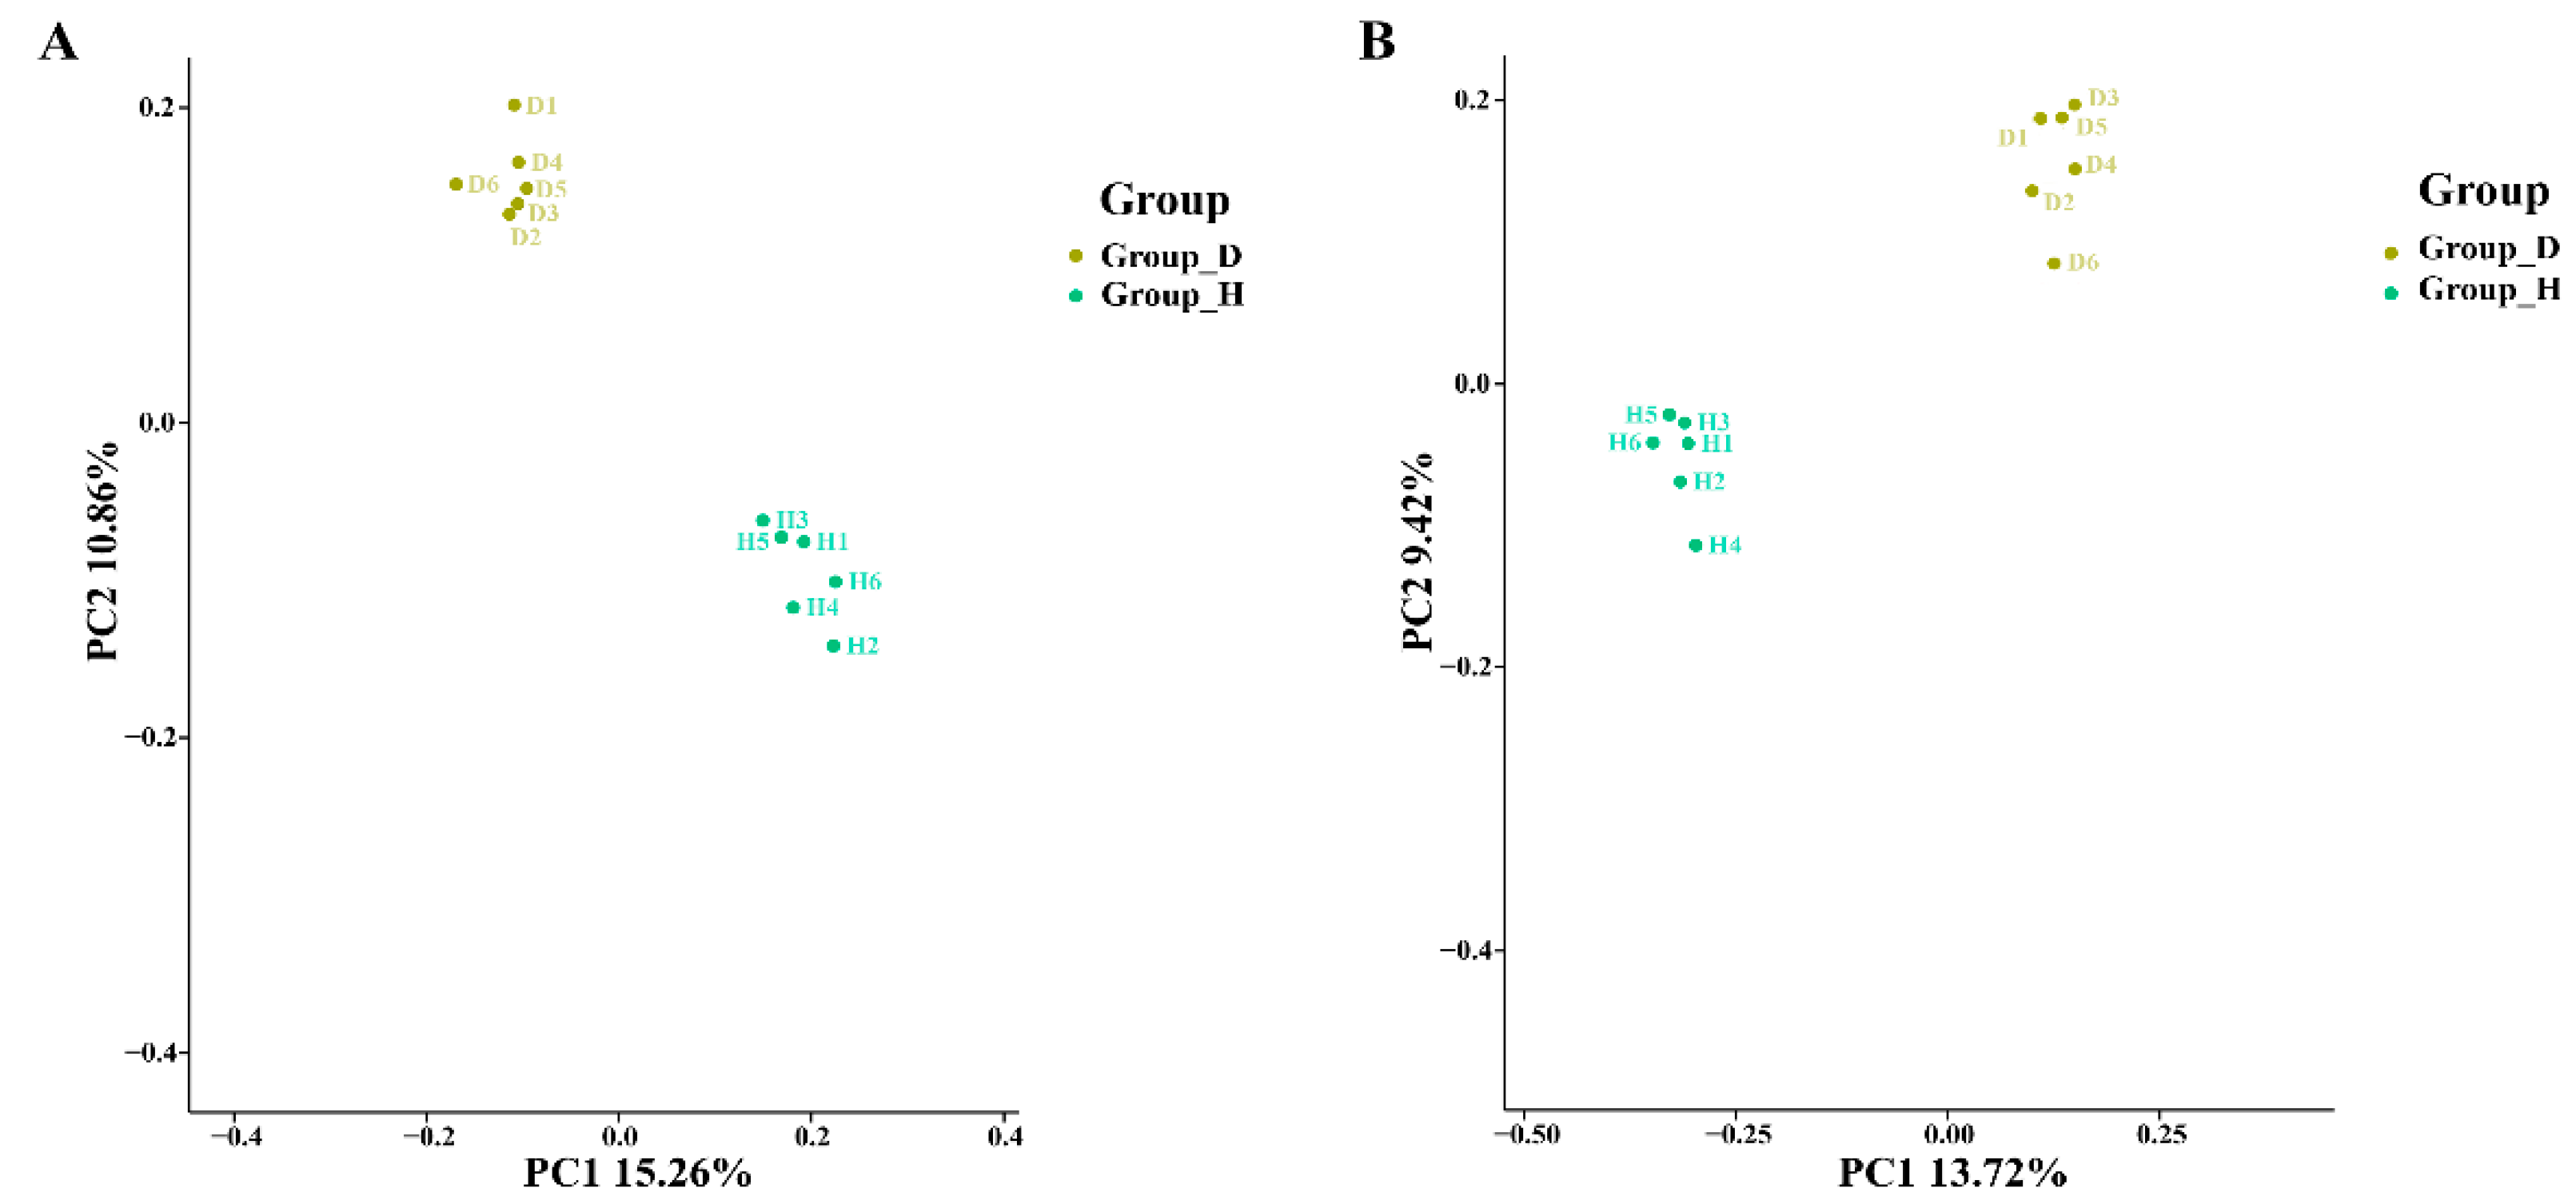
3.2. Changes in Microbial Community Diversity
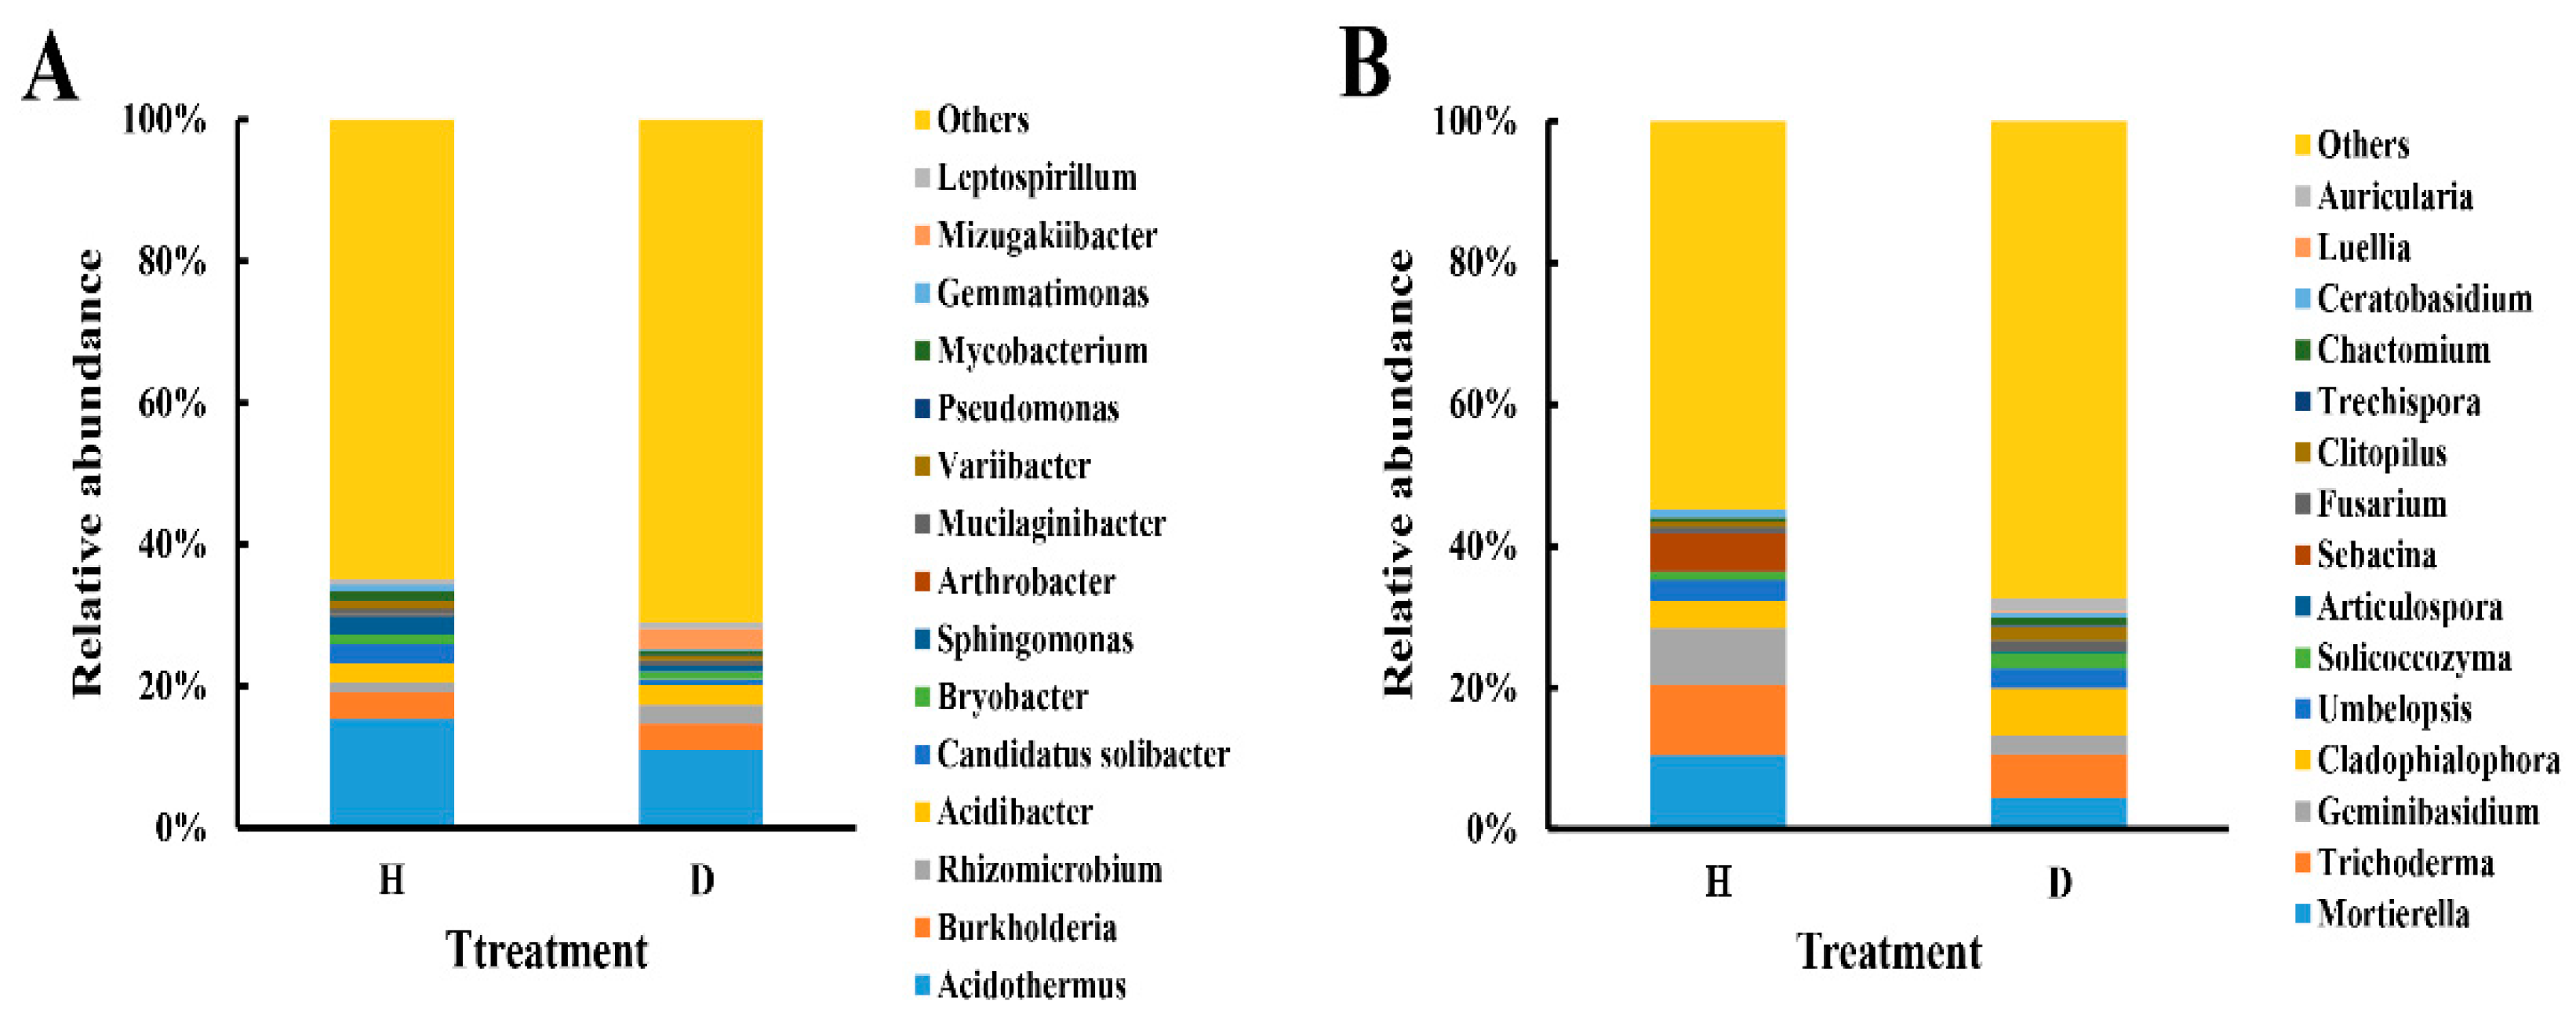
3.3. Changes in Soil Microbial Community Composition
3.4. Soil Properties Related to Microbial Communities
3.4.1. Soil Properties
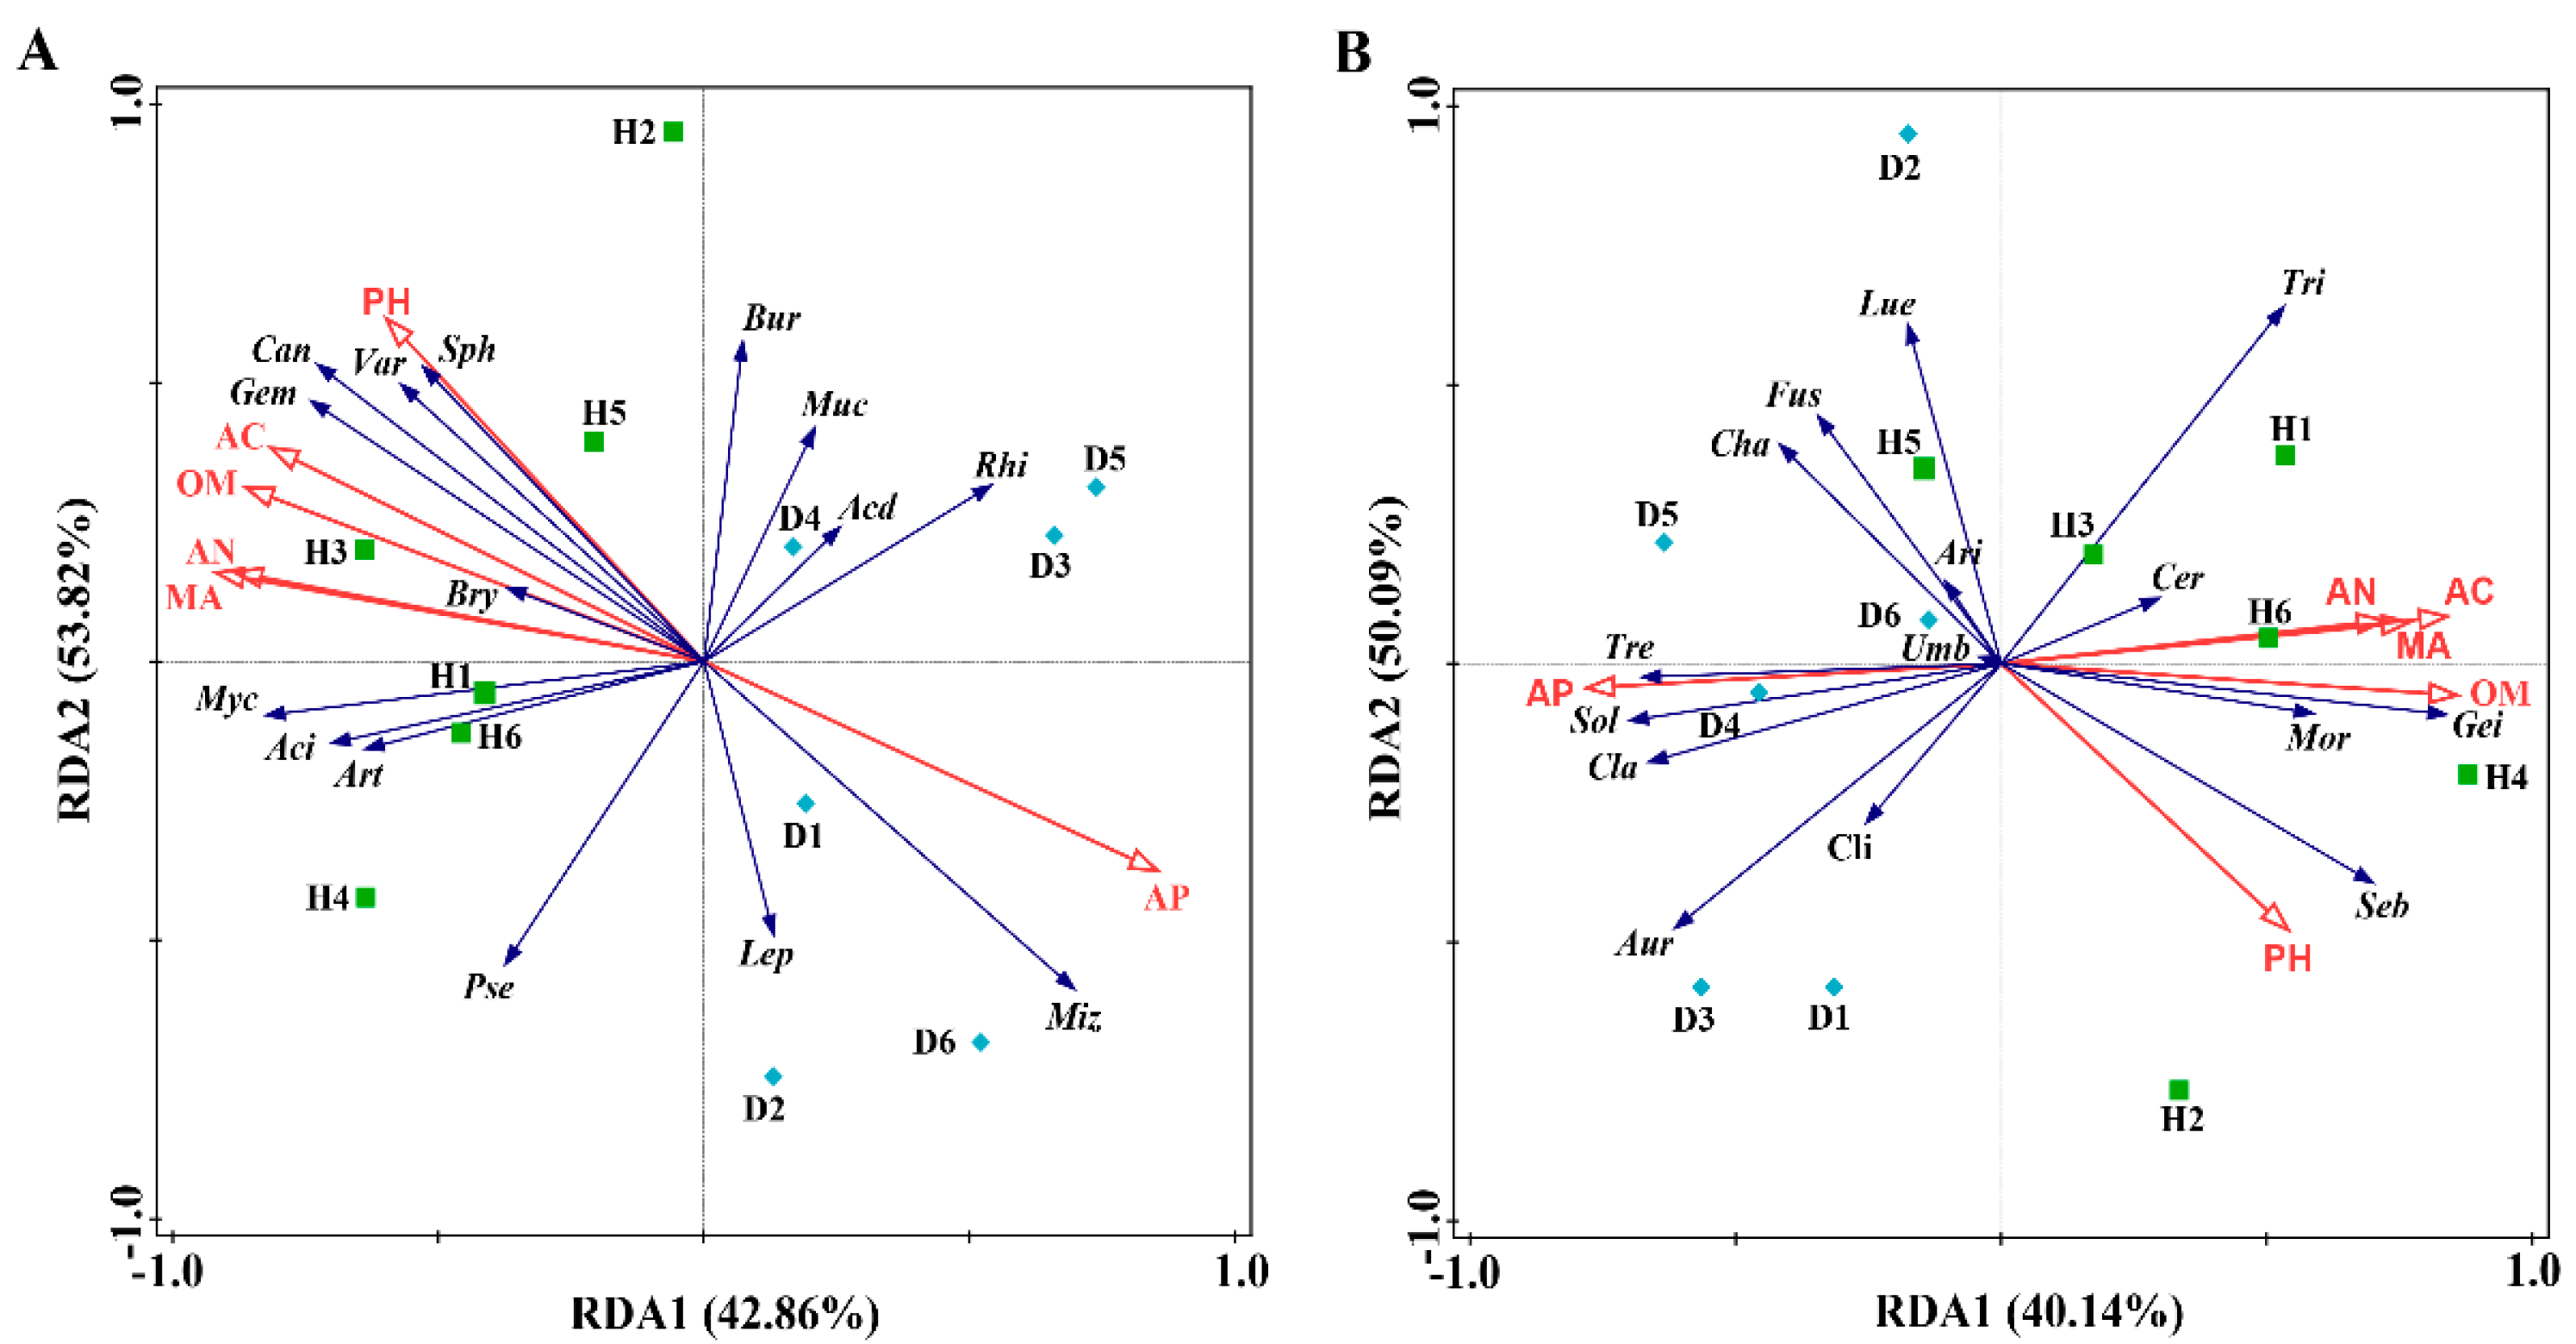
3.4.2. RDA of Soil Properties and Microbial Communities
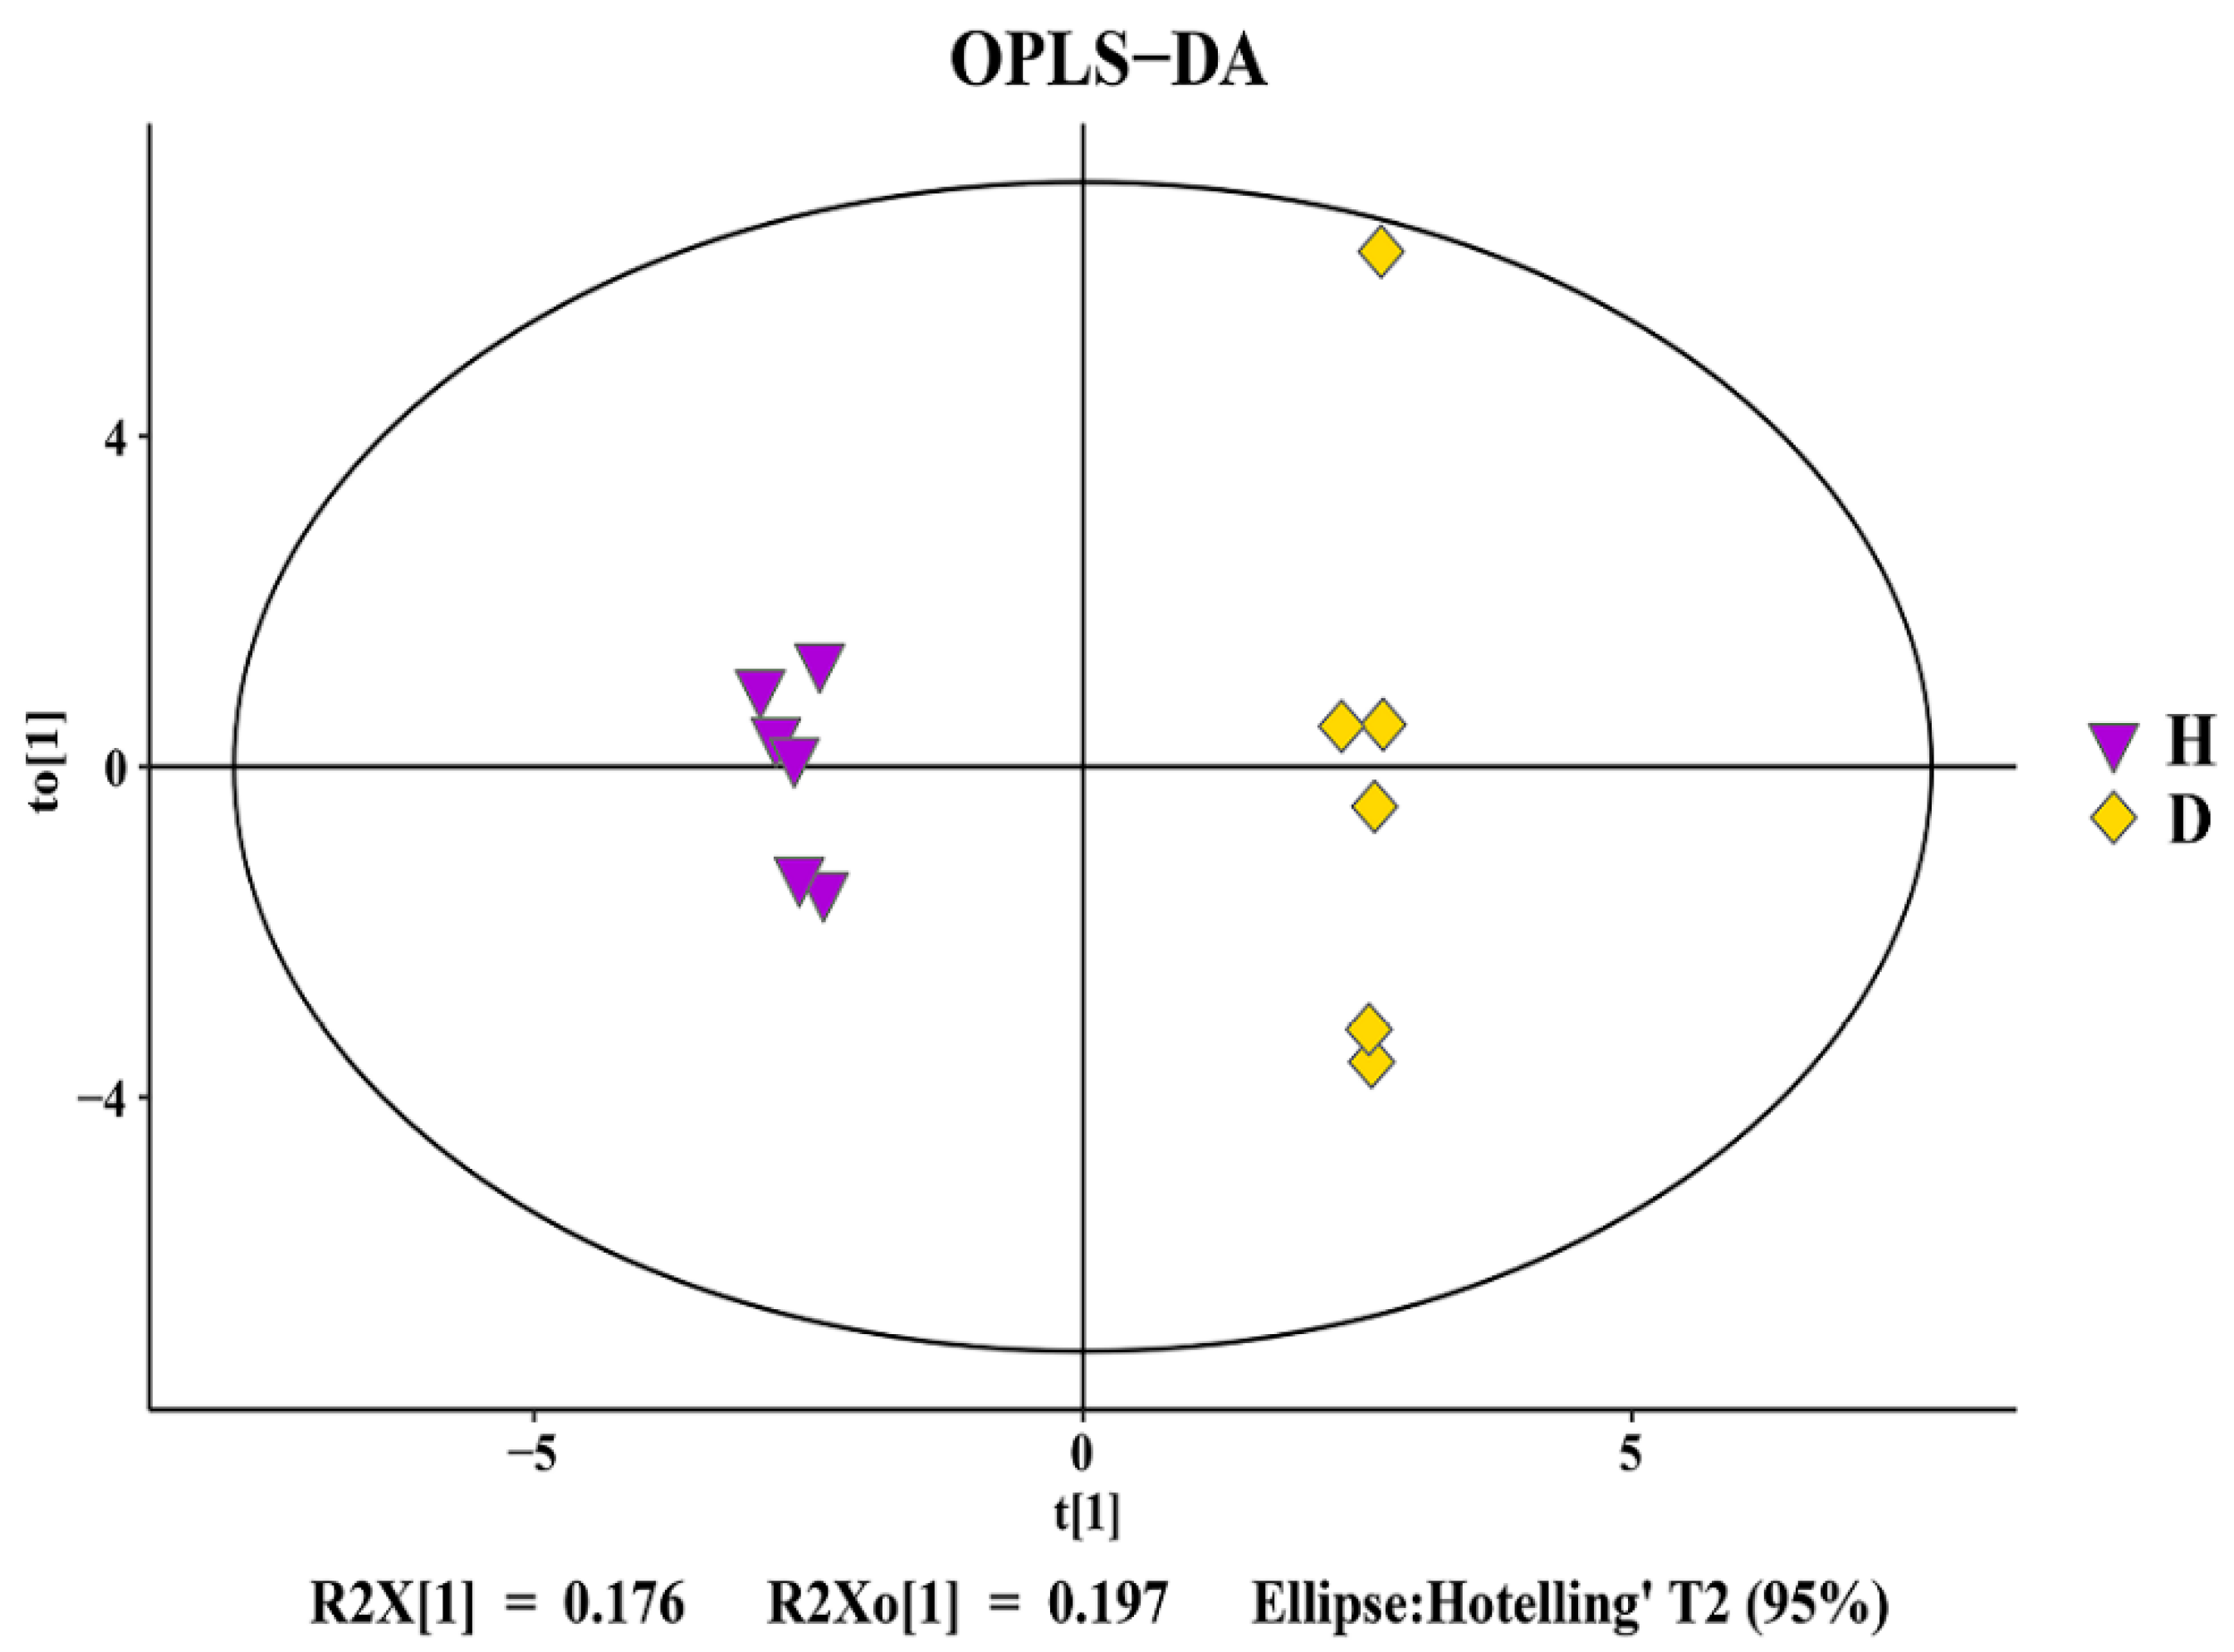
3.5. Change in Rhizosphere Soil Metabolomics
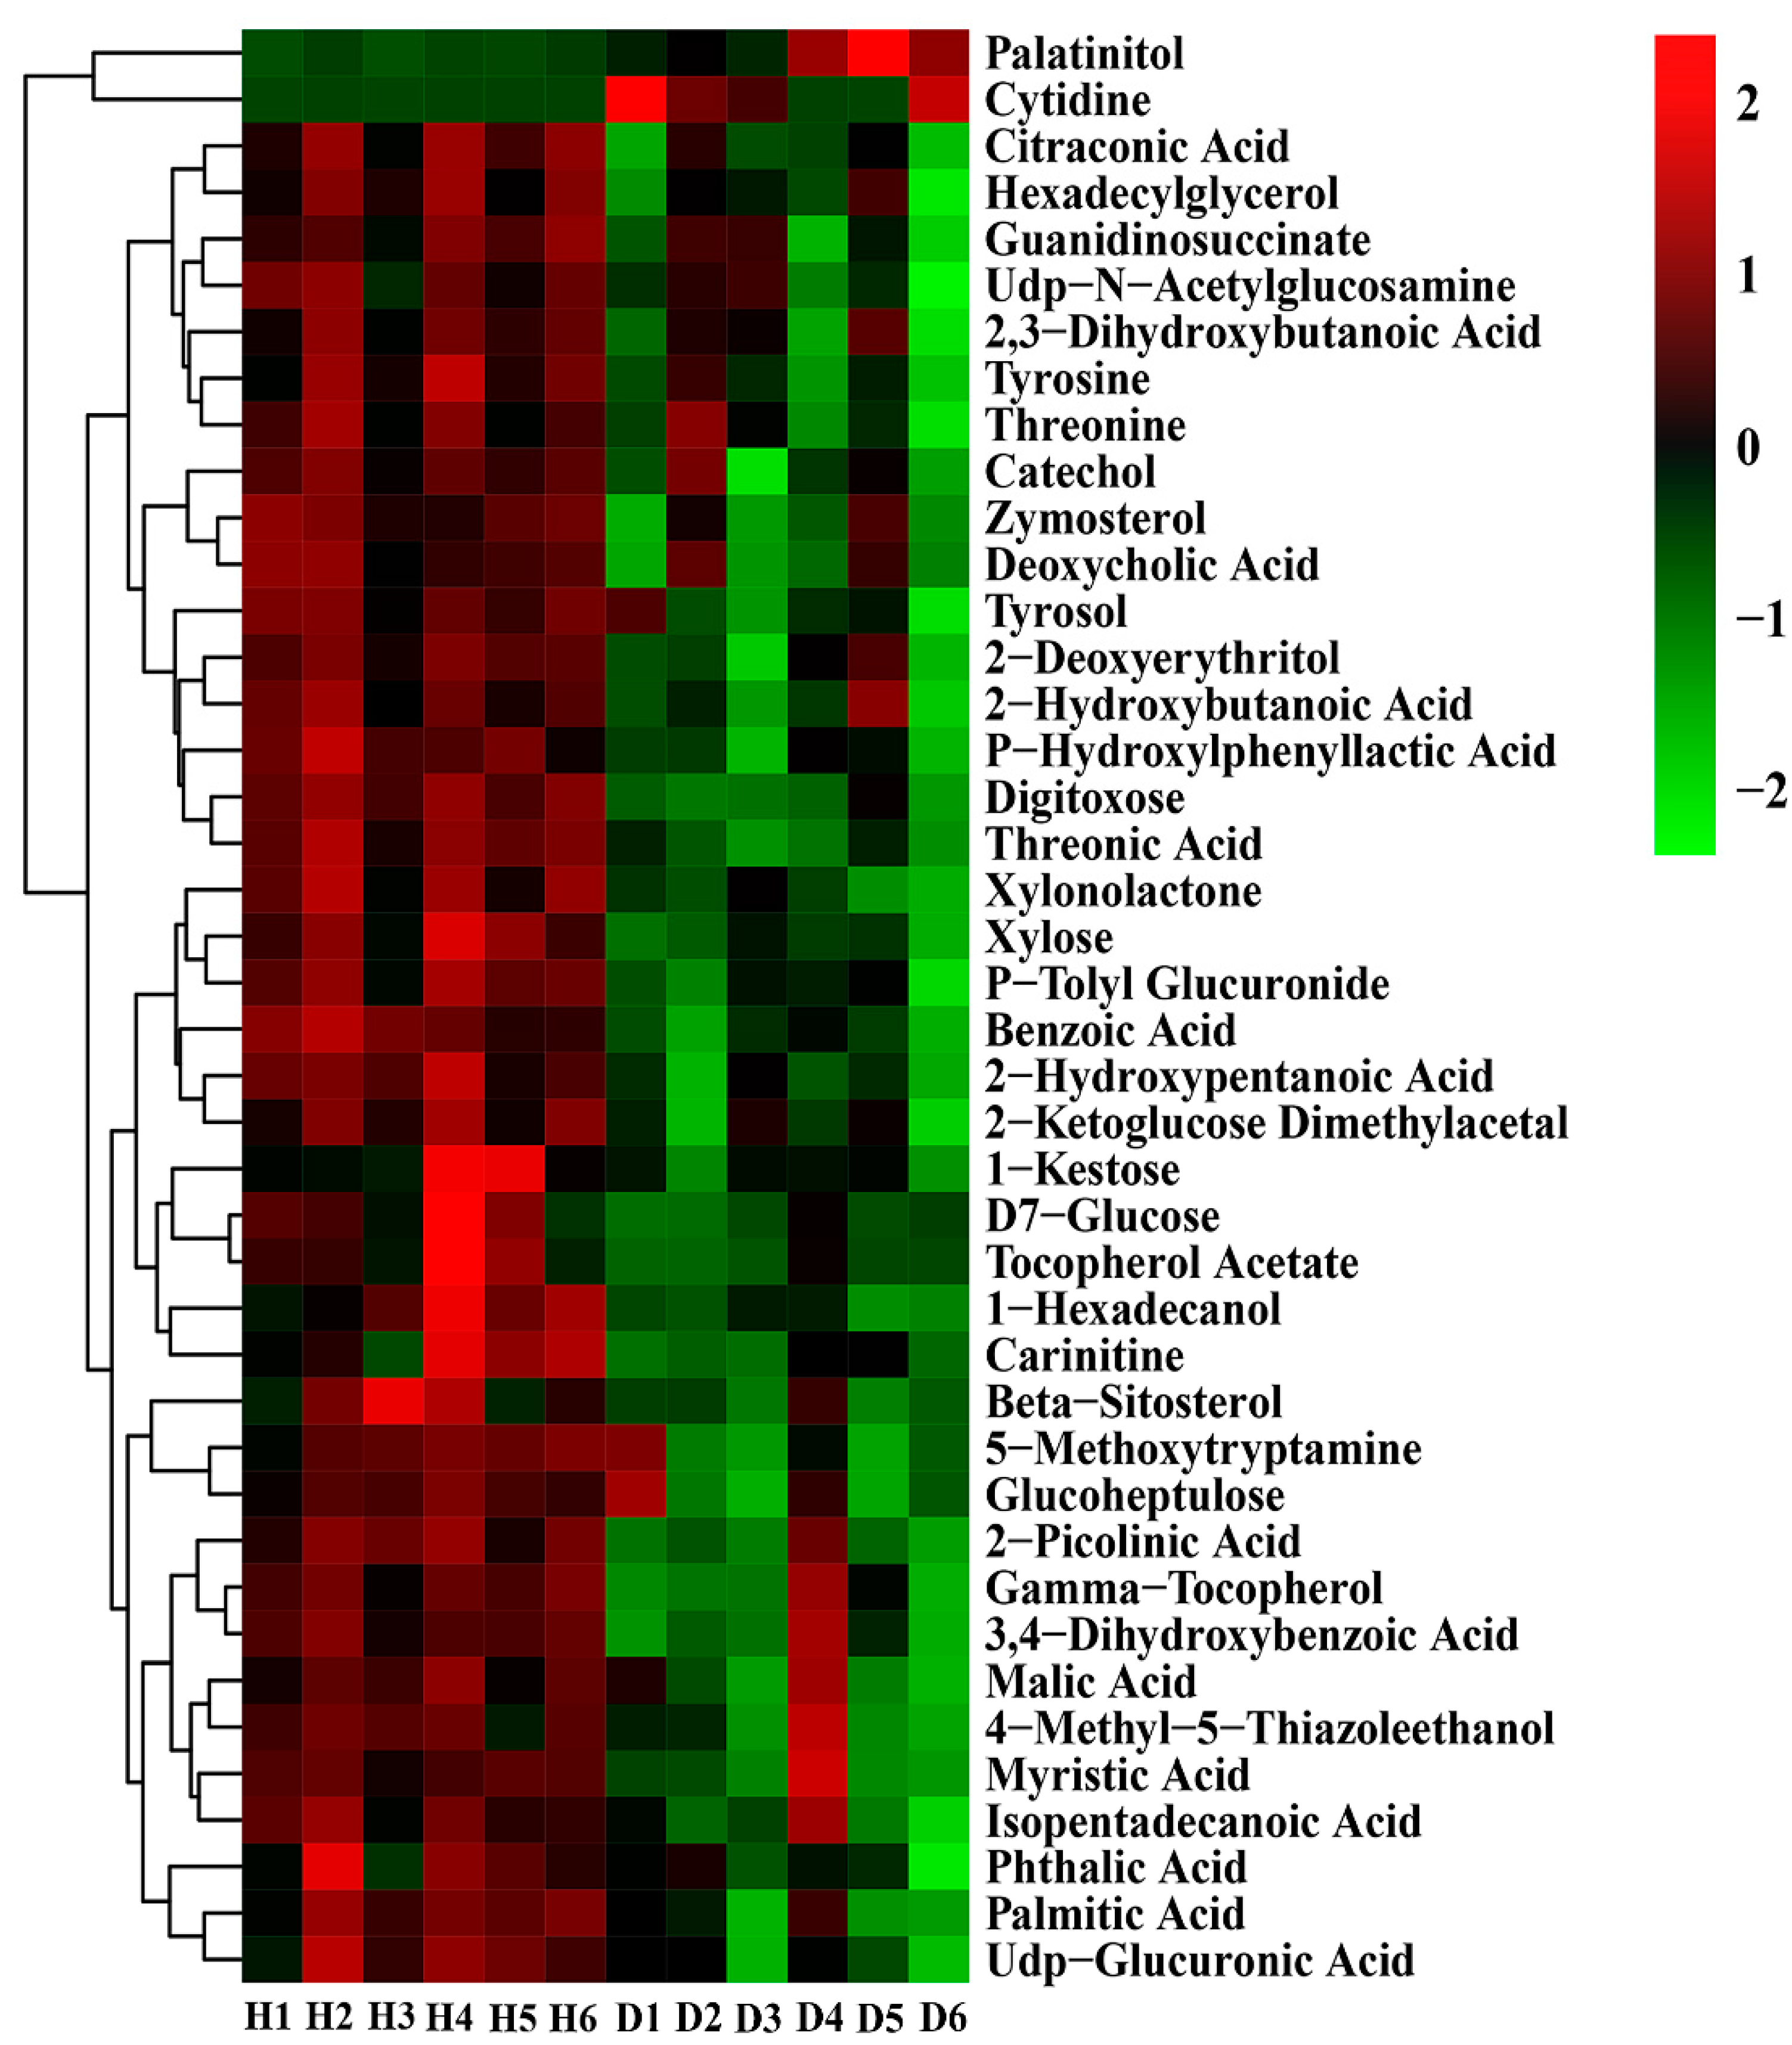
3.6. Analysis of Differential Metabolites
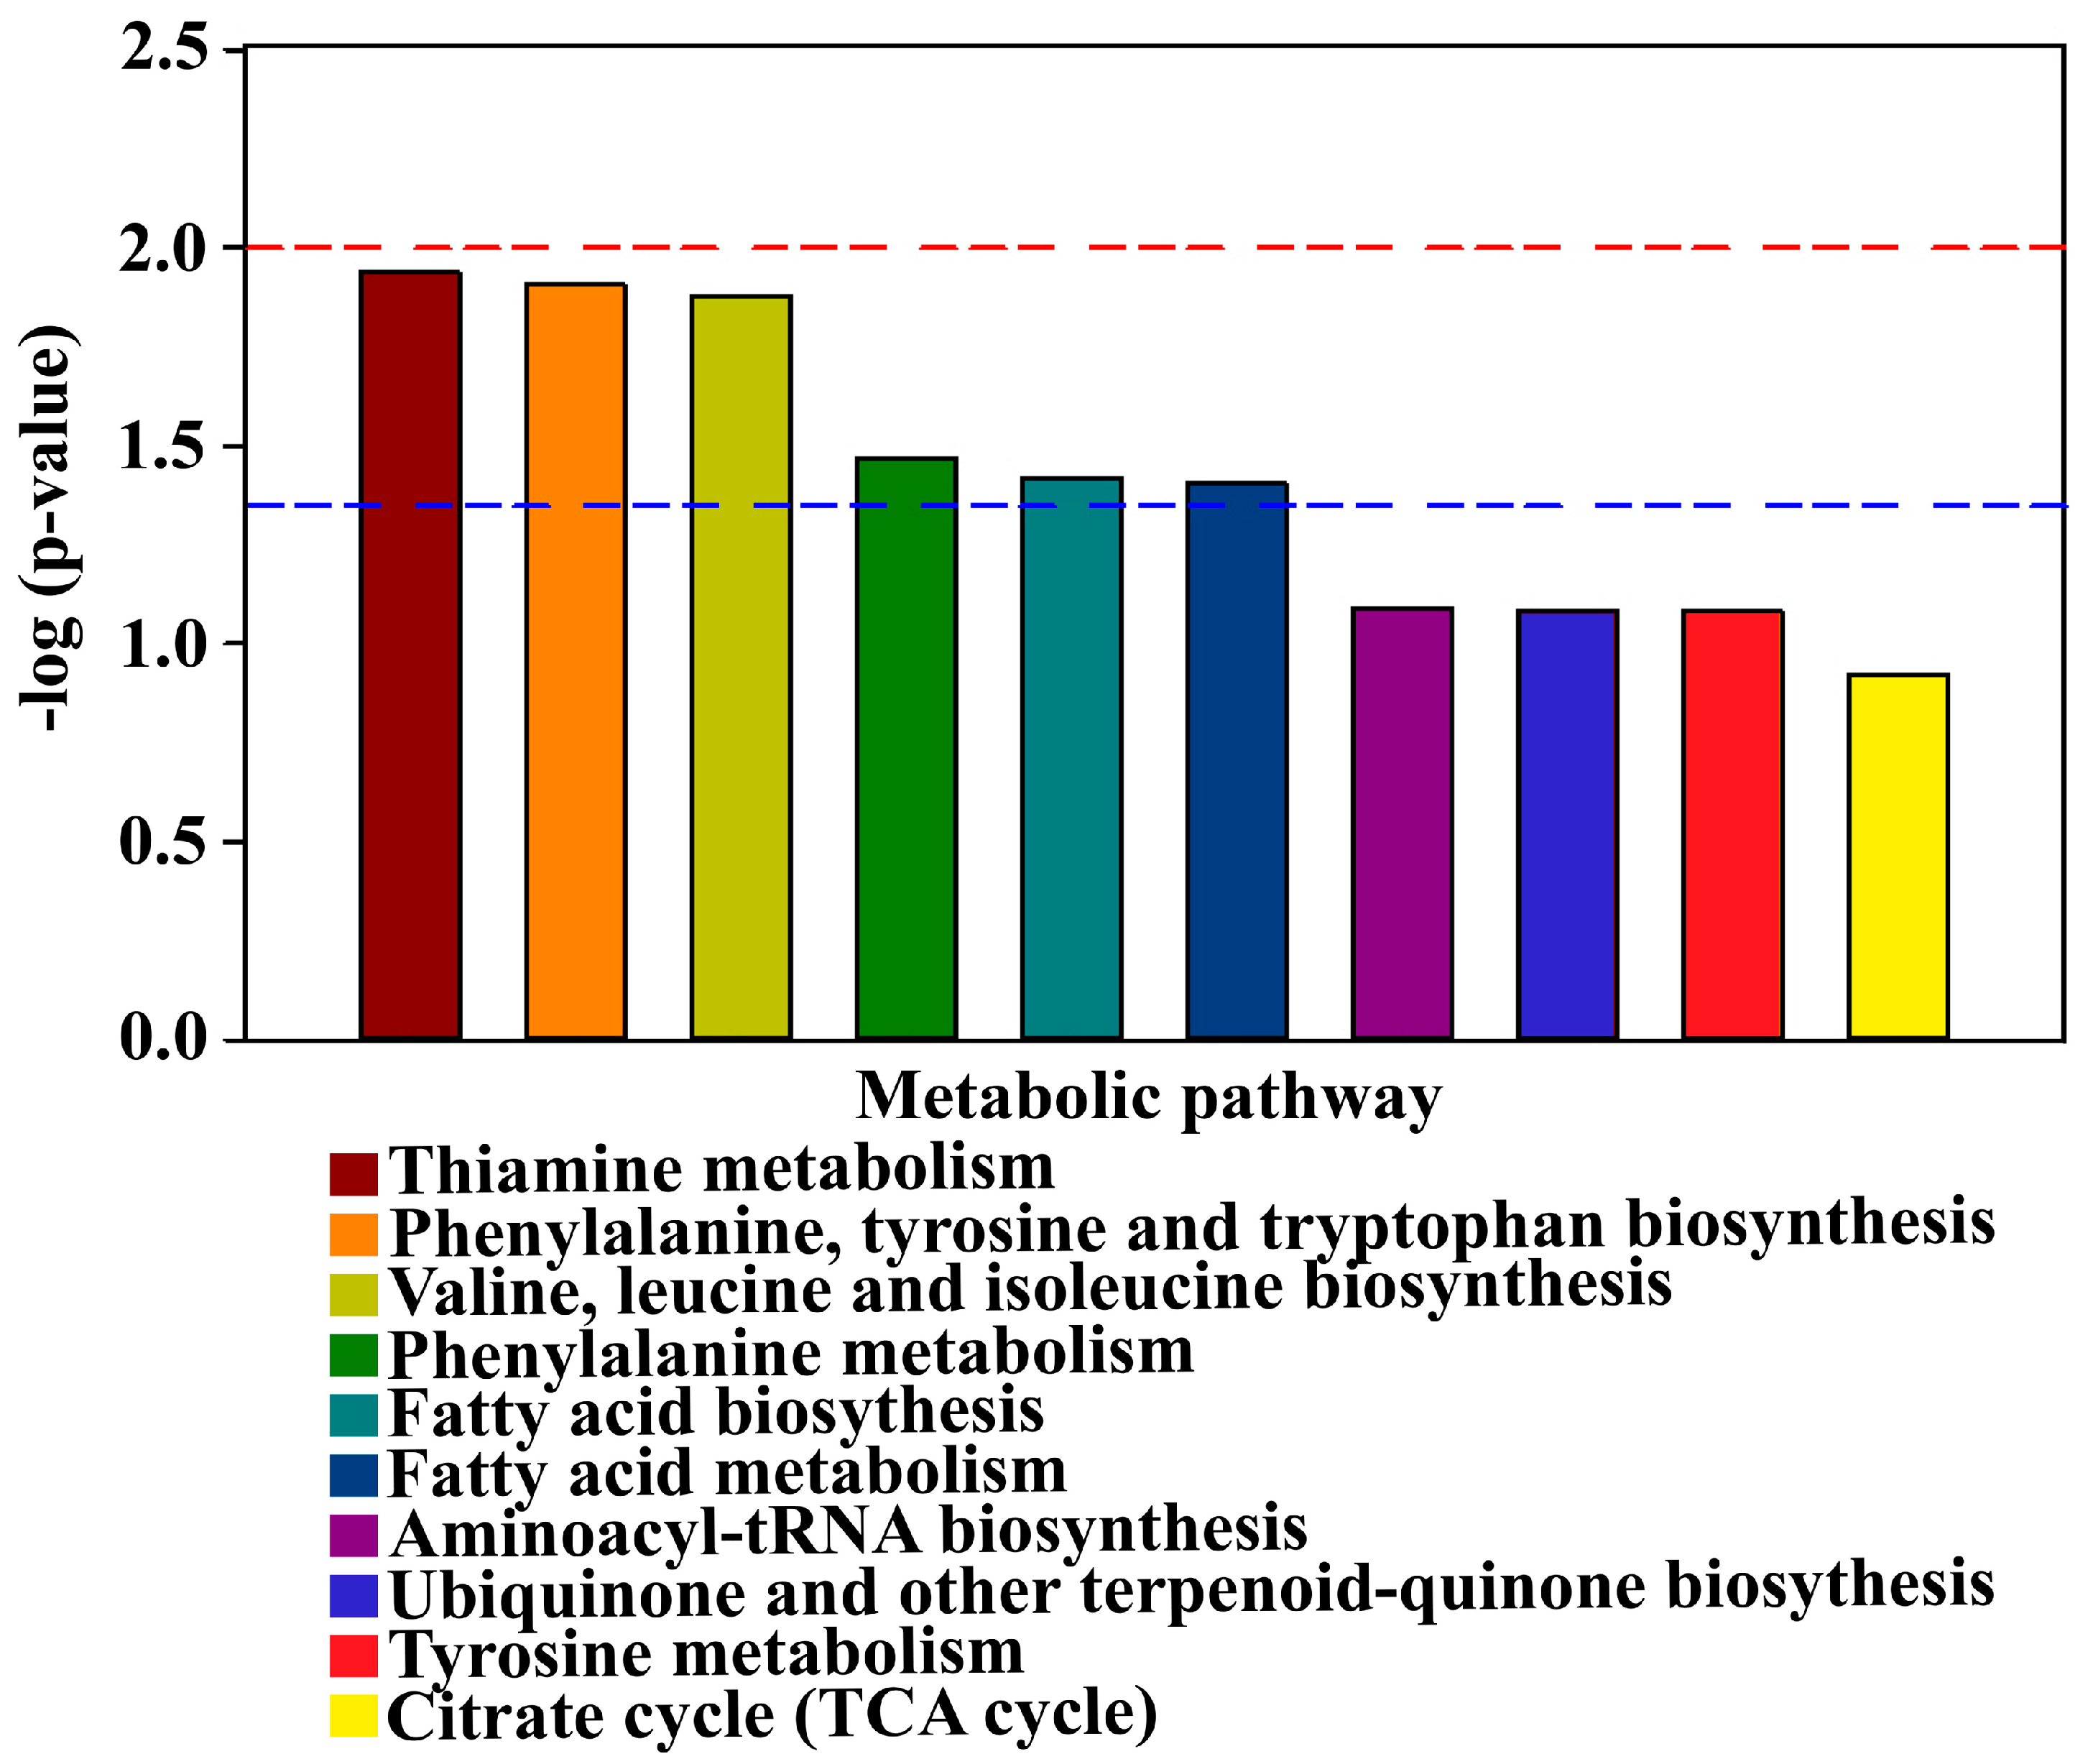
3.7. Analysis of Differential Metabolic Pathways
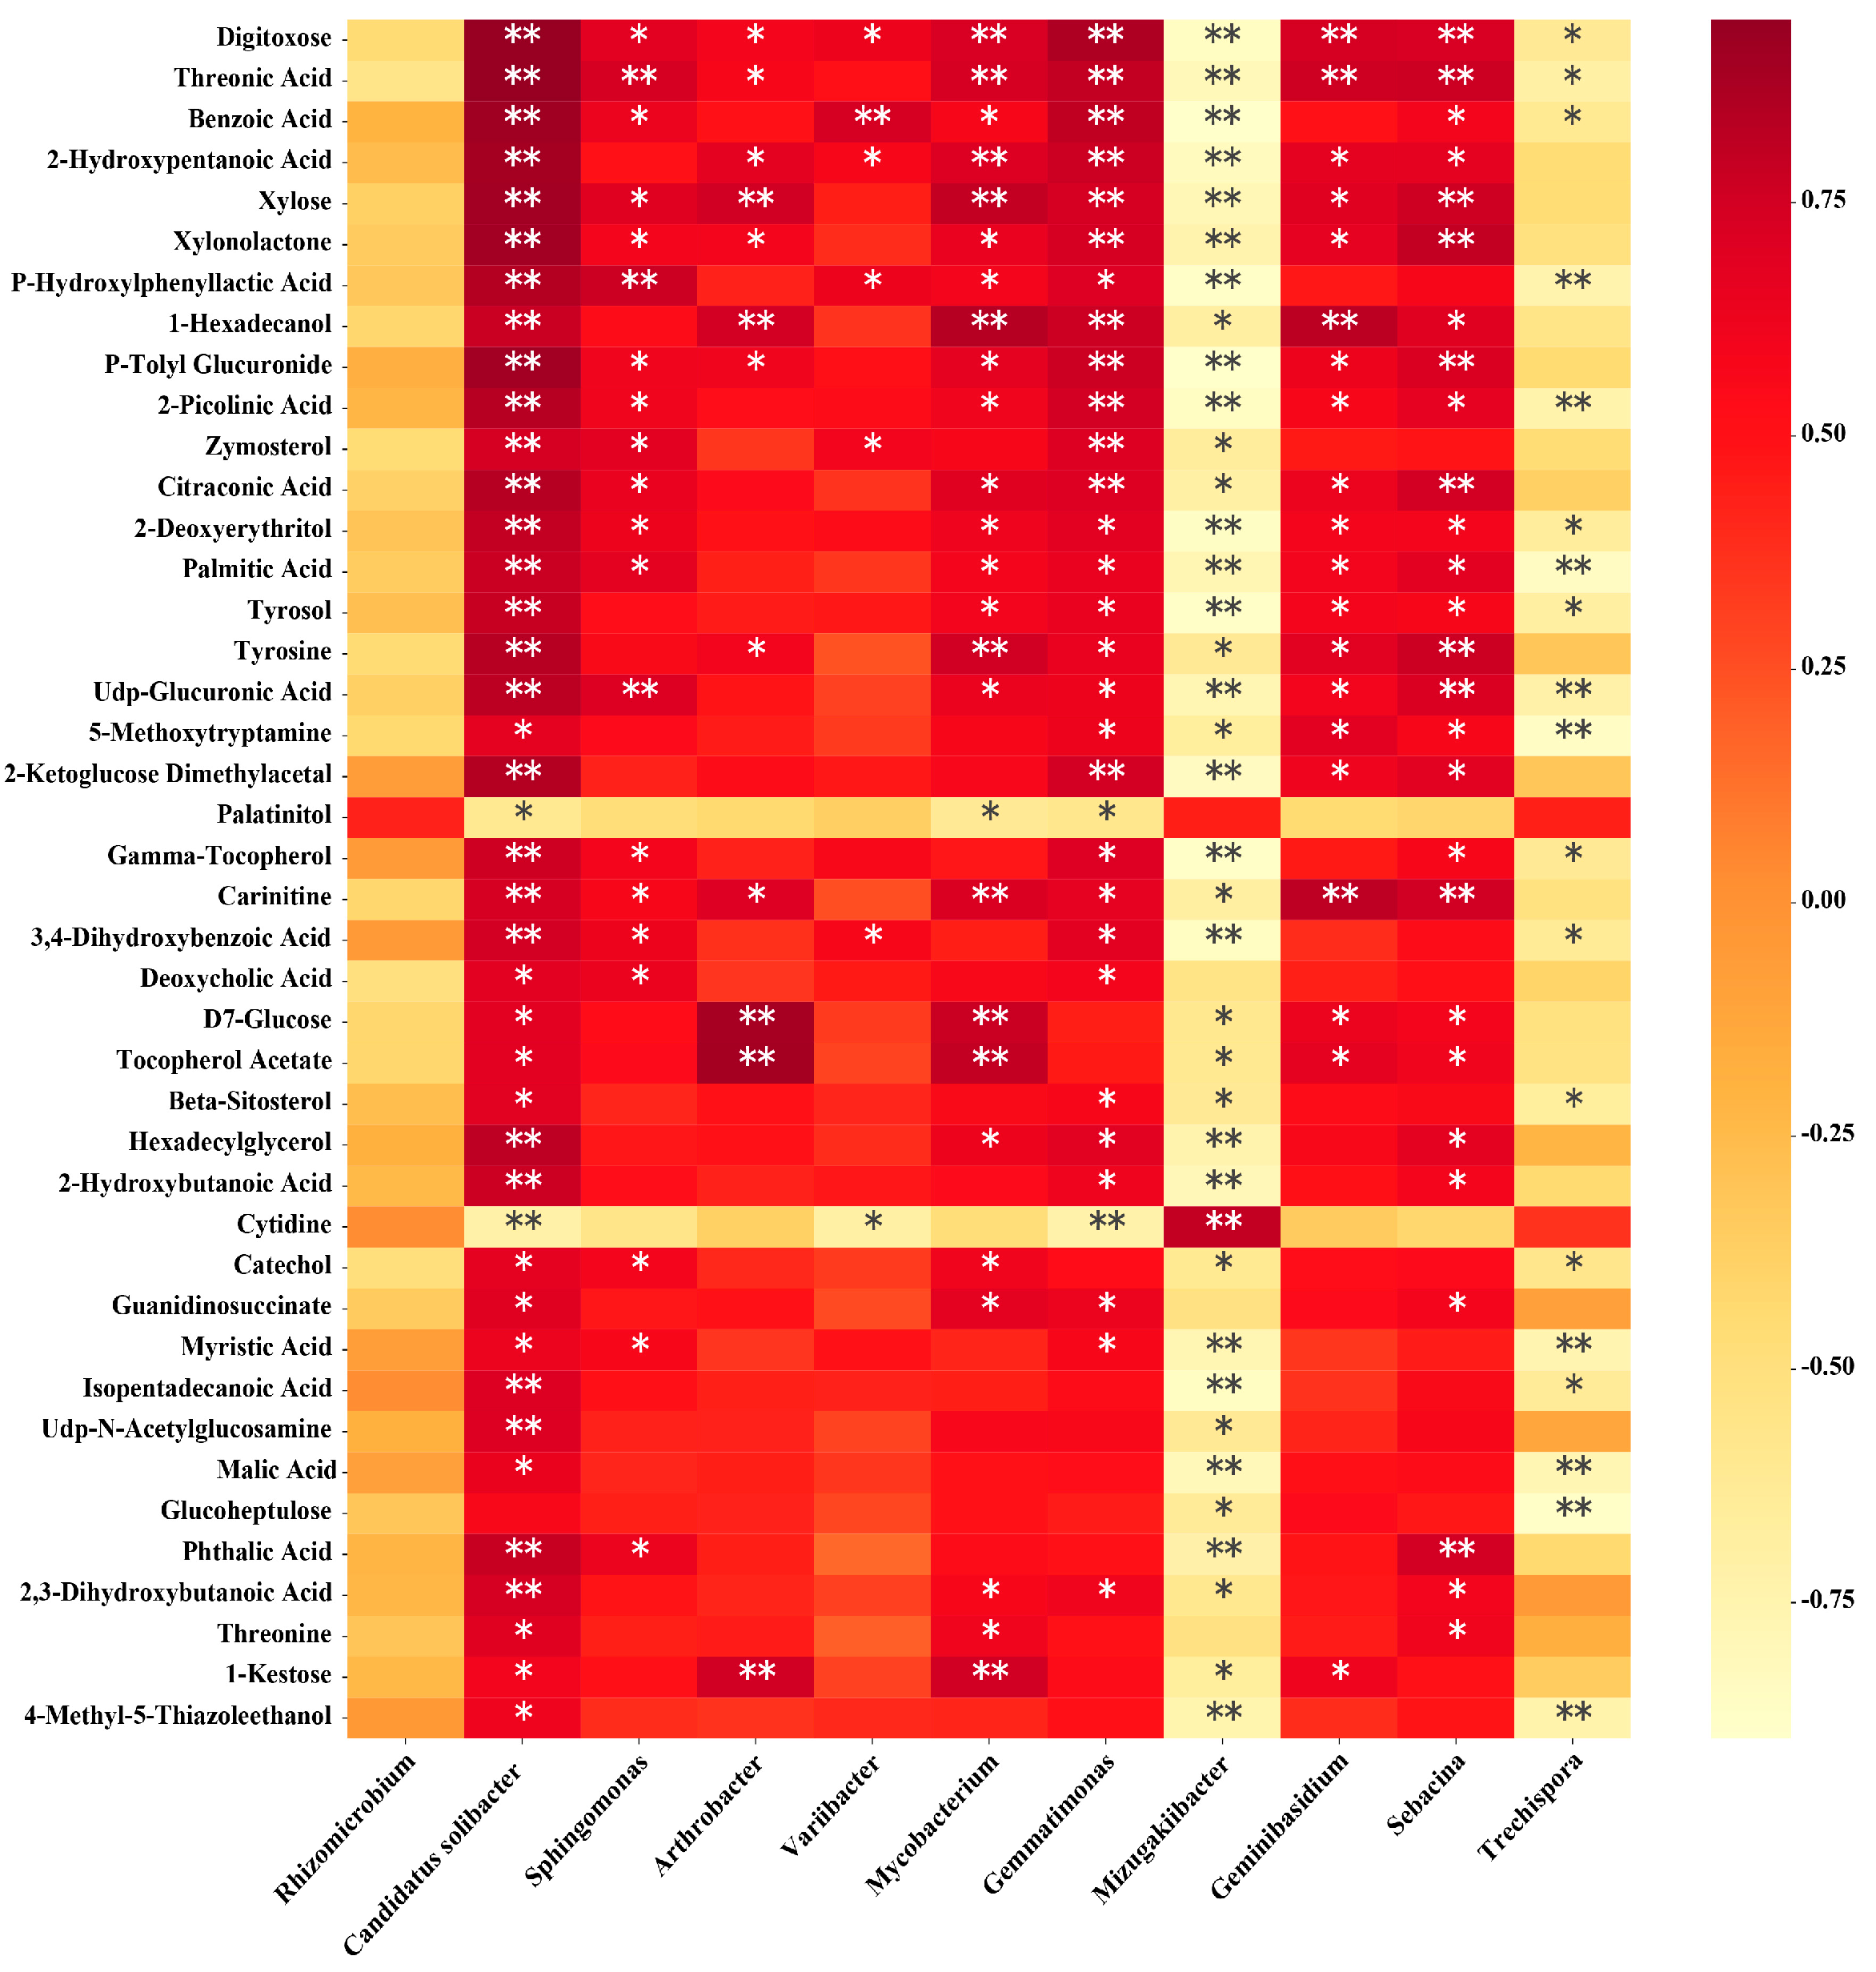
3.8. Correlation Analysis of Soil Microorganisms and Metabolites
4. Conclusions
Supplementary Materials
Author Contributions
Funding
Data Availability Statement
Acknowledgments
Conflicts of Interest
References
- Sun, C.; Huang, H.; Xu, C.; Li, X.; Chen, K. Biological Activities of Extracts from Chinese Bayberry (Myrica rubra Sieb. et Zucc.): A Review. Plant Foods Hum. Nutr. 2013, 68, 97–106. [Google Scholar] [CrossRef] [PubMed]
- Ren, H.Y.; Yu, H.Y.; Zhang, S.W.; Liang, S.M.; Qi, X.J. Genome sequencing provides insights into the evolution and antioxidant activity of Chinese bayberry. BMC Genom. 2019, 20, 458. [Google Scholar] [CrossRef] [PubMed]
- Ren, H.-Y.; Li, G.; Qi, X.-J.; Fang, L.; Wang, H.-R.; Wei, J.-G.; Zhong, S. Identification and characterization of Pestalotiopsis spp. causing twig blight disease of bayberry (Myrica rubra Sieb. & Zucc) in China. Eur. J. Plant Pathol. 2013, 137, 451–461. [Google Scholar] [CrossRef]
- Ren, H.Y.; Zheng, X.L.; Zhang, S.W.; Liang, S.M.; Wu, C.W.; Wang, K.Q.; Yu, Z.P.; Qi, X.J. The symptoms and nutritional status of weak diseased bayberry. Zhejiang Agri. Sci. 2020, 61, 93–98. (In Chinese) [Google Scholar]
- Ren, H.Y.; Wang, J.; Zheng, X.L.; Zhang, S.W.; Zou, X.Q.; Yu, Z.P.; Qi, X.J. Effect of bio-organic fertilizer on the improvement of nutrition and vigor of weak bayberry. Chin. Agri. Sci. Bull. 2021, 37, 127–137. (In Chinese) [Google Scholar]
- Tang, H.; Xiao, X.; Xu, Y.; Li, C.; Cheng, K.; Pan, X.; Li, W. Utilization of carbon sources in the rice rhizosphere and nonrhi-zosphere soils with different long-term fertilization management. J. Basic Microbiol. 2019, 59, 621–631. [Google Scholar] [CrossRef]
- Lucie, M.; Jakub, R.; Marketa, P.; Tomas, M.; Ondrej, U. Effects of secondary plant metabolites on microbial populations: Changes in community structure and metabolic activity in contaminated environments. Int. J. Mol. Sci. 2016, 17, 1205. [Google Scholar]
- Nossa, C.W.; Oberdorf, W.E.; Yang, L.Y.; Aas, J.A.; Paster, B.J.; DeSantis, T.Z.; Brodie, E.L.; Malamud, D.; Poles, M.A. Design of 16S rRNA gene primers for 454 pyrosequencing of the human foregut microbiome. World J. Gastroenterol. 2010, 16, 4135–4144. [Google Scholar] [CrossRef]
- Mukherjee, P.K.; Chandra, J.; Retuerto, M.; Sikaroodi, M.; Brown, R.E.; Jurevic, R.; Salata, R.A.; Lederman, M.M.; Gillevet, P.M.; Ghannoum, M.A. Oral mycobiome analysis of HIV-infected patients: Identification of pichia as an antagonist of opportunistic fungi. PLoS Pathog. 2014, 10, e1003996. [Google Scholar] [CrossRef]
- Bolger, A.M.; Lohse, M.; Usadel, B. Trimmomatic: A flexible trimmer for Illumina sequence data. Bioinformatics 2014, 30, 2114–2120. [Google Scholar] [CrossRef]
- Reyon, D.; Tsai, S.Q.; Khayter, C.; Foden, J.A.; Sander, J.D.; Joung, J.K. FLASH assembly of TALENs for high-throughput genome ed-iting. Nat. Biotechnol 2012, 30, 460–465. [Google Scholar] [CrossRef]
- Rognes, T.; Flouri, T.; Nichols, B.; Quince, C.; Mahé, F. VSEARCH: A versatile open source tool for metagenomics. PeerJ 2016, 4, e2584. [Google Scholar] [CrossRef]
- Caporaso, J.G.; Kuczynski, J.; Stombaugh, J.; Bittinger, K.; Bushman, F.D.; Costello, E.K.; Fierer, N.; Peña, A.G.; Goodrich, J.K.; Gordon, J.I.; et al. QIIME allows analysis of high-throughput community sequencing data. Nat. Methods 2010, 7, 335–336. [Google Scholar] [CrossRef]
- Wang, Q.; Garrity, G.M.; Tiedje, J.M.; Cole, J.R. Naive Bayesian classifier for rapid assignment of rRNA sequences into the new bacterial taxonomy. Appl. Environ. Microbiol. 2007, 73, 5261–5267. [Google Scholar] [CrossRef]
- Lobo, I. Basic Local Alignment Search Tool (BLAST). J. Mol. Biol. 2008, 215, 403–410. [Google Scholar]
- Chao, J.; Bunge, J. Estimatin the number of species in a stochastic abundance model. Biometrics 2002, 58, 531–539. [Google Scholar] [CrossRef]
- Hill, T.C.; Walsh, K.A.; Harris, J.A.; Moffett, B.F. Using ecological diversity measures with bacterial communities. FEMS Micorbiol. Ecol. 2003, 43, 1–11. [Google Scholar] [CrossRef]
- Qu, B.P.; Liu, Y.X.; Sun, X.Y.; Li, S.Y.; Wang, S.Y.; Xiong, K.Y.; Yun, B.H.; Zhang, H. Effect of various mulches on soil physi-co-Chemical properties and tree growth (Sophora japonica) in urban tree pits. PLoS ONE 2019, 14, e0210777. [Google Scholar] [CrossRef] [PubMed]
- Ma, M.; Zhou, J.; Ongena, M.; Liu, W.; Wei, D.; Zhao, B.; Guan, D.; Jiang, X.; Li, J. Effect of long-term fertilization strategies on bacterial community composition in a 35-year field experiment of Chinese Mollisols. AMB Express 2018, 8, 20. [Google Scholar] [CrossRef] [PubMed]
- Baran, A.; Mierzwa-Hersztek, M.; Gondek, K.; Tarnawski, M.; Szara, M.; Gorczyca, O.; Koniarz, T. The influence of the quantity and quality of sediment organic matter on the potential mobility and toxicity of trace elements in bottom sediment. Environ. Geochem. Health 2019, 41, 2893–2910. [Google Scholar] [CrossRef] [PubMed]
- Wu, Z.; Hao, Z.; Zeng, Y.; Guo, L.; Huang, L.; Chen, B. Molecular characterization of microbial communities in the rhizosphere soils and roots of diseased and healthy Panax notoginseng. Antonie Leeuwenhoek 2015, 108, 1059–1074. [Google Scholar] [CrossRef] [PubMed]
- Wang, L.G.; Shu, N.L.; Sun, K.G. The process of soybean continuous cropping obstacle and control teachnology. Soil Fert. Sci. Chin. 2001, 5, 3–8. [Google Scholar]
- Wang, L.; Li, J.; Yang, F.; Yaoyao, E.; Raza, W.; Huang, Q.W.; Shen, Q.R. Application of bioorganic fertilizer significantly in-creased apple yields and shaped bacterial community structure in orchard soil. Microb. Ecol. 2017, 73, 404–416. [Google Scholar] [CrossRef]
- Wang, N.; Wang, W.W.; Yao, Y.L.; Zhu, F.X.; Wang, W.P.; Chang, X.J. The influence of different concentrations of bio-organic fertilizer on cucumber Fusarium wilt and soil micro floralterations. PLoS ONE 2017, 12, e0171490. [Google Scholar]
- Kim, S.-K.; Chung, D.; Himmel, M.E.; Bomble, Y.J.; Westpheling, J. Heterologous expression of family 10 xylanases from Acidothermus cellulolyticus enhances the exoproteome of Caldicellulosiruptor bescii and growth on xylan substrates. Biotechnol. Biofuels 2016, 9, 1–10. [Google Scholar] [CrossRef][Green Version]
- Borrell, A.N.; Shi, Y.; Gan, Y.; Bainard, L.D.; Germida, J.J.; Hamel, C. Fungal diversity associates with pluses and its influence on the subsequent wheat crop in the Canadian prairies. Plant Soil. 2017, 414, 13–31. [Google Scholar] [CrossRef]
- Sallam, N.M.A.; Eraky, A.M.I.; Sallam, A. Effect of Trichoderma spp. on Fusarium wilt disease of tomato. Mol. Biol. Rep. 2019, 46, 4463–4470. [Google Scholar] [CrossRef]
- Buracco, S.; Peracino, B.; Andreini, C.; Bracco, E.; Bozzaro, S. Differential Effects of Iron, Zinc, and Copper on Dictyostelium discoideum Cell Growth and Resistance to Legionella pneumophila. Front. Cell. Infect. Microbiol. 2018, 7, 536. [Google Scholar] [CrossRef]
- Li, X.; Su, Y.; Ahmed, T.; Ren, H.; Javed, M.; Yao, Y.; An, Q.; Yan, J.; Li, B. Effects of Different Organic Fertilizers on Improving Soil from Newly Reclaimed Land to Crop Soil. Agriculture 2021, 11, 560. [Google Scholar] [CrossRef]
- Ali, A.; Lou, Y.; Hafeez, R.; Li, X.; Hossain, A.; Xie, T.; Lin, L.; Li, B.; Yin, Y.; Yan, J.; et al. Functional Analysis and Genome Mining Reveal High Potential of Biocontrol and Plant Growth Promotion in Nodule-Inhabiting Bacteria Within Paenibacillus polymyxa Complex. Front. Microbiol. 2021, 11, 618601. [Google Scholar] [CrossRef] [PubMed]
- Cao, C.; Tao, S.; Cui, Z.; Zhang, Y. Response of Soil Properties and Microbial Communities to Increasing Salinization in the Meadow Grassland of Northeast China. Microb. Ecol. 2021, 82, 722–735. [Google Scholar] [CrossRef] [PubMed]
- Zhou, J.; Fong, J.J. Strong agricultural management effects on soil microbial community in a non-experimental agroecosystem. Appl. Soil Ecol. 2021, 165, 103970. [Google Scholar] [CrossRef]
- Kooijman, A.; Morriën, E.; Akkerhuis, G.J.O.; Missong, A.; Bol, R.; Klumpp, E.; Van Hall, R.; Van Til, M.; Kalbitz, K.; Bloem, J. Resilience in coastal dune grasslands: pH and soil organic matter effects on P nutrition, plant strategies, and soil communities. Ecosphere 2020, 11, e03112. [Google Scholar] [CrossRef]
- Ogola, H.J.O.; Selvarajan, R.; Tekere, M. Local Geomorphological Gradients and Land Use Patterns Play Key Role on the Soil Bacterial Community Diversity and Dynamics in the Highly Endemic Indigenous Afrotemperate Coastal Scarp Forest Biome. Front. Microbiol. 2021, 12, 592725. [Google Scholar] [CrossRef]
- Steven, B.; LaReau, J.C.; Taerum, S.J.; Zuverza-Mena, N.; Cowles, R.S. What’s under the Christmas Tree? A Soil Sulfur Amendment Lowers Soil pH and Alters Fir Tree Rhizosphere Bacterial and Eukaryotic Communities, Their Interactions, and Functional Traits. Microbiol. Spectr. 2021, 9, e0016621. [Google Scholar] [CrossRef]
- De Boer, W.; Gerards, S.; Gunnewiek, P.J.A.K.; Modderman, R. Response of the chitinolytic microbial community to chitin amendments of dune soils. Biol. Fertil. Soils 1999, 29, 170–177. [Google Scholar] [CrossRef]
- Ahmed, S.; Bashir, A.; Saleem, H.; Saadia, M.; Jamil, A. Production and purification of cellulose-degrading enzymes from a filamentous fungus Trichoderma harzianum. Pak. J. Bot. 2009, 41, 1411–1419. [Google Scholar]
- Xun, W.; Liu, Y.; Li, W.; Ren, Y.; Xiong, W.; Xu, Z.; Zhang, N.; Miao, Y.; Shen, Q.; Zhang, R. Specialized metabolic functions of keystone taxa sustain soil microbiome stability. Microbiome 2021, 9, 1–15. [Google Scholar] [CrossRef] [PubMed]
- Pizarro-Tobias, P.; Ramos, J.L.; Duque, E.; Roca, A. Plant growth-stimulating rhizobacteria capable of producing L-amino acids. Environ. Microbiol. Rep. 2020, 12, 667–671. [Google Scholar] [CrossRef]
- Wang, C.; Wu, B.; Jiang, K. Allelopathic effects of Canada goldenrod leaf extracts on the seed germination and seedling growth of lettuce reinforced under salt stress. Ecotoxicology 2019, 28, 103–116. [Google Scholar] [CrossRef]
- Zhou, X.; Wu, F. p-Coumaric Acid Influenced Cucumber Rhizosphere Soil Microbial Communities and the Growth of Fusarium oxysporum f.sp. cucumerinum Owen. PLoS ONE 2012, 7, e48288. [Google Scholar] [CrossRef]
- Zhang, Y.; Tao, Y.; Zhang, H.; Wang, L.; Sun, G.Q.; Sun, X.; Erinle, K.O.; Feng, C.C.; Song, Q.X.; Li, M. Effect of di-n-butyl phthalate on root physiology and rhizosphere microbial community of cucumber seedings. J. Hazard Mater. 2015, 289, 9–17. [Google Scholar] [CrossRef] [PubMed]
- Zhao, L.; Zhang, H.; White, J.C.; Chen, X.; Li, H.; Qu, X.; Ji, R. Metabolomics reveals that engineered nanomaterial exposure in soil alters both soil rhizosphere metabolite profiles and maize metabolic pathways. Environ. Sci. Nano 2019, 6, 1716–1727. [Google Scholar] [CrossRef]
- Tian, L.Y.; Shen, J.P.; Sun, G.X.; Wang, B.; Ji, R.; Zhao, L.J. Foliar application of SiO2 nanoparticles alters soil metabolite pro-files and microbial community composition in the pakchoi (Brassica chinensis L.) rhizosphere grown in contaminated mine soil. Environ. Sci. Technol. 2020, 54, 13137–13146. [Google Scholar] [CrossRef] [PubMed]
- Ghimire, B.K.; Ghimire, B.; Yu, C.Y.; Chung, I.M. Allelopathic and autotoxic effects of medicago sativa-derived allelochemicals. Plants 2019, 8, 233. [Google Scholar] [CrossRef]
- Neal, A.L.; Ahmad, S.; Gordon-Weeks, R.; Ton, J. Benzoxazinoids in Root Exudates of Maize Attract Pseudomonas putida to the Rhizosphere. PLoS ONE 2012, 7, e35498. [Google Scholar] [CrossRef] [PubMed]
- Huang, X.-F.; Chaparro, J.M.; Reardon, K.; Zhang, R.; Shen, Q.; Vivanco, J.M. Rhizosphere interactions: Root exudates, microbes, and microbial communities. Botany 2014, 92, 267–275. [Google Scholar] [CrossRef]
- Patra, B.; Ray, S.; Richter, A.; Majumder, A.L. Enhanced salt tolerance of transgenic tobacco plants by co-expression of PcINO1 and McIMT1 is accompanied by increased level of myo-inositol and methylated inositol. Protoplasma 2010, 245, 143–152. [Google Scholar] [CrossRef]


| Microorganism | Treatment | Chao1 Index | Shannon Index | OTUs |
|---|---|---|---|---|
| Bacteria | Healthy | 2295.77 ± 174.80 | 8.54 ± 0.17 | 1685.50 ± 141.60 |
| Diseased | 2071.23 ± 234.20 # | 7.86 ± 0.76 | 1575.33 ± 211.98 | |
| Fungi | Healthy | 1005.80 ± 155.13 | 6.04 ± 0.50 | 909.67 ± 135.91 |
| Diseased | 883.69 ± 68.78 # | 6.12 ± 0.28 | 814.17 ± 70.56 |
| Parameters | Value | Parameters | Value |
|---|---|---|---|
| pH | Available phosphorus (mg/kg) | ||
| H | 5.17 ± 0.23 | H | 16.64 ± 0.50 |
| D | 4.69 ± 0.39 # | D | 30.78 ± 0.50 * |
| Organic matter (%) | Available calcium (mg/kg) | ||
| H | 4.38 ± 0.13 | H | 591.50 ± 20.17 |
| D | 2.80 ± 0.12 # | D | 348.33 ± 9.49 # |
| Available nitrogen (mg/kg) | Magnesium (mg/kg) | ||
| H | 147.38 ± 6.01 | H | 53.58 ± 3.00 |
| D | 117.90 ± 4.58 # | D | 35.54 ± 1.12 # |
| Taxa | Soil Environment | Contribution (%) |
|---|---|---|
| Bacteria | ||
| pH | 19.5 | |
| Organic Matter | 33.3 | |
| Available Nitrogen | 33.9 | |
| Available Phosphorus | 33.1 | |
| Available Calcium | 30.6 | |
| Magnesium | 36.6 | |
| Fungi | ||
| pH | 14.9 | |
| Organic Matter | 30.1 | |
| Available Nitrogen | 22.6 | |
| Available Phosphorus | 25.3 | |
| Available Calcium | 24.5 | |
| Magnesium | 28.8 |
| Metabolite Name | Relative Content | Metabolite Name | Relative Content |
|---|---|---|---|
| Palatinitol | Benzoic Acid | ||
| H | 1.03 ± 0.12 | H | 3.69 ± 0.28 |
| D | 3.44 ± 0.79 * | D | 2.45 ± 0.40 # |
| Cytidine | 2-Hydroxypentanoic Acid | ||
| H | 1.66 ± 0.15 | H | 1.96 ± 0.23 |
| D | 18.40 ± 3.39 * | D | 1.51 ± 0.16 # |
| Citraconic Acid | 2-Ketoglucose Dimethylacetal | ||
| H | 7.05 ± 0.67 | H | 0.23 ± 0.03 |
| D | 5.12 ± 0.51 # | D | 0.16 ± 0.05 # |
| Hexadecyl glycerol | 1-Kestose | ||
| H | 5.89 ± 0.75 | H | 52.15 ± 4.21 |
| D | 3.87 ± 0.40 # | D | 24.28 ± 2.97 # |
| Guanidinosuccinate | D7-Glucose | ||
| H | 0.50 ± 0.05 | H | 2.29 ± 1.00 |
| D | 0.36 ± 0.02 # | D | 0.87 ± 0.21 # |
| Udp-N-Acetylglucosamine | Tocopherol Acetate | ||
| H | 0.98 ± 0.09 | H | 3.84 ± 0.89 |
| D | 0.77 ± 0.07 # | D | 1.20 ± 0.16 # |
| 2,3-Dihydroxybutanoic Acid | 1-Hexadecanol | ||
| H | 1.28 ± 0.08 | H | 6.59 ± 1.11 |
| D | 1.06 ± 0.10 # | D | 4.22 ± 0.61 # |
| Tyrosine | Carnitine | ||
| H | 2.70 ± 0.32 | H | 9.95 ± 1.73 |
| D | 1.91 ± 0.12 # | D | 4.33 ± 0.97 # |
| Threonine | Beta-Sitosterol | ||
| H | 2.21 ± 0.24 | H | 2.64 ± 0.65 |
| D | 1.68 ± 0.17 # | D | 1.64 ± 0.12 # |
| Catechol | 5-Methoxytryptamine | ||
| H | 0.37 ± 0.02 | H | 57.95 ± 5.44 |
| D | 0.28 ± 0.08 # | D | 38.13 ± 2.79 # |
| Zymosterol | Glucoheptulose | ||
| H | 0.85 ± 0.09 | H | 5.51 ± 0.35 |
| D | 0.46 ± 0.03 # | D | 3.90 ± 0.51 # |
| Deoxycholic Acid | 2-Picolinic Acid | ||
| H | 0.76 ± 0.09 | H | 3.03 ± 0.28 |
| D | 0.45 ± 0.01 # | D | 1.81 ± 0.10 # |
| Tyrosol | Gamma-Tocopherol | ||
| H | 0.66 ± 0.05 | H | 1.88 ± 0.17 |
| D | 0.45 ± 0.03 # | D | 1.09 ± 0.17 # |
| 2-Deoxyerythritol | 3,4-Dihydroxybenzoic Acid | ||
| H | 2.48 ± 0.17 | H | 9.86 ± 0.82 |
| D | 1.52 ± 0.18 # | D | 5.52 ± 0.18 # |
| 2-Hydroxybutanoic Acid | Malic Acid | ||
| H | 2.07 ± 0.14 | H | 1.65 ± 0.12 |
| D | 1.11 ± 0.13 # | D | 1.26 ± 0.15 # |
| P-Hydroxylphenyllactic Acid | 4-Methyl-5-Thiazoleethanol | ||
| H | 1.38 ± 0.18 | H | 0.36 ± 0.03 |
| D | 0.69 ± 0.09 # | D | 0.28 ± 0.07 # |
| Digitoxose | Myristic Acid | ||
| H | 6.62 ± 0.48 | H | 3.14 ± 0.15 |
| D | 3.30 ± 0.29 # | D | 2.19 ± 0.23 # |
| Threonic Acid | Isopentadecanoic Acid | ||
| H | 1.45 ± 0.12 | H | 0.51 ± 0.04 |
| D | 0.86 ± 0.04 # | D | 0.38 ± 0.01 # |
| Xylonolactone | Phthalic Acid | ||
| H | 1.68 ± 0.14 | H | 2.14 ± 0.29 |
| D | 1.28 ± 0.14 # | D | 1.70 ± 0.30 # |
| Xylose | Palmitic Acid | ||
| H | 1.16 ± 0.14 | H | 13.90 ± 1.03 |
| D | 0.79 ± 0.10 # | D | 10.39 ± 2.02 # |
| P-Tolyl Glucuronide | Udp-Glucuronic Acid | ||
| H | 0.48 ± 0.05 | H | 0.41 ± 0.04 |
| D | 0.31 ± 0.08 # | D | 0.32 ± 0.05 # |
Publisher’s Note: MDPI stays neutral with regard to jurisdictional claims in published maps and institutional affiliations. |
© 2021 by the authors. Licensee MDPI, Basel, Switzerland. This article is an open access article distributed under the terms and conditions of the Creative Commons Attribution (CC BY) license (https://creativecommons.org/licenses/by/4.0/).
Share and Cite
Ren, H.; Wang, H.; Qi, X.; Yu, Z.; Zheng, X.; Zhang, S.; Wang, Z.; Zhang, M.; Ahmed, T.; Li, B. The Damage Caused by Decline Disease in Bayberry Plants through Changes in Soil Properties, Rhizosphere Microbial Community Structure and Metabolites. Plants 2021, 10, 2083. https://doi.org/10.3390/plants10102083
Ren H, Wang H, Qi X, Yu Z, Zheng X, Zhang S, Wang Z, Zhang M, Ahmed T, Li B. The Damage Caused by Decline Disease in Bayberry Plants through Changes in Soil Properties, Rhizosphere Microbial Community Structure and Metabolites. Plants. 2021; 10(10):2083. https://doi.org/10.3390/plants10102083
Chicago/Turabian StyleRen, Haiying, Hongyan Wang, Xingjiang Qi, Zheping Yu, Xiliang Zheng, Shuwen Zhang, Zhenshuo Wang, Muchen Zhang, Temoor Ahmed, and Bin Li. 2021. "The Damage Caused by Decline Disease in Bayberry Plants through Changes in Soil Properties, Rhizosphere Microbial Community Structure and Metabolites" Plants 10, no. 10: 2083. https://doi.org/10.3390/plants10102083
APA StyleRen, H., Wang, H., Qi, X., Yu, Z., Zheng, X., Zhang, S., Wang, Z., Zhang, M., Ahmed, T., & Li, B. (2021). The Damage Caused by Decline Disease in Bayberry Plants through Changes in Soil Properties, Rhizosphere Microbial Community Structure and Metabolites. Plants, 10(10), 2083. https://doi.org/10.3390/plants10102083