Article

Soil Bacteria to Regulate Phoebe bournei Seedling Growth and Sustainable Soil Utilization under NPK Fertilization

1
College of Forestry, Fujian Agriculture and Forestry University, Fuzhou 350002, China
2
Fujian Academy of Forestry Sciences, Fuzhou 350002, China
3
Department of Forest and Conservation Sciences, Faculty of Forestry, University of British Columbia, 2424 Main Mall, Vancouver, BC V6T 1Z4, Canada
*
Authors to whom correspondence should be addressed.
Plants 2021, 10(9), 1868; https://doi.org/10.3390/plants10091868
Submission received: 23 July 2021 / Revised: 31 August 2021 / Accepted: 7 September 2021 / Published: 9 September 2021
(This article belongs to the Special Issue Plant-Soil Interactions: From Soil Fertility to Crop Growth)

Abstract

:
Soil bacteria play a key role in the plant–soil system and can regulate the growth of Phoebe bournei seedlings under fertilization. However, there are few reports on how soil bacteria respond to fertilization and regulate seedling growth. This study adopted the “3414” field fertilization experiment, combined with soil microbial sequencing, nutrient contents, and biomass measurement, to explore the changes of soil chemical properties and bacterial structure under different NPK fertilization conditions and to establish the coupling relationship between soil bacteria, soil nutrients, and plant growth. The results showed that NPK fertilization decreased soil pH; increased soil N, P, and K content; reduced bacterial diversity and abundance; promoted the growth of dominant bacterial species; and enhanced Phoebe bournei seedlings’ soil N, P, and K elements. NPK fertilization promoted Proteobacteria growth, especially of three genera (Methylobacterium, Sphingobium, and Acinetobacter) and Actinobacteria, while it decreased Acidobacteria and Chloroflexi. By reducing the ratio of N to K and increasing P, NPK fertilization can slow soil acidification, promote bacterial reproduction, maintain P. bournei seedlings’ soil ecological stability, and balance the seedlings’ growth and sustainable soil utilization. AD3, Pseudomonas, and Rhodanobacter can be used as the marker species for N, P, and K fertilization, respectively, while Methylobacterium, Brevundimonas, Acinetobacter, and Sphingobium can be used as indicator species for soil pH and soil N, P, and K content changes, respectively. These results provided a theoretical basis and technical guidance for the effective fertilization and cultivation of robust P. bournei seedlings.

1. Introduction

Soil microorganisms, the main driving force of soil material circulation, have a direct relationship with soil fertility and play an essential role in determining soil properties and affecting plant growth [1,2,3]. Bacteria account for about 70~90% of the soil microbial population [4,5] and participate in a variety of soil physical and chemical processes, such as decomposition of soil organic matter, formation of humus, and transformation and circulation of nutrients. Soil bacteria not only perform soil material transformation but also store plant nutrient elements and can be used as the measurement index of soil quality [6,7,8,9]. At the same time, bacteria are sensitive to environmental changes and can also be used as an early indicator of soil changes [10]. Thus, studying soil bacteria is particularly important.
Soil bacteria play an important role in the material circulation and energy flow of the plant–soil system [11]. Changes in the soil environment are expected to lead to a change in bacterial adaptability as well as an effect on its community structure [12]. Fertilization affects the transformation and storage of the available nutrients in soil, leading to changes in the physical and chemical properties of soil, and strongly affects the diversity and abundance of soil bacteria, which, in turn, may influence plant growth and quality [13,14,15]. The addition of NPK fertilizer is expected to influence bacterial community structure, and its impact is not conclusive and somewhat controversial. Research results have indicated that the combined application of NPK fertilizer has no significant effect on soil bacterial diversity [16], while others have argued that it could have a diversity reduction effect [17]. However, inorganic fertilizer can change nutrient-rich and nutrient-poor bacteria in soil, which their relative abundance can be used as a microbial index to indicate and predict soil nutrient content [18,19]. Studying the influence of fertilization on changing soil bacterial community diversity and abundance is of importance in regulating soil microbial community structure, improving plant productivity, and promoting the sustainable utilization of soil.
In addition to soil factors, soil bacteria are also affected by plant types [20]. Soil microorganisms and plants act in a mutualistic manner so that different plants are associated with different enrichment microorganisms [21]. Phoebe bournei (Hemsl.) Yang is a rare, endemic, and endangered tree species in China with high economic and ecological value [22]. Bacteria have been reported to be the main soil microorganism component of P. bournei, accounting for 98.2~99.8% [23]. P. bournei seedling growth (height and ground diameter) can be regulated by the application of bacterial and NPK fertilizers [24,25]; however, few reports on the effects of fertilization on soil bacterial community structure, and how bacteria regulate seedling growth are available.
High-throughput sequencing has facilitated studying bacteria, specifically those species that are difficult to culture, and allowed the generation of information on soil bacterial community structure and growth [26]. Furthermore, the “3414” balanced fertilization protocol, with its advantages of empirical, forest nutrition diagnosis, and formula fertilization methods, offers strong practicability and operability and is widely implemented in fertilization experiments [27]. Here, we combine the use of soil microbial sequencing and the “3414” fertilization protocol to assess nutrient content and biomass in the soil and P. bournei seedlings, as well as soil bacterial structure changes under different fertilization conditions. Furthermore, we attempted to establish the coupling relationship between soil bacteria, soil nutrients, and plant growth to identify the key bacteria driving soil nutrient cycling and seedling growth. We anticipate that this work will contribute to our understanding of P. bournei seedlings’ living environmental mechanisms, the soil bacteria regulating seedling growth, and the sustainable utilization of soil under N, P, and K fertilization and will provide guidance for the species’ robust cultivation and rational fertilization.

2. Results

2.1. Effect of NPK Fertilization on Phoebe bournei Seedlings’ Soil Chemical Characteristics

Different NPK fertilization treatments significantly affected the soil pH and N, P, and K contents of P. bournei seedlings (Table 1). With the exception of T2, soil N contents of all treatments were higher than the control (T1), with T11 and T2 representing the highest and lowest values, respectively. Soil P contents were lower than the control (T1); however, T3, T6, T8, and T9 produced higher values, with T8 and T4 representing the highest and lowest values, respectively. Soil K contents of all treatments were higher than the control (T1), with T7 and T13 representing the highest and lowest values, respectively. With the exception of T2, soil pH of all treatments was lower than the control (T1). Generally, as determined by the multiple range tests, the three-factor (N, P, and K) fertilizer had the greatest influence on soil pH and N, P, and K contents, followed by two factors and a single factor. In the seven NPK fertilization combinations, N fertilizer had the least effect on soil K content, and, similarly, the P fertilizer had a minimal effect on soil N and P content and pH value.

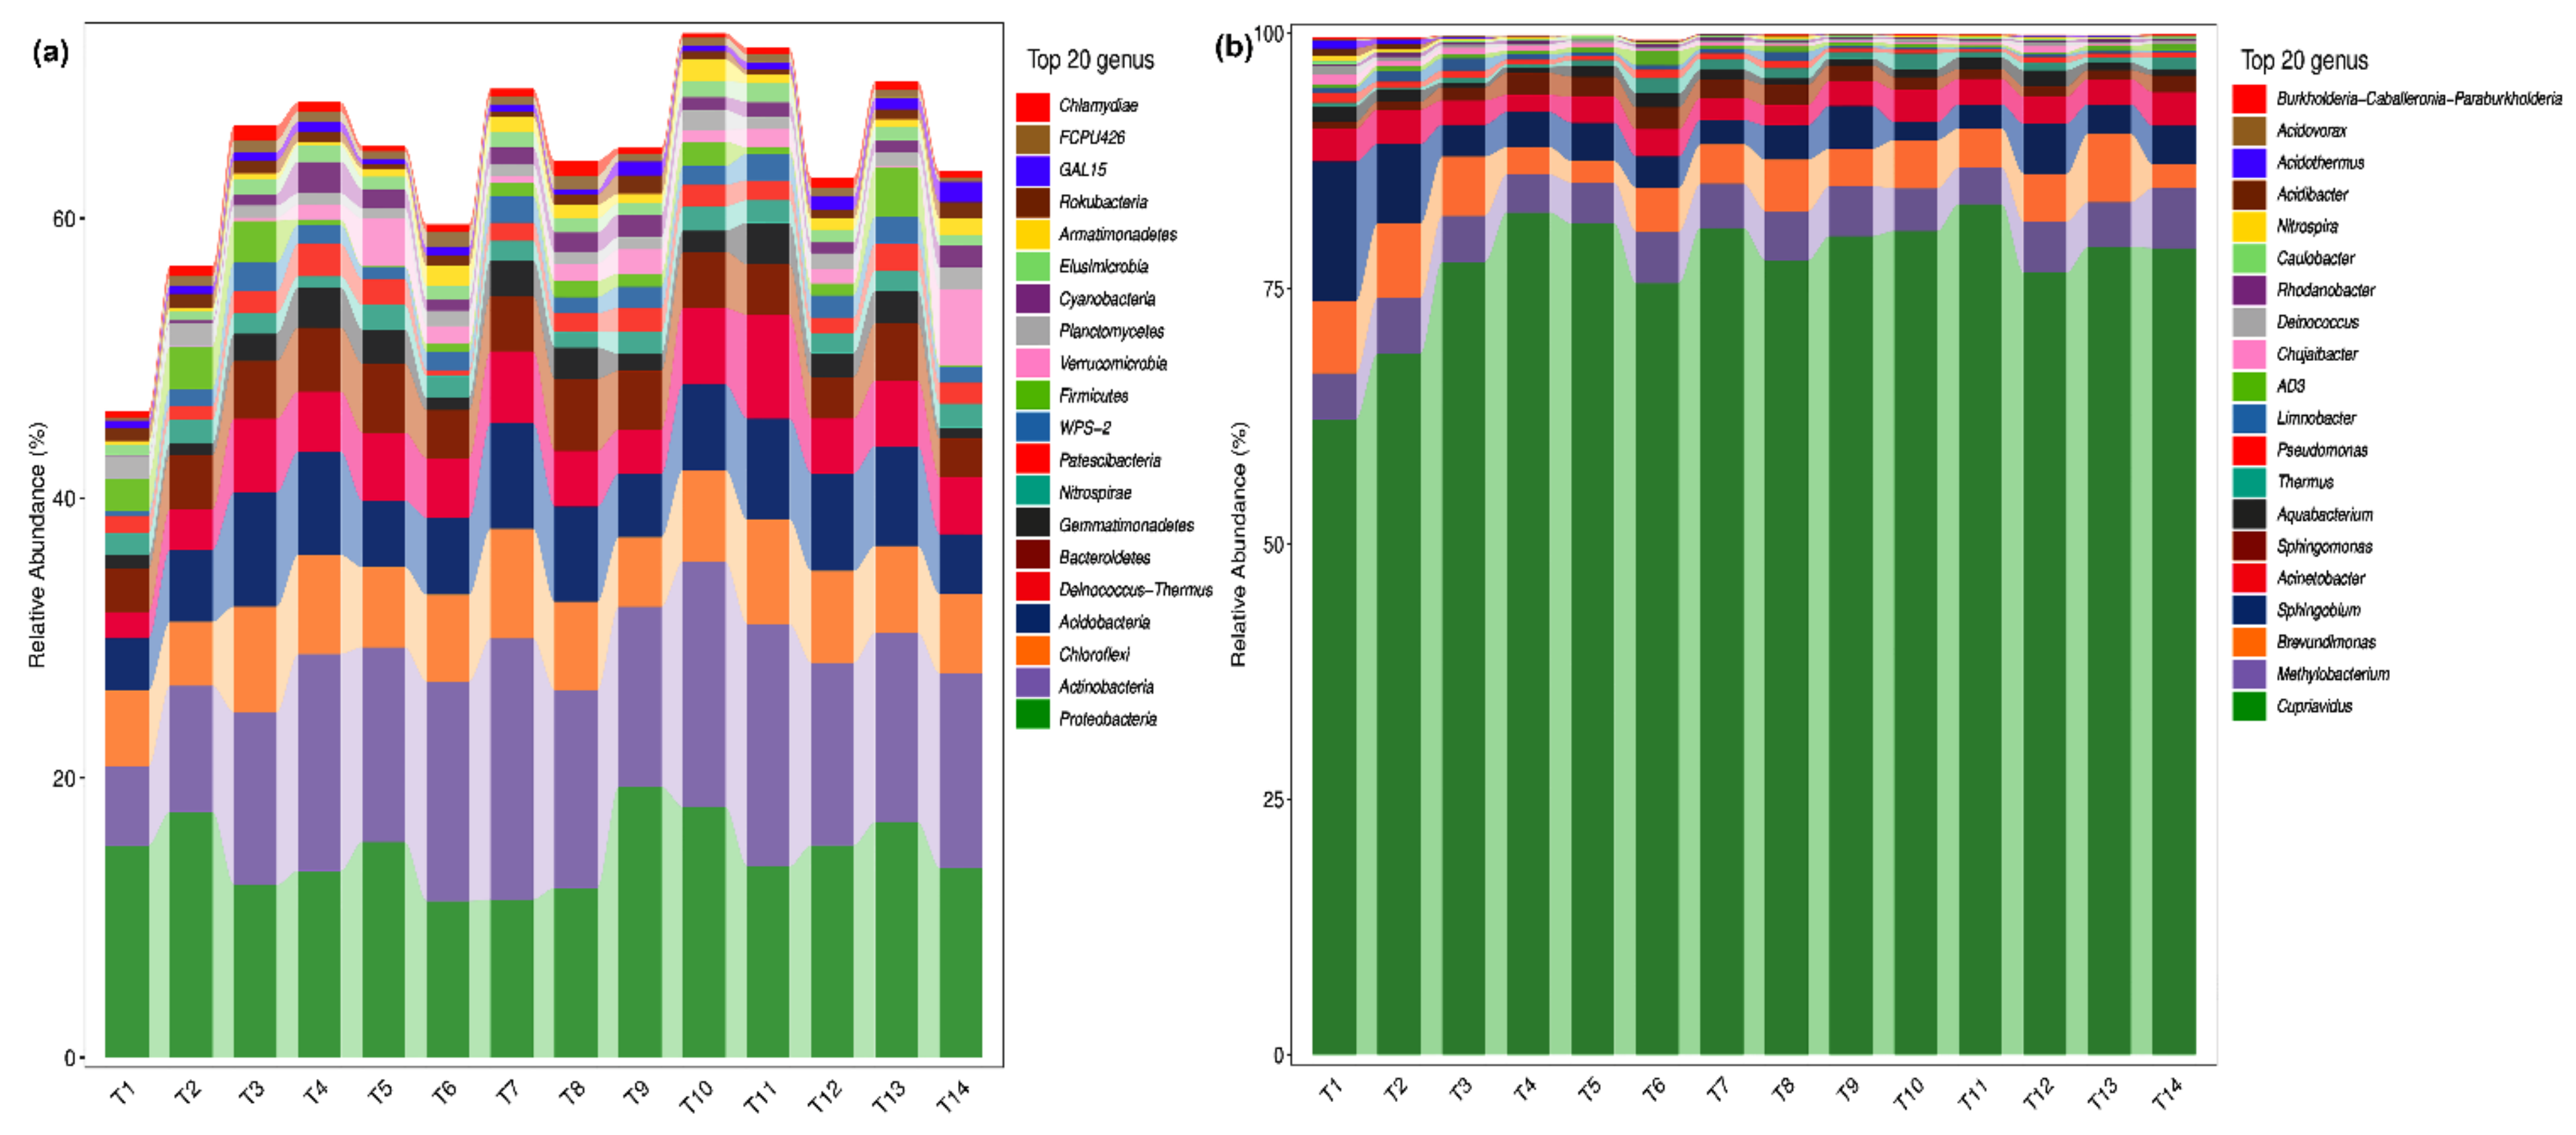
2.2. Analysis of Microbial Species Composition of Phoebe bournei Seedlings’ Soil at the Phylum and Genus Levels

The composition and abundance of soil microorganisms under different fertilization treatments were obtained at the taxonomic level of phyla and genera by QIIME software. The top 20 species of relative abundance at the genus level are illustrated in Figure 1a. Among them, 15 genera were with >1% relative abundance, accounting for 61.0% of total genera. These include: Cupriavidus (14.6%), Methylobacterium (13.7%), Brevundimonas (6.3%), Sphingobium (6.1%), Acinetobacter (4.4%), Sphingomonas (3.9%), Aquabacterium (1.8%), Thermus (1.5%), Pseudomonas (1.4%), Limnobacter (1.4%), AD3 (1.4%), Chujaibacter (1.3%), Deinococcus (1.1%), Rhodanobacter (1.1%), and Caulobacter (1.0%), indicating that Cupriavidus, Methylobacterium, Brevundimonas, Sphingobium, Acinetobacter, and Sphingomonas were the dominant bacteria genera in P. bournei seedlings’ soil. The sum of relative abundance of dominant genera under each fertilization treatment was greater than the control (T1), indicating that NPK fertilization promoted dominant genera bacteria growth. Minimum abundance of Methylobacterium, Sphingobium, and Acinetobacter was observed in the control (T1), indicating that NPK fertilization increased their growth. Maximum abundance of Cupriavidus, Brevundimonas, and Sphingomonas was observed in T9, T7, and T8, while the minimum was observed in T6, T2, and T14, indicating that only an appropriate NPK fertilization ratio could improve their growth. The best Brevundimonas and Sphingomonas growth was observed under high-P and no-K fertilizer levels, while the worst Brevundimonas growth was observed under no-N fertilizer.
At the phylum level, the top 20 species of relative abundance included 7 phyla with >1% relative abundance, accounting for 95.8% of the total. These include: Proteobacteria (77.5%), Actinobacteria (4.6%), Chloroflexi (4.5%), Acidobacteria (4.3%), Deinococcus-Thermus (2.6%), Bacteroidetes (1.3%), and Gemmatimonadetes (1.0%) (Figure 1b). This indicates that Proteobacteria, Actinobacteria, Chloroflexi, and Acidobacteria are the dominant phyla bacteria in P. bournei seedlings’ soil. The total abundance of dominant bacteria phyla in each treatment was greater than the control (T1), indicating that NPK fertilization promoted the dominant bacteria phyla growth. Among the 14 fertilization treatments, the maximum abundance of Proteobacteria, Actinobacteria, Chloroflexi, and Acidobacteria was observed in T11, T14, T2, and T1 (control), respectively, and the minimum abundance was observed in T1, T11, T5, and T10, respectively, indicating that NPK fertilization increased Proteobacteria and inhibited Acidobacteria growth and that only an appropriate NPK fertilization ratio can improve Actinobacteria and Chloroflexi growth. The best Chloroflexi growth was observed under no-N fertilizer, while the worst Actinobacteria growth was observed under a high-N level.

2.3. Effect of NPK Fertilization on Phoebe bournei Seedlings’ Soil Bacterial Diversity

Different NPK fertilization conditions significantly affected soil microbial Chao1, Simpson, and Shannon indices (Table 2). Chao1, Simpson, and Shannon indices of the control (T1) were higher than all fertilization treatments, indicating that fertilization reduced Phoebe bournei seedlings’ soil microbial diversity, with T10 showing the lowest values for the three indices, indicating that soil bacteria diversity was inhibited by a high-K fertilizer level. The three (Chao1, Simpson, and Shannon) diversity indices for the three-factor fertilizer (N, P, and K) were the highest, followed by the two-factor and single-factor fertilizers, with P having the least effect on soil diversity indices.

2.4. Differential Groups of Phoebe bournei Seedlings’ Soil Bacteria under NPK Fertilization

The Anosim significance test showed that N, P, and K three-, two-, and single-factor fertilization treatments had significantly different impacts on soil bacterial community structure, with the following order: NPK, N, P, NP, NK, PK, and K fertilization (Figure 2).

2.4.1. Differential Soil Bacteria Groups under Three-Factor NPK Fertilization

We used Lefse1.0 software to compare the species composition differences among the 14 NPK treatments to identify the marker species. The results showed that at the taxonomic phylum level, the marker species were Bacterodetes, Armatimonadetes, Chlamydiae, WPS-2, and Gal15. At the genus level, the top 10 marker species among treatments were Granulicella, Env-OP-17, Sinomonas, OLB14, SBR1031, Pajarollobacter, F-0319-6G20, Sphingononas, Allorhizobium-Neorhizobium-Pararhizobium-Rhizobium, Rhodanobacter, and G-AD3 (Figure 3).

2.4.2. Differential Soil Bacteria Groups under Two-Factor NPK Fertilization

Among NP fertilization treatments and at the phylum and genus levels, we identified the following marker species: WPS-2 and Gal15 and AD3, SBR1031, Nitrolancea, Gitt_GS_136, G12_WMSP1, GAL15, Rhodopseudomonas, Castellaniella, Delftia, Chujaibacter, Mizugakibacter, and WPS-2, respectively (Figure 4a). Similarly, among NK fertilization treatments, we identified Chlamydiae, WPS-2, and GAL15 species at the phylum level and Granulicella, Jatrophihabitans, AD3, Nitrolancea, OLB14, GAL15, S0134_terrestrial_group, Nitrospira, Novispirillum, Bdellovibrio, Castellaniella, Cupriavidus, Rhodanobacter, and Mizugakibacter, Allorhizobium_Neorhizobium_Pararhizot_Rhodopseudomonas at the genus level (Figure 4b). For PK fertilization treatments, we identified Acidipila, Sinomonas, Thermus, S0134_terrestrial_group, Inquilinus, 0319_6G20, IS_44, AD3, Allorhizobium_Neorhizobium_Pararhizobium_Rhizobium, Sphingomonas, Pajaroellobacter, Methyloversatilis, Mizugakibacter, and Rhodanobacter as marker species at the genus level (Figure 4c).

2.4.3. Differential Soil Bacteria Groups under Single-Factor NPK Fertilization

Among N fertilization treatments, we identified Granulicella, Nubsella, AD3, Nitrolancea, Longimicrobiaceae, S0134_terrestrial_group, Phenylobacterium, URHD0088, mle1_27, B1_7BS, Bordetella, Castellaniella, Thiobacillus, and Chujaibacter as marker species at the genus level (Figure 5a). Similarly, among P and K fertilization treatments, we identified Gaiella, Nubsella, Thermus, Pajaroellobacter, 0319_6G20, and Pseudomonas (Figure 5b) and Pajaroellobacter, Mizugakibacter, and Rhodanobacter as marker species at the genus level (Figure 5c), respectively.

2.5. Network Association Analysis of Phoebe bournei Seedlings’ Soil Microbial Community under NPK Fertilization

Network modularity segmentation of bacterial communities in Phoebe bournei seedlings soil was performed under the various fertilization conditions (Table 3). The modularity index was greater than 0.7 for the seven NPK fertilization combinations, indicating that the community had a modular structure. Number of nodes, number of edges, and closeness centrality in bacterial community were the highest under NPK, NP, and NK, followed by N, PK, K, and P, fertilization. Transitivity coefficient and average path length in the bacterial ecosystem under P was the highest, followed by K, PK, the remaining three fertilization conditions (NPK, NP, and NK), and N fertilization, indicating that single-factor fertilization was the lowest in network stability, followed by two-factor fertilization; the highest stability was with three-factor fertilization. Under single-factor fertilization, N was the most stable network, followed by K and P; this could be due to the improved diversification of three-factor fertilization, leading to enhanced interaction and stability among bacteria.
The network association among microbial members was visualized using the R graph package, and nine key phylum species were found in different NPK fertilization treatments, including Proteobacteria, Deinococcy-Thermus, Chloroflexi, Actinobacteria, Acidobacteria, Nitrospirae, Bacteroidetes, Gematimonadetes, and WPS-2 (Figure 6).

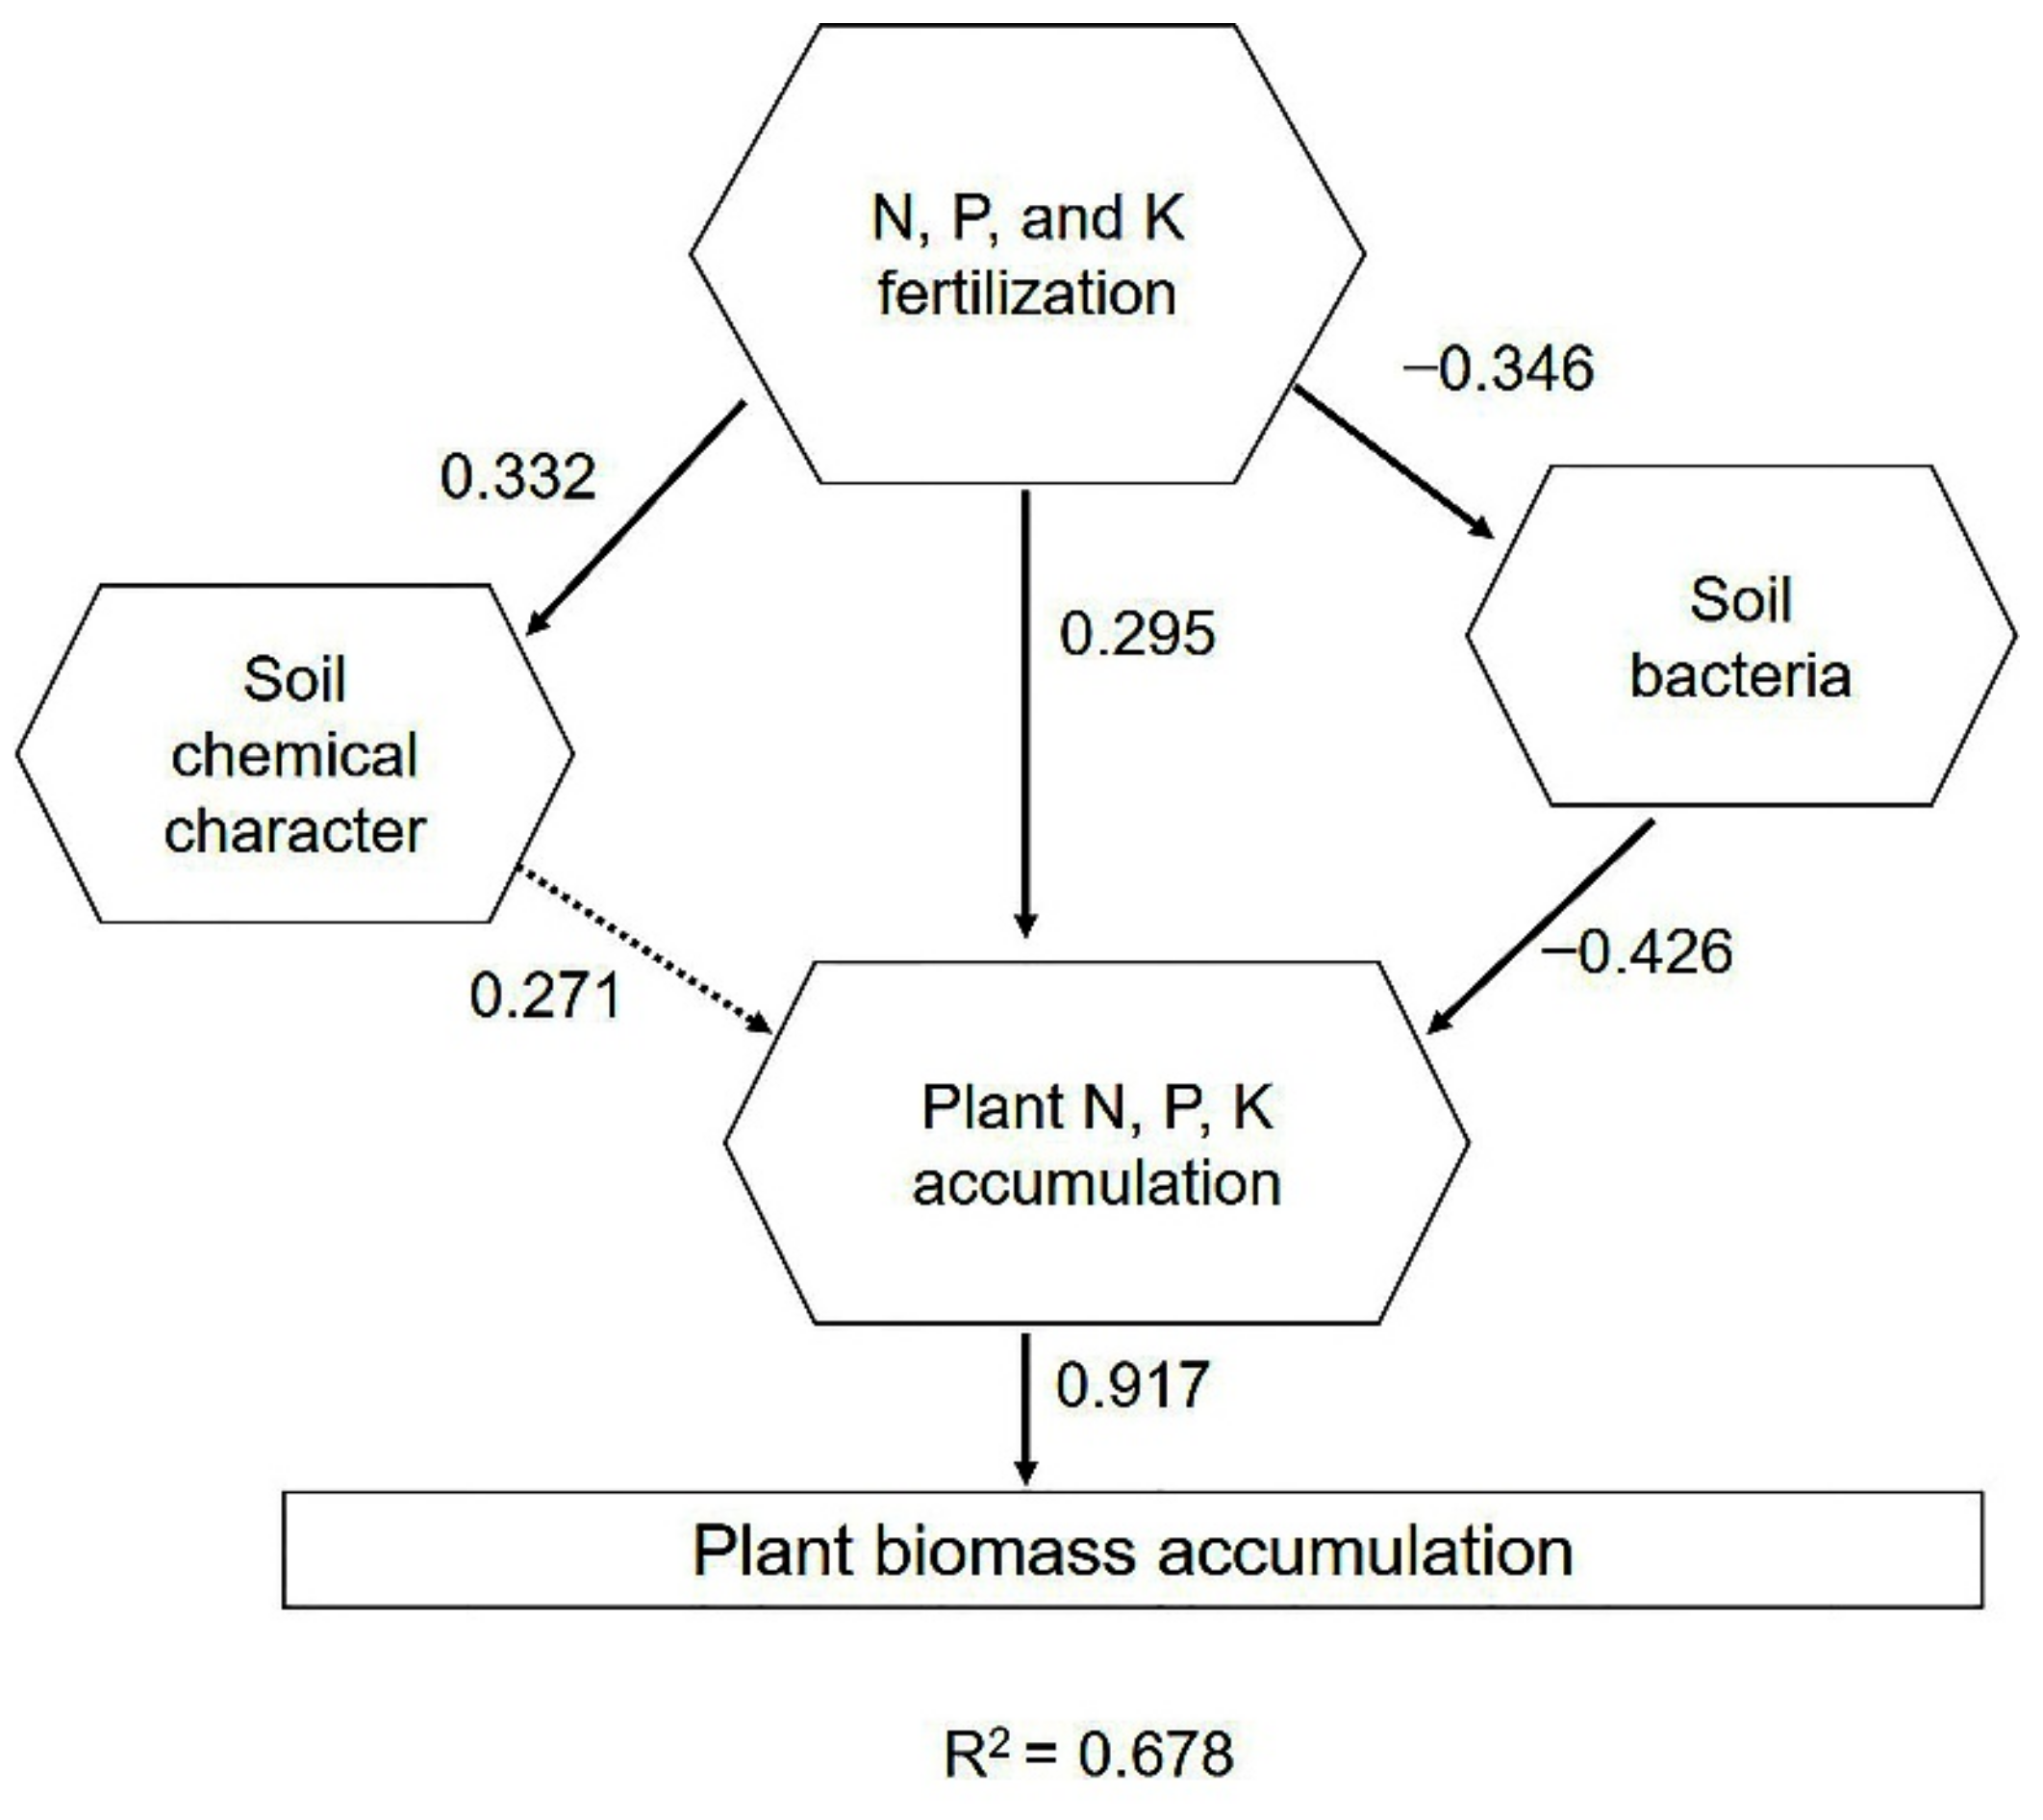
2.6. Driving Factors of Phoebe bournei Seedling Growth under NPK Fertilization

PLS-PM results showed that the growth of Phoebe bournei seedlings was significantly affected by NPK accumulation, which was driven by three aspects, namely, the significant and positive effect of NPK fertilizers, the positive effect of soil chemical properties, and the negative effect of bacteria growth. According to the absolute value of the correlation coefficient, the factors influencing P. bournei seedling growth were soil bacteria, soil chemical character, and NPK fertilization, indicating soil bacteria was the most important factor for P. bournei seedling growth (Figure 7). Further correlation analysis of soil dominant phylum and genera bacteria indicated that Methylobacterium, Brevundimonas, Sphingobium, and Acinetobacter had significant or highly significant negative correlation with Actinobacteria, Chloroflexi and Acidobacteria and significant or highly significant positive correlation with Proteobacteria, which indicated that Methylobacterium, Brevundimonas, Sphingobium, and Acinetobacter were the key species regulating the soil ecology of Phoebe bournei seedling soil (Table 4).
Correlation analysis of soil key bacteria and chemical traits showed that pH was negatively correlated with Methylobacterium, Brevundimonas, Sphingobium, and Acinetobacter abundance, among which significant correlation with observed for Methylobacterium and Acinetobacter. Soil NPK contents were positively and significantly correlated with the abundance of four key bacteria (N content with Brevundimonas and Acinetobacter, P content with Acinetobacter, and K content with Sphingobium) (Table 5).

3. Discussion

3.1. NPK Fertilization Regulation of Phoebe bournei Seedlings’ Soil Chemical Characters

Fertilization is the main influencing factor for soil properties, causing changes in soil nutrients and pH [28]. NPK fertilization reduced P. bournei seedlings’ soil pH, with the largest change under N and the least under P; these results are consistent with previous observations [29,30]. NPK fertilization can reduce soil acidification by decreasing and increasing the proportion of N and P, respectively. NPK fertilization significantly increased P. bournei seedlings’ soil N and K contents, possibly due to promoting N- and K-rich microorganism growth. Soil P content can be significantly increased only when appropriate NPK application is applied, especially by reducing the K ratio. K fertilizer increased soil K content and the amount of soil H+ due to the increased competition between the binding points of H+ and K+ on the plasma membrane, thus enhancing P activation capacity [31,32,33] and, consequently, increasing P. bournei seedlings’ P uptake, resulting in reduced soil P content. Hence, soil P content in T8 (N2P2K0), T9 (N2P2K1), and T6 (N2P2K2) was higher than that of T1 (N0P0K0), with T8 representing the highest soil P content among the 14 fertilization treatments. Multiple range analysis showed that the three-factor NPK fertilization had the greatest influence on soil NPK content, followed by double-factor and single-factor fertilization, indicating that NPK could improve the sustainable soil productivity of P. bournei seedlings. P appeared to be the key factor in regulating P. bournei seedlings’ stem growth [34]. Therefore, reducing the K fertilization proportion in NPK fertilizer combinations can improve the seedlings’ P uptake.

3.2. NPK Fertilization Regulation of Phoebe bournei Seedlings’ Soil Bacterial Diversity

Soil bacterial diversity is closely related to soil functions. Protecting soil bacterial diversity can effectively ensure the existence of a balanced and stable soil ecosystem [13,14,15]. Fertilization level, type, duration, and application method can individually and/or in concert change soil physical and chemical properties and, subsequently, affect soil bacteria species and diversity [17,35]. In the present experiment, NPK fertilizer acidized the soil and increased its nutrient content, resulting in the enrichment of some soil bacterial growth along with a reduction in their diversity; these results support previous observations [17,18,19]. Soil bacterial diversity under three-factor fertilization was higher than two- and single-factor fertilization, indicating that three-factor fertilization provided the most balanced nutrients for P. bournei seedlings’ soil bacteria and satisfied the growth and metabolism requirements of more bacteria types, a keeping high diversity level. At the same time and as previously reported, P fertilizer had the least effect on soil bacteria diversity [36]. Therefore, reducing the ratio of N and K and increasing P can maintain P. bournei seedlings’ soil ecological stability under NPK fertilization.

3.3. Soil Bacteria Response to Phoebe bournei Seedlings’ NPK Fertilization

NPK fertilization significantly affected P. bournei seedlings’ soil bacterial community composition. The abundance and network correlation analyses of soil bacteria indicated that Proteobacteria, Actinobacteria, Chloroflexi, and Acidobacteria were the dominant and core phylum species, playing an important role in soil material circulation and ecological environment balance [37,38]. NPK fertilization significantly increased soil fertility and the available N and P contents in the soil, resulting in increased Proteobacteria abundance, as affected by the available N, and decreased Acidobacteria abundance, mainly due to poor soil environment [39,40]. Urea, as the N source in our experiment, was conducive to increasing P. bournei seedlings’ nitrite absorption and reducing the nitrite content in the soil, thus decreasing Chloroflexi abundance, which oxidizes nitrites into nitrates, increasing autotrophic nitrite bacteria growth (e.g., the best Chloroflexi growth was in T2, which did not include N fertilizer) [41,42]. Actinobacteria are known to be beneficial bacteria that produce agricultural antibiotics and fight plant diseases [43]. Similar to most NPK fertilization results, high N levels resulted in reduced Actinobacteria abundance; however, an appropriate NPK ratio can promote Actinobacteria growth, reaching maximum abundance in T14 (N2P1K1), probably because NPK fertilizer provides material and energy in relatively arid red soil [40,44]. Cupriavidus, Methylobacterium, Brevundimonas, Sphingobium, Acinetobacter, and Sphingomonas were the dominant genera in Phoebe bournei seedling soil, and they all belong to Proteobacteria, which indicates that Proteobacteria have strong adaptability to NPK fertilization. Methylobacterium, Sphingobium, and Acinetobacter can fully absorb soil nutrients, providing NPK fertilization as substances and energy to promote their reproduction. However, Brevundimona propagated best under the application of high-level P fertilizer (T7, N2P3K2), indicating that it had a high phosphorus-dissolving function [45]. Sphingomonas grew best without K fertilizer (T8, N2P2K0), indicating that it had a weak potassium-releasing capacity [46].
Soil bacteria can reflect changes in soil in time, such as soil nutrients and pH value, and can temporarily reflect the quality of soil [18,19,28,47]. With a relative abundance of more than 1%, Bacteroidetes was only used as the marker phyla species for NPK three-factor fertilization, while there was no marker phyla species for two- and single-factor fertilization, indicating that the phyla species could not be used as the marker species for NPK fertilization. Under NPK three-factor fertilization, Rhodanobacter, Sphingononas, and AD3 were used as the marker genera species, with a relative abundance of more than 1%. Under two-factor fertilization, AD3, Pseudomonas, and Chujaibacter were used as the marker genera species, with a relative abundance of more than 1% for N and P fertilization; AD3, Pseudomonas, Cupriavidus, and Rhodanobacter for N and K fertilization; and Thermus, AD3, Sphingomonas, and Rhodanobacter for P and K fertilization. Under single-factor fertilization, AD3 was the marker bacteria for N, with relative abundance over 1%; Thermus and Pseudomonas for P fertilizers; and Rhodanobacter for K fertilizer. These indicate that the genera species can be used as the marker species for NPK fertilization.

3.4. Soil Bacteria Regulate P. bournei Seedling Growth and Soil Development

Soil microorganisms play an important role in soil nutrient cycling and the soil–plant growth system [11]. Plants, soil, and microorganisms are not independent in soil material circulation and energy exchange processes but interact with each other in a synergetic manner. NPK fertilization significantly increased soil N, P, and K contents, directly promoting P. bournei seedling growth and indirectly improving soil bacteria growth. On the other hand, NPK fertilization directly and significantly inhibited soil bacteria growth; however, it did promote dominant bacteria growth by enriching nutrient elements, promoting N, P, and K element storage in the soil bank, and providing nutrients for subsequent seedling growth. Hence, soil bacteria was the most important factor for P. bournei seedling growth and the sustainable utilization of soil. Methylobacterium, Brevundimonas, Sphingobium, and Acinetobacter are the key species for regulating soil fertilization. Methylobacterium and Acinetobacte had a significant negative correlation with soil pH, Brevundimonas a significant positive correlation with soil N content, Sphingobium with soil K content, and Acinetobacter with soil N and P contents, which indicated that Methylobacterium and Acinetobacter could be used as indicator species of soil pH, Brevundimonas as an indicator of soil N content, Acinetobacter as an indicator of soil P content, and Sphingobium as an indicator of soil K content. Therefore, improving Brevundimonas, Sphingobobacter, and Acinetobacter abundance can increase N, P, and K contents in the soil bank and sustainably provide nutrients for P. bournei seedling growth.

4. Materials and Methods

4.1. Site Description

The experiment site was at a field nursery of the Fujian Agriculture and Forestry University, China (119°23′ E, 26°09′ N). The annual average temperature is 19.6 °C, the minimum temperature is −2.5, and the maximum temperature is 42.3 °C. Effective accumulated temperature ≥10 °C is 5880 °C, with 326 days >0 °C. Annual precipitation is 1490 mm, and annual average humidity is 77% [48].

4.2. Materials

Well-grown, well-developed buds and one-year-old Phoebe bournei bareroot seedlings were selected for the experimental population in May 2018. The average height of the seedlings was 20.2 ± 0.9 cm, and the average diameter was 2.3 ± 1.0 mm. Seedlings had total N, P, and K contents of 1.219, 1.555, and 14.022 g·Kg−1, respectively, at the start of the experiment [48].
Red laterite soil, vermiculite, and sand were used to mix the soil substrate, the volume ratio of which was 6:2:2. Organic matter was 5.78 g·kg−1, pH was 5.30, and total N, P, and K contents were 1.5, 0.035, and 33.91 g·kg−1 in the soil mixture, respectively. Plastic-pot-grown seedlings (diameter × height: 25 × 25 cm) had 6.0 kg of dry soil. The fertilizers used were urea (N: 47%), superphosphate (P2O5: 12%), and potassium chloride (K2O: 60%) [48].

4.3. Experimental Design

The test followed the “3414” fertilizer experimental design, which is set as three factors of N, P, and K [27,49]. Every factor has 0, 1, 2, 3 fertilization levels, respectively. Level 0 is the control (no fertilizer). Level 2 (medium level) is the common fertilizer rates, which were 0.532, 0.133, and 0.356 g·plant−1 for N, P2O5, and K2O, respectively [50,51]. Level 1 (low level) and Level 3 (high level) are 0.5 and 1.5 times Level 2, respectively. The specific rates of fertilizer were calculated in terms of N, P2O5, and K2O (Table 6). The “3414” fertilizer experiment has 14 treatment combinations and can analyze the single-factor, two-factor, and three-factor interaction effects of NPK fertilization. In the single-factor effect treatments, when the “2” level was fixed by P and K fertilizers, the 0, 1, 2, 3 levels of N fertilizer were T2, T3, T6, and T11, respectively. When the “2” level was fixed by N and K fertilizers, the 0, 1, 2, 3 levels of P fertilizer were T4, T5, T6, and T7, respectively. When the “2” level was fixed by N and K fertilizers, the 0, 1, 2, 3 levels of K fertilizer were T8, T9, T6, and T10, respectively. In the two-factor interaction treatments, when K fertilizer was fixed at the “2” level, the N–P interactions had 8 treatments, which were T2, T3, T4, T5, T6, T7, T11, and T12. When the “2” level was fixed by P fertilizer, the N–K interaction had 8 treatments, which were T2, T3, T6, T8, T9, T10, T11, and T13. When the N fertilizer was fixed at the “2” level, the P–K interaction had 8 treatments, which were T4, T5, T6, T7, T8, T9, T10, and T14. The three-factor interaction of N × P × K was the T1–T14 treatments. The experiment had 14 treatments, with each treatment replicated three times, and 1260 seedlings, with 30 seedlings at each treatment replication. Random arrangement (complete randomized design) was used for the fertilizer replications to minimize any environmental effects [48].

4.4. Experimental Management

This field experiment began in March 2018 and ended in December 2018. P fertilizer was used as the base fertilizer, and N fertilizer and K fertilizer were applied in different stages under the annual growth characteristics of P. bournei seedlings [52]. The applied fertilization regime was April—25% N and 20% K, June—35% N and 25% K, August—25% N and 35% K, and October—15% N and 20% K through a liquid application of fertilizer. Additionally, the concentration of fertilizer liquid was 0.05%. P. bournei seedlings need a light intensity equivalent of 75% natural light, and a 2.7 m high shed was equipped in the nursery. Seedlings were watered on a varying schedule determined by the empirical method of topsoil coloration, resulting in watering at ~7 days during March to April, ~15 days during May to July, not watered in August, ~10 days during September to November, and ~15 days in December, to maintain the desired soil water status of ~75% field capacity [48].

4.5. Sample Collection and Processing

Nine seedlings per treatment were harvested after growth cessation in December 2018. The intact root systems were dug up and gently shaken to harvest the loose soil on the root surface, which were the soil samples. Soil from 9 plants were mixed in each treatment and divided into two parts, and one part was placed in a 5 mL sterile centrifuge tube and stored in a −80 °C refrigerator for soil bacterial sequencing use. The other part was air-dried and screened for chemical indicators.

4.6. Soil and Seedling Measurement Parameters

The sampled seedlings were washed with water and dried in the shade, fixed at 105 ℃ for 15 min, and dried at 75 °C to achieve a stable weight. The samples’ dry biomass was measured with 0.001 g accuracy by electronic scales (AL204, Mettler-Toledo, Melbourne, Australia) [48]. Seedlings were prepared for analytical sampling by grinding with a plant crusher and then processing the material through a 0.5 mm plastic sieve. Total N, P, and K of seedlings were dissolved with the H2SO4-HClO4 method, soil total P and K with the NaOH solution-melting method, and soil total N with concentrated sulfuric acid and mixed catalyst (K2SO4: CuSO4 = 10:1). N, P, and K contents were determined by the Kjeldahl method (ATN-300, Hongji, Shanghai, China) [53], the molybdenum-antimony colorimetric method (UV-2600A, Unicom, Shanghai, China) [54], and the atomic absorption spectrophotometer method (AA7002, Dongxi, Beijing, China) [55], respectively. Each indicator was repeated three times. Plant N (P, K) accumulations (mg·plant−1) were obtained by multiplying dry biomass (g·plant−1) by N (P, K) content (g·Kg−1). Plant biomass and the N, P, and K accumulation of each fertilizer combination are listed in Table 7.

4.7. Soil Bacterial Sequencing

Soil samples of 0.5 g were used to extract soil DNA using the Fast DNA® Spin Kit for Soil (MP Biomedicals, Carlsbad, CA, USA). The extracted DNA products were tested by agarose gel electrophoresis, and the qualified DNA samples stored at −80 °C until further use. PCR conditions were 30 cycles at 98 °C pre-denaturation for 1 min, 98 °C denaturation for 10 s, 50 °C annealing for 30 s, 72 °C extending for 60 s, and finally extending 72 °C for another 5 min. PCR amplifications of the V3–V4 highly variable region of the bacterial 16S rRNA gene were performed with primers 338F (5′-ACTCCTACGGGAGCAG-3′) and 806R (5′-GGACTACHVGGGTWTCTAAT-3′). After amplification, the recovered products were quantified by Quanti Fluor TM fluorometer, denatured by NaOH into single chains, connected to sequencing joints, and sequenced on PE251 mode of Hiseq2500; a sequencing library was constructed according to Illumina instructions. The 16S rRNA sequence bases were analyzed using the Quantitative Insights into Microbial Ecology (QIIME) platform. Sequences with quality lower than Q20 and lengths less than 200 bp were removed and matched with samples according to the barcode sequence. Amplified primers and joint sequences were removed by Cutadapt and TrimMomatic software, and the Usearch algorithm was used to cluster the sequences according to 97% similarity and to remove chimeric operational taxonomic units (OTUs). Samples were divided into different OTUs; among each of them, that the sequence with the highest abundance was selected as the representative sequence.

4.8. Data Analysis

The annotated species in the Silva (Release132, http://www.arb-silva.de) database were selected (10 September 2020), and cluster comparisons were performed on all valid sequences to get OTUs with a >97% sequence similarity level. In this experiment, on average, each sample obtained 593 OTUs, belonging to 23 phyla, 51 classes, 107 orders, 155 families, and 208 genera. Mothur software was used to analyze the abundance and Alpha and Beta diversity of OTUs in each treatment soil. Alpha diversity was assessed by Chao1, Shannon, and Simpson indices. Chao1, the estimated number of OTUs, is defined as
chao1 = Sobs + F1(F1−1)/2(F2 + 1)
where Sobs are the number of OTUs observed, and F1 and F2 are the counts of singletons and doubletons, respectively [56,57].
Shannon’s index is defined as
Shannon = i = 1 s p i   log 2 p i
where s is the number of OTUs, and pi is the proportion of the community represented by OUTi [56,57].
Simpson’s index is defined as
Simpson = 1 p i 2
where pi is the proportion of the community represented by OUTi [56,58].
Additionally, Beta diversity was analyzed by the Anosim test, which was carried out on soil bacteria of all experimental treatments using R language [57,58]. Lefse1.0 software was used to further compare the composition differences of bacterial species among the different treatments and to find biomarker species [58]. The partial least squares path mode (PLS-PM) was used to analyze the relationships between fertilization, soil microorganisms, soil nutrition, and plant nutrition and growth by R language [59]. The results were drawn by Adobe Photoshop CC. Analysis of variance (ANOVA) was used to determine whether soil chemical characteristics and Alpha diversity indices of soil bacterial were significant in all treatments. Then Duncan’s multiple comparisons (α = 0.05) were used to analyze whether there were significant differences between the treatments by SPSS 22.0 (Chicago, IL, USA). Excel 2016 and SPSS 22.0 (Chicago, IL, USA) were used to conduct the range analyses, which were the differences between the maximum and minimum values at different levels for the single-factor, two-factor, and three-factor effects of N, P, and K fertilizer. The correlation analysis between dominant phyla bacteria and dominant genera bacteria and key bacteria and soil chemical characteristics was performed by SPSS 22.0 (Chicago, IL, USA) for the three-factor interaction effect of N, P, and K fertilizer.

5. Conclusions

NPK fertilization reduced Phoebe bournei seedlings’ soil pH, with the largest effect under N and the least under P for single-factor fertilization. By reducing the rate of N and increasing P, soil acidification can be controlled with minimal pH reduction. NPK fertilization significantly increased soil’s N and K contents and decreased bacterial diversity. With proper NPK application, by reducing the N and K ratios and increasing P, not only can P. bournei seedlings be provided with balanced nutrients, but various bacteria can meet their growth and metabolism needs while keeping ecological stability and maintaining seedling growth and a soil sustainable utilization balance. Proteobacteria, Actinobacteria, Chloroflexi, and Acidobacteria were the dominant and core phylum species, while Cupriavidus, Methylobacterium, Brevundimonas, Sphingobium, Acinetobacter, and Sphingomonas were the dominant genus species in Phoebe bournei seedlings soil. NPK fertilization significantly affected soil bacterial community composition, increasing Proteobacteria, Methylobacterium, Sphingobium, and Acinetobacter abundance, decreasing Acidobacteria, and promoting Actinomycetes and Chloroflexi under appropriate NPK ratios, Brevundimonas under high P level, and Sphingomonas in the absence of K. NPK fertilization significantly increased P. bournei seedlings’ soil N, P, K contents and indirectly promoted soil bacteria growth. However, it directly and significantly inhibited soil bacteria growth while promoting dominant bacterial species growth (which enrich nutrient elements) and N, P and K element storage in the soil bank (which provide the nutrients needed for subsequent seedling growth). Soil bacteria was the most important factor for P. bournei seedling growth and the sustainable utilization of soil. Methylobacterium, Brevundimonas, Sphingobium, and Acinetobacter were the key species in P. bournei seedlings’ soil under fertilization, with increasing Brevundimonas, Sphingobium, and Acinetobacter abundance inducing increased N, P, and K contents in the soil bank, which sustainably provided the nutrients needed for seedling growth. AD3 can be used as the marker species under N fertilizer application, Pseudomonas under K fertilizer application, and Rhodanobacter under K fertilizer application; Methylobacterium and Acinetobacter for mentoring soil pH; Brevundimonas for soil N content; Sphingobium for soil K content; and Acinetobacter for soil P content change.

Author Contributions

Conceptualization, Y.A.E.-K. and J.-L.F.; Data curation, Z.-J.Y., X.-H.W., and L.-M.H.; Data analysis, Z.-J.Y. and Y.C.; Investigation, X.-H.W. and L.-M.H.; Methodology, Z.-J.Y. and X.-H.W.; Project administration, J.-L.F.; Resources, Z.-J.Y. and W.-W.X.; Supervision, J.-L.F.; Writing—original draft, Z.-J.Y. and J.-L.F.; Writing—review and editing, Y.A.E.-K. All authors have read and agreed to the published version of the manuscript.

Funding

This research was funded by the Fujian Soil and Water Conservation Research Project (KH180280A) and the Fujian Forest Seedling Science and Technology Research Project (KLh16H04A).

Data Availability Statement

The datasets used and analysed during the current study could be available from the corresponding author on reasonable request.

Acknowledgments

We are grateful to the Fujian Academy of Forestry for providing the Phoebe bournei seedlings.

Conflicts of Interest

The authors declare no conflict of interest. The funders had no role in the design of the study; in the collection, analyses, or interpretation of data; in the writing of the manuscript, or in the decision to publish the results.

References

  1. Chaparro, J.M.; Sheflin, A.M.; Manter, D.K.; Vivanco, J.M. Manipulating the Soil Microbiome to Increase Soil Health and Plant Fertility. Biol. Fertil. Soils 2012, 48, 489–499. [Google Scholar] [CrossRef]
  2. Lozano, Y.M.; Armas, C.; Hortal, S.; Casanoves, F.; Pugnaire, F.I. Disentangling above-and below-Ground Facilitation Drivers in Arid Environments: The Role of Soil Microorganisms, Soil Prop-Erties and Microhabitat. New Phytol. 2017, 216, 1236–1246. [Google Scholar] [CrossRef] [Green Version]
  3. Lamhamedi, M.S.; Renaud, M.; Auger, I.; Fortin, J.A. Granular Calcite Stimulates Natural Mycorrhization and Growth of White Spruce Seedlings in Peat-Based Substrates in Forest Nursery. Microorganisms 2020, 7, 1088. [Google Scholar] [CrossRef]
  4. Li, J.; Ma, H.; Zhang, E. Influence of Irrigation with Reclaimed Water on Rhizosphere Soil Properties and Leaf Physiology of Different Landscape Plants. Res. Soil. Water Conserv. 2017, 24, 70–76. [Google Scholar]
  5. Zhou, X.; Chen, L.; Xu, J.; Brookes, P.C. Soil Biochemical Properties and Bacteria Community in a Repeatedly Fumigated-Incubated Soil. Biol. Fertil. Soils 2020, 56, 619–631. [Google Scholar] [CrossRef]
  6. Van der Wal, A.; De Boer, W. Dinner in the Dark: Illuminating Drivers of Soil Organic Matter Decomposition. Soil Biol. Biochem. 2017, 105, 45–48. [Google Scholar] [CrossRef]
  7. Singh, J.S.; Gupta, V.K. Soil Microbial Biomass: A Key Soil Driver in Management of Ecosystem Functioning. Sci. Total Environ. 2018, 634, 497–500. [Google Scholar] [CrossRef] [PubMed]
  8. Zhang, M.; Muhammad, R.; Zhang, L.; Xia, H.; Cong, M.; Jiang, C. Investigating the Effect of Biochar and Fertilizer on the Composition and Function of Bacteria in Red Soil. Appl. Soil Ecol. 2019, 139, 107–116. [Google Scholar] [CrossRef]
  9. Wu, J.; Wei, Z.; Zhu, Z.; Zhao, Y.; Jia, L.; Lv, P. Humus Formation Driven by Ammonia-Oxidizing Bacteria During Mixed Materials Composting. Bioresour. Technol. 2020, 311, 123500. [Google Scholar] [CrossRef] [PubMed]
  10. Gu, Y.; Bai, Y.; Xiang, Q.; Yu, X.; Zhao, K.; Zhang, X.; Li, C.; Liu, S.; Chen, Q. Degradation Shaped Bacterial and Archaeal Communities with Predictable Taxa and Their Association Patterns in Zoige Wetland at Tibet Plateau. Sci. Rep. 2018, 8, 3884. [Google Scholar] [CrossRef] [PubMed] [Green Version]
  11. Ehrenfeld, J.G.; Ravit, B.; Elgersma, K. Feedback in the Plant-Soil System. Annu. Rev. Environ. Resour. 2005, 30, 75–115. [Google Scholar] [CrossRef] [Green Version]
  12. Brandt, K.K.; Frandsen, R.J.N.; Holm, P.E.; Nybroe, O. Development of Pollution-Induced Community Tolerance Is Linked to Structural and Functional Resilience of a Soil Bacterial Community Following a Five-Year Field Exposure to Copper. Soil. Biol. Biochem. 2010, 42, 748–757. [Google Scholar] [CrossRef]
  13. Miransari, M. Soil Microbes and Plant Fertilization. Appl. Microbiol. Biot. 2011, 92, 875–885. [Google Scholar] [CrossRef] [PubMed]
  14. Wang, C.; Zheng, M.; Song, W.; Wen, S.; Wang, B.; Zhu, C.; Shen, R. Impact of 25 Years of Inorganic Fertilization on Diazotrophic Abundance and Community Structure in an Acidic Soil in Southern China. Soil. Biol. Biochem. 2017, 113, 240–249. [Google Scholar] [CrossRef]
  15. Yang, K.; Luo, S.; Hu, L.; Chen, B.; Xie, Z.; Ma, B.; Ma, W.; Du, G.; Ma, X.; Roux, X.L. Responses of Soil Ammonia-Oxidizing Bacteria and Archaea Diversity to N, P and NP Fertilization: Relationships with Soil Environmental Variables and Plant Community Diversity. Soil. Biol. Biochem. 2020, 145, 107795. [Google Scholar] [CrossRef]
  16. Daquiado, A.R.; Kuppusamy, S.; Kim, S.Y.; Kim, J.H.; Yoon, Y.E.; Kim, P.J.; Oh, S.H.; Kwak, Y.; Lee, Y.B. Pyrosequencing Analysis of Bacterial Community Diversity in Long-Term Fertilized Paddy Field Soil. Appl. Soil. Ecol. 2016, 108, 84–91. [Google Scholar] [CrossRef]
  17. Zhang, C.; Song, Z.; Zhuang, D.; Wang, J.; Xie, S.; Liu, G. Urea Fertilization Decreases Soil Bacterial Diversity, but Improves Microbial Biomass, Respiration, and N-Cycling Potential in a Semiarid Grassland. Biol. Fertil. Soils 2019, 55, 229–242. [Google Scholar] [CrossRef]
  18. Van der Bom, F.; Nunes, I.; Raymond, N.S.; Hansen, V.; Bonnichsen, L.; Magid, J.; Nybroe, O.; Jensen, L.S. Long-Term Fertilization Form, Level and duration Affect the Diversity, Structure and Functioning of Soil Microbial Communities in the Field. Soil. Biol. Biochem. 2018, 122, 91–103. [Google Scholar] [CrossRef]
  19. Hernández-Fernández, M.; Cordero-Bueso, G.; Ruiz-Muñoz, M.; Cantoral, J.M. Culturable Yeasts as Biofertilizers and Biopesticides for a Sustainable Agriculture: A Comprehensive Review. Plants 2021, 10, 822. [Google Scholar] [CrossRef] [PubMed]
  20. Stephan, A.; Meyer, A.H.; Schmid, B. Plant Diversity Affects Culturable Soil Bacteria in Experimental Grassland Communities. J. Ecol. 2000, 88, 988–998. [Google Scholar] [CrossRef]
  21. Trivedi, P.; Leach, J.E.; Tringe, S.G.; Sa, T.; Singh, B.K. Plant-Microbiome Interactions: From Community Assembly to Plant Health. Nat. Rev. Microbiol. 2020, 18, 607–621. [Google Scholar] [CrossRef]
  22. Wang, X.; Wei, X.; Wu, G.; Chen, S. Ammonium Application Mitigates the Effects of Elevated Carbon Dioxide on the Carbon/Nitrogen Balance of Phoebe bournei Seedlings. Tree Physiol. 2021, 2. [Google Scholar] [CrossRef]
  23. Xue, L.; Chen, H.; Xu, Y.; Peng, Y.; Xu, S.; Chen, W. Soil Physical Properties, Microbial Biomass and Enzyme Activity in Mixed Stands. Chin. J. Soil. Sci. 2004, 35, 154–158. [Google Scholar]
  24. Wu, F.; Wen, S.; He, G.; Zhou, Q. Response of Soil Bacterial Community Structure and Diversity to Different Forest Ages. J. Cent. South. Univ. For. Tech. 2020, 40, 134–143. [Google Scholar]
  25. Wang, X.; Wang, Y.; Wei, X.; Wu, G. Growth, Physiology and Nutrient Accumulation of Phoebe bournei Seedlings Under Different Amount of Exponential Nitrogen. J. Zhejiang. Agric. For. Univ. 2020, 37, 514–521. [Google Scholar]
  26. Albertsen, M.; Hugenholtz, P.; Skarshewski, A.; Nielsen, K.L.; Tyson, G.W.; Nielsen, P.H. Genome Sequences of Rare, Uncultured Bacteria Obtained by Differential Coverage Binning of Multiple Metagenomes. Nat. Biotechnol. 2013, 31, 533–538. [Google Scholar] [CrossRef] [PubMed]
  27. Huang, Y.; Li, T.X.; Zhang, X.Z.; Lin, J. Establishment of Fertilization Recommendation Indexes of Rapeseed Soil Based on the “3414” Field Experiments in the Middle of Sichuan Hilly Regions. Sci. Agri. Sin. 2013, 46, 2058–2066. [Google Scholar]
  28. Zhang, Y.; Shen, H.; He, X.; Thomas, B.W.; Lupwayi, N.Z.; Hao, X.; Thomas, M.C.; Shi, X. Fertilization Shapes Bacterial Community Structure by Alteration of Soil pH. Front. Microbiol. 2017, 8, 325. [Google Scholar] [CrossRef] [Green Version]
  29. Chakraborty, A.; Chakrabarti, K.; Chakraborty, A.; Ghosh, S. Effect of Long-Term Fertilizers and Manure Application on Microbial Biomass and Microbial Activity of a Tropical Agricultural Soil. Biol. Fertil. Soils 2011, 47, 227–233. [Google Scholar] [CrossRef]
  30. Zhang, Y.; Zhang, S.; Wang, R.; Cai, J.; Zhang, Y.; Huang, S.; Jiang, Y. Impacts of Fertilization Practices on pH and the pH Buffering Capacity of Calcareous Soil. Soil Sci. Plant. Nutr. 2016, 62, 432–439. [Google Scholar] [CrossRef]
  31. Tan, D.; Jin, J.; Huang, S.; Li, S.; He, P. Effect of Long-Term Application of K Fertilizer and Wheat Straw to Soil on Crop Yield and Soil K under Different Planting Systems. Agric. Sci. China 2007, 6, 200–207. [Google Scholar]
  32. Gaxiola, R.A.; Sanchez, C.A.; Paez-Valencia, J.; Ayre, B.G.; Elser, J.J. Genetic Manipulation of a “Vacuolar” H+-PPase: From Salt Tolerance to Yield Enhancement under Phosphorus-Deficient Soils. Plant. Physiol. 2012, 159, 3–11. [Google Scholar] [CrossRef] [PubMed] [Green Version]
  33. Zhang, X.; Wu, H.; Chen, L.; Liu, L.; Wan, X. Maintenance of Mesophyll Potassium and Regulation of Plasma Membrane H+-ATPase Are Associated with Physiological Responses of Tea Plants to Drought and Subsequent Rehydration. Crop. J. 2018, 6, 611–620. [Google Scholar] [CrossRef]
  34. Ou, J. N, P, K Formulas for Fertilization with Young Phoebe bournei Plantations in Fujian Province. J. Zhejiang Agric. For. Univ. 2015, 32, 92–97. [Google Scholar]
  35. Major, N.; Schierstaedt, J.; Jechalke, S.; Nesme, J.; Ban, S.G.; Černe, M.; Sørensen, S.J.; Ban, D.; Schikora, A. Composted Sewage Sludge Influences the Microbiome and Persistence of Human Pathogens in Soil. Microorganisms 2020, 7, 1020. [Google Scholar] [CrossRef]
  36. Gyaneshwar, P.; Kumar, G.N.; Parekh, L.J.; Poole, P.S. Role of Soil Microorganisms in Improving P Nutrition of Plants. Plant. Soil 2002, 245, 83–93. [Google Scholar] [CrossRef]
  37. Lupwayi, N.Z.; May, W.E.; Kanashiro, D.A.; Petri, P.M. Soil Bacterial Community Responses to Black Medic Cover Crop and Fertilizer N under No-Till. Appl. Soil. Ecol. 2018, 124, 95–103. [Google Scholar] [CrossRef]
  38. Liu, M.; Wang, C.; Wang, F.; Xie, Y. Maize (Zea mays) Growth and Nutrient Uptake Following Integrated Improvement of Vermicompost and Humic Acid Fertilizer on Coastal Saline Soil. Appl. Soil. Ecol. 2019, 142, 147–154. [Google Scholar] [CrossRef]
  39. Naether, A.; Foesel, B.U.; Naegele, V.; Wüst, P.K.; Weinert, J.; Bonkowski, M.; Alt, F.; Oelmann, Y.; Polle, N.; Lohaus, G.; et al. Environmental Factors Affect Acidobacterial Communities below the Subgroup Level in Grassland and Forest Soils. Appl. Environ. Microbiol. 2012, 78, 7398–7406. [Google Scholar] [CrossRef] [Green Version]
  40. Dai, Z.; Su, W.; Chen, H.; Barberan, A.; Zhao, H.; Yu, M.; Yu, L.; Brookes, P.C.; Schadt, C.W.; Chang, S.X.; et al. Long-Term Nitrogen Fertilization Decreases Bacterial Diversity and Favors the Growth of Actinobacteria and Proteobacteria in Agro-Ecosystems Across the Globe. Glob. Chang. Biol. 2018, 24, 3452–3461. [Google Scholar] [CrossRef]
  41. Puig, S.; Serra, M.; Vilar-Sanz, A.; Cabré, M.; Bañeras, L.; Colprim, J.; Balaguer, M.D. Autotrophic Nitrite Removal in the Cathode of Microbial Fuel Cells. Bioresour. Technol. 2011, 102, 4462–4467. [Google Scholar] [CrossRef]
  42. Yamashita, N.; Tanabata, S.; Ohtake, N.; Sueyosh, K.; Sato, T.; Higuchi, K.; Saito, A.; Ohyama, T. Effects of Different Chemical Forms of Nitrogen on the Quick and Reversible Inhibition of Soybean Nodule Growth and Nitrogen Fixation Activity. Front. Plant. Sci. 2019, 10, 131. [Google Scholar] [CrossRef] [PubMed]
  43. Saidi, S.; Cherif-Silini, H.; Bouket, A.C.; Silini, A.; Eshelli, M.; Luptakova, L.; Alenezi, F.N.; Belbahri, L. Improvement of Medicago sativa Crops Productivity by the Co-Inoculation of Sinorhizobium meliloti-Actinobacteria under Salt Stress. Curr. Microbiol. 2021, 78, 1344–1357. [Google Scholar] [CrossRef] [PubMed]
  44. Ai, C.; Liang, G.; Sun, J.; Wang, X.; He, P.; Zhou, W.; He, X. Reduced Dependence of Rhizosphere Microbiome on Plant-Derived Carbon in 32-Year Long-Term Inorganic and Organic Fertilized Soils. Soil. Biol. Biochem. 2015, 80, 70–78. [Google Scholar] [CrossRef]
  45. Chen, J.; van Groenigen, K.J.; Hungate, B.A.; Terrer, C.; Groenigen, J.V.; Maestre, F.T.; Ying, S.C.; Luo, Y.; Jørgensen, U.; Sinsabaugh, R.L.; et al. Long-Term Nitrogen Loading Alleviates Phosphorus Limitation in Terrestrial Ecosystems. Glob. Chang. Biol. 2020, 26, 5077–5086. [Google Scholar] [CrossRef]
  46. Gao, X.; Zhang, S.; Zhao, X.; Long, H. Evaluation of Potassium Application on Tomato Performance and Rhizosphere Bacterial Communities under Negative Pressure Irrigation of Greenhouse-Grown. J. Plant. Nutr. 2020, 43, 317–326. [Google Scholar] [CrossRef]
  47. Waldrop, M.P.; Firestone, M.K. Response of Microbial Community Composition and Function to Soil Climate Change. Microb. Ecol. 2006, 52, 716–724. [Google Scholar] [CrossRef]
  48. Yang, Z.J.; Wu, X.H.; Grossnickle, S.C.; Chen, L.H.; Yu, X.X.; EI-Kassaby, Y.A.; Feng, J.L. Formula Fertilization Promotes Phoebe bournei Robust Seedling Cultivation. Forests 2020, 11, 781. [Google Scholar] [CrossRef]
  49. Li, J.; Zhang, M.; Chen, F.; Yao, B. Improving Rice Modeling Success Rate with Ternary Non-Structural Fertilizer Response Model. Sci. Rep. 2018, 8, 9071. [Google Scholar] [CrossRef]
  50. Wang, Y.; Wang, X.; Wu, X.; Zhang, L.; Wu, L.; Xu, Y.; Zhou, Z. Effects of Slow-Release Fertilizer Loading on Growth and Construction of Nutrients Reserves of Phoebe chekiangensis and Phoebe bournei Container Seedlings. Sci. Agri. Sin. 2013, 49, 57–63. [Google Scholar]
  51. Dong, L.J.; Zhu, X.T.; Lin, X.Z.; Xu, Z.D. Effects of Fertilization on the Growth of Three Lauraceae Seedlings in Containers. North. Horti. 2011, 13, 73–77. [Google Scholar]
  52. Liu, Q.; Chen, M.; Wu, J.; Dong, C.; Huang, X.; Huang, S.; Tang, A.; Huang, M. Nutritional Properties and Fertilizer Demand Rules of Young Phoebe bournei Forest. Agric. Sci. Tech. 2015, 16, 2758–2760, 2781. [Google Scholar]
  53. Sui, Y.; Gao, J.; Shang, Q. Characterization of Nitrogen Metabolism and Photosynthesis in a Stay-Green Rice Cultivar. Plant Soil Environ. 2019, 65, 283–289. [Google Scholar] [CrossRef]
  54. Woźniak, G.; Chmura, D.; Małkowski, E.; Zieleźnik-Rusinowska, P.; Sitko, K.; Ziemer, B.; Błońska, A. Is the Age of Novel Ecosystem the Factor Driving Arbuscular Mycorrhizal Colonization in Poa compressa and Calamagrostis epigejos? Plants 2021, 10, 949. [Google Scholar] [CrossRef] [PubMed]
  55. Ishikawa, J.; Fujimura, S.; Kondo, M.; Murai-Hatano, M.; Goto, A.; Shinano, T. Dynamic Changes in the Cs Distribution throughout Rice Plants during the Ripening Period, and Effects of the Soil-K Level. Plant Soil 2018, 429, 503–518. [Google Scholar] [CrossRef]
  56. Thukral, A.K. A Review on Measurement of Alpha Diversity in Biology. Agric. Res. J. 2017, 54, 1–10. [Google Scholar] [CrossRef]
  57. Li, B.; Cao, Y.; Guan, X.; Li, Y.; Hao, Z.; Hu, W.; Chen, L. Microbial Assessments of Soil with a 40-Year History of Reclaimed Wastewater Irrigation. Sci. Total Environ. 2019, 651, 696–705. [Google Scholar] [CrossRef]
  58. Chen, Z.; Xie, Y.; Zhou, F.; Zhang, B.; Wu, J.; Yang, L.; Xu, S.; Stedtfeld, R.; Chen, Q.; Liu, J.; et al. Featured Gut Microbiomes Associated with the Progression of Chronic Hepatitis B Disease. Front. Microbiol. 2020, 11, 383. [Google Scholar] [CrossRef]
  59. Duan, C.; Razavi, B.S.; Shen, G.; Cui, Y.; Ju, W.; Li, S.; Fang, L. Deciphering the Rhizobium Inoculation Effect on Spatial Distribution of Phosphatase Activity in the Rhizosphere of Alfalfa Under Copper Stress. Soil. Biol. Biochem. 2019, 137, 107574. [Google Scholar] [CrossRef]
Figure 1. Phylum and genus horizontal species composition in Phoebe bournei seedlings’ soil bacteria under different fertilization treatments (T1–T14). (a) Genus horizontal; (b) phylum horizontal.
Plants 10 01868 g001
Figure 2. Anosim significance test of community structure difference between Phoebe bournei seedlings’ different fertilization groups. R-value ranges between −1 and 1 (values >0 indicate a significant difference between groups).
Plants 10 01868 g002
Figure 3. Analysis of soil bacterial differences of Phoebe bournei seedlings under NPK fertilization treatments.
Plants 10 01868 g003
Figure 4. Analysis of soil bacterial differences of Phoebe bournei seedlings under two-factor NPK fertilization treatments. (a) NP fertilizer application rate changes; (b) NK fertilizer application rate changes; (c) PK fertilizer application rate changes.
Plants 10 01868 g004
Figure 5. Analysis of soil bacterial differences of Phoebe bournei seedlings under single-factor NPK fertilization treatments. (a) N fertilizer application rate changes; (b) P fertilizer application rate changes; (c) K fertilizer application rate changes.
Plants 10 01868 g005
Figure 6. Scatter plots of soil bacterial marker species of Phoebe bournei seedlings under NPK fertilization treatments. The node in the network can be divided into four parts using Zi and Pi values, namely, peripherals, connectors, module hubs, and network hubs. Peripherals represent some specialists in microbial networks. Module hubs and connectors represent species that are close to generalists. Network hubs represent super-generalists among the microbial networks.
Plants 10 01868 g006
Figure 7. Complex interrelationships of soil bacteria with soil chemical properties, seedlings nutrient and biomass accumulation under NPK fertilization by the partial least squares path mode. Black solid and dashed lines represent significant effects (p < 0.05) and non-significant effects (p > 0.05), respectively. The data represent the magnitude and direction of the association between the two systems.
Plants 10 01868 g007
Table 1. Effect of NPK fertilization on soil chemical characteristics of Phoebe bournei seedlings.
NumberTreatmentN Content (g·Kg−1)P Content (g·Kg−1)K Content (g·Kg−1)pH
T1N0P0K02.86 ± 0.35 i0.35 ± 0.13 ef32.91 ± 1.67 g5.29 ± 0.01 b
T2N0P2K22.45 ± 0.09 j0.18 ± 0.01 gh51.91 ± 2.63 cd5.59 ± 0.07 a
T3N1P2K211.73 ± 0.33 b0.74 ± 0.01 c49.92 ± 3.88 de4.74 ± 0.01 e
T4N2P0K24.68 ± 0.04 h0.16 ± 0.04 h42.79 ± 0.24 ef4.43 ± 0.03 h
T5N2P1K25.17 ± 0.26 g0.25 ± 0.06 fgh58.88 ± 4.13 bc4.53 ± 0.04 g
T6N2P2K26.34 ± 0.19 ef0.50 ± 0.08 d39.18 ± 1.45 fg4.65 ± 0.04 f
T7N2P3K24.83 ± 0.14 h0.24 ± 0.02 fgh69.39 ± 5.50 a4.83 ± 0.07 d
T8N2P2K08.20 ± 0.08 c0.91 ± 0.13 b58.19 ± 7.34 bc4.97 ± 0.02 c
T9N2P2K16.50 ± 0.09 e0.45 ± 0.04 de48.48 ± 0.58 de4.84 ± 0.03 d
T10N2P2K35.29 ± 0.08 g0.28 ± 0.05 fgh43.67 ± 9.15 ef4.15 ± 0.04 j
T11N3P2K213.47 ± 0.26 a2.33 ± 0.18 a47.41 ± 3.08 de4.64 ± 0.01 f
T12N1P1K26.15 ± 0.12 f0.18 ± 0.02 gh61.86 ± 4.11 b4.45 ± 0.04 h
T13N1P2K12.79 ± 0.03 i0.35 ± 0.00 ef33.70 ± 2.50 g4.47 ± 0.01 gh
T14N2P1K17.42 ± 0.10 d0.31 ± 0.04 fg34.71 ± 3.04 g4.27 ± 0.02 i
RN11.022.1512.720.95
RP1.660.3430.210.40
RK2.900.6219.010.82
RNP11.022.1730.211.16
RNK11.022.1525.501.44
RPK3.520.7534.680.82
RNPK11.022.1736.691.44
Means ± SD with different letters indicate a significant difference among the 14 treatments, as determined by Duncan’s multiple range test (p < 0.05). R means the difference between the maximum and minimum values at different levels for single-factor, two-factor, and three-factor effects of N, P, and K fertilizer. RN is the difference at 4 N levels (T2, T3, T6, and T11), RP at 4 P levels (T4, T5, T6, and T7), RK at 4 K levels (T8, T9, T6, and T10), RNP at 8 NP levels (T2, T3, T4, T5, T6, T7, T11, and T12), RNK at 8 NK levels (T2, T3, T6, T8, T9, T10, T11, and T13), RPK at 8 PK levels (T4, T5, T6, T7, T8, T9, T10, and T14), and RNPK at 14 NPK levels (T1–T14).
Table 2. Effect of different fertilizer treatments on soil alpha diversity indices of soil bacterial in Phoebe bournei seedlings.
NumberTreatmentDiversity Index
Chao1SimpsonShannon
T1N0P0K01929.96 ± 84.55 a0.97 ± 0.01 a8.37 ± 0.44 a
T2N0P2K21577.62 ± 152.83 ab0.96 ± 0.02 ab7.60 ± 0.57 ab
T3N1P2K21389.66 ± 166.04 ab0.96 ± 0.02 ab7.10 ± 0.67 ab
T4N2P0K21102.84 ± 142.98 b0.95 ± 0.01 ab6.69 ± 0.43 b
T5N2P1K21048.23 ± 87.34 b0.95 ± 0.01 ab6.52 ± 0.40 b
T6N2P2K21380.80 ± 302.08 ab0.95 ± 0.04 ab7.16 ± 1.65 ab
T7N2P3K21281.24 ± 211.79 b0.94 ± 0.02 ab6.63 ± 0.71 b
T8N2P2K01250.01 ± 214.96 b0.96 ± 0.03 ab7.09 ± 1.21 ab
T9N2P2K11112.93 ± 7.42 b0.94 ± 0.01 ab6.69 ± 0.22 b
T10N2P2K31042.75 ± 196.40 b0.93 ± 0.02 b6.24 ± 0.88 b
T11N3P2K21150.40 ± 144.02 b0.95 ± 0.01 ab6.55 ± 0.60 b
T12N1P1K21370.78 ± 336.40 ab0.96 ± 0.04 ab7.28 ± 1.69 ab
T13N1P2K11171.17 ± 75.22 b0.95 ± 0.01 ab6.72 ± 0.47 b
T14N2P1K11056.21 ± 77.82 b0.96 ± 0.01 ab7.02 ± 0.50 ab
RN427.220.021.05
RP332.580.010.64
RK338.060.030.92
RNP529.390.021.08
RNK534.870.031.37
RPK338.060.030.92
RNPK887.220.052.13
Means ± SD with different letters indicate a significant difference among the 14 treatments, as determined by Duncan’s multiple range test (p < 0.05). R means the difference between the maximum and minimum values at different levels for single-factor, two-factor, and three-factor effects of N, P, and K fertilizer. RN is the difference at 4 N levels (T2, T3, T6, and T11), RP at 4 P levels (T4, T5, T6, and T7), RK at 4 K levels (T8, T9, T6, and T10), RNP at 8 NP levels (T2, T3, T4, T5, T6, T7, T11, and T12), RNK at 8 NK levels (T2, T3, T6, T8, T9, T10, T11, and T13), RPK at 8 PK levels (T4, T5, T6, T7, T8, T9, T10, and T14), and RNPK at 14 NPK levels (T1–T14).
Table 3. Topological parameters of bacterial network of different NPK fertilization conditions.
TopoNPKNPNKPKNPK
Number of Nodes617617617612615545594
Number of Edges3593359335933444359124473223
Closeness Centrality0.610.610.610.600.610.560.60
Average Path Length4.094.094.094.124.074.244.21
Transitivity0.610.610.610.620.600.700.64
Modularity0.750.750.750.760.750.730.76
Number of nodes: the number of nodes in the target network; number of edges: the number of edges in the target network; closeness centrality: the ratio of the average distance between the target node and all other nodes; average path length: the sum of all the short paths in the network; transitivity: the probability of connecting the target node and the adjacent node; modularity: the modularity index.
Table 4. The correlation analysis of dominant phylum bacteria and dominant genera bacteria.
SpeciesActinobacteriaChloroflexiAcidobacteriaProteobacteria
Cupriavidus0.0240.1050.063−0.038
Methylobacterium−0.703 **−0.659 **−0.689 **0.855 **
Brevundimonas−0.659 **−0.495 **−0.496 **0.651 **
Sphingobium−0.626 **−0.350 *−0.500 **0.643 **
Acinetobacter−0.641 **−0.442 **−0.617 **0.732 **
Sphingomonas−0.157−0.132−0.3700.298
*, ** indicate significant (p < 0.05) and highly significant (p < 0.01), respectively.
Table 5. Correlation analysis between key bacteria and soil chemical characteristics.
SpeciespHN ContentP ContentK Content
Methylobacterium−0.383 *0.2120.1410.140
Brevundimonas−0.2190.322 *0.1780.080
Sphingobium−0.1540.2400.1650.293 *
Acinetobacter−0.356 *0.433 **0.403 **0.080
*, ** indicate significant (p < 0.05) and highly significant (p < 0.01), respectively.
Table 6. The “3414” fertilization experiment rates [48].
No.Treatment 1N 1 (g·Plant−1)P2O5 1 (g·Plant−1)K2O 1 (g·Plant−1)
T1N0P0K00 (0)0 (0)0 (0)
T2N0P2K20 (0)2 (0.1332)2 (0.356)
T3N1P2K21 (0.266)2 (0.1332)2 (0.356)
T4N2P0K22 (0.532)0 (0)2 (0.356)
T5N2P1K22 (0.532)1 (0.0666)2 (0.356)
T6N2P2K22 (0.532)2 (0.1332)2 (0.356)
T7N2P3K22 (0.532)3 (0.1998)2 (0.356)
T8N2P2K02 (0.532)2 (0.1332)0 (0)
T9N2P2K12 (0.532)2 (0.1332)1 (0.178)
T10N2P2K32 (0.532)2 (0.1332)3 (0.534)
T11N3P2K23 (0.798)2 (0.1332)2 (0.356)
T12N1P1K21 (0.266)1 (0.0666)2 (0.356)
T13N1P2K11 (0.266)2 (0.1332)1 (0.178)
T14N2P1K12 (0.532)1 (0.0666)1 (0.178)
1 Treatment numbers represent no (0), low (1), medium (2), and high (3) levels of fertilization, respectively (values in parentheses represent a specific amount of fertilization). Data from Yang et al., 2020 [48].
Table 7. Biomass and macro-element accumulations of Phoebe bournei seedlings under different NPK fertilization conditions.
NumberTreatmentPlant Biomass (g·Plant−1) [48]N Accumulation (mg·Plant−1)P Accumulation (mg·Plant−1)K Accumulation (mg·Plant−1)
T1N0P0K02.89 ± 0.23 e31.43 ± 2.05 g9.14 ± 0.56 g78.36 ± 10.72 i
T2N0P2K22.73 ± 0.27 e39.87 ± 4.31 f11.80 ± 1.39 ef132.07 ± 11.24 fg
T3N1P2K24.01 ± 0.32 c55.50 ± 4.24 d14.98 ± 0.32 d158.46 ± 3.14 de
T4N2P0K24.97 ± 0.14 b62.71 ± 1.22 bc12.72 ± 0.22 e115.07 ± 1.71 h
T5N2P1K24.10 ± 0.07 c64.96 ± 0.84 b16.27 ± 3.25 cd220.64 ± 10.78 b
T6N2P2K27.27 ± 0.41 a82.45 ± 4.85 a24.68 ± 0.97 a323.91 ± 16.26 a
T7N2P3K24.71 ± 0.34 b58.85 ± 4.84 cd15.69 ± 0.75 cd120.47 ± 5.48 gh
T8N2P2K03.95 ± 0.14 c54.39 ± 0.70 d11.08 ± 0.38 ef91.79 ± 11.29 i
T9N2P2K13.97 ± 0.20 c64.83 ± 2.05 bc16.09 ± 0.18 cd145.80 ± 0.75 ef
T10N2P2K33.30 ± 0.12 d44.73 ± 5.19 ef10.40 ± 0.38 fg167.34 ± 7.97 cd
T11N3P2K22.73 ± 0.16 e47.73 ± 3.81 e12.79 ± 0.79 e111.10 ± 6.32 h
T12N1P1K24.65 ± 0.32 b62.46 ± 1.05 bc17.07 ± 0.48 bc180.19 ± 2.11 c
T13N1P2K14.69 ± 0.12 b65.76 ± 3.05 b18.78 ± 0.99 b175.76 ± 7.18 c
T14N2P1K14.20 ± 0.12 c64.04 ± 1.24 bc12.52 ± 1.13 e133.77 ± 7.29 fg
Means ± SD with different letters indicate a significant difference among the 14 treatments, as determined by Duncan’s multiple range test (p < 0.05). Data from Yang et al., 2020 [48].
Publisher’s Note: MDPI stays neutral with regard to jurisdictional claims in published maps and institutional affiliations.

