
The Effect of Specific Soil Microorganisms on Soil Quality Parameters and Organic Matter Content for Cereal Production


Abstract
:1. Introduction
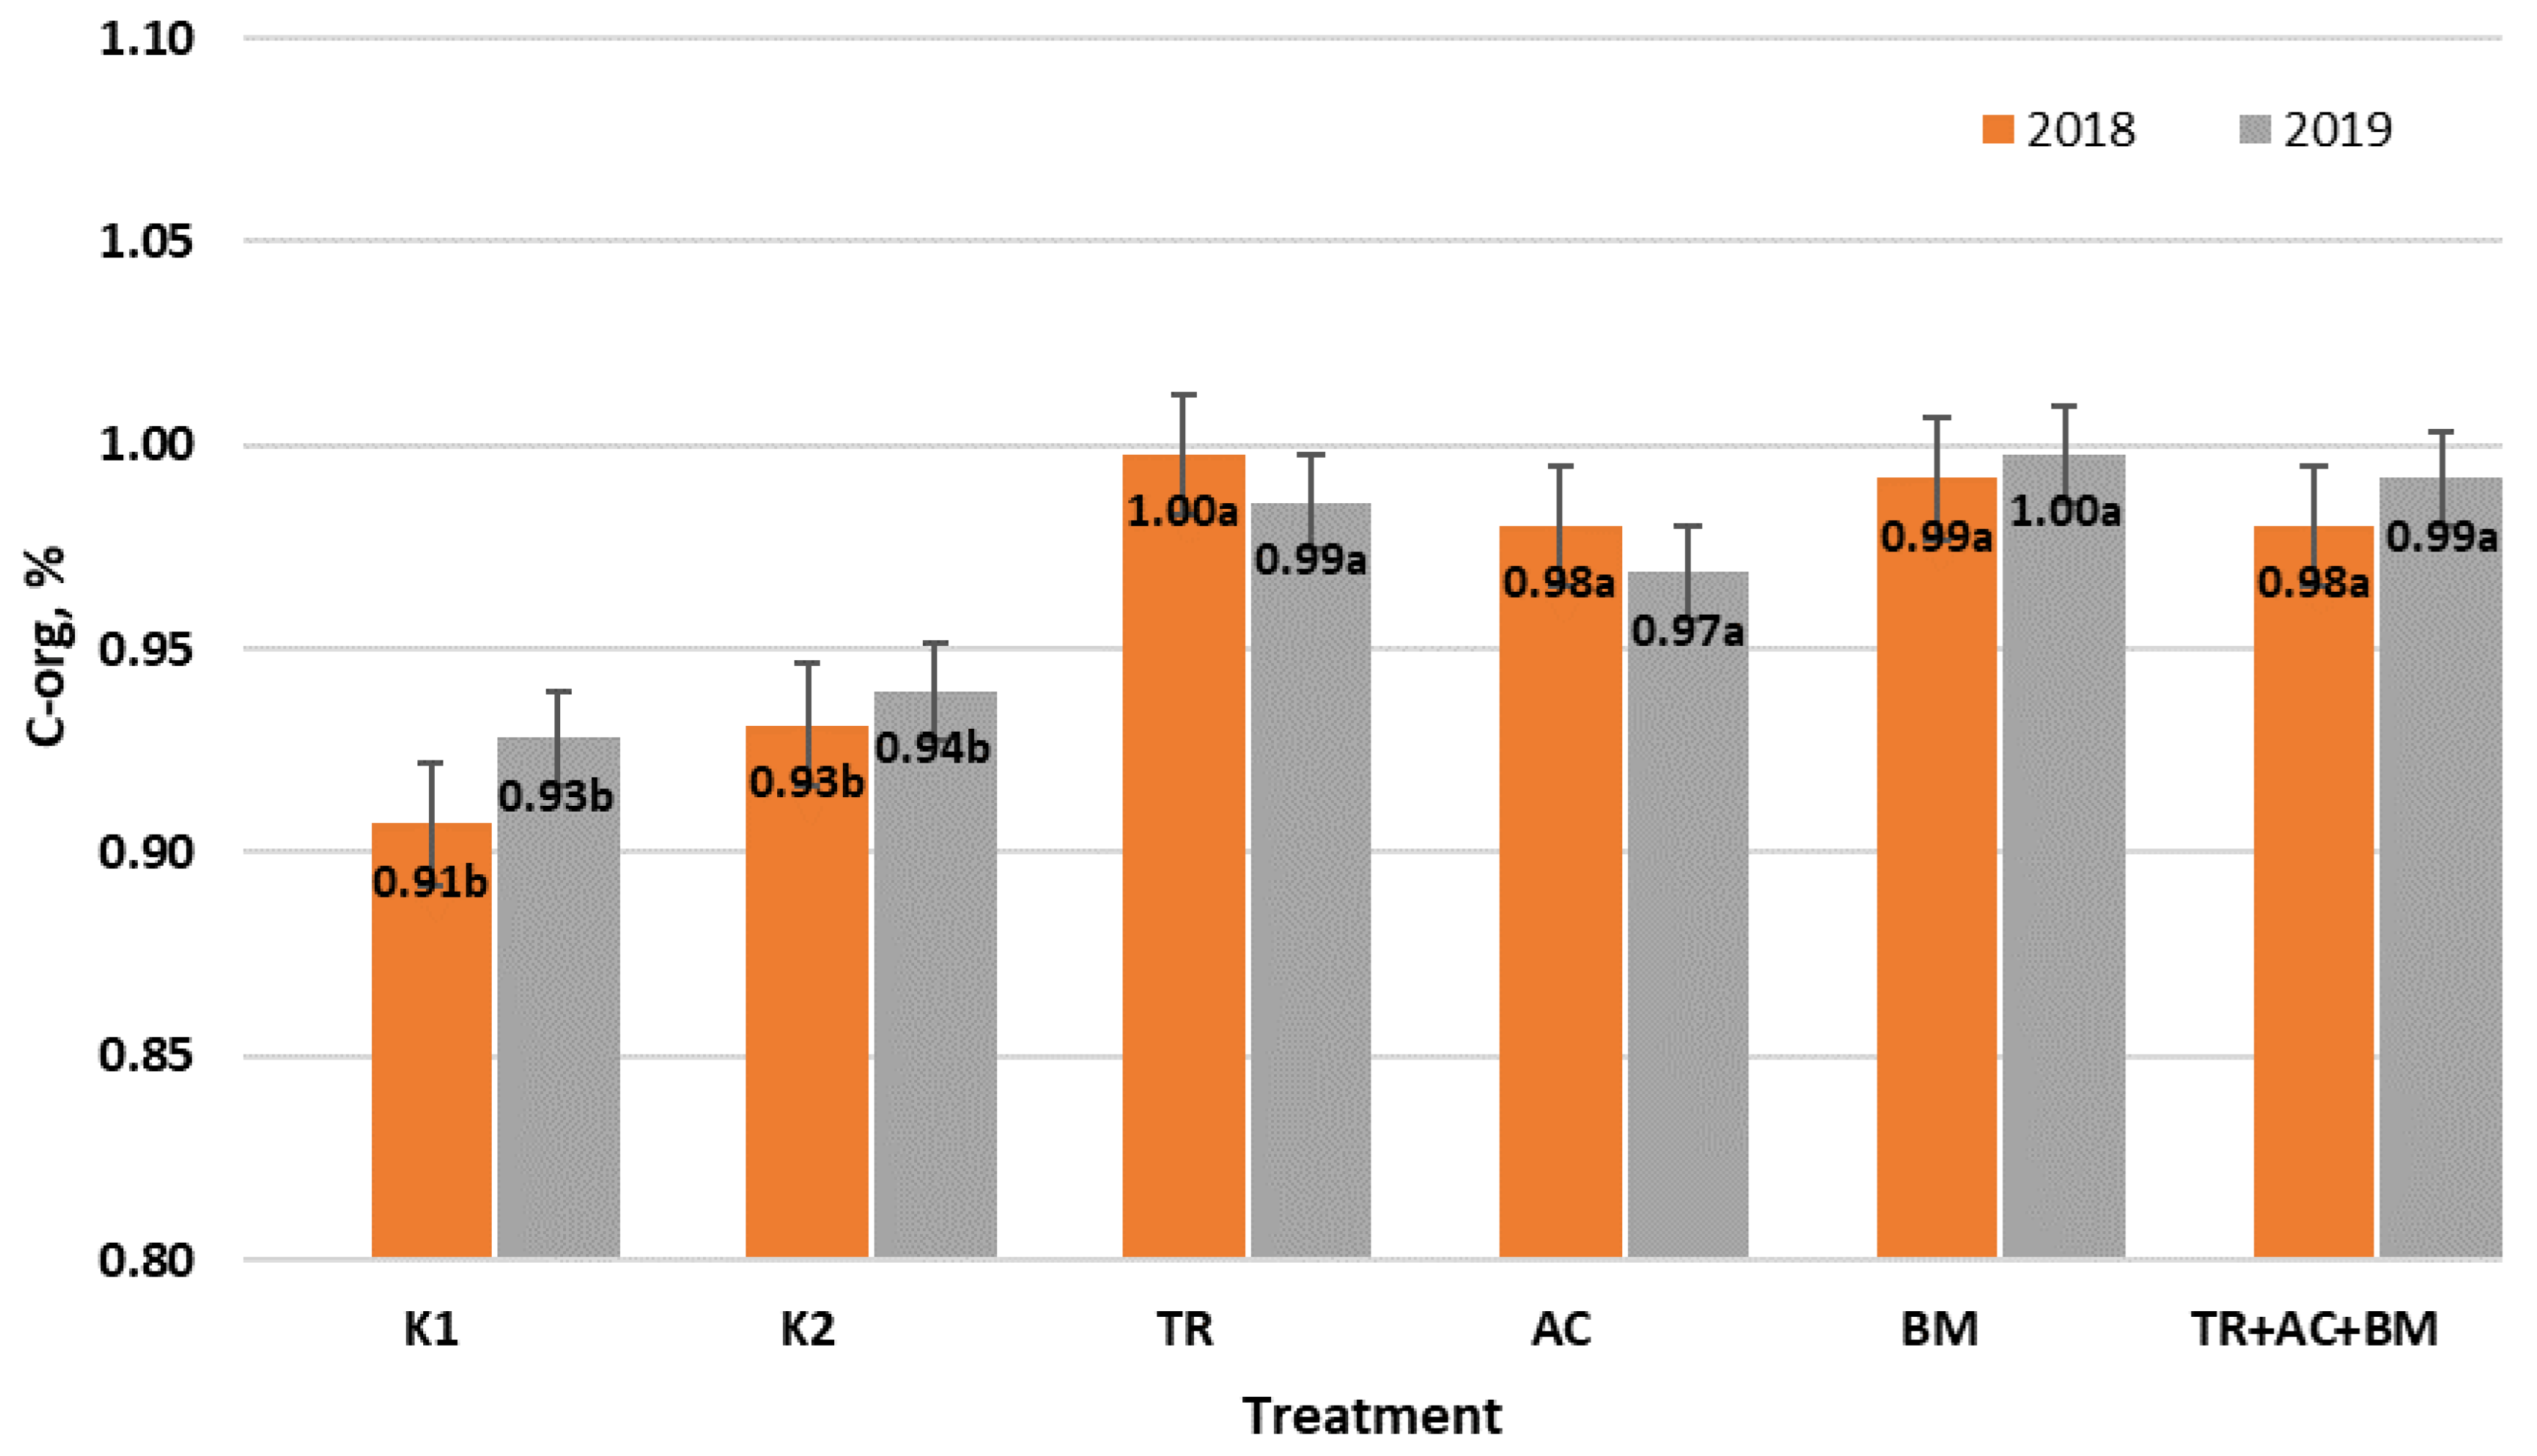
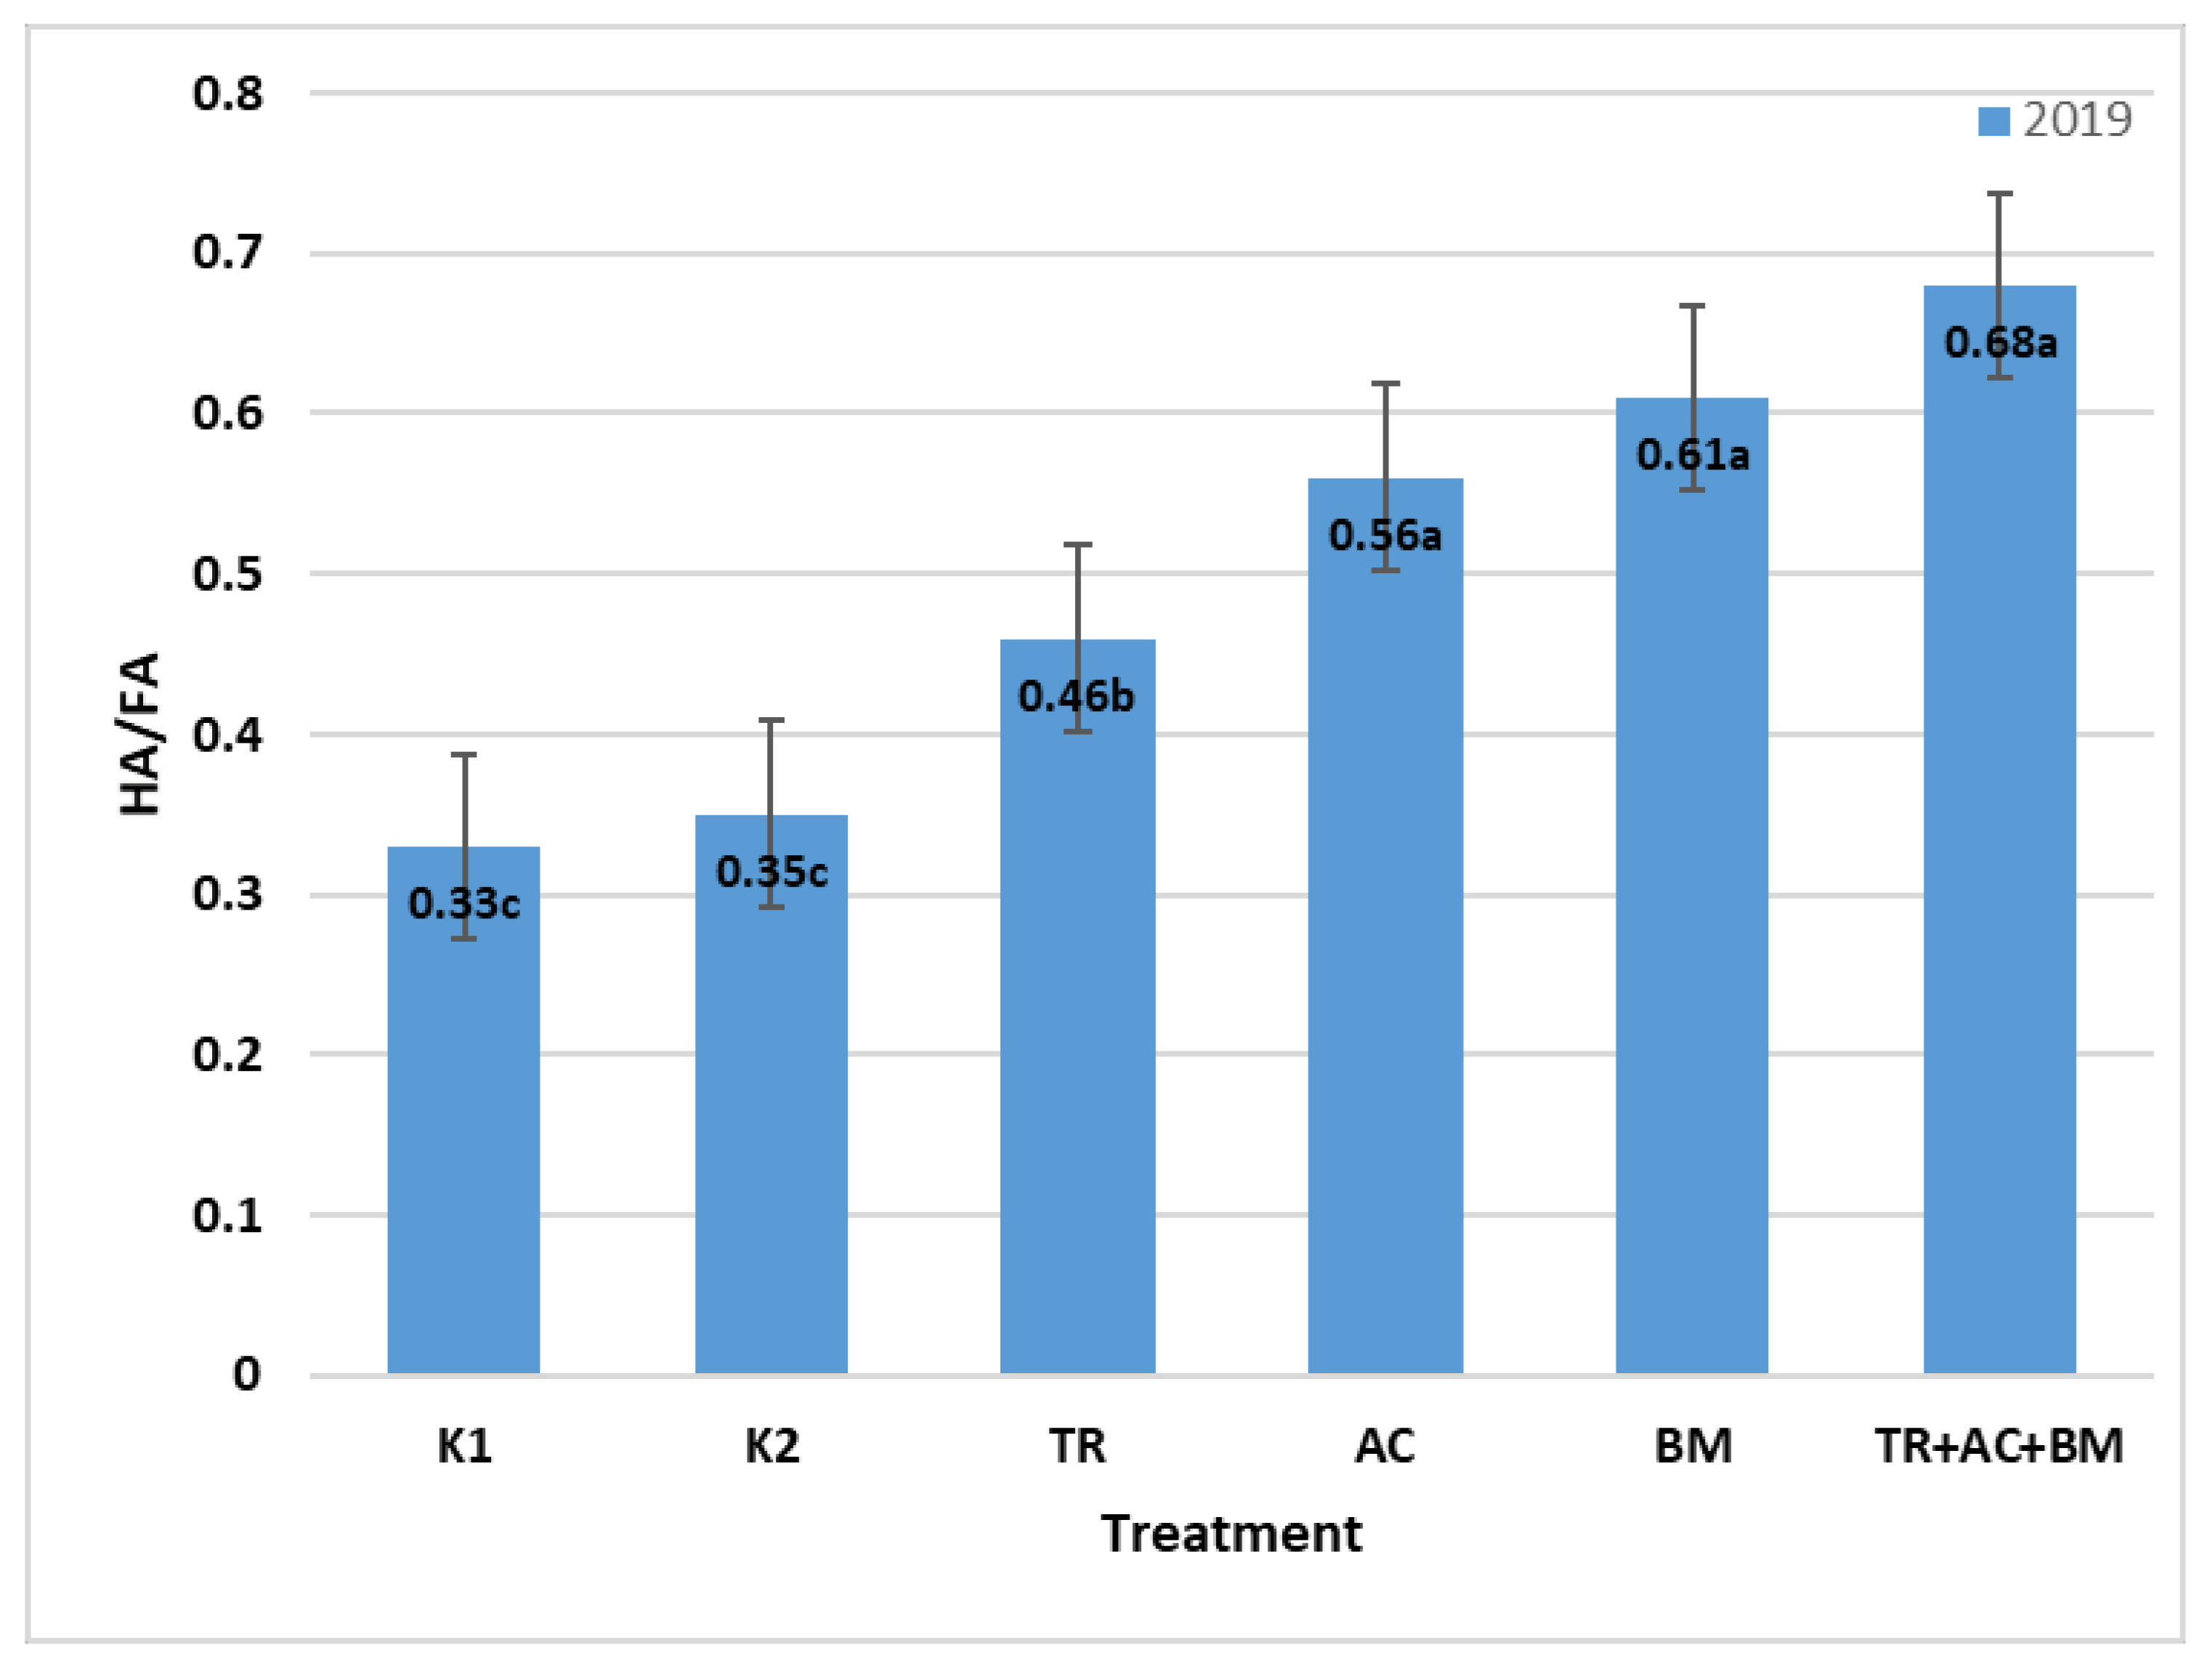
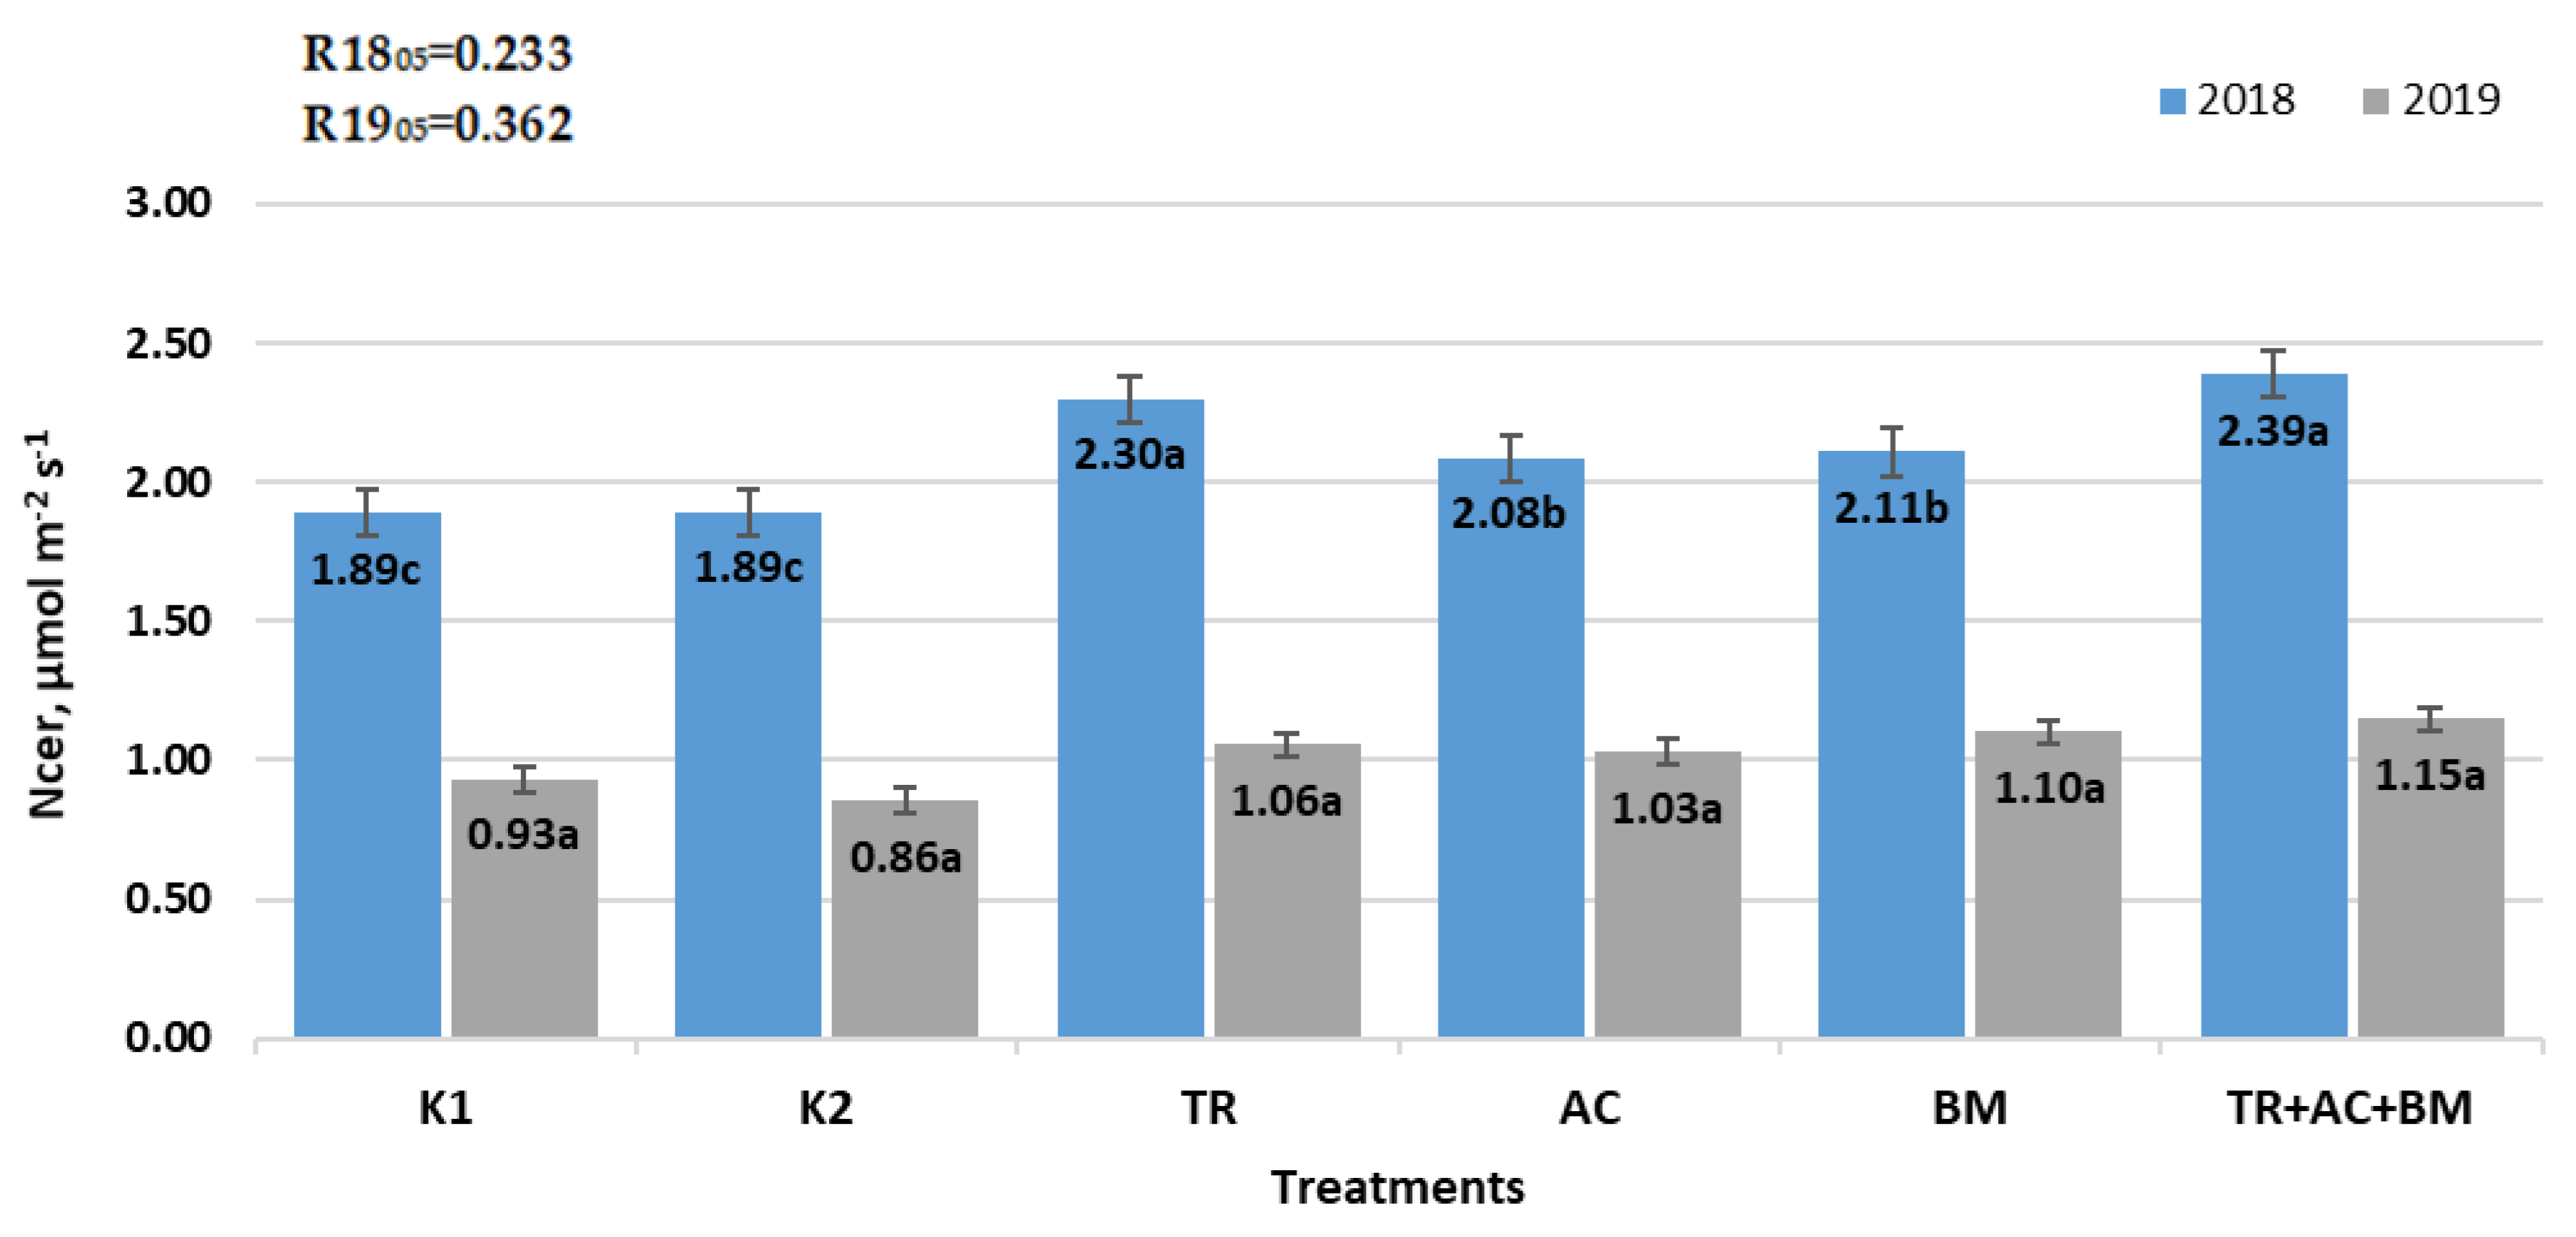
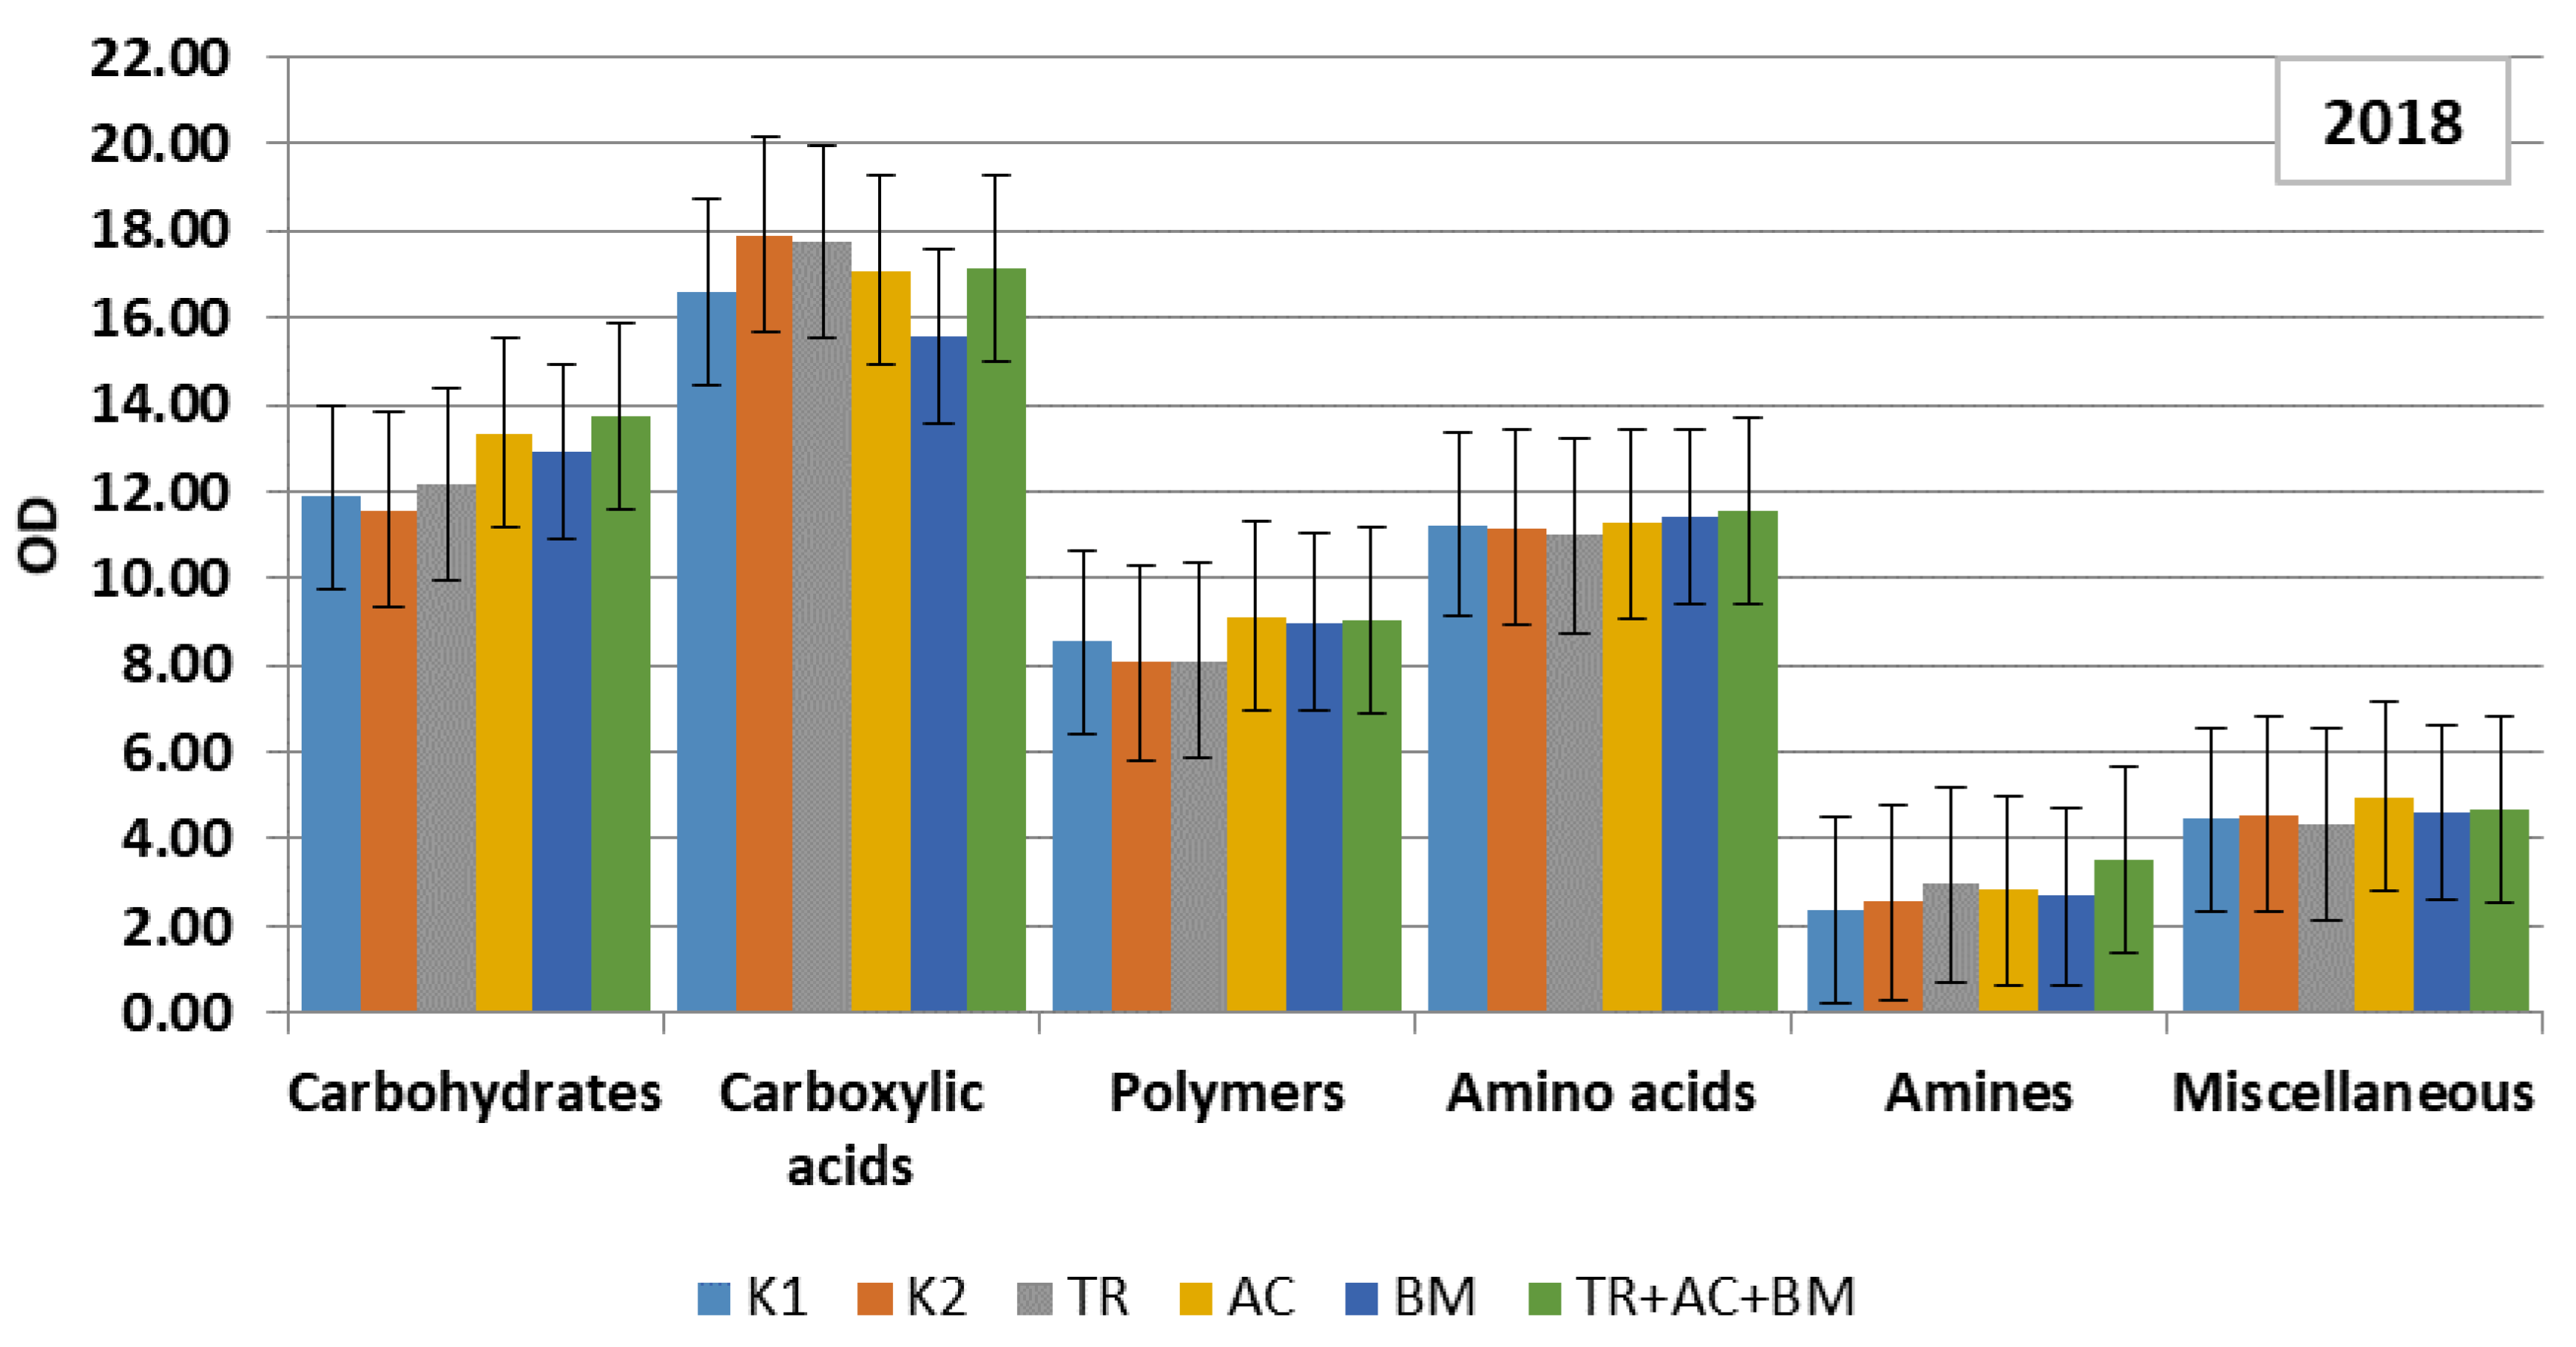
2. Results
3. Discussion
4. Materials and Methods
4.1. Site and Soil Description
4.2. Soil Sampling and Analysis
4.3. Soil Samples for Microorganism Extraction
4.4. Isolation of Microorganisms
4.5. Microbial Identification
4.6. Statistical Analysis
5. Conclusions
Author Contributions
Funding
Institutional Review Board Statement
Informed Consent Statement
Conflicts of Interest
References
- Chen, R.; Senbayram, M.; Blagodatsky, S.; Myachina, O.; Dittert, K.; Lin, X.; Blagodatskaya, E.; Kuzyakov, Y. Soil C and N Availability Determine the Priming Effect: Microbial N Mining and Stoichiometric Decomposition Theories. Glob. Chang. Biol. 2014, 20, 2356–2367. [Google Scholar] [CrossRef] [PubMed]
- Coonan, E.C.; Kirkby, C.A.; Kirkegaard, J.A.; Amidy, M.R.; Strong, C.L.; Richardson, A.E. Microorganisms and Nutrient Stoichiometry as Mediators of Soil Organic Matter Dynamics. Nutr. Cycl. Agroecosyst. 2020, 117, 273–298. [Google Scholar] [CrossRef]
- Aziz, I.; Mahmood, T.; Islam, K.R. Effect of Long Term No-till and Conventional Tillage Practices on Soil Quality. Soil Tillage Res. 2013, 131, 28–35. [Google Scholar] [CrossRef]
- Mącik, M.; Gryta, A.; Frąc, M. Biofertilizers in agriculture: An overview on concepts, strategies and effects on soil microorganisms. Adv. Agron. 2020, 162, 31–87. [Google Scholar] [CrossRef]
- Hammad, H.M.; Khaliq, A.; Abbas, F.; Farhad, W.; Fahad, S.; Aslam, M.; Shah, G.M.; Nasim, W.; Mubeen, M.; Bakhat, H.F. Comparative Effects of Organic and Inorganic Fertilizers on Soil Organic Carbon and Wheat Productivity under Arid Region. Commun. Soil Sci. Plant Anal. 2020, 51, 1406–1422. [Google Scholar] [CrossRef]
- Delgado-Baquerizo, M.; García-Palacios, P.; Milla, R.; Gallardo, A.; Maestre, F.T. Soil Characteristics Determine Soil Carbon and Nitrogen Availability during Leaf Litter Decomposition Regardless of Litter Quality. Soil Biol. Biochem. 2015, 81, 134–142. [Google Scholar] [CrossRef]
- Jacoby, R.; Peukert, M.; Succurro, A.; Koprivova, A.; Kopriva, S. The Role of Soil Microorganisms in Plant Mineral Nutrition—Current Knowledge and Future Directions. Front. Plant Sci. 2017, 8, 1617. [Google Scholar] [CrossRef] [Green Version]
- Sasse, J.; Martinoia, E.; Northen, T. Feed Your Friends: Do Plant Exudates Shape the Root Microbiome? Trends Plant Sci. 2018, 23, 25–41. [Google Scholar] [CrossRef] [Green Version]
- de Graaff, M.A.; Classen, A.T.; Castro, H.F.; Schadt, C.W. Labile Soil Carbon Inputs Mediate the Soil Microbial Community Composition and Plant Residue Decomposition Rates. New Phytol. 2010, 188, 1055–1064. [Google Scholar] [CrossRef] [Green Version]
- Venturi, V.; Keel, C. Signaling in the Rhizosphere. Trends Plant Sci. 2016, 21, 187–198. [Google Scholar] [CrossRef]
- Pieterse, C.M.J.; Zamioudis, C.; Berendsen, R.L.; Weller, D.M.; van Wees, S.C.M.; Bakker, P.A.H.M. Induced Systemic Resistance by Beneficial Microbes. Annu. Rev. Phytopathol. 2014, 52, 347–375. [Google Scholar] [CrossRef] [Green Version]
- Nascimento, F.X.; Hernández, A.G.; Glick, B.R.; Rossi, M.J. Plant Growth-Promoting Activities and Genomic Analysis of the Stress-Resistant Bacillus Megaterium STB1, a Bacterium of Agricultural and Biotechnological Interest. Biotechnol. Rep. 2020, 25. [Google Scholar] [CrossRef]
- Shinwari, Z.; Bot, P.J.; Kang, S.-M.; Latif Khan, A.; Hamayun, M.; Shinwari, Z.K.; Kim, Y.-H.; Joo, G.-J.; Lee, I.-J. Acinetobacter Calcoaceticus Ameliorated Plant Growth and Influenced Gibberellins and Functional Biochemicals. Pak. J. Bot. 2012, 44, 365–372. [Google Scholar]
- Sachdev, D.; Nema, P.; Dhakephalkar, P.; Zinjarde, S.; Chopade, B. Assessment of 16S RRNA Gene-Based Phylogenetic Diversity and Promising Plant Growth-Promoting Traits of Acinetobacter Community from the Rhizosphere of Wheat. Microbiol. Res. 2010, 165, 627–638. [Google Scholar] [CrossRef]
- Peciulyte, A.; Anasontzis, G.E.; Karlström, K.; Larsson, P.T.; Olsson, L. Morphology and Enzyme Production of Trichoderma Reesei Rut C-30 Are Affected by the Physical and Structural Characteristics of Cellulosic Substrates. Fungal Genet. Biol. 2014, 72, 64–72. [Google Scholar] [CrossRef] [Green Version]
- Adav, S.S.; Sze, S.K. Trichoderma Secretome: An Overview. In Biotechnology and Biology of Trichoderma; Elsevier: Amsterdam, The Netherlands, 2014; pp. 103–114. ISBN 978-0-444-59576-8. [Google Scholar]
- Adav, S.S.; Chao, L.T.; Sze, S.K. Quantitative Secretomic Analysis of Trichoderma Reesei Strains Reveals Enzymatic Composition for Lignocellulosic Biomass Degradation. Mol. Cell. Proteom. 2012, 11, M111.012419-1–M111.012419-15. [Google Scholar] [CrossRef] [Green Version]
- Larney, F.J.; Angers, D.A. The Role of Organic Amendments in Soil Reclamation: A Review. Can. J. Soil Sci. 2012, 92, 19–38. [Google Scholar] [CrossRef]
- Nuzzo, A.; Satpute, A.; Albrecht, U.; Strauss, S.L. Impact of Soil Microbial Amendments on Tomato Rhizosphere Microbiome and Plant Growth in Field Soil. Microb. Ecol. 2020, 80, 398–409. [Google Scholar] [CrossRef]
- Sessitsch, A.; Brader, G.; Pfaffenbichler, N.; Gusenbauer, D.; Mitter, B. The Contribution of Plant Microbiota to Economy Growth. Microb. Biotechnol. 2018, 11, 801–805. [Google Scholar] [CrossRef]
- van Veen, J.A.; van Overbeek, L.S.; Dirk, J.; Elsas, V. Fate and Activity of Microorganisms Introduced into Soil. Microbiol. Mol. Biol. Rev. 1997, 61, 121–135. [Google Scholar] [CrossRef] [PubMed]
- Trivedi, P.; Singh, K.; Pankaj, U.; Verma, S.K.; Verma, R.K.; Patra, D.D. Effect of Organic Amendments and Microbial Application on Sodic Soil Properties and Growth of an Aromatic Crop. Ecol. Eng. 2017, 102, 127–136. [Google Scholar] [CrossRef]
- Pii, Y.; Mimmo, T.; Tomasi, N.; Terzano, R.; Cesco, S.; Crecchio, C. Microbial Interactions in the Rhizosphere: Beneficial Influences of Plant Growth-Promoting Rhizobacteria on Nutrient Acquisition Process. A Review. Biol. Fertil. Soils 2015, 51, 403–415. [Google Scholar] [CrossRef]
- Schmidt, M.W.I.; Skjemstad, J.O.; Gehrt, E.; Kögel-Knabner, I. Charred organic carbon in German chernozemic soils. Eur. J. Soil Sci. 1999, 50, 351–365. [Google Scholar] [CrossRef]
- Garland, J.L.; Mills, A.L. Classification and Characterization of Heterotrophic Microbial Communities on the Basis of Patterns of Community-Level Sole-Carbon-Source Utilization. Appl. Environ. Microbiol. 1991, 57, 2351–2359. [Google Scholar] [CrossRef] [PubMed] [Green Version]
- Wan, W.; Qin, Y.; Wu, H.; Zuo, W.; He, H.; Tan, J.; Wang, Y.; He, D. Isolation and Characterization of Phosphorus Solubilizing Bacteria With Multiple Phosphorus Sources Utilizing Capability and Their Potential for Lead Immobilization in Soil. Front. Microbiol. 2020, 11, 752. [Google Scholar] [CrossRef] [PubMed] [Green Version]
- Nautiyal, C.S. An Efficient Microbiological Growth Medium for Screening Phosphate Solubilizing Microorganisms. FEMS Microbiol. Lett. 1999, 170, 265–270. [Google Scholar] [CrossRef]
- Vargas Gil, S.; Pastor, S.; March, G.J. Quantitative Isolation of Biocontrol Agents Trichoderma spp., Gliocladium spp. and Actinomycetes from Soil with Culture Media. Microbiol. Res. 2009, 164, 196–205. [Google Scholar] [CrossRef]


| Chemical Farm with Poor Crop Rotation | Chemical Farm with 5 Field Crop Rotations | Ecological Farm | Natural Meadows | |
|---|---|---|---|---|
| Total amount of phosphorus solubilizing bacteria CFU/g | 4.1 × 10⁵ | 6.2 × 10⁶ | 5.3 × 10⁵ | 2.8 × 10⁵ |
| Total amount of nitrogen fixing bacteria CFU/g | 3.1 × 10⁶ | 8.1 × 10⁶ | 3.8 × 10⁵ | 3.1 × 10⁵ |
| Total amount of fungi CFU/g | 2.7 × 10⁴ | 2.5 × 10⁵ | 2.1 × 10⁴ | 3.2 × 10⁴ |
| Sample pH | 7.72 | 7.31 | 6.91 | 7.91 |
| Treatments | Abbreviations | Application of Bioproducts | |
|---|---|---|---|
| After Harvesting—For Decomposition of Organic Residues | After Germination BBCH12–15 | ||
| Control 1 | K1 | - | - |
| Control 2 | K2 | ammonium nitrate | - |
| Trichoderma reesei | TR | Trichoderma reesei | |
| Acinetobacter calcoaceticus | AC | - | Acinetobacter calcoaceticus |
| Bacillus megaterium | BM | - | Bacillus megaterium |
| Trichoderma reesei + Acinetobacter calcoaceticus + Bacillus megaterium | TR + AC + BM | Trichoderma reesei | Acinetobacter calcoaceticus + Bacillus megaterium |
| Pikovskaya (PVK) Agar | National Botanical Research Institute’s Phosphate Growth Medium (NBRIY) | |
|---|---|---|
| Glucose | 10.0 | 10.0 |
| Yeast Extract | 0.5 | - |
| (NH4)2SO4 | 0.5 | 0.5 |
| MgSO4·7H2O | 0.1 | 0.1 |
| Ca3(PO4)2 | 5.0 | 5.0 |
| NaCl | 0.2 | 0.2 |
| KCl | 0.2 | 0.2 |
| MnSO4·2H2O | 0.002 | 0.002 |
| FeSO4·7H2O | 0.002 | 0.002 |
| Agar | 15.0 | 15.0 |
| Sucrose | 20.0 |
| K2HPO4 | 1.0 |
| MgSO4 | 0.5 |
| NaCl | 0.5 |
| FeSO4 | 0.1 |
| Na2MoO4 | 0.005 |
| CaCO3 | 2.0 |
| Agar | 15.0 |
| Glucose | 40.0 |
| Peptone | 10.0 |
| Chloramphenicol | 0.05 |
| Agar | 15.0 |
Publisher’s Note: MDPI stays neutral with regard to jurisdictional claims in published maps and institutional affiliations. |
© 2021 by the authors. Licensee MDPI, Basel, Switzerland. This article is an open access article distributed under the terms and conditions of the Creative Commons Attribution (CC BY) license (https://creativecommons.org/licenses/by/4.0/).
Share and Cite
Jurys, A.; Feizienė, D. The Effect of Specific Soil Microorganisms on Soil Quality Parameters and Organic Matter Content for Cereal Production. Plants 2021, 10, 2000. https://doi.org/10.3390/plants10102000
Jurys A, Feizienė D. The Effect of Specific Soil Microorganisms on Soil Quality Parameters and Organic Matter Content for Cereal Production. Plants. 2021; 10(10):2000. https://doi.org/10.3390/plants10102000
Chicago/Turabian StyleJurys, Arnoldas, and Dalia Feizienė. 2021. "The Effect of Specific Soil Microorganisms on Soil Quality Parameters and Organic Matter Content for Cereal Production" Plants 10, no. 10: 2000. https://doi.org/10.3390/plants10102000
APA StyleJurys, A., & Feizienė, D. (2021). The Effect of Specific Soil Microorganisms on Soil Quality Parameters and Organic Matter Content for Cereal Production. Plants, 10(10), 2000. https://doi.org/10.3390/plants10102000