Spatial Interaction Effect of Population Density Patterns in Sub-Districts of Northeastern Thailand


Abstract
1. Introduction
2. Materials and Methods
2.1. Study Area
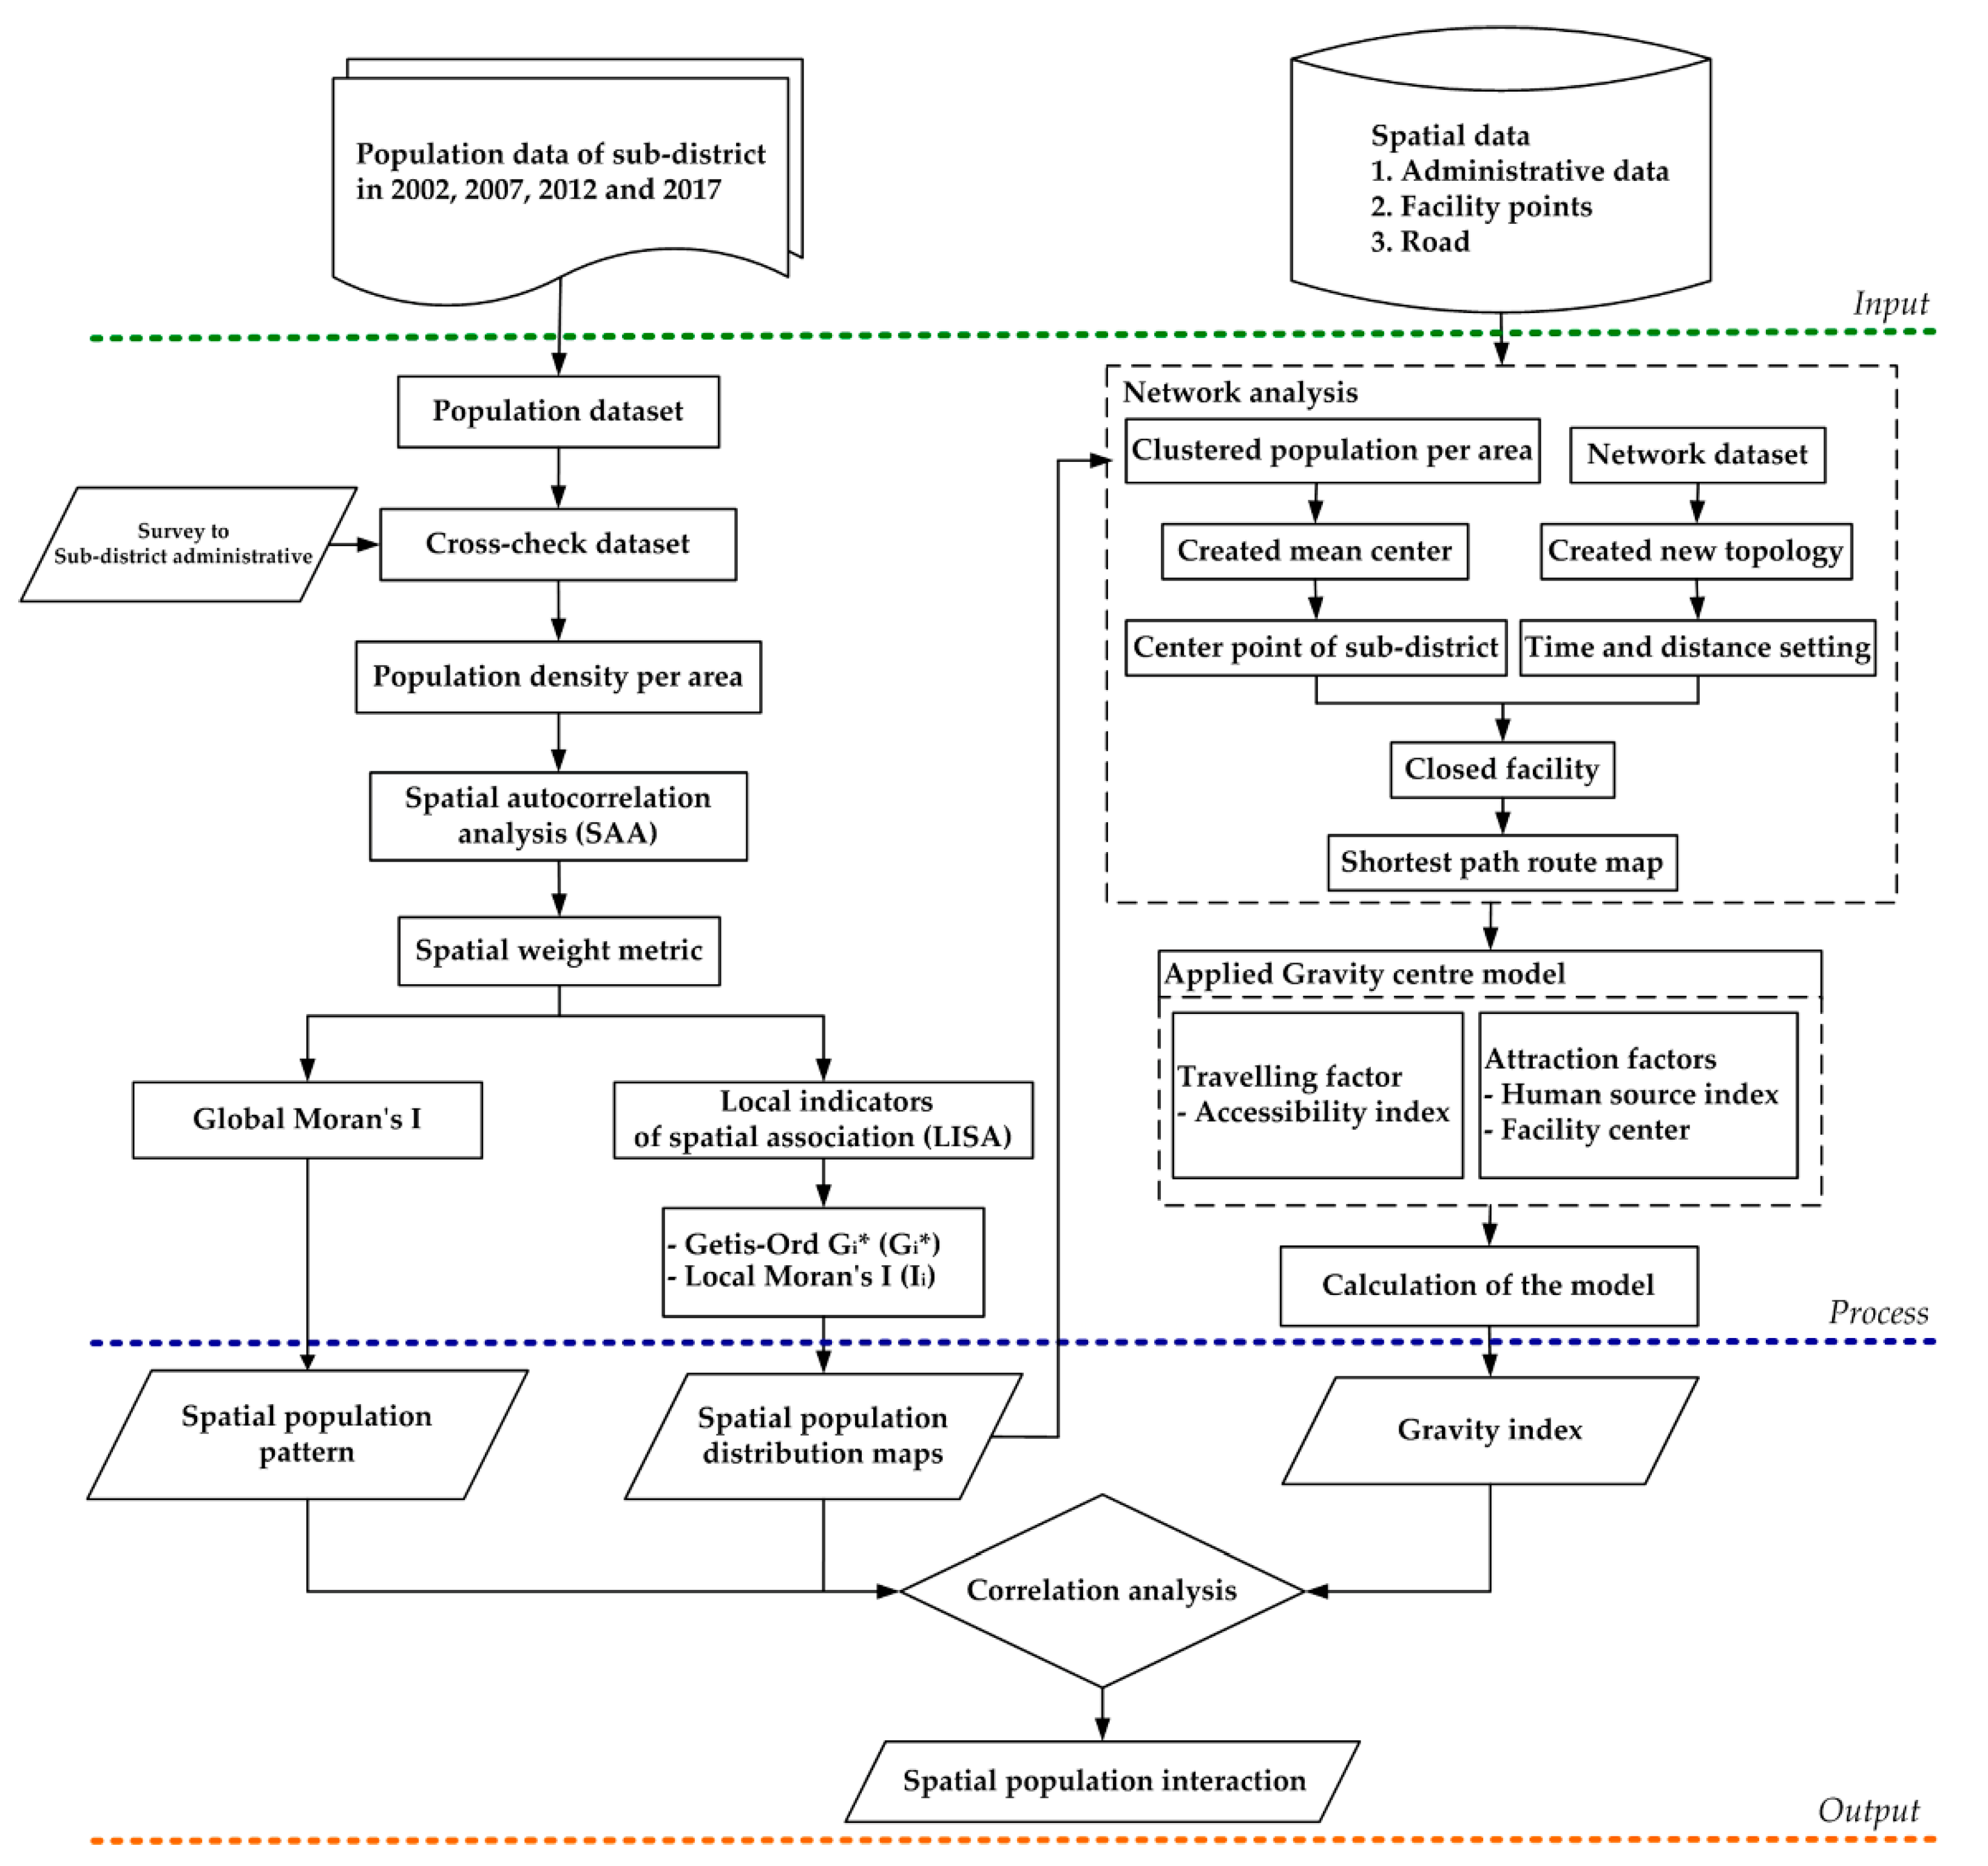
2.2. Data Acquisition and Preparation
2.3. Spatial Autocorrelation Analysis
2.4. Gravity Centre Model
2.5. Interaction between Gravity Index and Related Factors
3. Results
3.1. Spatial Pattern Analysis Using Spatial Autocorrelation
3.2. Gravity Centre Index
3.3. Interaction of Gravity Index and Factors Related to Population
4. Discussion
5. Conclusions
Author Contributions
Funding
Acknowledgments
Conflicts of Interest
References
- Foran, T.; Ward, J.; Leitch, A.; Smajgl, A. Exploring Mekong Futures: Compilation of Scenarios; Technical Report, June 2012; CSIRO: Canberra, Australia, 2012. [Google Scholar]
- National Statistical Office. Number of Population from Registration by Sex, Area, Density, House, Region and Province: 2008–2017. Available online: http://statbbi.nso.go.th/staticreport/page/sector/th/01.aspx (accessed on 26 August 2019).
- Chattranond, O. Isan in Asean: Inequality and regional development. J. Public Adm. Pol. 2020, 9, 81–104. [Google Scholar]
- Pinyochatchinda, S.; Walsh, J. The role of SEZs in Thailand’s regional economic development. Bus. Manag. Rev. 2015, 6, 199. [Google Scholar]
- Turner, B.; Mauer, B.A. Geographical population analysis: Tools for the analysis of biodiversity. J. Ecol. 1994, 82, 981. [Google Scholar] [CrossRef]
- Páez, A.; Scott, D.M. Spatial statistics for urban analysis: A review of techniques with examples. GeoJournal 2004, 61, 53–67. [Google Scholar] [CrossRef]
- Hu, Z.; Lo, C. Modeling urban growth in Atlanta using logistic regression. Comput. Environ. Urban Syst. 2007, 31, 667–688. [Google Scholar] [CrossRef]
- Ramos, R. Gravity models: A tool for migration analysis. IZA World Labor 2016, 239, 1–10. [Google Scholar] [CrossRef]
- Carrothers, G.A.P. An historical bedew of the gravity and potential concepts of human interaction. J. Am. Inst. Plan. 1956, 22, 94–102. [Google Scholar] [CrossRef]
- Gordon, I. Densities, urban form and travel behaviour. Town Ctry. Plan. 1997, 66, 239–241. [Google Scholar]
- Jones, C.; Pimdee, P. Innovative ideas: Thailand 4.0 and the fourth industrial revolution. Asian Int. J. Soc. Sci. 2017, 17, 4–35. [Google Scholar] [CrossRef]
- Shao, Y.; Walsh, S.J.; Entwisle, B.; Rindfuss, R.R. Spatial clustering and urban settings of rural migrants in Bangkok, Thailand. Geocarto Int. 2008, 23, 35–52. [Google Scholar] [CrossRef]
- Liu, C.; Wu, X.; Wang, L. Analysis on land ecological security change and affect factors using RS and GWR in the Danjiangkou Reservoir area, China. Appl. Geogr. 2019, 105, 1–14. [Google Scholar] [CrossRef]
- Orsi, F.; Geneletti, D. Using geotagged photographs and GIS analysis to estimate visitor flows in natural areas. J. Nat. Conserv. 2013, 21, 359–368. [Google Scholar] [CrossRef]
- Anselin, L. Local Indicators of spatial association-LISA. Geogr. Anal. 2010, 27, 93–115. [Google Scholar] [CrossRef]
- Lei, C.; Zhang, A.; Qi, Q.; Su, H.; Wang, J. Spatial-temporal analysis of human dynamics on urban land use patterns using social media data by gender. ISPRS Int. J. Geo-Inf. 2018, 7, 358. [Google Scholar] [CrossRef]
- Mathur, M. Spatial autocorrelation analysis in plant population: An overview. J. Appl. Nat. Sci. 2015, 7, 501–513. [Google Scholar] [CrossRef]
- Oden, N. Adjusting Moran’s I for population density. Stat. Med. 1995, 14, 17–26. [Google Scholar] [CrossRef]
- Wang, W.C.; Chang, Y.-J.; Wang, H.-C. An application of the spatial autocorrelation method on the change of real estate prices in Taitung city. ISPRS Int. J. Geo-Inf. 2019, 8, 249. [Google Scholar] [CrossRef]
- Assuncao, R.M.; Reis, E.A. A new proposal to adjust Moran’s I for population density. Stat. Med. 1999, 18, 2147–2162. [Google Scholar] [CrossRef]
- Gutiérrez, A.; Arauzo-Carod, J.-M. Spatial analysis of clustering of foreclosures in the poorest-quality housing urban areas: Evidence from Catalan cities. ISPRS Int. J. Geo-Inf. 2018, 7, 23. [Google Scholar] [CrossRef]
- Millward, H.; Bunting, T. Patterning in urban population densities: A spatiotemporal model compared with Toronto 1971–2001. Environ. Plan. A Econ. Space 2008, 40, 283–302. [Google Scholar] [CrossRef]
- Rodríguez-Rangel, M.C.; Sánchez-Rivero, M. Spatial imbalance between tourist supply and demand: The identification of spatial clusters in Extremadura, Spain. Sustainability 2020, 12, 1651. [Google Scholar] [CrossRef]
- Sarrión-Gavilán, M.D.; Márquez, M.D.B.; Mora-Rangel, E.O. Spatial distribution of tourism supply in Andalusia. Tour. Manag. Perspect. 2015, 15, 29–45. [Google Scholar] [CrossRef]
- Schuurman, N.; Peters, P.A.; Oliver, L.N. Are obesity and physical activity clustered? A spatial analysis linked to residential density. Obesity 2009, 17, 2202–2209. [Google Scholar] [CrossRef] [PubMed]
- Jeefoo, P. Analyzing spatial clustering and hotspots detection of HIV/AIDS prevalence using GIS technology. Int. J. Geoinf. 2016, 12, 65–73. [Google Scholar]
- Luo, Y.; Yu, H.; Liu, S.; Liang, Y.; Liu, S. Spatial heterogeneity and coupling of economy and population gravity centres in the Hengduan Mountains. Sustainability 2019, 11, 1508. [Google Scholar] [CrossRef]
- Yang, M.; Ma, J.; Jia, P.; Pu, Y.; Chen, G. The use of spatial autocorrelation to analyze changes in spatial distribution patterns of population density in Jiangsu province, China. In Proceedings of the 2011 19th International Conference on Geoinformatics, Shanghai, China, 24–26 June 2011. [Google Scholar]
- Haggett, P. Geography: A Global Synthesis, 4th ed.; Prentice Hall: Harlow, UK, 2001. [Google Scholar]
- Haynes, K.E.; Fotheringham, A.S. Gravity and Spatial Interaction Models; Sage: Beverly Hills, CA, USA, 1984; Volume 2. [Google Scholar]
- Kurowska, K.; Kryszk, H.; Kietlińska, E. The Use of Gravity Model in Spatial Planning. In Proceedings of the International Conference on Environmental Engineering, ICEE, Vilnius, Lithuania, 27–28 April 2017. [Google Scholar]
- Bivand, R.S.; Wong, D.W.S. Comparing implementations of global and local indicators of spatial association. TEST 2018, 27, 716–748. [Google Scholar] [CrossRef]
- Mitchell, A. The ESRI guide to GIS analysis. In Spatial Measurements and Statistics; ESRI Guide to GIS Analysis; ESRI Press: Redlands, CA, USA, 2005. [Google Scholar]
- Ord, J.K.; Getis, A. Local spatial autocorrelation statistics: Distributional issues and an application. Geogr. Anal. 1995, 27, 286–306. [Google Scholar] [CrossRef]
- Junior, G.B.; de Paiva, A.C.; Silva, A.C.; de Oliveira, A.C.M. Classification of breast tissues using Moran’s index and Geary’s coefficient as texture signatures and SVM. Comput. Biol. Med. 2009, 39, 1063–1072. [Google Scholar] [CrossRef]
- Rutter, C.M.; Isaaks, E.H.; Srivastava, R.M. An introduction to applied geostatistics. J. Am. Stat. Assoc. 1991, 86, 548. [Google Scholar] [CrossRef]
- Fortin, M.-J.; Dale, M.R.T.; Ver Hoef, J. Spatial analysis in ecology. In Encyclopedia of Environmetrics; El-Shaarawi, A.H., Piegorsch, W.W., Eds.; John Wiley & Sons Ltd.: Chichester, England, 2002; Volume 4, pp. 2051–2058. [Google Scholar]
- Huff, D.L. A Probabilistic analysis of shopping center trade areas. Land Econ. 1963, 39, 81. [Google Scholar] [CrossRef]
- Huff, D.L. Parameter estimation in the Huff model. ArcUser. Ann. GIS 2003, 19, 34–36. [Google Scholar]
- Lakshmanan, J.R.; Hansen, W.G. A retail market potential model. J. Am. Inst. Plan. 1965, 31, 134–143. [Google Scholar] [CrossRef]
- Lee, S.-H.; Choi, J.-Y.; Yoo, S.-H.; Oh, Y.-G. Evaluating spatial centrality for integrated tourism management in rural areas using GIS and network analysis. Tour. Manag. 2013, 34, 14–24. [Google Scholar] [CrossRef]
- Bai, J.; Li, S.; Wang, N.; Shi, J.; Li, X. Spatial spillover effect of new energy development on economic growth in developing areas of China—An empirical test based on the spatial Dubin model. Sustainability 2020, 12, 3249. [Google Scholar] [CrossRef]
- Sánchez-Martín, J.-M.; Gallego, J.I.R.; Blas-Morato, R. Hot Spot analysis versus cluster and outlier analysis: An Enquiry into the grouping of rural accommodation in Extremadura (Spain). ISPRS Int. J. Geo-Inf. 2019, 8, 176. [Google Scholar] [CrossRef]
- Eichhorn, S. Disaggregating population data and evaluating the accuracy of modeled high-resolution population distribution—The case study of Germany. Sustainability 2020, 12, 3976. [Google Scholar] [CrossRef]
- Wei, C.; Wang, Z.; Lan, X.; Zhang, H.; Fan, M. The spatial-temporal characteristics and dilemmas of sustainable urbanization in China: A new perspective based on the Concept of Five-in-One. Sustainability 2018, 10, 4733. [Google Scholar] [CrossRef]
- Department of Industrial Works. Statistics on Number of Factories and Permitted to Operate, Northeastern Region; Ministry of Industry: Bangkok, Thailand, 2014. Available online: http://service.nso.go.th/nso/web/statseries/statseries16.html (accessed on 30 August 2019).
- Ronghanam, P.; Bejranade, M. Emerging of low-cost carrier and changing of aviation network, airport hierarchy and relationship between the economics of airport located province. Built Environ. 2019, 18, 51–68. [Google Scholar] [CrossRef]
- Office of the National Economic and Social Development Board. Per Capita Income of Population by Region and Province; Office of the Prime Minister: Bangkok, Thailand, 2014. Available online: http://service.nso.go.th/nso/web/service/service03.html (accessed on 30 August 2019).
- Chotchaiwong, P.; Wijitkosum, S. Predicting urban expansion and urban land use changes in Nakhon Ratchasima city using A CA-Markov model under two different scenarios. Land 2019, 8, 140. [Google Scholar] [CrossRef]
- Bunea, D. Modern gravity models of internal migration. The case of Romania. Theor. Appl. Econ. 2012, 4, 127. [Google Scholar]
- Mafi, S.; Abdelrazig, Y.; Amirinia, G.; Kocatepe, A.; Ulak, M.B.; Ozguven, E.E. Investigating exposure of the population to crash injury using a spatiotemporal analysis: A case study in Florida. Appl. Geogr. 2019, 104, 42–55. [Google Scholar] [CrossRef]


| Years | Moran’s I | p-Value | Z-Score | Pattern |
|---|---|---|---|---|
| 2002 | 0.064 | 0.004 | 6.8221 | Clustered |
| 2007 | 0.077 | 0.002 | 8.0045 | Clustered |
| 2012 | 0.075 | 0.003 | 7.8022 | Clustered |
| 2017 | 0.096 | 0.001 | 9.6438 | Clustered |
| Year | Local Moran’s I | Getis–Ord Gi* | ||||
|---|---|---|---|---|---|---|
| H-H | L-L | L-H | H-L | Hot | Cold | |
| 2002 | 97 | 485 | 17 | 24 | 122 | 506 |
| 2007 | 103 | 482 | 15 | 17 | 126 | 500 |
| 2012 | 106 | 478 | 16 | 17 | 129 | 498 |
| 2017 | 113 | 472 | 17 | 16 | 135 | 490 |
© 2020 by the authors. Licensee MDPI, Basel, Switzerland. This article is an open access article distributed under the terms and conditions of the Creative Commons Attribution (CC BY) license (http://creativecommons.org/licenses/by/4.0/).
Share and Cite
Suwanlee, S.R.; Som-ard, J. Spatial Interaction Effect of Population Density Patterns in Sub-Districts of Northeastern Thailand. ISPRS Int. J. Geo-Inf. 2020, 9, 556. https://doi.org/10.3390/ijgi9090556
Suwanlee SR, Som-ard J. Spatial Interaction Effect of Population Density Patterns in Sub-Districts of Northeastern Thailand. ISPRS International Journal of Geo-Information. 2020; 9(9):556. https://doi.org/10.3390/ijgi9090556
Chicago/Turabian StyleSuwanlee, Savittri Ratanopad, and Jaturong Som-ard. 2020. "Spatial Interaction Effect of Population Density Patterns in Sub-Districts of Northeastern Thailand" ISPRS International Journal of Geo-Information 9, no. 9: 556. https://doi.org/10.3390/ijgi9090556
APA StyleSuwanlee, S. R., & Som-ard, J. (2020). Spatial Interaction Effect of Population Density Patterns in Sub-Districts of Northeastern Thailand. ISPRS International Journal of Geo-Information, 9(9), 556. https://doi.org/10.3390/ijgi9090556