Article

A New Methodology for Mapping Past Rockfall Events: From Mobile Crowdsourcing to Rockfall Simulation Validation

Department of Forestry and Renewable Forest Resources, Biotechnical Faculty, University of Ljubljana, Večna Pot 83, 1000 Ljubljana, Slovenia
*
Author to whom correspondence should be addressed.
ISPRS Int. J. Geo-Inf. 2020, 9(9), 514; https://doi.org/10.3390/ijgi9090514
Submission received: 24 July 2020 / Revised: 13 August 2020 / Accepted: 21 August 2020 / Published: 25 August 2020
(This article belongs to the Special Issue Surface and Subsurface Mapping)

Abstract

:
Rockfalls are one of the most common natural hazards in mountainous areas that pose high risk to people and their activities. Rockfall risk assessment is commonly performed with the use of models that can simulate the potential rockfall source, propagation and runout areas. The quality of the models can be improved by collecting data on past rockfall events. Mobile crowdsourcing is becoming a common approach for collecting field data by using smartphones, the main advantages of which are the use of a harmonised protocol, and the possibility of creating large datasets due to the simultaneous use by multiple users. This paper presents a new methodology for collecting past rockfall events with a mobile application, where the locations and attributes of rockfall source areas and rockfall deposits are collected, and the data are stored in an online database which can be accessed via the WebGIS platform. The methodology also presents an approach for calculating an actual source location based on viewshed analysis which greatly reduces the problem of field mapping of inaccessible source areas. Additionally, we present a rockfall database in the Alpine Space that has been created by the presented methodology, and an application of collected data for the calibration and validation of two rockfall models (CONEFALL and Rockyfor3D).

Graphical Abstract

1. Introduction

Rockfall is a fragmented rock or a block that has detached from a surface slope or cliff by falling, sliding, toppling, bouncing or rolling [1]. Because rockfalls occurs suddenly, usually without any visible warning signs, they are extremely difficult (or impossible) to predict, and pose a great potential threat to people and infrastructure [2,3]. Rockfall models are useful tools for assessing rockfall risk, as well as the planning of rockfall protection measures in high-risk areas since they can be used to predict rockfall trajectories, distribution and intensity of impacts, and magnitude of rockfall events [4,5,6]. The quality of rockfall risk assessment is directly linked to the available databases of past rockfall events since this information allows for the analysis of spatial distribution of the process, its frequency and magnitude. The most important features that are needed for the determination of spatial distribution, frequency and magnitude of a rockfall event, are the location of the rockfall source (release) area and locations of the corresponding deposits (rock blocks and their volumes) [7,8,9,10,11]. The spatial distribution of the rockfall phenomena is used for rockfall propagation analyses which are performed with various empirical and probabilistic models [4,5,6,12,13], namely for the purpose of calibration, validation and verification of the model’s performance [4,6,14]. Moreover, rockfall deposit volumes are needed for studying rockfall frequency-size distribution laws, and the temporal occurrence of rockfalls for calculating the rockfall return periods [7,15,16,17,18,19]. Thus it is crucial to have truthful, accurate and detailed information about past rockfall events.
By reviewing the relevant literature, data on past rockfall events can be obtained via multiple strategies and sources, specifically:
(1)
Historical archives: reports and inventories on mass movement events, e.g., reports that focus on events that damaged houses, roads and trails, can be used to reconstruct rockfall propagation statistics and frequency [7,10,20,21];
(2)
Databases of past mass movement processes: e.g., databases about rockfalls, landslides, earthquakes [8,9,21,22];
(3)
Visual estimation in the field: based on geological observations of rockfall source areas and silent witnesses (deposited rocks, rocks stopped by trees, visual damage on the trees, surface and infrastructure) [4,10,14];
(4)
Dendrogeomorphology: the analysis of abrupt changes in tree growth, presence of traumatic resin ducts, and cross-dating of callus using tree-rings can provide insights for reconstructing rockfall frequencies and trajectories [23,24,25,26];
(5)
Remote sensing techniques: orthorectified images, LiDAR data, UAV technology, multispectral images etc. can provide information about changes in the surface and impacts of rockfall events [27,28,29,30,31].
However, as rockfall inventories vary and can be based on different sources of data, they do not always contain quantitative and detailed information of past rockfall events [15,32]. Data are usually characterised by low spatial accuracy, and most often include poor information about the rockfall event, with only the location of the main rockfall event recorded but not the rockfall source area, information on rock deposit volumes or temporal information etc. [15,33]. Often the data on smaller rockfall events are missing especially those that did not cause any damage [15,34]. Databases are, therefore, incomplete, not harmonised, and include various uncertainties about their reliability. Field collection of past event can be challenging due to e.g., rockfall recurrence time, short permanence of post-event traces, lack of historical data about the events, and heterogeneity of the rockfall source and deposits [10]. Procedures for objective collection of rock deposits have been proposed [35,36], nonetheless since rockfalls occur mainly in mountainous areas they are often remote and difficult to access, meaning that the collection of past data is complex, labour-intensive and time-consuming [4,10].
The quality of the collected data can greatly affect the results of rockfall risk analyses, and their application in modelling of rockfall phenomena can result in false calibration of rockfall models and imprecise identification of potential rockfall source areas and simulation of rockfall propagation and runout areas [37,38]. Consequently, for example the maximum rockfall trajectories can overestimate/underestimate the potential reach of rocks along the slope, potentially exposing human assets [32] to high rockfall risk. The limited or reduced number of past rockfall events can cause large errors in the estimation of the parameters of the rockfall frequency laws, and consequently rockfall volumes [33,39], which are also of a primary importance for the design of rockfall protection and mitigation measures, and for the implementation of reliability differentiation in structural engineering [39]. For example, in the case of designing rockfall protection nets, a recorded number rockfall deposits that is smaller than 200 does not present a statistically representative sample [40]. Due to the presented facts, there is a great need for an approach that will harmonise both the collection procedure of past rockfall events, including information on rockfall source areas and rockfall deposits, and the organization of rockfall databases.
With the development of smartphones and mobile applications [41], crowdsourcing has become a common paradigm for collecting and sharing data by groups of people or wider crowds [42]. Smartphones are equipped with various sensors, e.g., internal Global Positioning System (GPS) receiver, camera, digital compass etc., meaning that they practically offer a practical and global infrastructure for the collection of informative data [41]. The crowdsourcing approach is increasingly used for the collection of information about natural hazards; the collected data can serve in early-warning systems and post-disaster management [43,44,45] and by providing data that is necessary for the science to better understand the mechanisms of these processes [46], identify the high risk areas, and consequently implement protection measures that can reduce negative effects to society.
Among the gravitational processes, the mobile crowdsourcing approach has most widely been used to record landslides. Olyazadeh et al. [47] have presented a mobile application for the rapid collection of landslide hazard and risk data, which enables quick creation of landslide inventory maps by collecting information on the type, feature, date and patterns of landslides. Choi et al. [46] have presented a mobile application, powered by the Google maps platform, for collecting landslide data and locations with the purpose of mitigating the effects of landslides. A smartphone application for collecting essential and concise landslide information has also been presented by Kocaman and Gokceoglu [48]. Juang et al. [49] have implemented an online landslide repository with citizen participation for the collection of new landslide events. Moreover, Chu and Chen [50] have shown that crowdsourced photographs could be used to define potential landslide and debris flow on hazardous hot spot maps.
Since mobile crowdsourcing can be a powerful tool for the creation of large databases, the approach has been used in this paper to form a mobile application for the collection of data about rockfall events directly in the field, focused on obtaining locations and additional attributes of rockfall source areas and their corresponding rock deposits. The main goal of our research was to design and develop a methodology for the collection of past rockfall events in the field with a mobile application so that the users could collect data in a harmonized approach that would enable simple and quick field workflow. At the same time our condition was that the methodology would enable direct applicability of the collected results to various rockfall analyses, both at the local and regional scale. The methodology was realized with a mobile application (Collector for ArcGIS) which is part of the Esri ArcGIS platform [51]. Data are being collected by a mobile device and linked to the cloud-based online Geographic Information System (GIS) data repository (ArcGIS Online server) from where they are directly visualised with a WebGIS application (Web Map). All parts of the platform are customizable and were tailored to the needs of the collection and visualisation of past rockfall events. In this paper we present (i) a methodology for crowdsourcing past rockfall events, its functionality within a mobile application, and the attributes that can be collected, (ii) a calculation procedure for the actual rockfall source areas along with energy line angles, (iii) design and visualisation of a database via the WebGIS platform, (iv) a rockfall database in the Alpine Space that has been created with the presented methodology, and finally (v) the application of the collected results for calibrating and validating rockfall models.

2. Materials and Methods
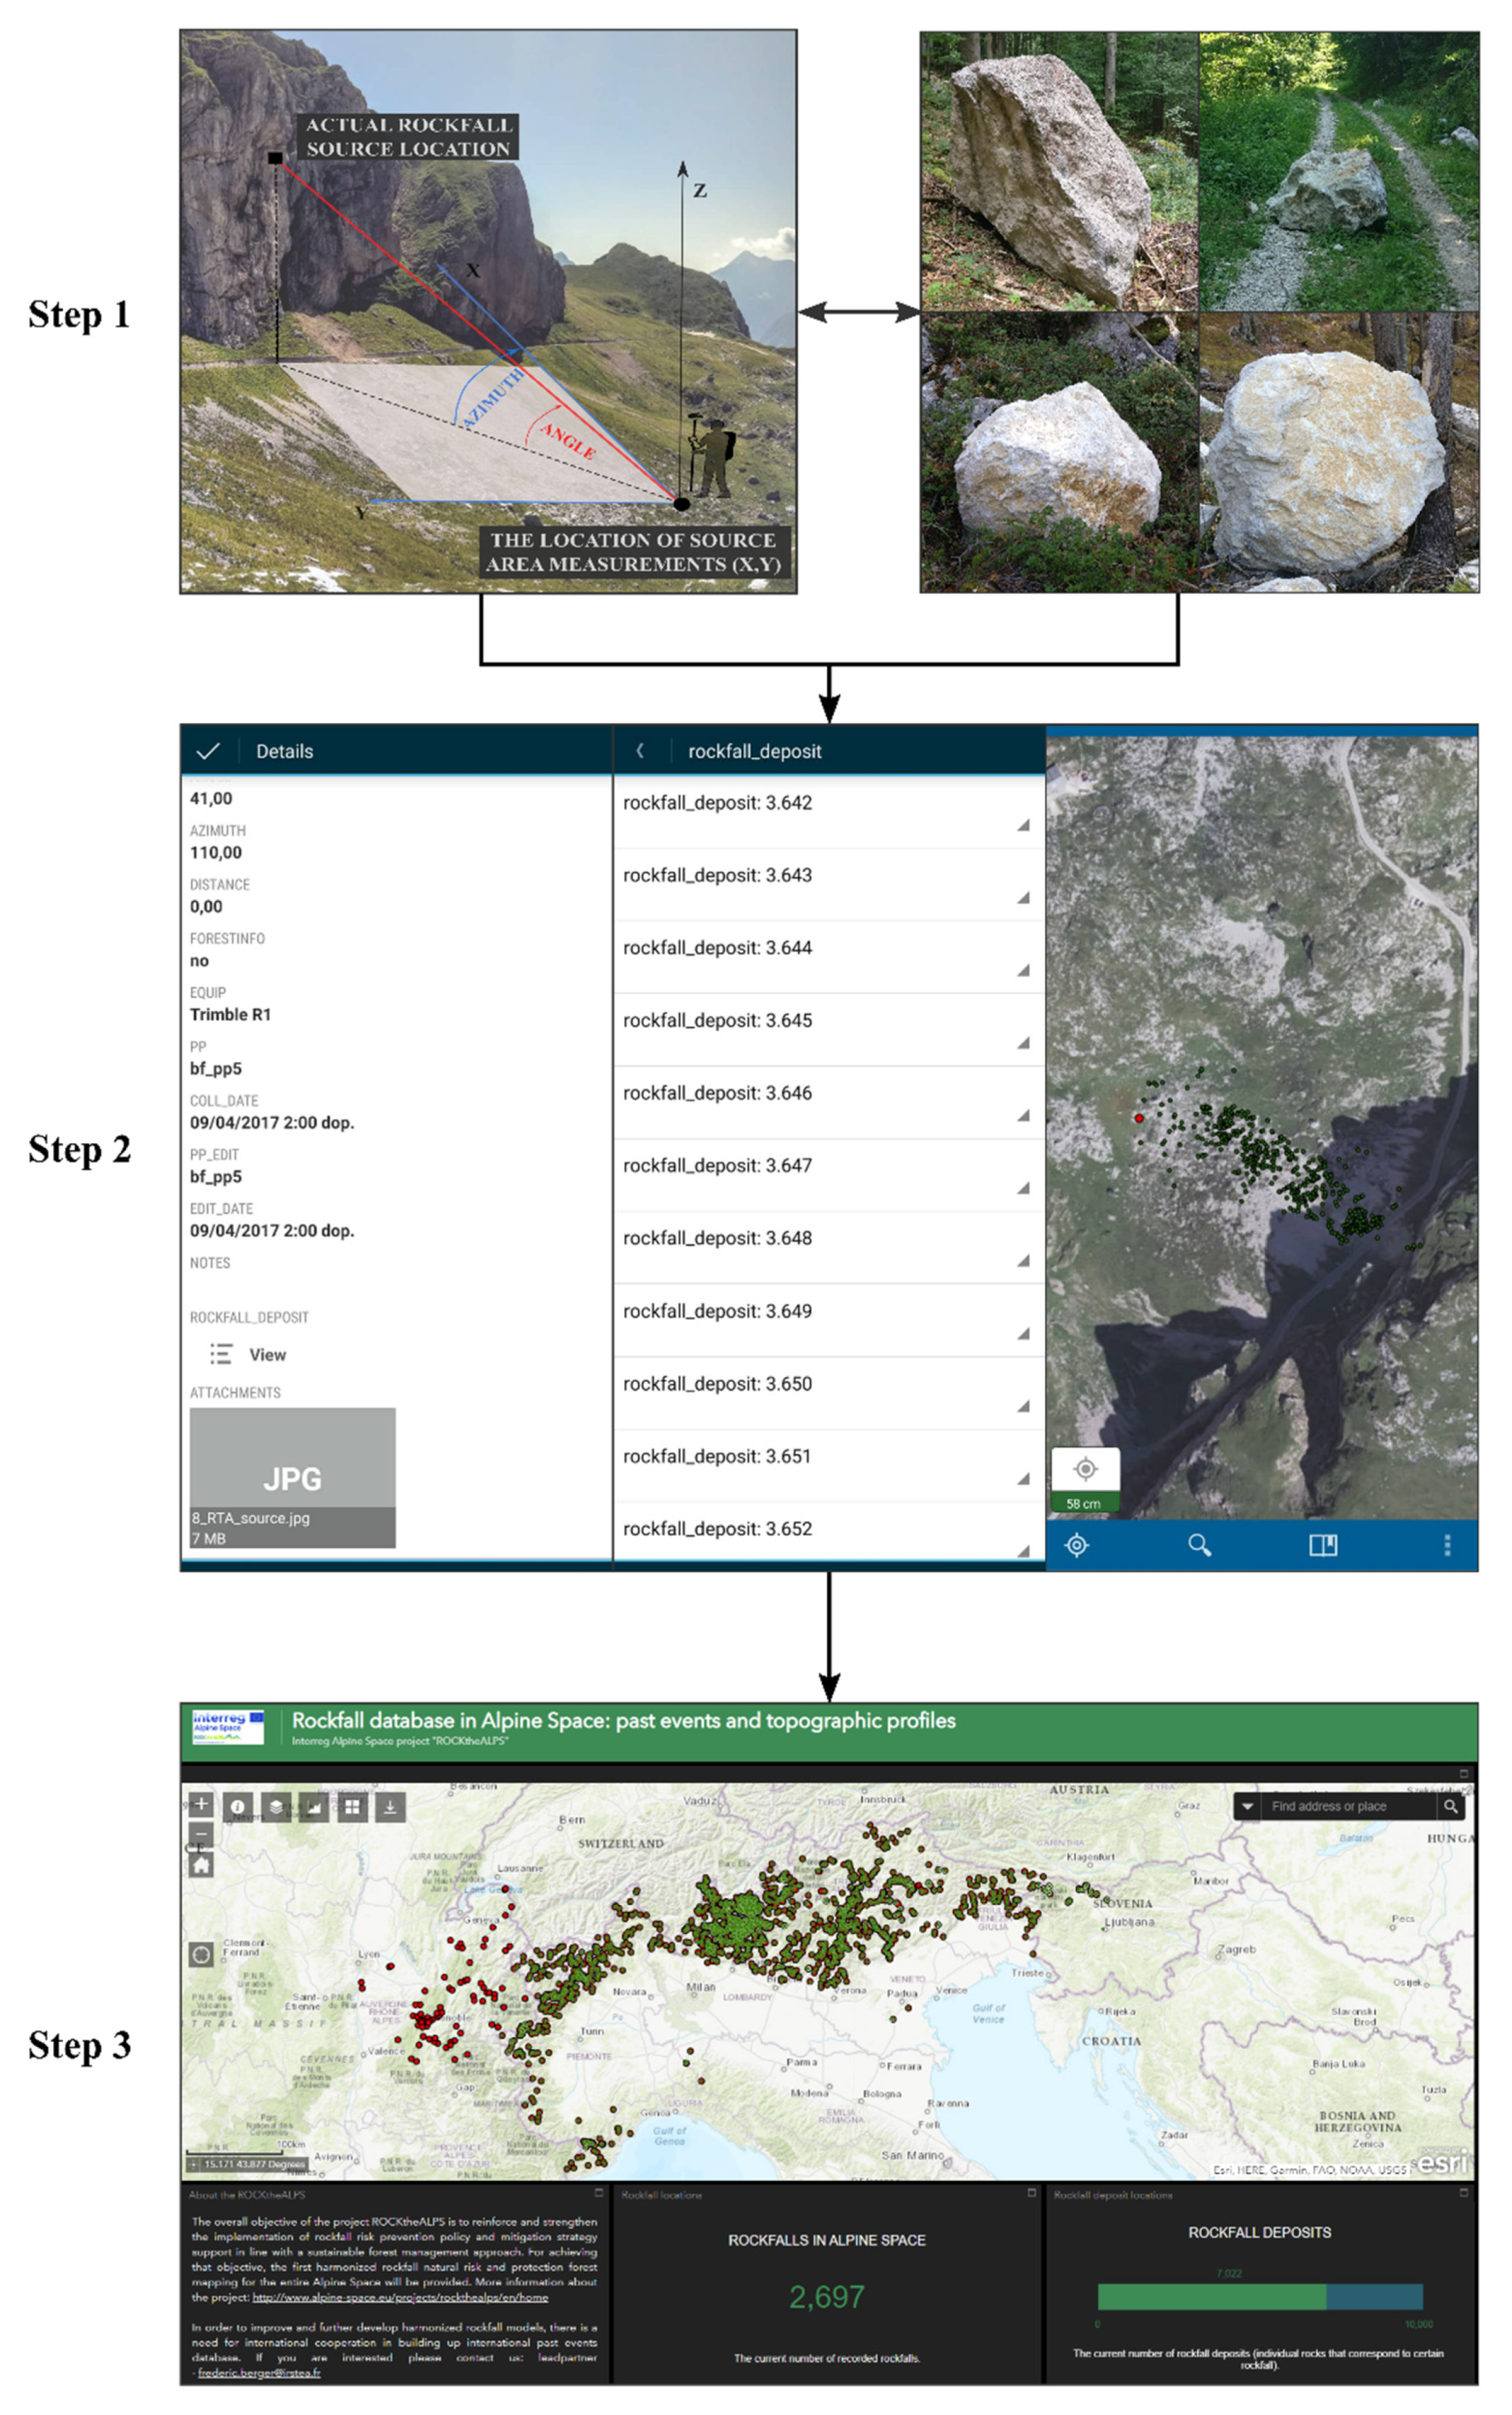
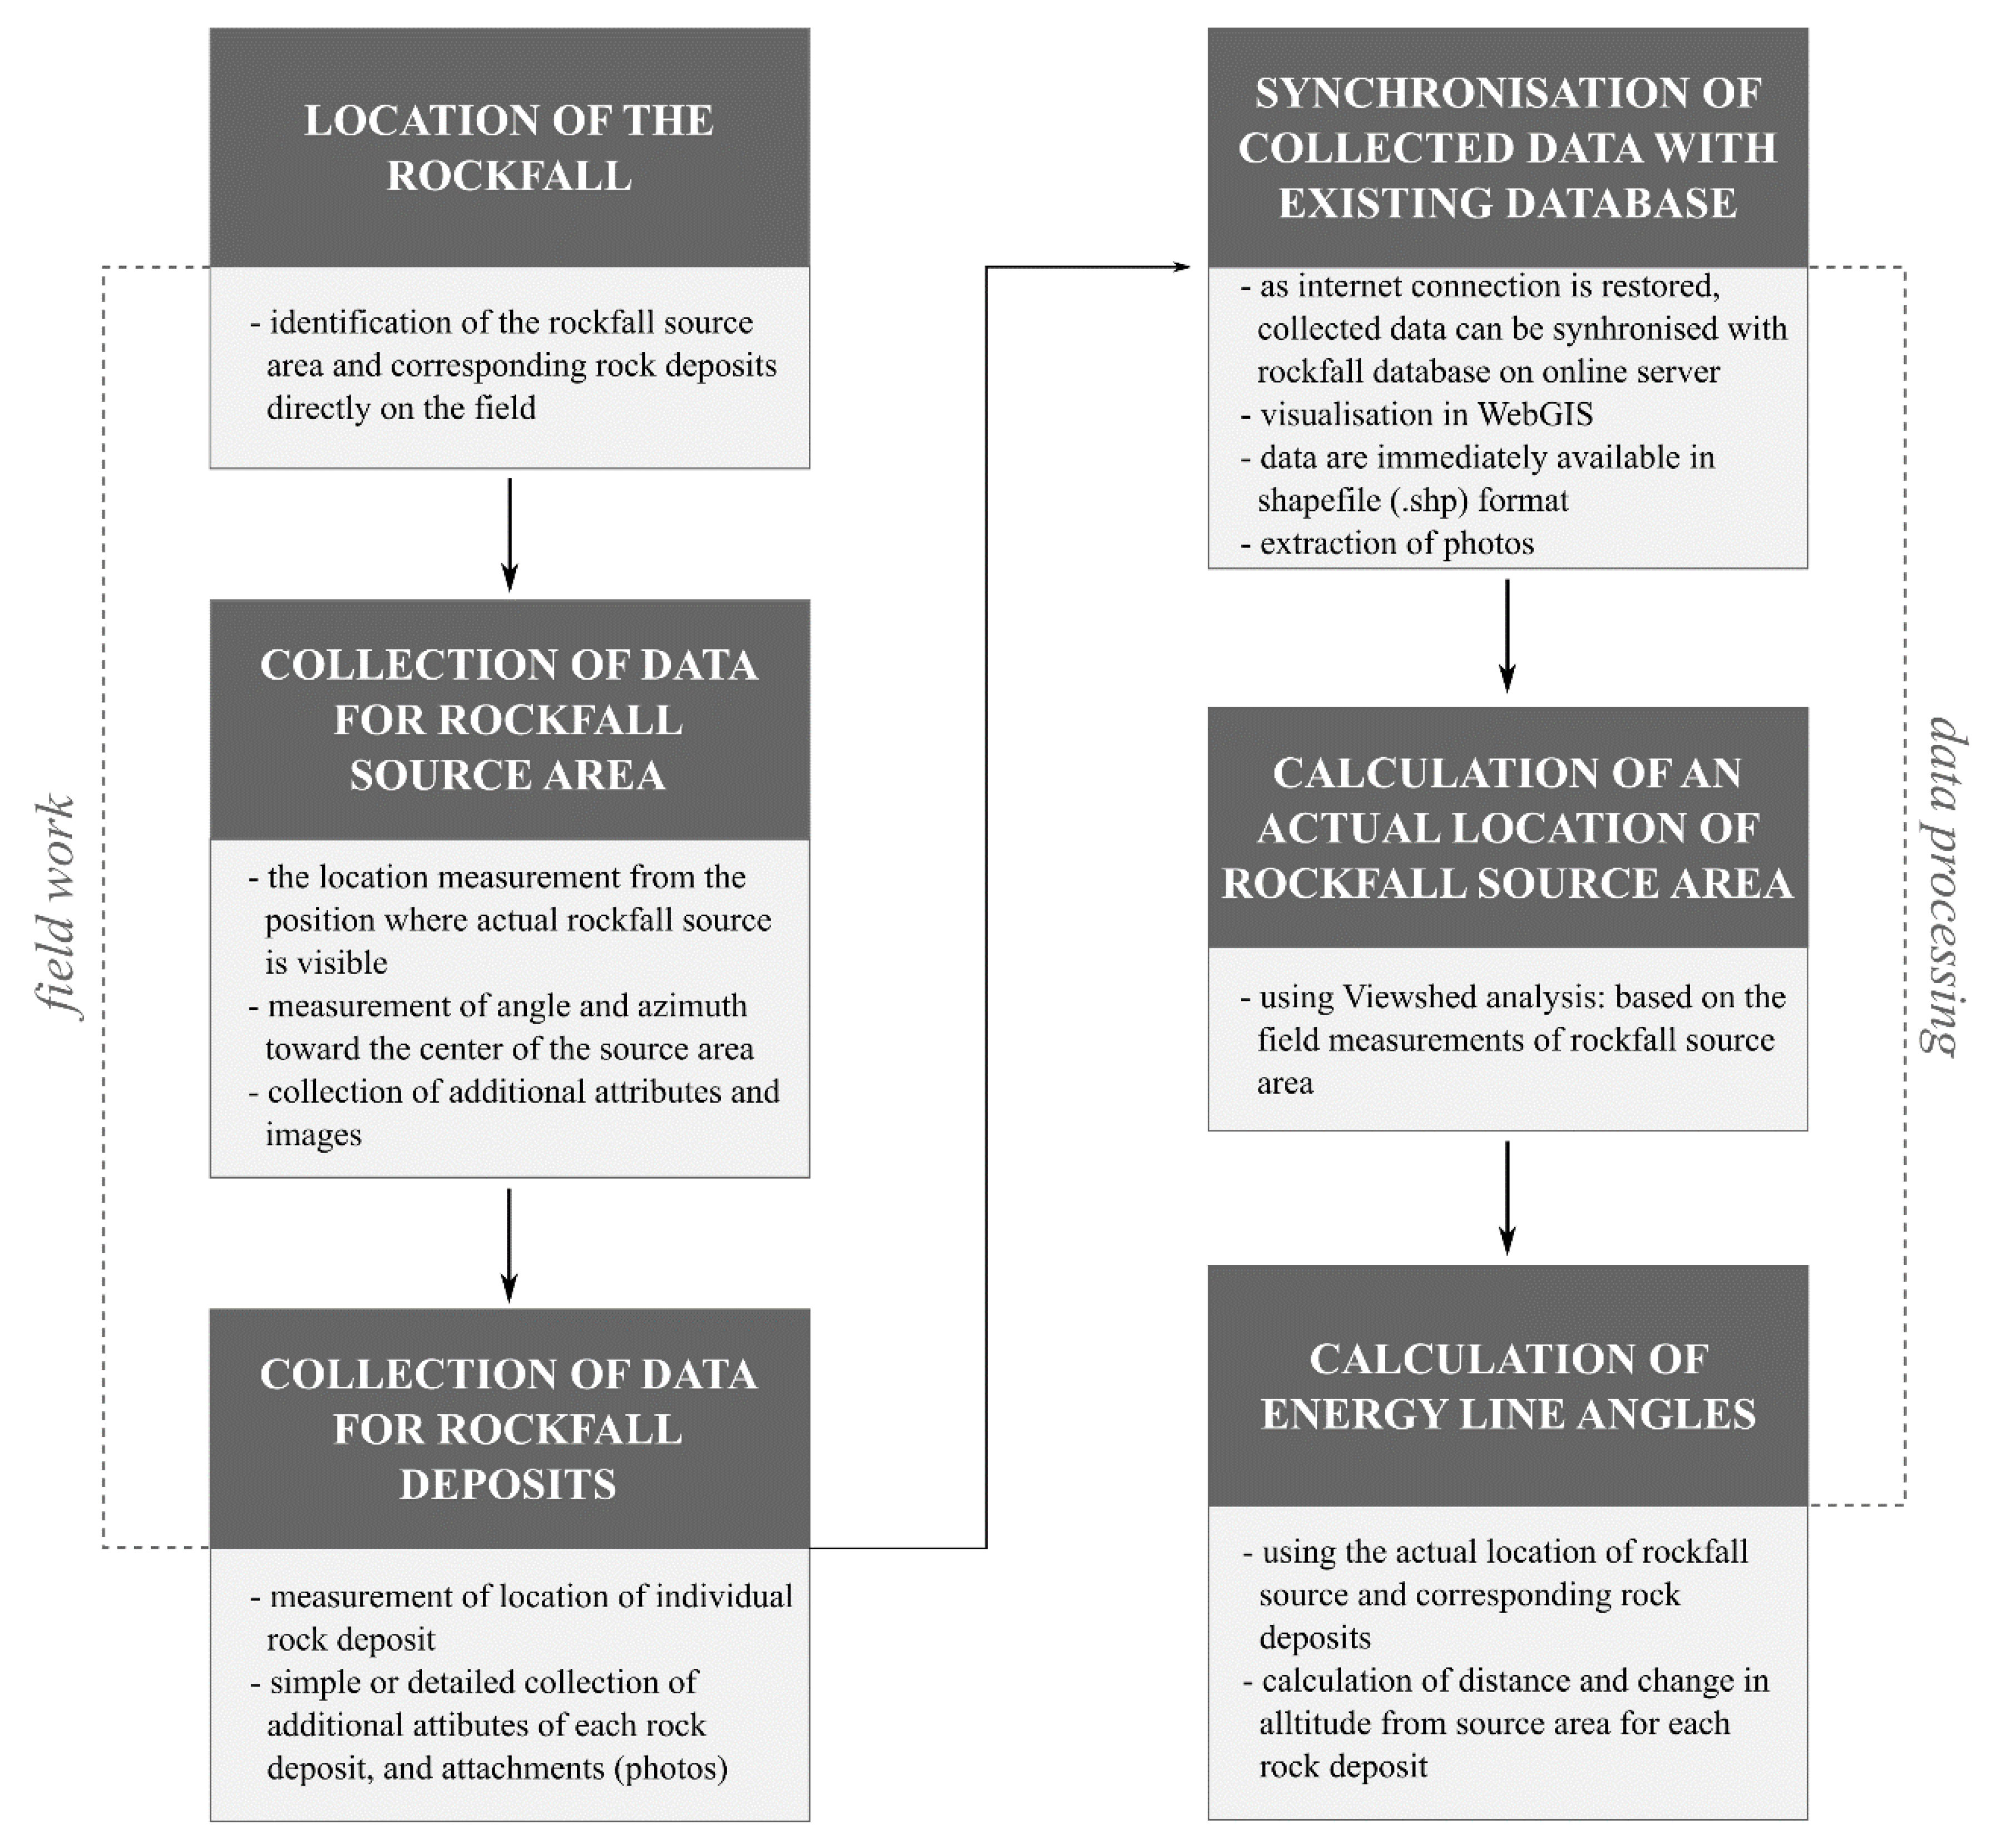
The Figure 1 presents the methodological framework of the whole work-flow from data collection in the field to its synchronisation with a complete database, visualisation and its possible further use. The framework is divided into two working parts: into field work and data processing. The field work consists of collecting rockfall source and deposit data directly in the field with the use of mobile application (either smartphone or tablet), while the data processing part consists of uploading collected data to the existing database, visualisation of data in WebGIS, and calculation of energy line angle values for possible further use of the data in rockfall modelling.

2.1. Field Work

2.1.1. Characterisation of the Mobile Application

The collection of a rockfall source area and its deposits in the field is performed with the Collector for ArcGIS mobile application [51]. The application enables the configuration of the data collection form which was in the case of this study configured to store data as two separate point shapefiles (for source and deposits). The application provides a simple interface and, therefore, enables easy and quick collection of data. The main characteristics of this mobile application are [51]: (1) it provides geolocation (latitude and longitude) as a point shapefile; (2) it enables the collection of various attributes by direct input or form a pre-defined list of attribute possibilities that are accessed via a drop-down menu; (3) the collected data can be edited throughout the whole process; (4) the application can be used by several users simultaneously by enabling authorship tracking option and time tracking option; (5) multiple photographs can be added to each collected feature; (6) it is available for various operating systems (e.g., Android, iOS, Windows); (7) the application can be used on a smartphone or tablet; (8) it does not require an internet connection for use in the field since collected data can be stored on the device and later synchronised with online database; (9) the maps required for the field work can be downloaded to the device; and (10) the application is compatible with external GNSS receivers which enables the collection of data with greater location accuracy, and with the option of using the average location.

2.1.2. Collection of Data in the Field

The collection of data begins with by capturing the location of the rockfall source area. Since rockfall source areas are generally inaccessible or difficult to access (e.g., rock cliffs), the user collects the location of the standing point from which the rockfall source area is visible. From this point one also measures the angle and azimuth towards an actual rockfall source area (Figure 2–Step 1), and also enters additional attributes that describe the source area (see Section 2.1.3). The actual location of the rockfall source area is calculated subsequently in the data processing stage (see Section 2.2.2). In the next step the user measures the locations of corresponding rock deposits and records additional attributes (see Section 2.1.3). Since the rockfall source area is generally a single area (representing a larger area), the survey form is structured so that multiple rockfall deposits are added to the individual rockfall source area using the concept “one-to-many” (Figure 2–Step 2). This means that each object in the original attribute table (rockfall source area) is linked to the multiple objects in the associated table (rockfall deposit area). Due to this relationship, each rockfall source area feature point has its own unique identification number (SOURCE_ID) that links together all corresponding deposits, while each deposit also has its own unique ID (DEPOSIT_ID). The number of corresponding rockfall deposits to a single rockfall source area is unlimited. If one has an Internet connection in the field, the collected data are directly synchronised with the existing database; if there is no Internet connection, the data are temporarily stored on the mobile device and synchronised after the field collection of data.

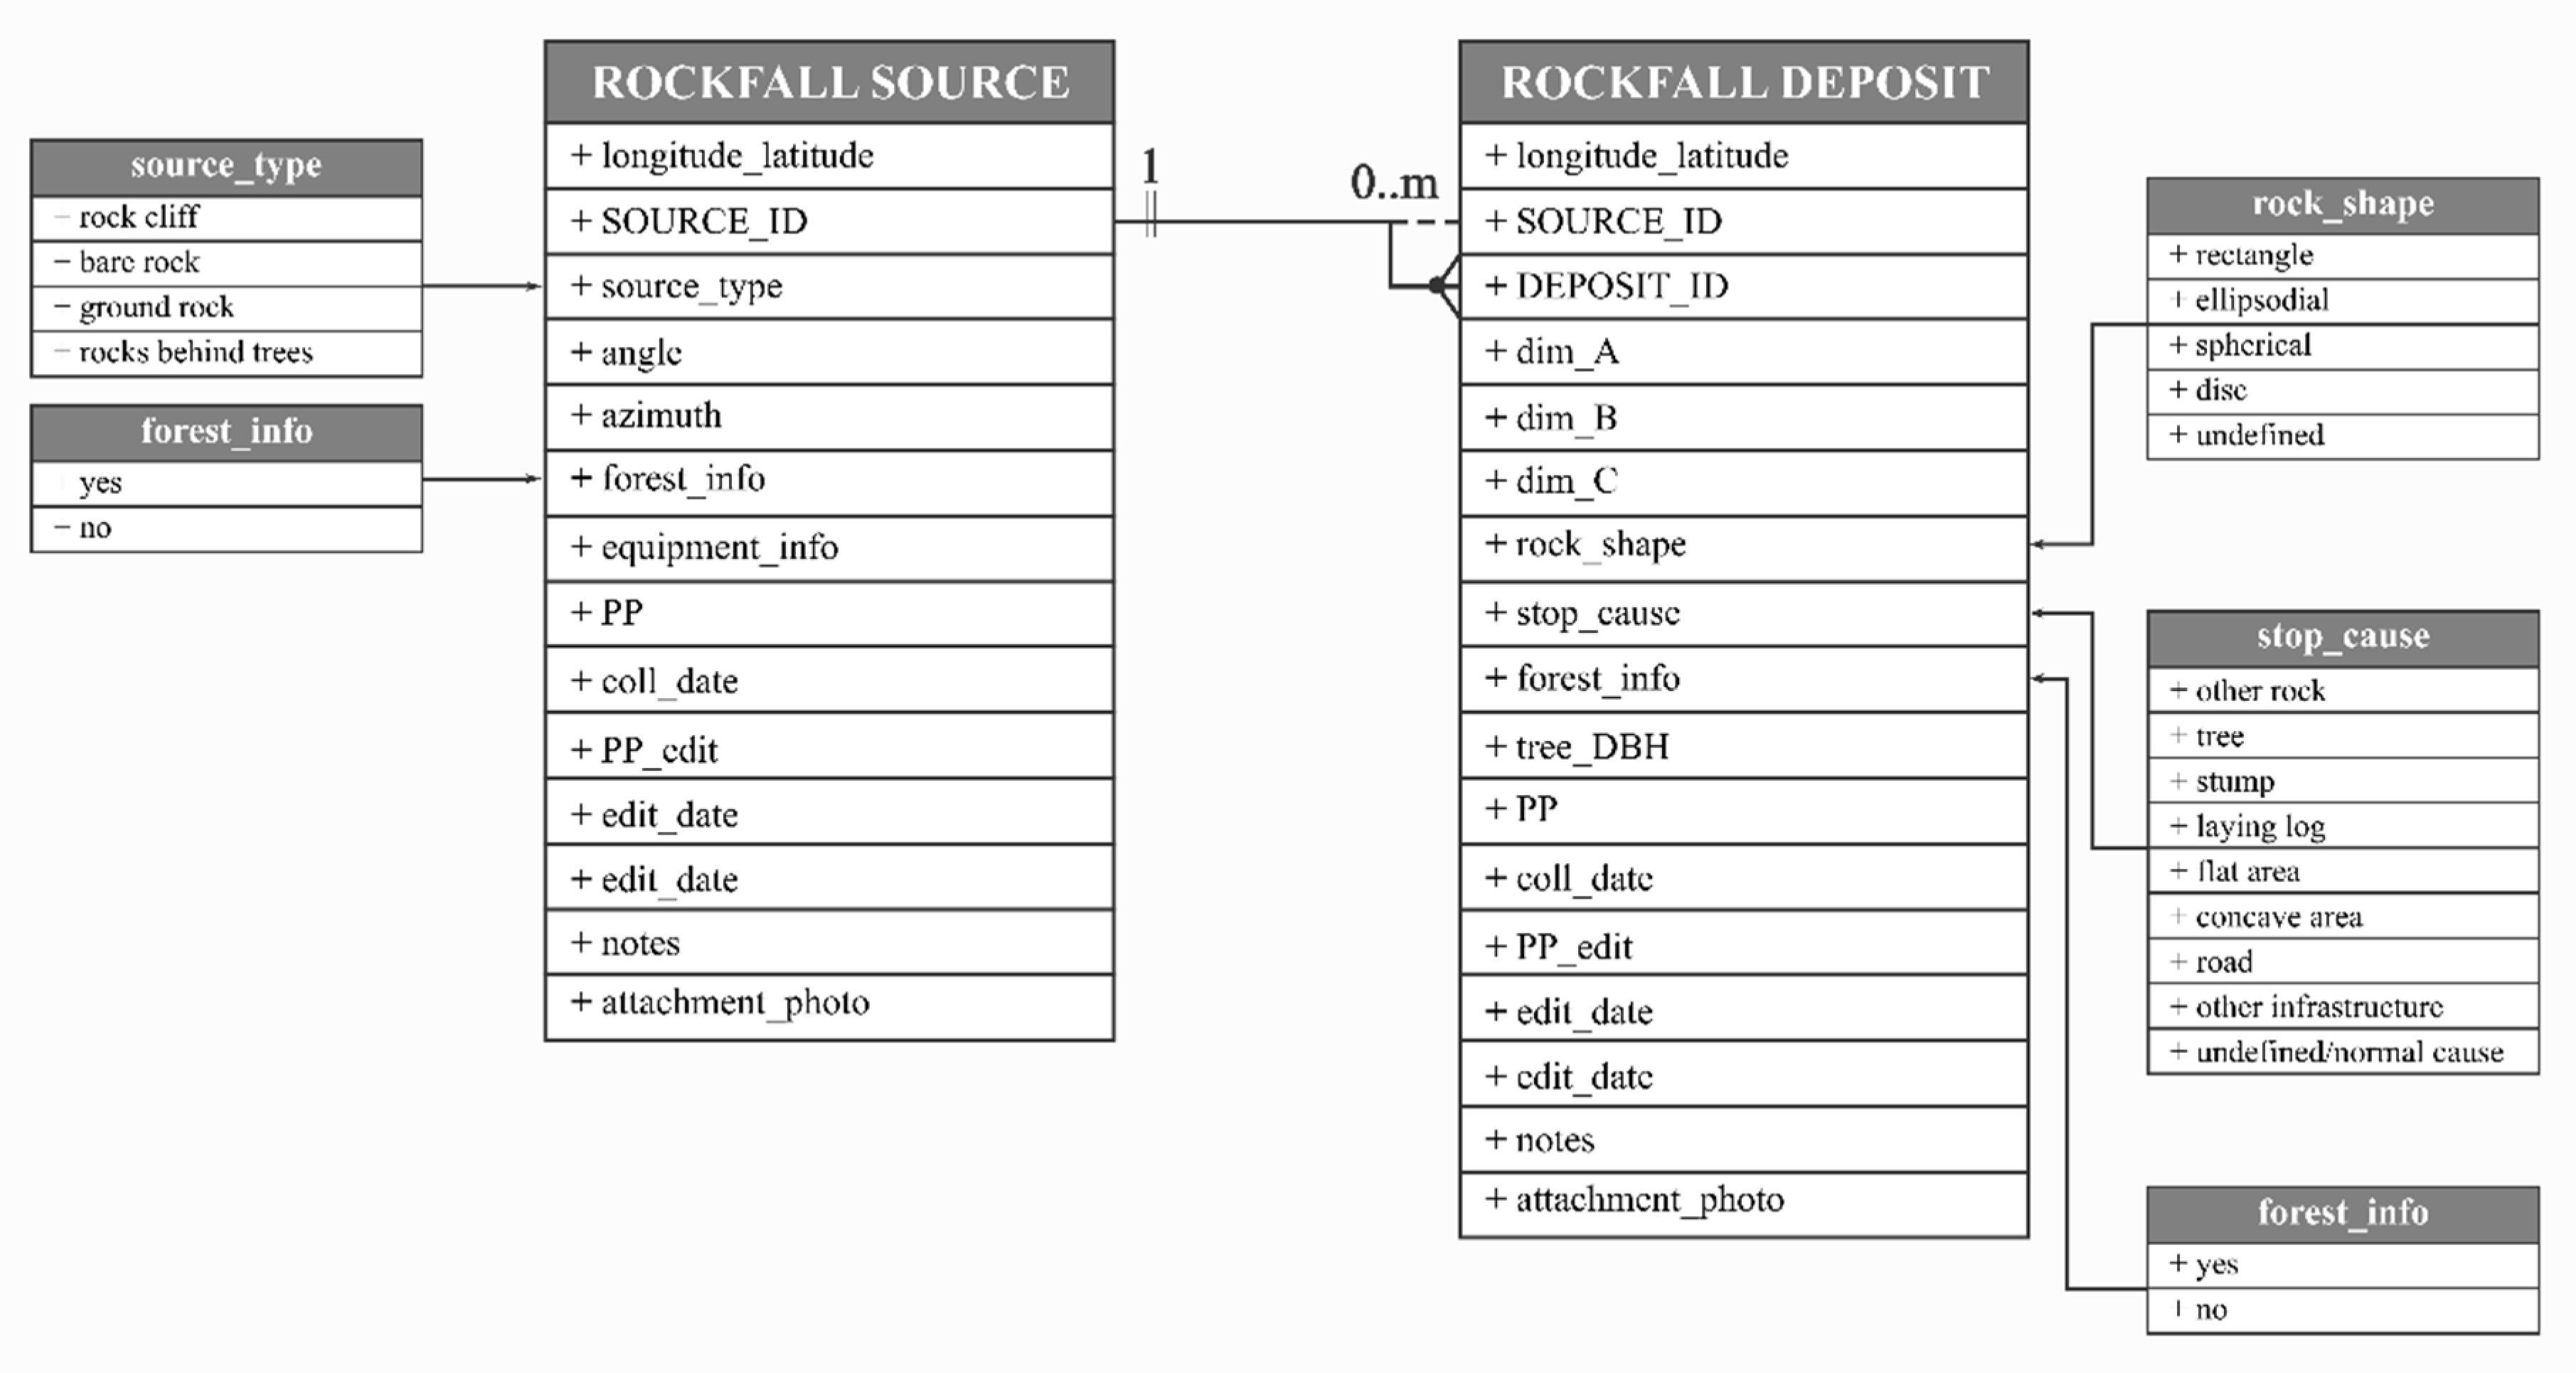
2.1.3. Data Attributes

Besides the location (X and Y coordinate) of an individual feature (being automatically stored), the rockfall source area record can have up to 14 attributes, and rockfall deposits up to 17 attributes (Figure 3). All records store information about the date and time at which the data were collected along with information about the author who entered the new source or deposit, and information about when and by whom the input was changed. Both attributes are stored automatically since the user has a specific account with which they use the application. Some attributes for both features are optional and do not have to be collected, while the majority of them are obligatory, meaning that one cannot store a feature before filling-in those attributes. Attributes that are not obligatory are: notes (both source and deposit feature—user can enter observations about that feature; e.g., temporal information about the rockfall event), information about the measuring equipment that was used (stored with the rockfall source feature—e.g., type of GNSS receiver, equipment for measuring of angle and azimuth), photographs (both source and deposit feature), and tree DBH (stored with the rockfall deposit feature—DBH = diameter at breast height: 1.3 m; in case the rock had been stopped by a tree).
Other attributes (shown in Figure 3) are obligatory for the collection and description of the source or deposit, and were determined based on the various classifications used for describing the phenomena, emphasizing that the collected data can be used to model rockfalls. Numerical data (e.g., angle and azimuth for the source area, rock dimension and tree DBH for the rock deposit) have upper and lower limits that can be entered in order to avoid possible mistakes while entering the numbers into the application (angle values 0–90°, azimuth values 0–360°). Each rockfall deposit must be measured in all three dimensions, and in order to be collected the rock should have at least one dimension (x, y or z) larger than 50 cm. Type of rockfall source, forest information, the shape of rockfall deposit, and stopping cause of rockfall deposit are categorical attributes and predefined, meaning that the user can only choose between defined categories from the drop-down menu. The type of rockfall source area categories were formed based on the typology by Ancelin et al. [52], while rock shape categories are based on Dorren [4]. Stopping cause of rockfall deposits were determined based on the most common situations observed in the field. Forest information provides information about whether the rock source area or deposit are located within a forest or not.

2.2. Data Processing

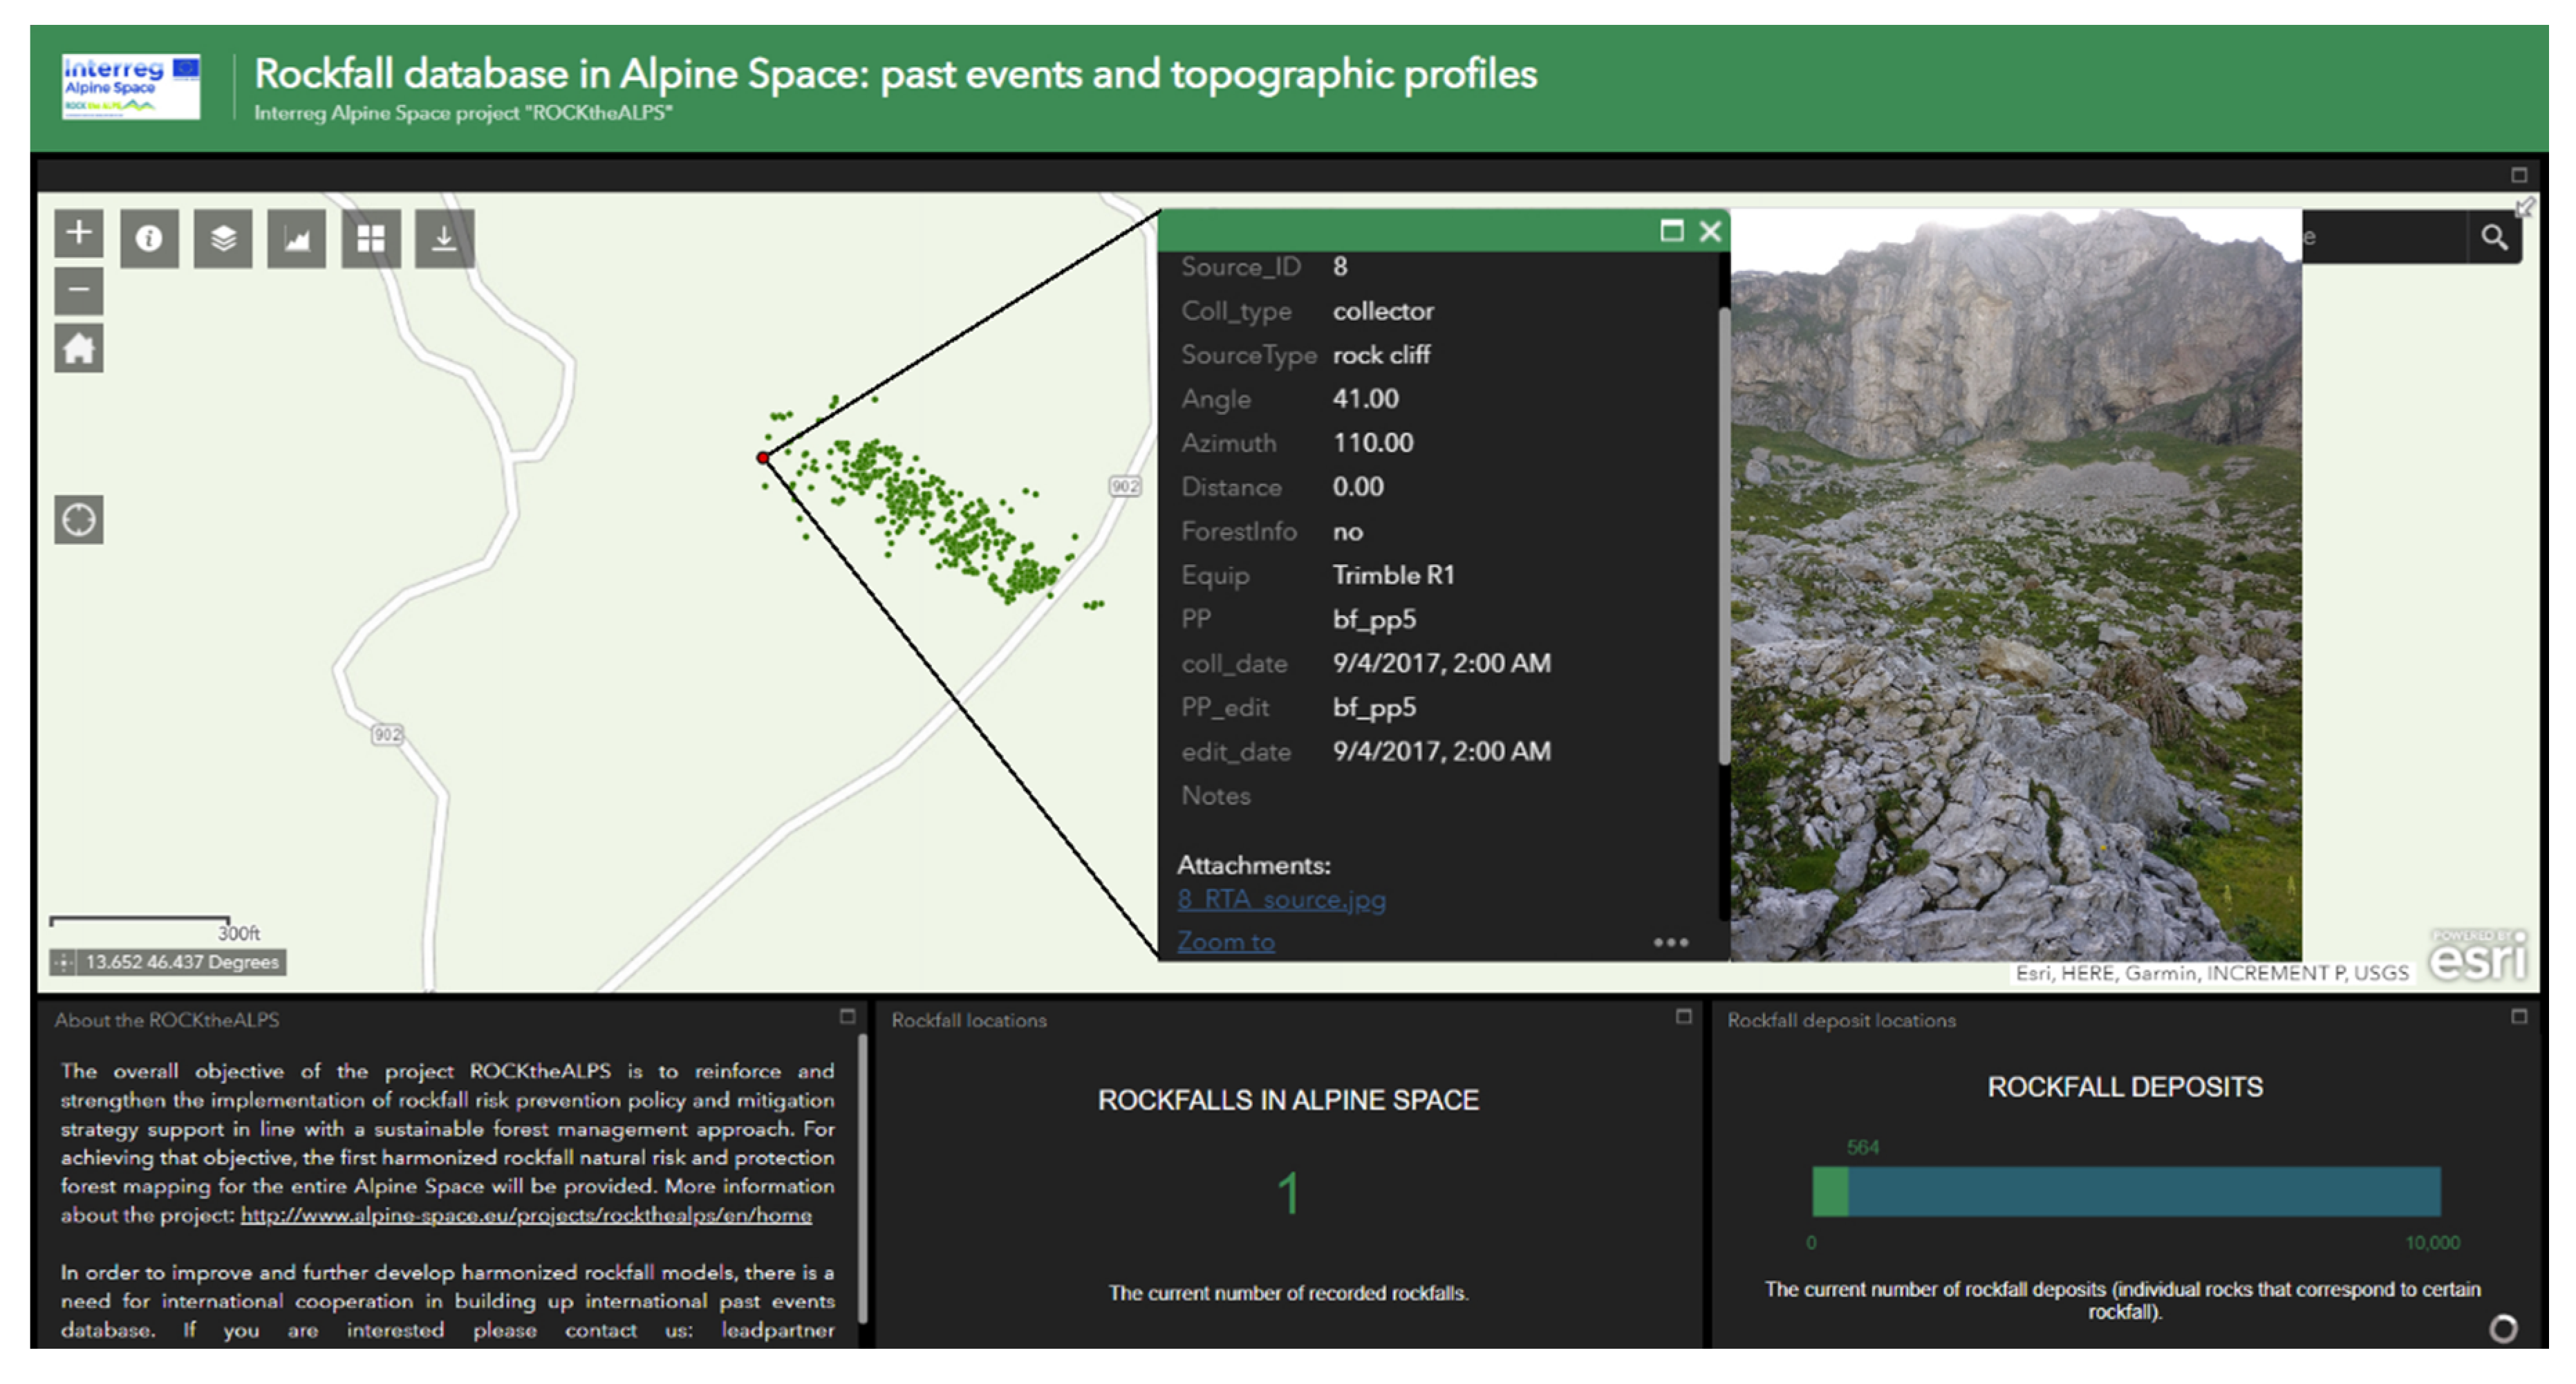
2.2.1. Synchronisation of Data and Visualisation in the WebGIS Platform

The WebGIS platform is intended for the visualisation of the data collected with a mobile application, and since it provides a simple and interactive graphic user interface it can be used by the lay public. It represents the link between the geographical data (collected rockfall events) collected by the Collector for ArcGIS application and the cloud-based online database held on Esri’s ArcGIS Online server. The platform for showing past rockfall events is implemented through the Esri online Web Map application (Figure 2–Step 3). Users of the WebGIS can only view the collected data since the mobile application has the purpose of collecting rockfall events which can in in combination with an external GNSS receiver be performed with higher accuracy. However, there are many other functionalities that crowd users can utilize on that platform which enables the display and querying of data in form of charts, map views and images. The displayed data originate from the original, live data that from the rockfall database, and with each new entry from the mobile application, it is automatically added to the Web Map. The web application is publicly available and the data can also be downloaded by the user. The WebGIS application does not enable the direct upload of the new events by the user unless one contacts the administrator. Additionally, the source of data can be tracked for each feature to see whether it was collected from some other source or with the mobile application.

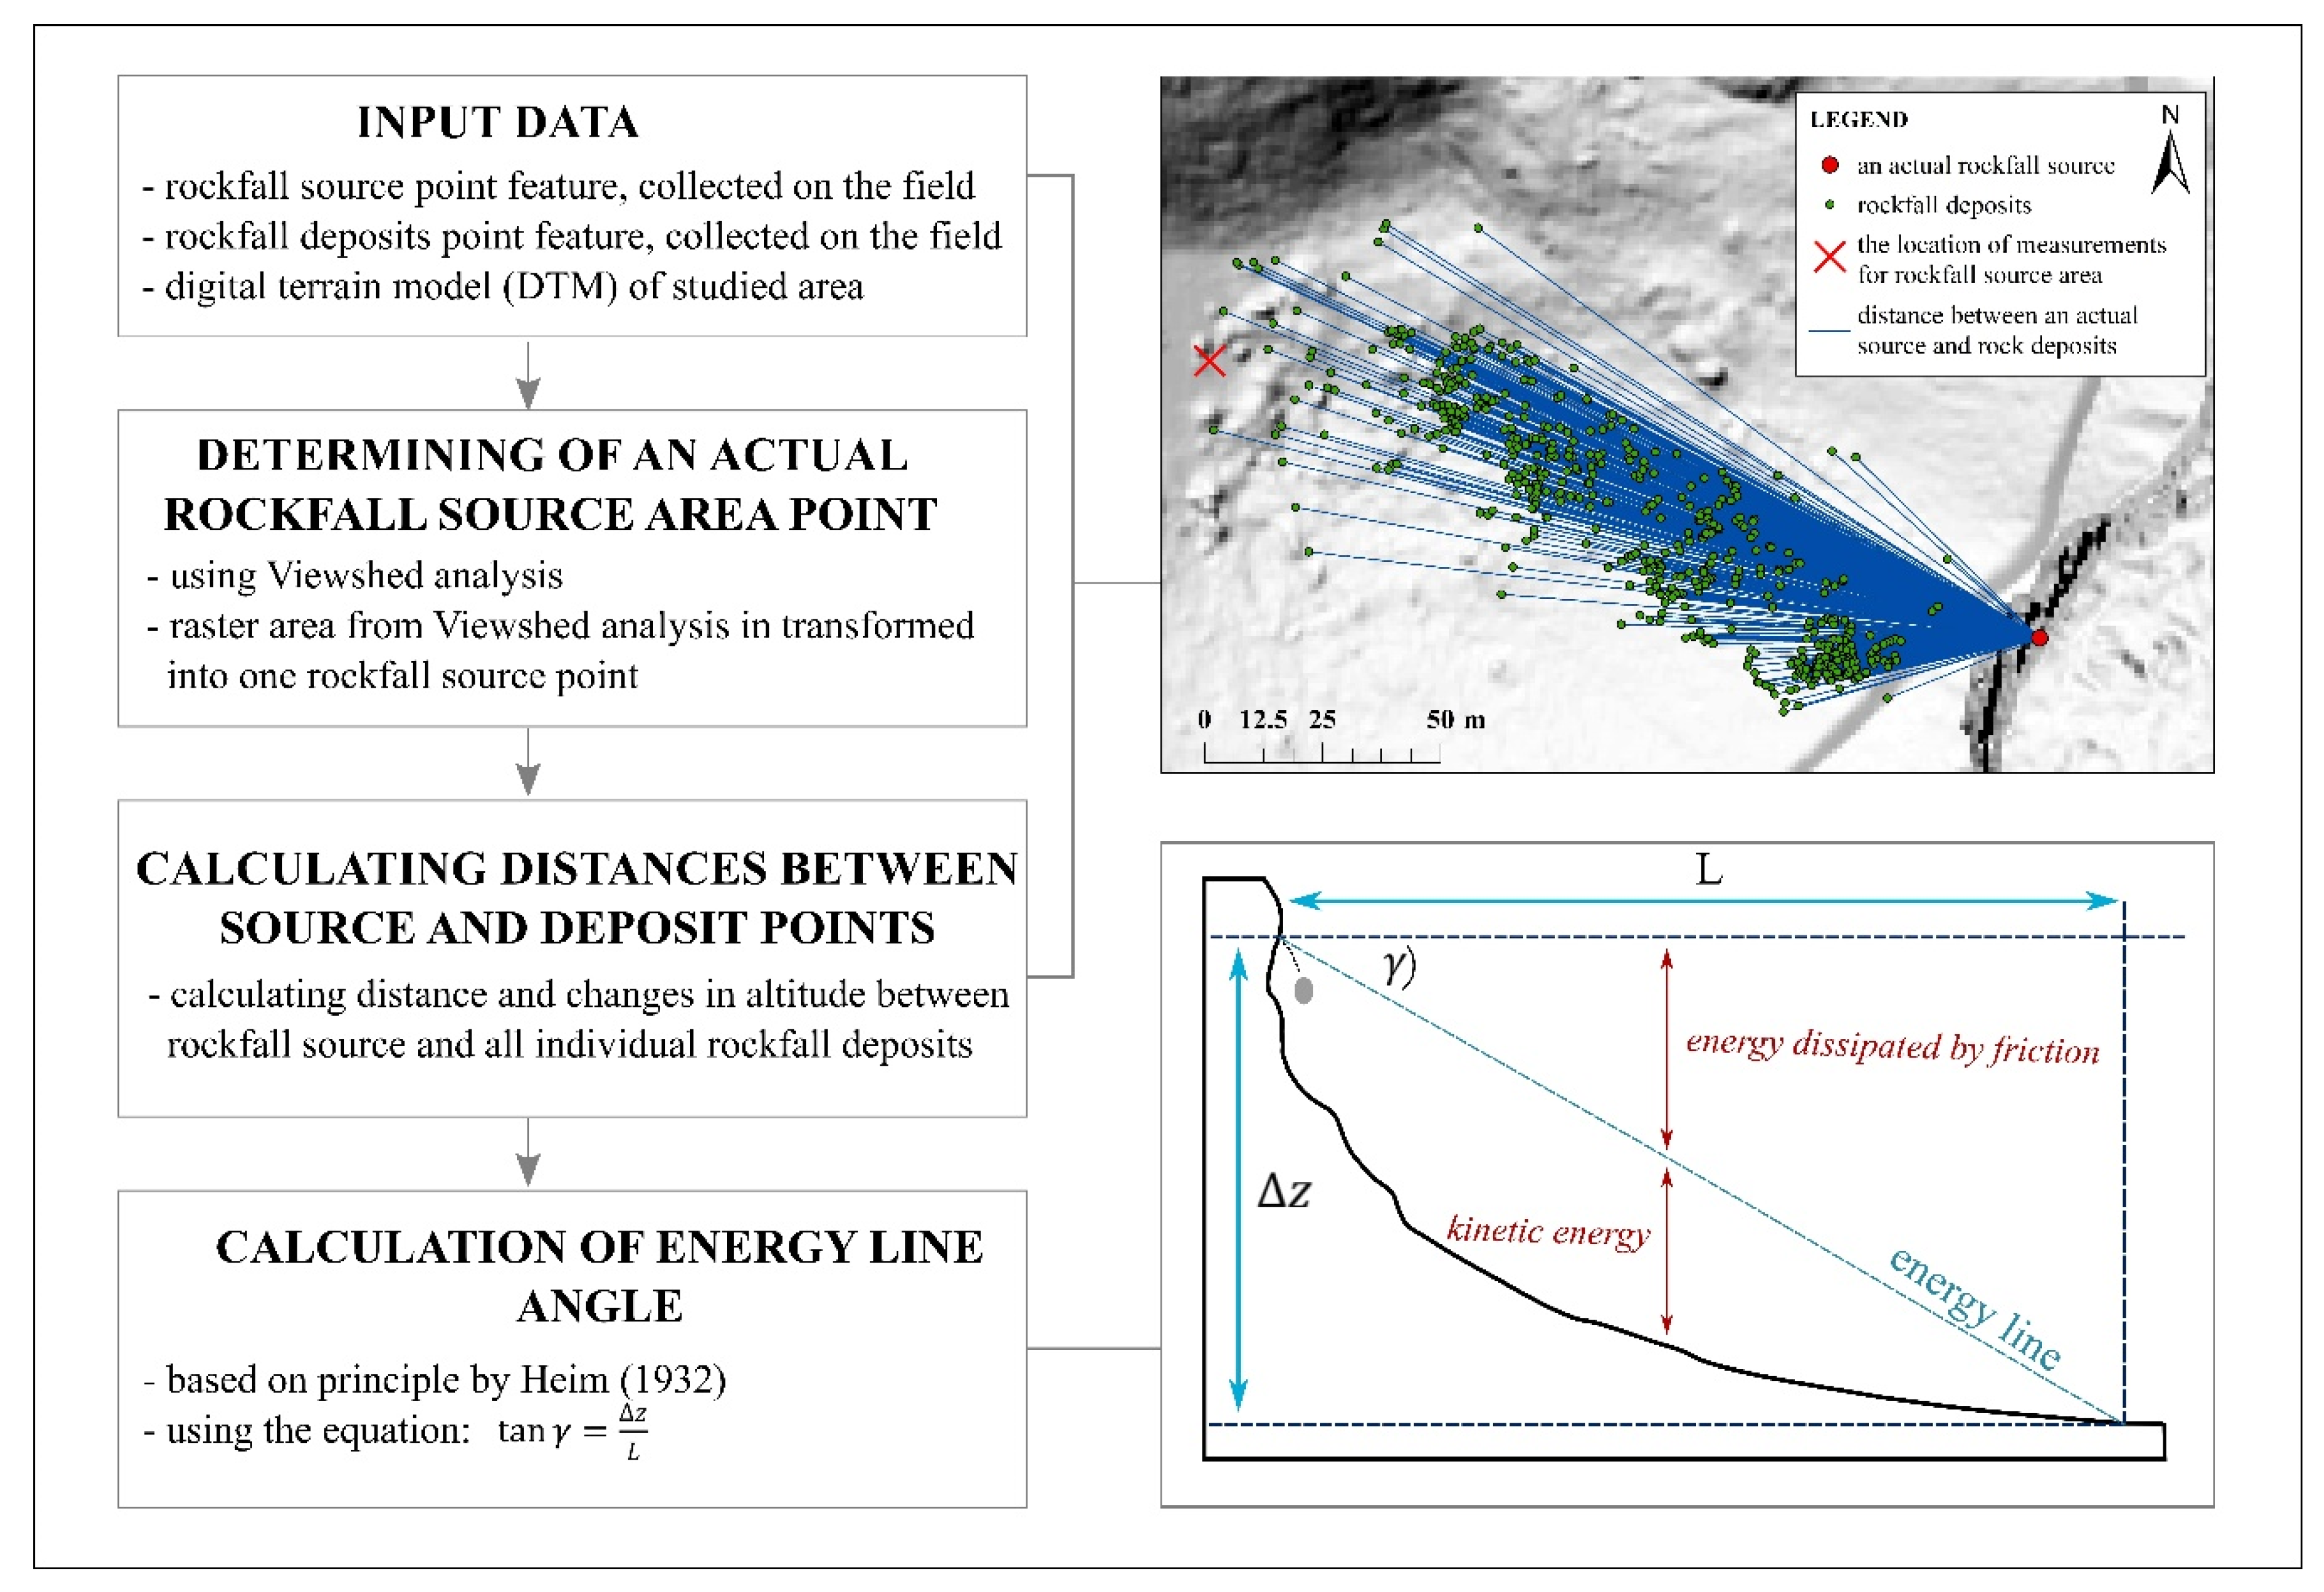
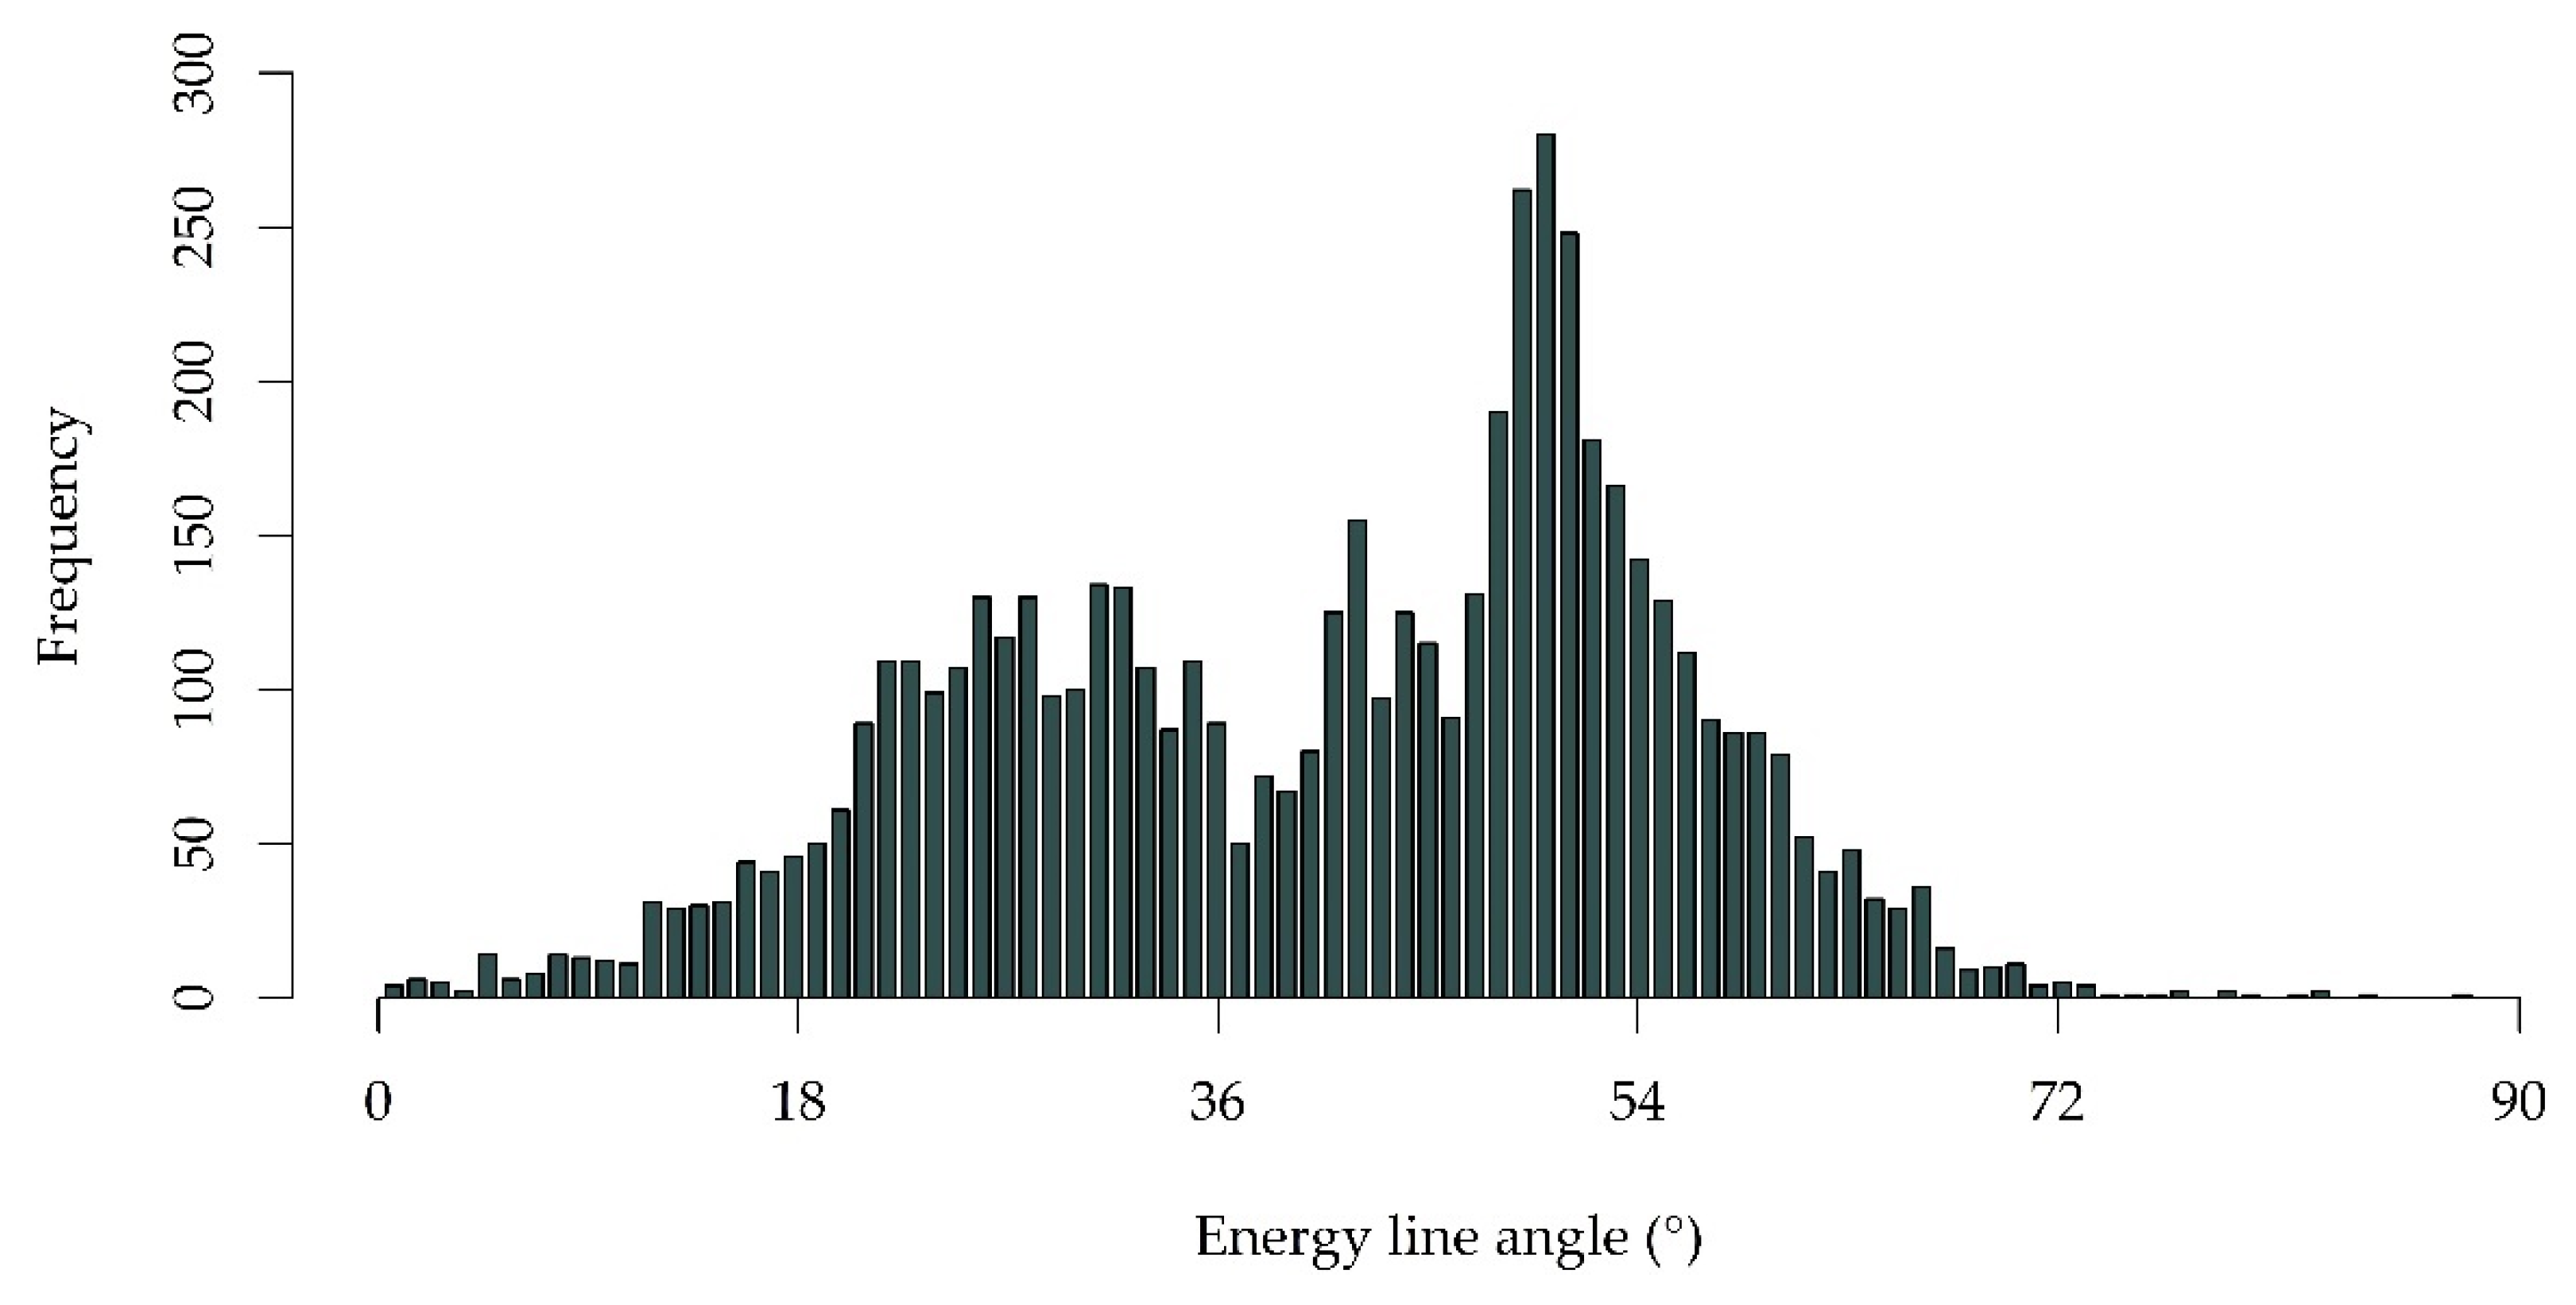
2.2.2. Calculation of an Actual Rockfall Source Area and Energy Line Angles

The calculation of an actual rockfall source area is performed by use of a specially designed tool (called ELA, energy line angle) in the ArcGIS environment [53] (summarised on Figure 4). This tool calculates an actual source area location by using the location of a measured rockfall source area in the field, the locations of rockfall deposits and high-resolution digital terrain model—DTM (inputs into the tool). The final outputs of the tool are two: an actual location of the rockfall source area, and energy line angles for each rockfall deposit. The first output of the tool is calculated on the basis of visibility analysis by using the Viewshed 2 tool in ArcMap 10.5 [52]. This tool calculates the surface (based on DTM) visible from one location—in this case the location of the rockfall source area collected in the field, while the view is limited by the angle and azimuth toward an actual rockfall source area.
The second is a set of energy line angles for each rock deposit, calculated on the basis of Heim’s [54] principle. Based on this principle (Figure 4), the run-out distance (L) of a rockfall deposit can be estimated by using the intersection of a line connecting the top of the rockfall cliff with a slope equal to:
tanγ = ∆z/L
with the topography, where ∆z is equal to the difference in elevation between the top of the rockfall cliff and L being the distance between the top of the rockfall cliff and an individual rockfall deposit [55]. Therefore, the coordinates of an actual rockfall source area point and corresponding rockfall deposits are used for calculating the run-out distance (L) of individual rockfall deposits as well as the difference (∆z) in elevation between the source point and deposit points (Figure 5). Using Equation (1), the value of γ is calculated which presents the value of an energy line angle as output that is appended to the existing attribute table.

3. Results

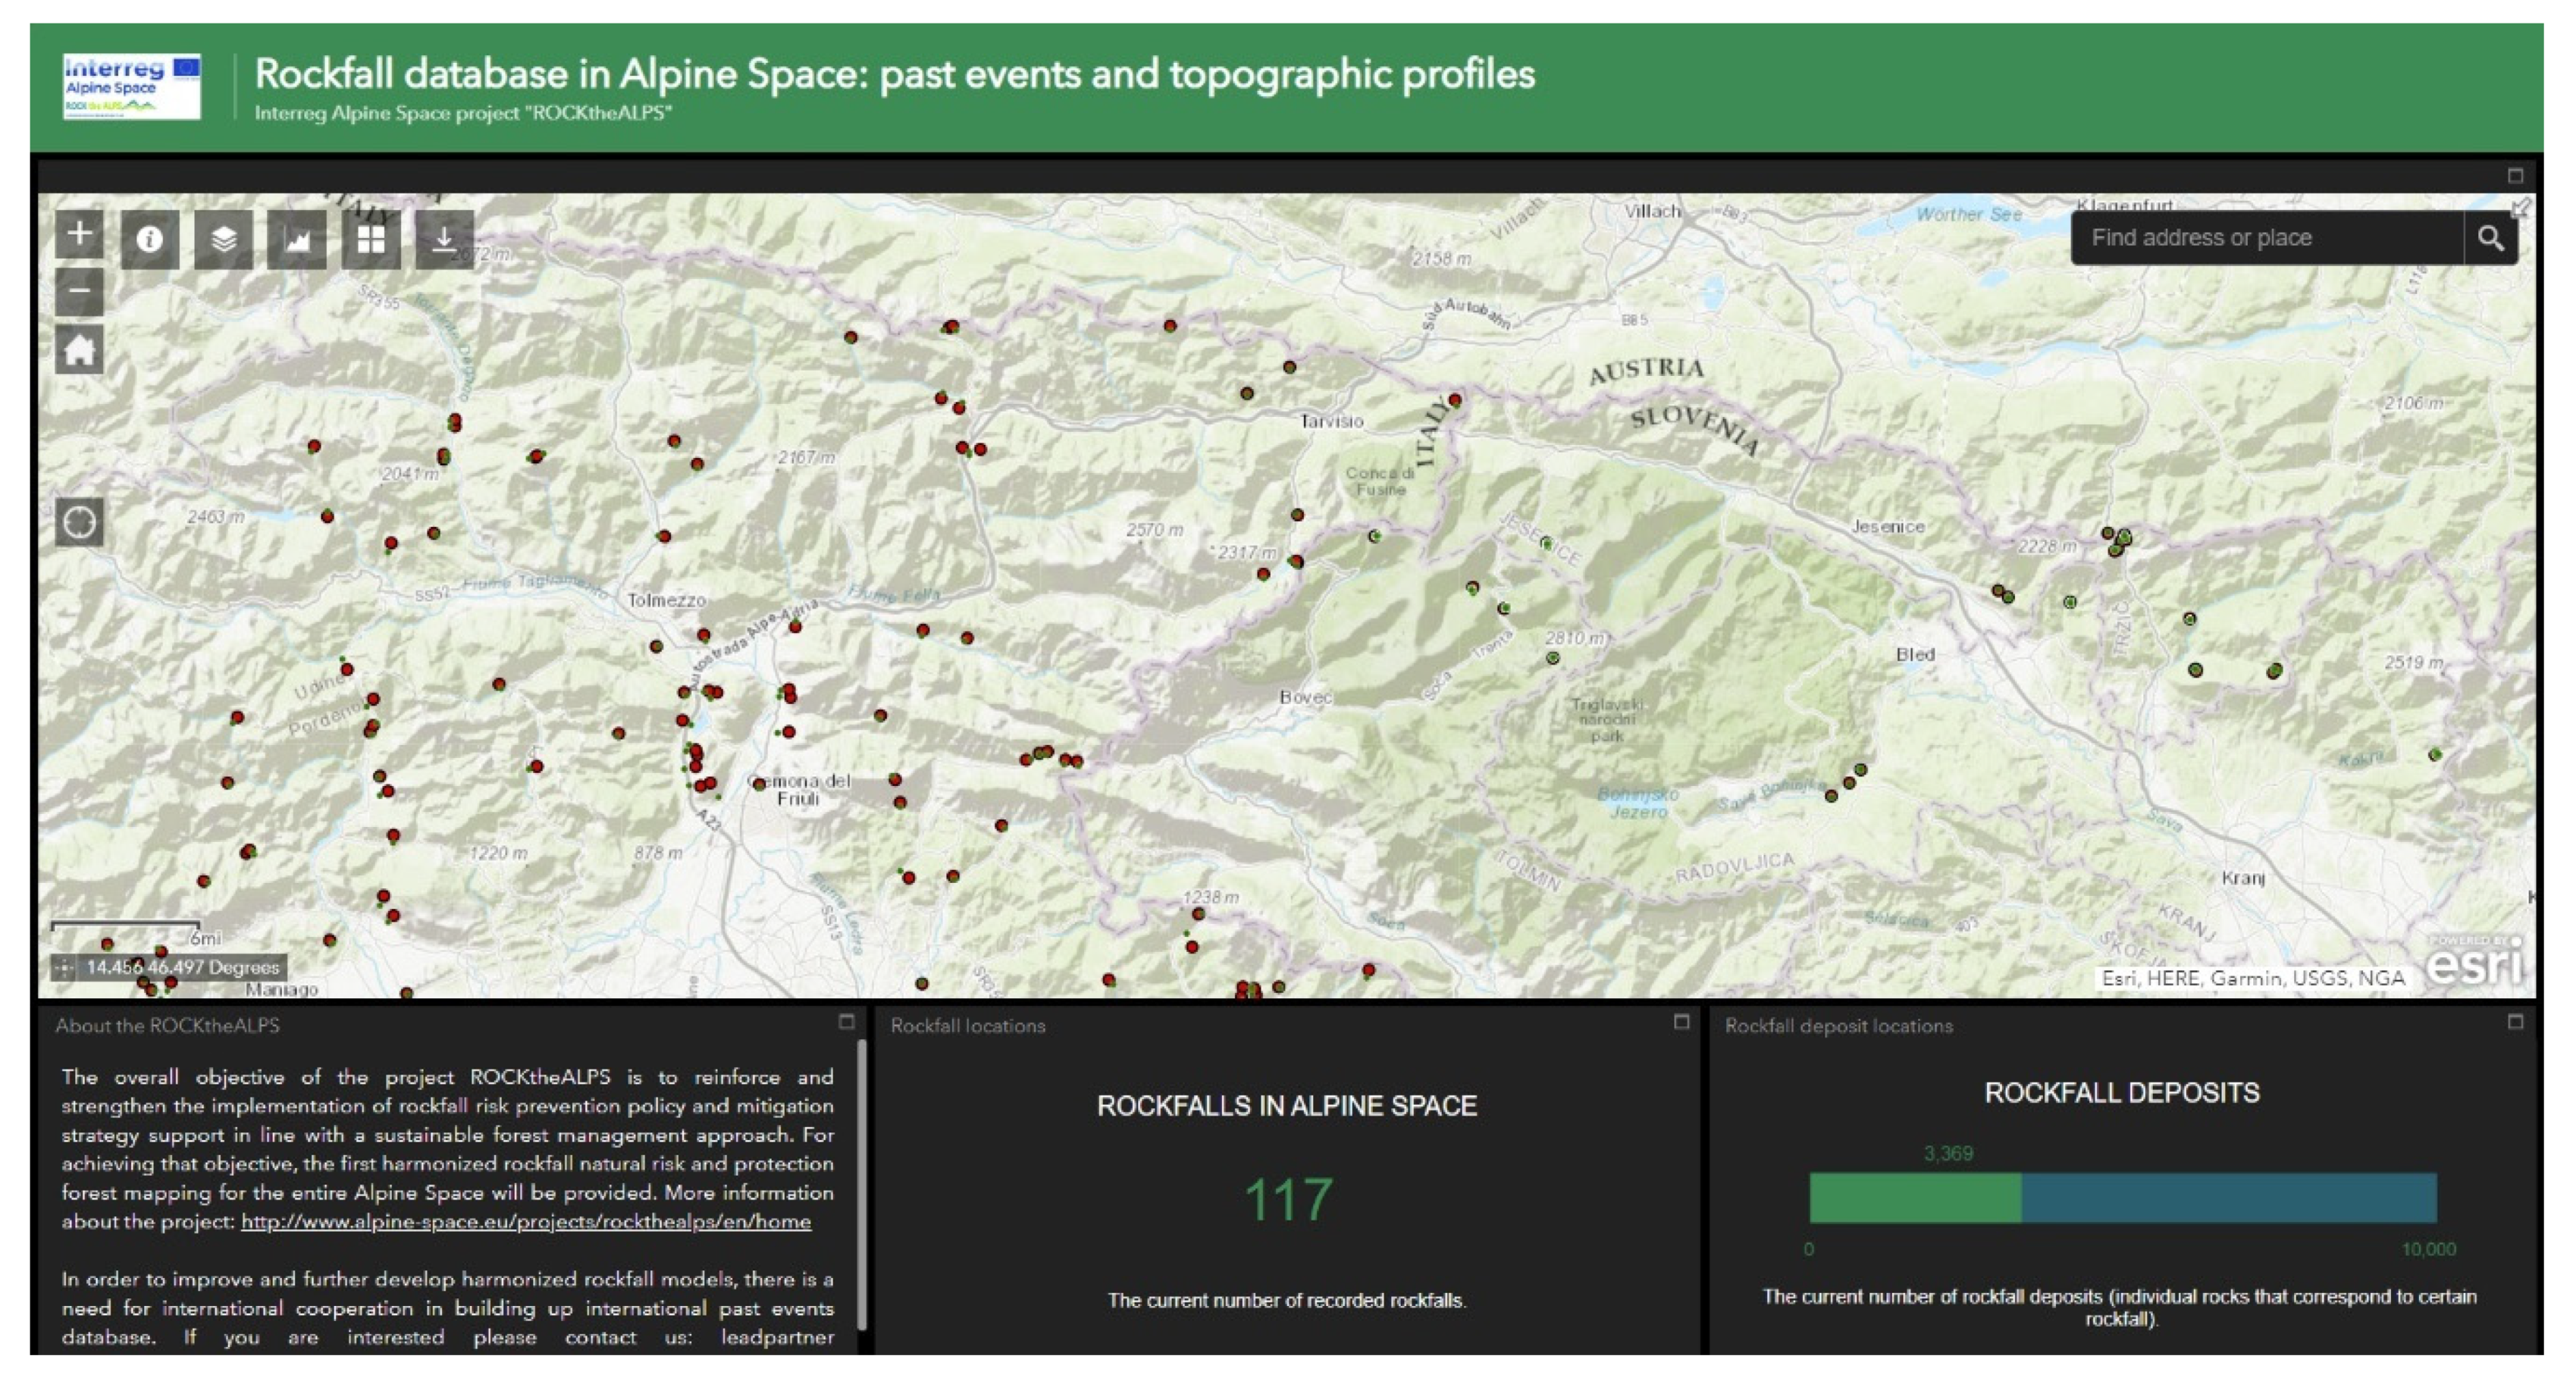
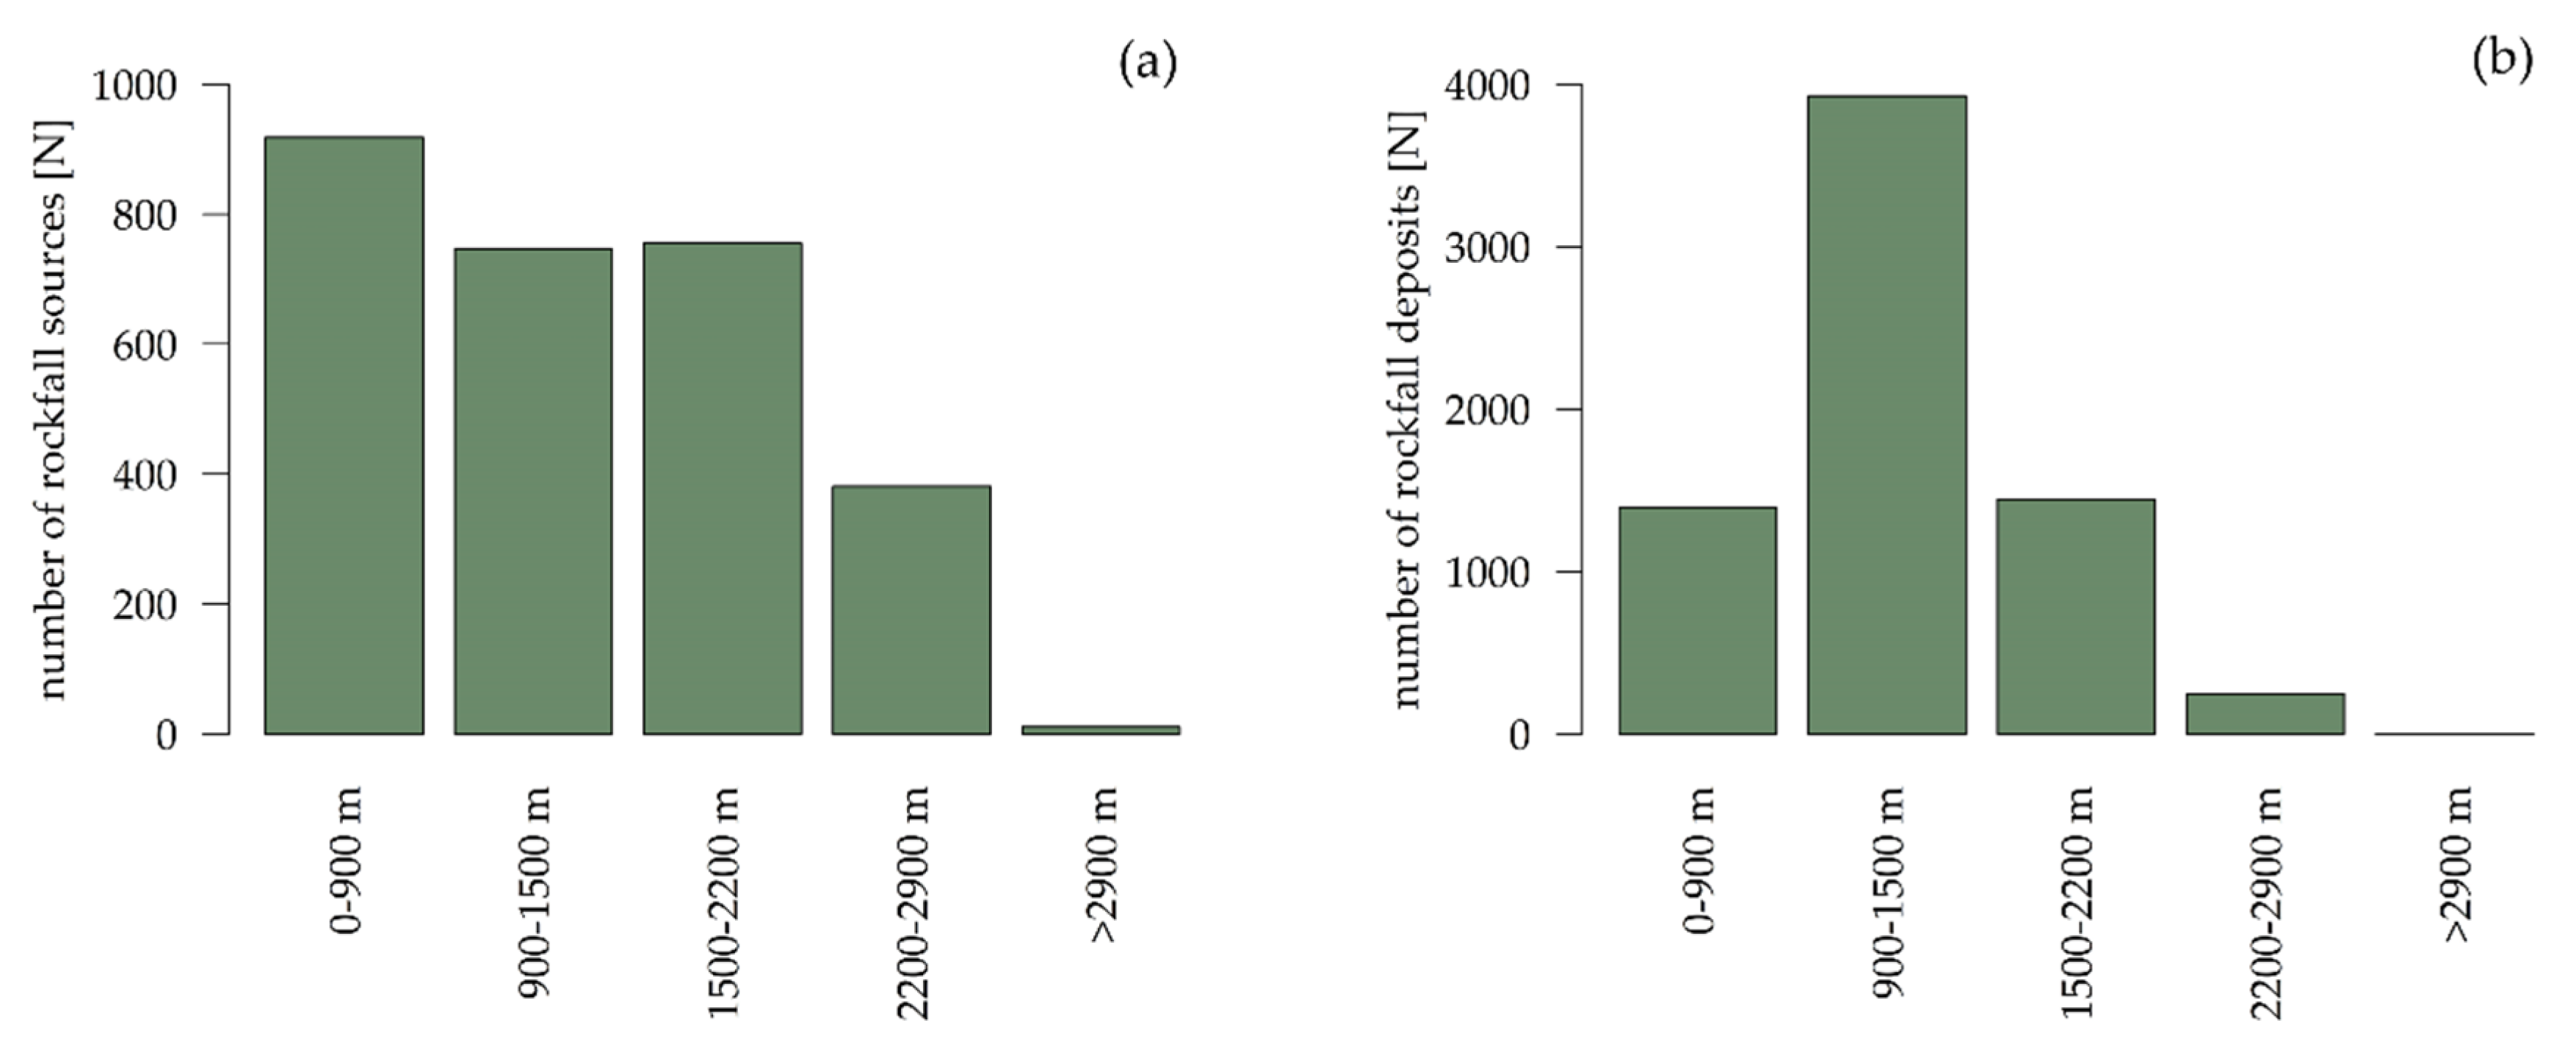
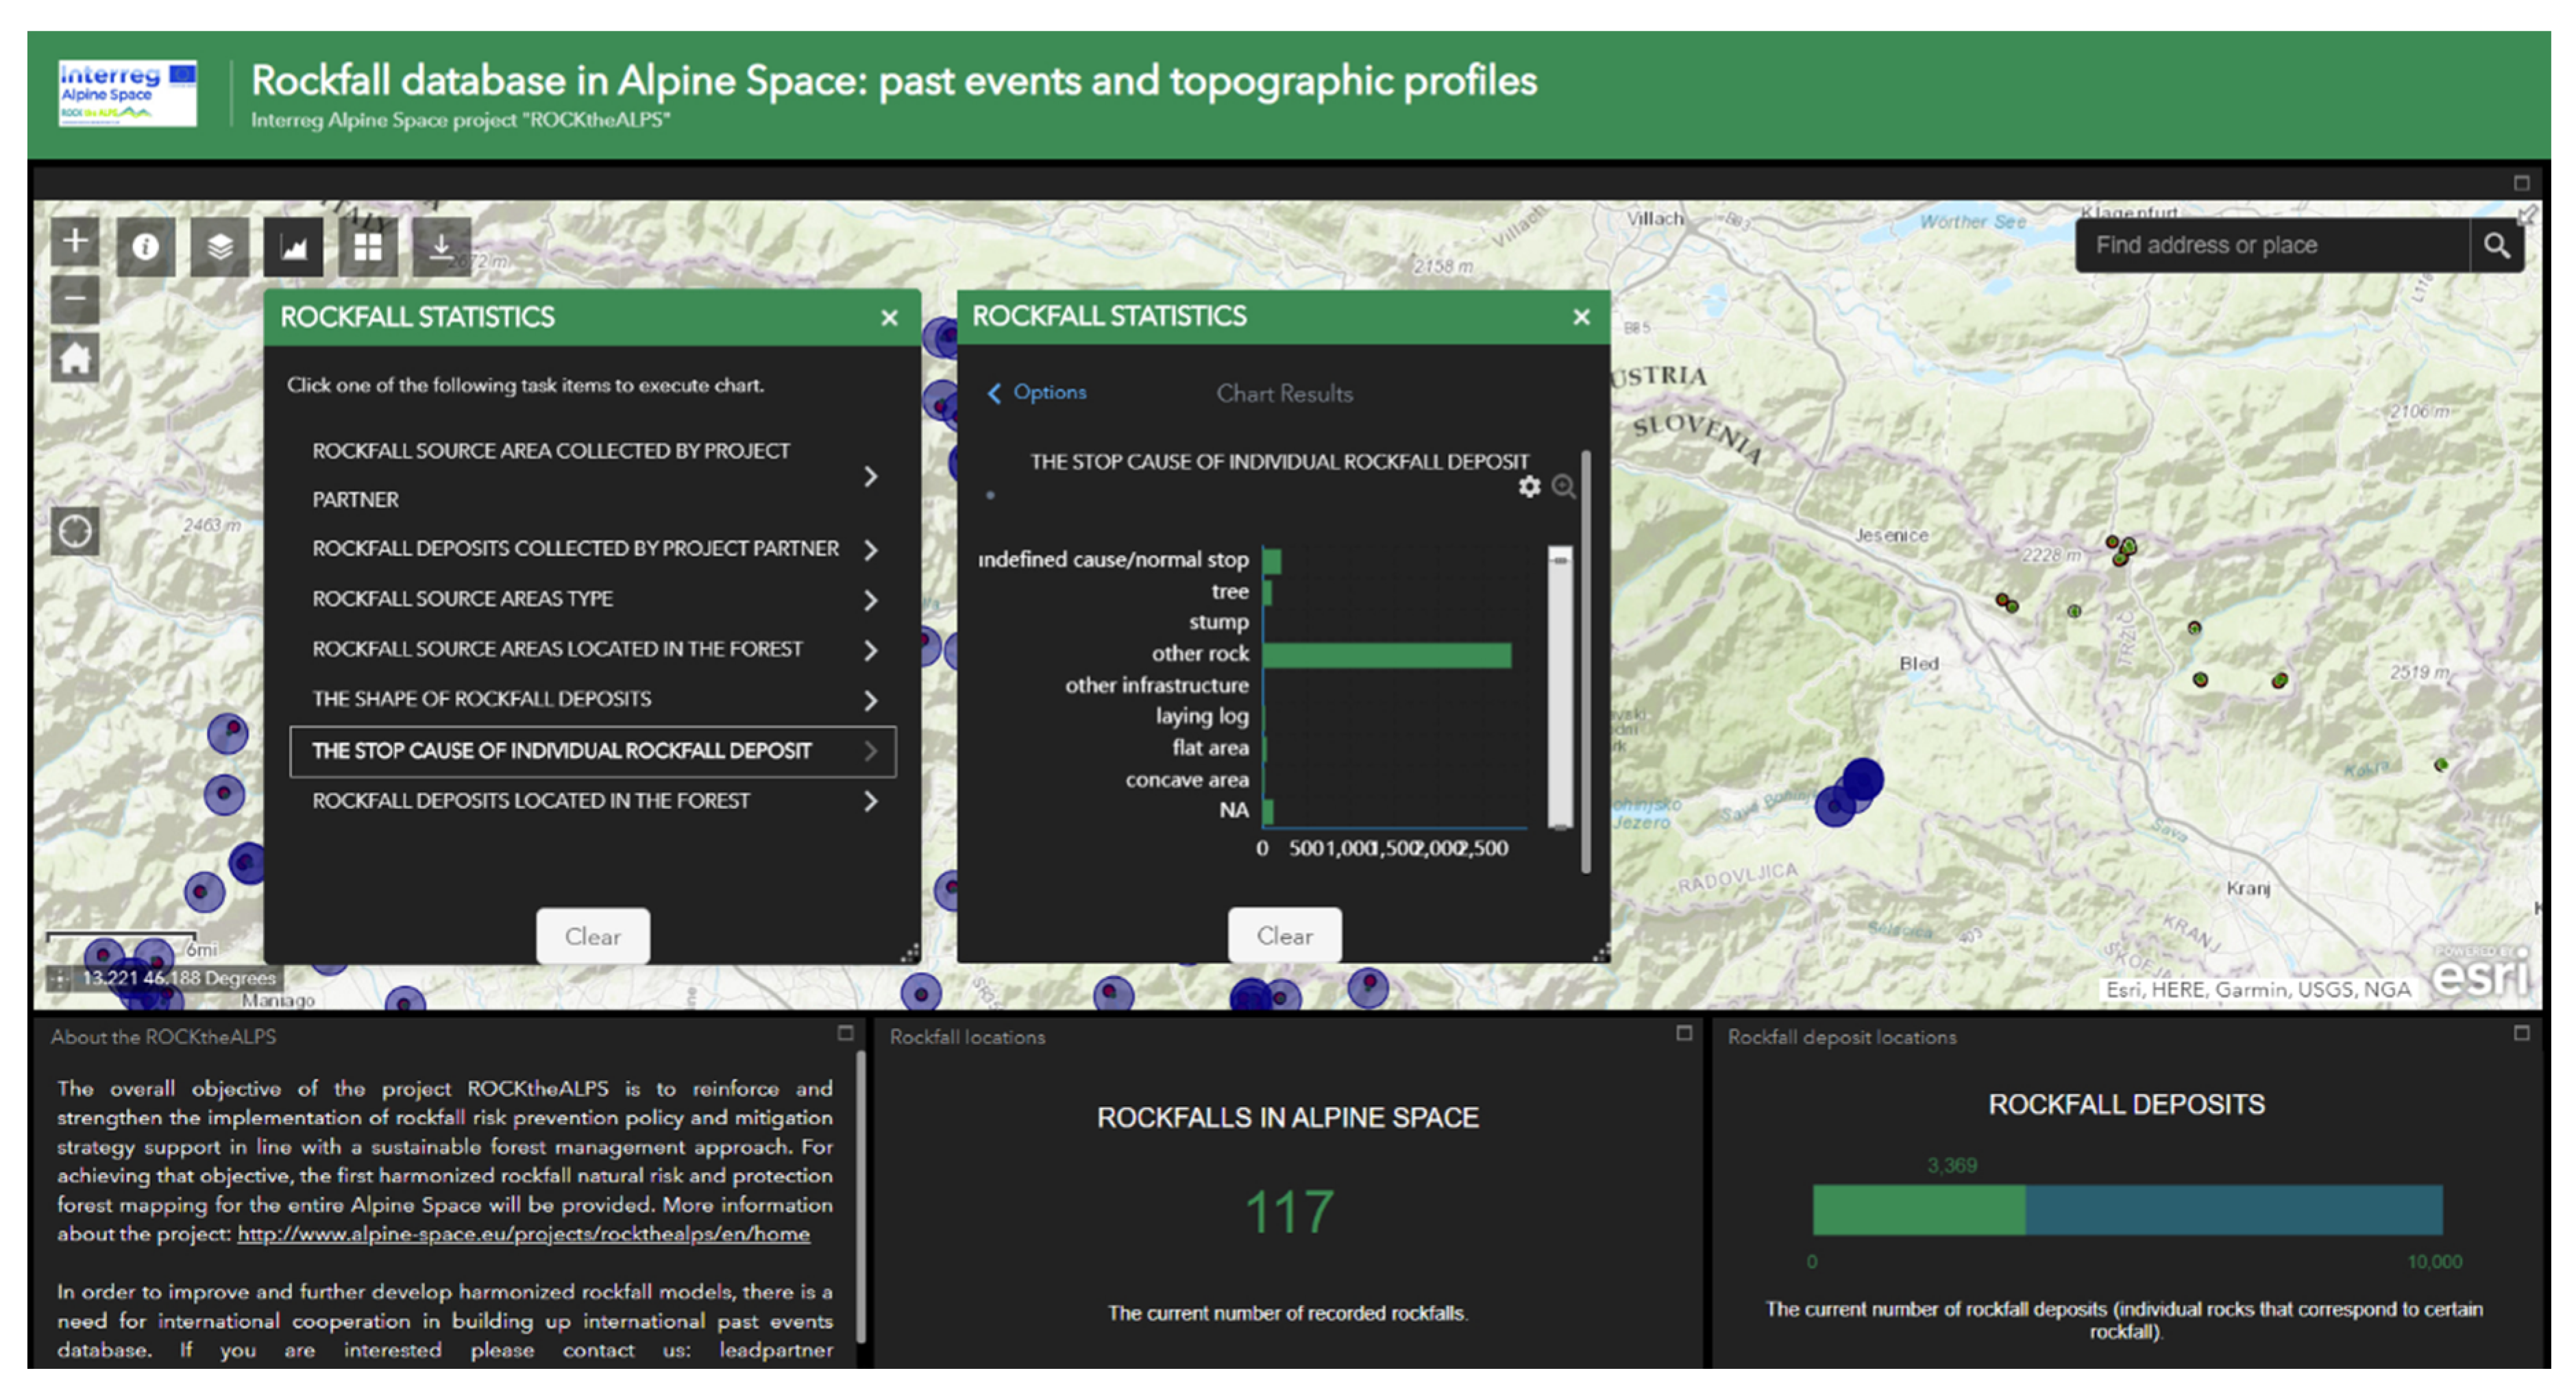
3.1. Case Study: Rockfall Database in the Alpine Space

After designing the mobile application, we began collecting data within the Alpine Space area (the Alps and their surrounding lowlands—Italy, France, Switzerland, Germany, Austria and Slovenia). The purpose of creating a historical rockfall database was to develop a new rockfall model called ROCK-EU (Interreg Alpine Space project ROCKtheALPS) [56]. For the duration of the project we surveyed 1516 locations of rockfall sites and have collected data on 4448 corresponding rockfall deposits; via other sources we also additionally added 1181 rockfalls with 2574 rock deposits. The field survey was conducted by experts from various research fields (e.g., experts from forestry, geology, environmental engineering etc.). After the field survey, the collected features were synchronised with the existing online database, and the data were then directly transferred to the WebGIS.
The WebGIS outlook is structured in a way that the Web Map with collected features represents the largest part of the website (Figure 5); the navigation pane is limited to small icons that can be popped-up by clicking on them. This pane includes the five sections: (i) short introduction explaining the content of the Web Map, (ii) list of layers, (iii) rockfall statistics tools, (iv) available basemaps for the Web Map, and (v) download section from where Web Map data can be exported. By clicking on an individual rockfall source point or deposit point (Figure 6), a pop-up window will appear with a list of all attributes that were collected along with the photographs of that source/deposit if they were taken.
By selecting a rockfall source point one can also obtain a list of all rock deposits that were collected at this site and via that list all those deposit attributes can be accessed. WebGIS tools enable simple statistical analyses of collected attributes (Figure 7), e.g., about the ratio between different source types or rockfall deposit shapes etc. The analyses can be performed for the whole Web Map extent at once or by using a spatial limitation query such as reduction of the Web Map extent or definition of the Web Map extent for the wanted analysis. The user of the WebGIS can change the Web Map’s basemap (e.g., topographic, imagery, streets etc.) for better visualisation, and the collected data can be exported in a common shapefile format to be further used in different GIS programs. The datum used in all WebGIS is EPSG:3857.
Based on the collected data, basic statistics were calculated in order to obtain an overview of rockfalls in this area. The average recorded length of rockfall runout zone was 250 m; the shortest runout was 5 m and the longest 1828 m. Most rockfall deposits stopped at the energy line angle 49° (Figure 8); after energy line angle 52° the frequency of the energy line angle drops drastically. The second peak is between 20° and 40°. The most common rockfall source type is rock cliff (99.1%), followed by bare rock (0.5%) and ground rocks (0.4 %), while there was no example of the type “rocks behind the trees”. Rockfall source area locations were mainly located outside the forest area (97.1%). Average volume of rockfall deposits was 2.3 m3, and the majority of rocks had a volume smaller than 1 m3. The most common rockfall shapes were undefined (45.7%) and rectangular (30.4%). The main stop cause of rocks were other rocks (69.9 %), followed by undefined/normal stop (12.4%) and trees (9.1%). Those trees had an average DBH of 28.4 cm. More than a half of the rockfall deposits were deposited outside the forest area (66.7%).
Altitudinal zonation of the vegetation in the Alps which represent specific vegetation and climate features and can both have a great impact on formation of rockfall source areas (release of rock material), and transportation and deposition of the rockfall deposits (presence of forest vegetation or not). The greatest change in the vegetation cover occurs with the increasing altitude since there will be no more obstacles that could reduce the velocity of the rocks or completely stop them. The features collected with the application offered us an insight into the topography and rockfall activity of the Alpine Space. Following the vegetation and altitudinal features of the Alps we were able to analyze rockfalls based on five zones (we took lower height limits for north-facing slopes) [57], namely foothill slope (0–900 m), montane zone (901–1500 m), subalpine zone (1501–2200 m), alpine zone (2201–2900 m), and nival zone (>2900 m). Analyses were combined with the DEM model of 25 m for the whole Alpine Space, provided by Copernicus [58].
As can be seen in Figure 9 the majority of individual rockfall sources is located in the first three zones as well as the rockfall deposits. The majority of deposits were collected in the second, montane zone. The maximum recorded rockfall source altitude was 3570 m, while for rockfall deposit it was a little lower: 3309 m. The average recorded rockfall source altitude was 1341 m, and the average rockfall deposit altitude 1211 m. The prevailing slope orientation of both sources and deposits was west (25% and 32%), followed by northwest and southwest oriented slopes.

3.2. Application of Collected Data for Calibration and Validation of Rockfall Modelling

The application of the methodology was tested for calibration and validation of two rockfall models: the empirical rockfall model CONEFALL [55], and the probabilistic process-based rockfall trajectory model Rockyfor3D [59]. The CONEFALL model uses the energy line method based on a simple Coulomb frictional model for calculating the rockfall propagation areas calculated on the basis of a conical shape. Rockyfor3D is a physically-based model that calculates trajectories of single individually falling rocks in three dimensions (3D). For detailed descriptions of both models see references in the beginning of the paragraph. In order to demonstrate the calibration and validation applicability of data collected with the mobile application based on the proposed methodology, rockfall, the characteristics of two rockfalls were collected. Tested rockfalls are located in the north-western part of Slovenia (Europe) in the Julian Alps (Figure 10), specifically in the Krnica Valley (46°25′54″ N, 13°47′7″ E), and in Trenta Valley (46°23′45″ N, 13°45′5″ E). The Krnica rockfall occurred in 2007 from an altitude of about 1465 m (layers of limestone and dolomite) toward the direction of the valley where the furthest rocks stopped at an altitude of about 1090 m. It covers an area of approximately 50,000 m2 with individual boulders ranging from 0.02 m3 to more than 100 m3. The rockfall in Trenta valley occurred in 2017 from a limestone rock wall of about 1160 m, and the rocks stopped on the steep forested slope at an altitude of about 940 m. It covered an area of approximately 19,000 m2 with boulders ranging from 0.01 m3 up to 80 m3. Altogether 1334 rockfall deposits were collected at the Krnica rockfall, and 368 rockfall deposits at the Trenta rockfall. The collection of the rockfall deposits was performed by using a smartphone and external GNSS device (Trimble R1) which can achieve a position accuracy up to 1 m. The Krnica rockfall was modelled with the CONEFALL model, while the Trenta rockfall was modelled with the Rockyfor3D model.
The modelling results were validated using goodness-of-fit (GOF) indices [60], based on a pixel-by-pixel comparison between the observed and modelled rockfall area, resulting in four possible outcomes: (i) true positive—TP (actual rockfall and modelled rockfall area; correct prediction), (ii) true negative—TN (no rockfall and no modelled rockfall area), (iii) false positive—FP (no rockfall area but modelled as one), and (iv) false negative—FN (no rockfall area and also not modelled as one). These indices are used for quantification of model performance since they assess the model’s performance using the relation between the benefits (true positive) and costs (false positives). Formetta et al. [60] have shown the variation of different indices that can be used for the validation analysis, however they state that even one is enough to evaluate the model’s performance. Consequently, we have used two of the most suitable indices based on their experience: the success index (SI), and the average index (AI):
SI = 1 2 ×   ( TP TP + FN +   TN FP + TN )
AI = 1 4 × ( TP TP + FN + TP TP + FP + TN FP + TN + TN FN + TN )

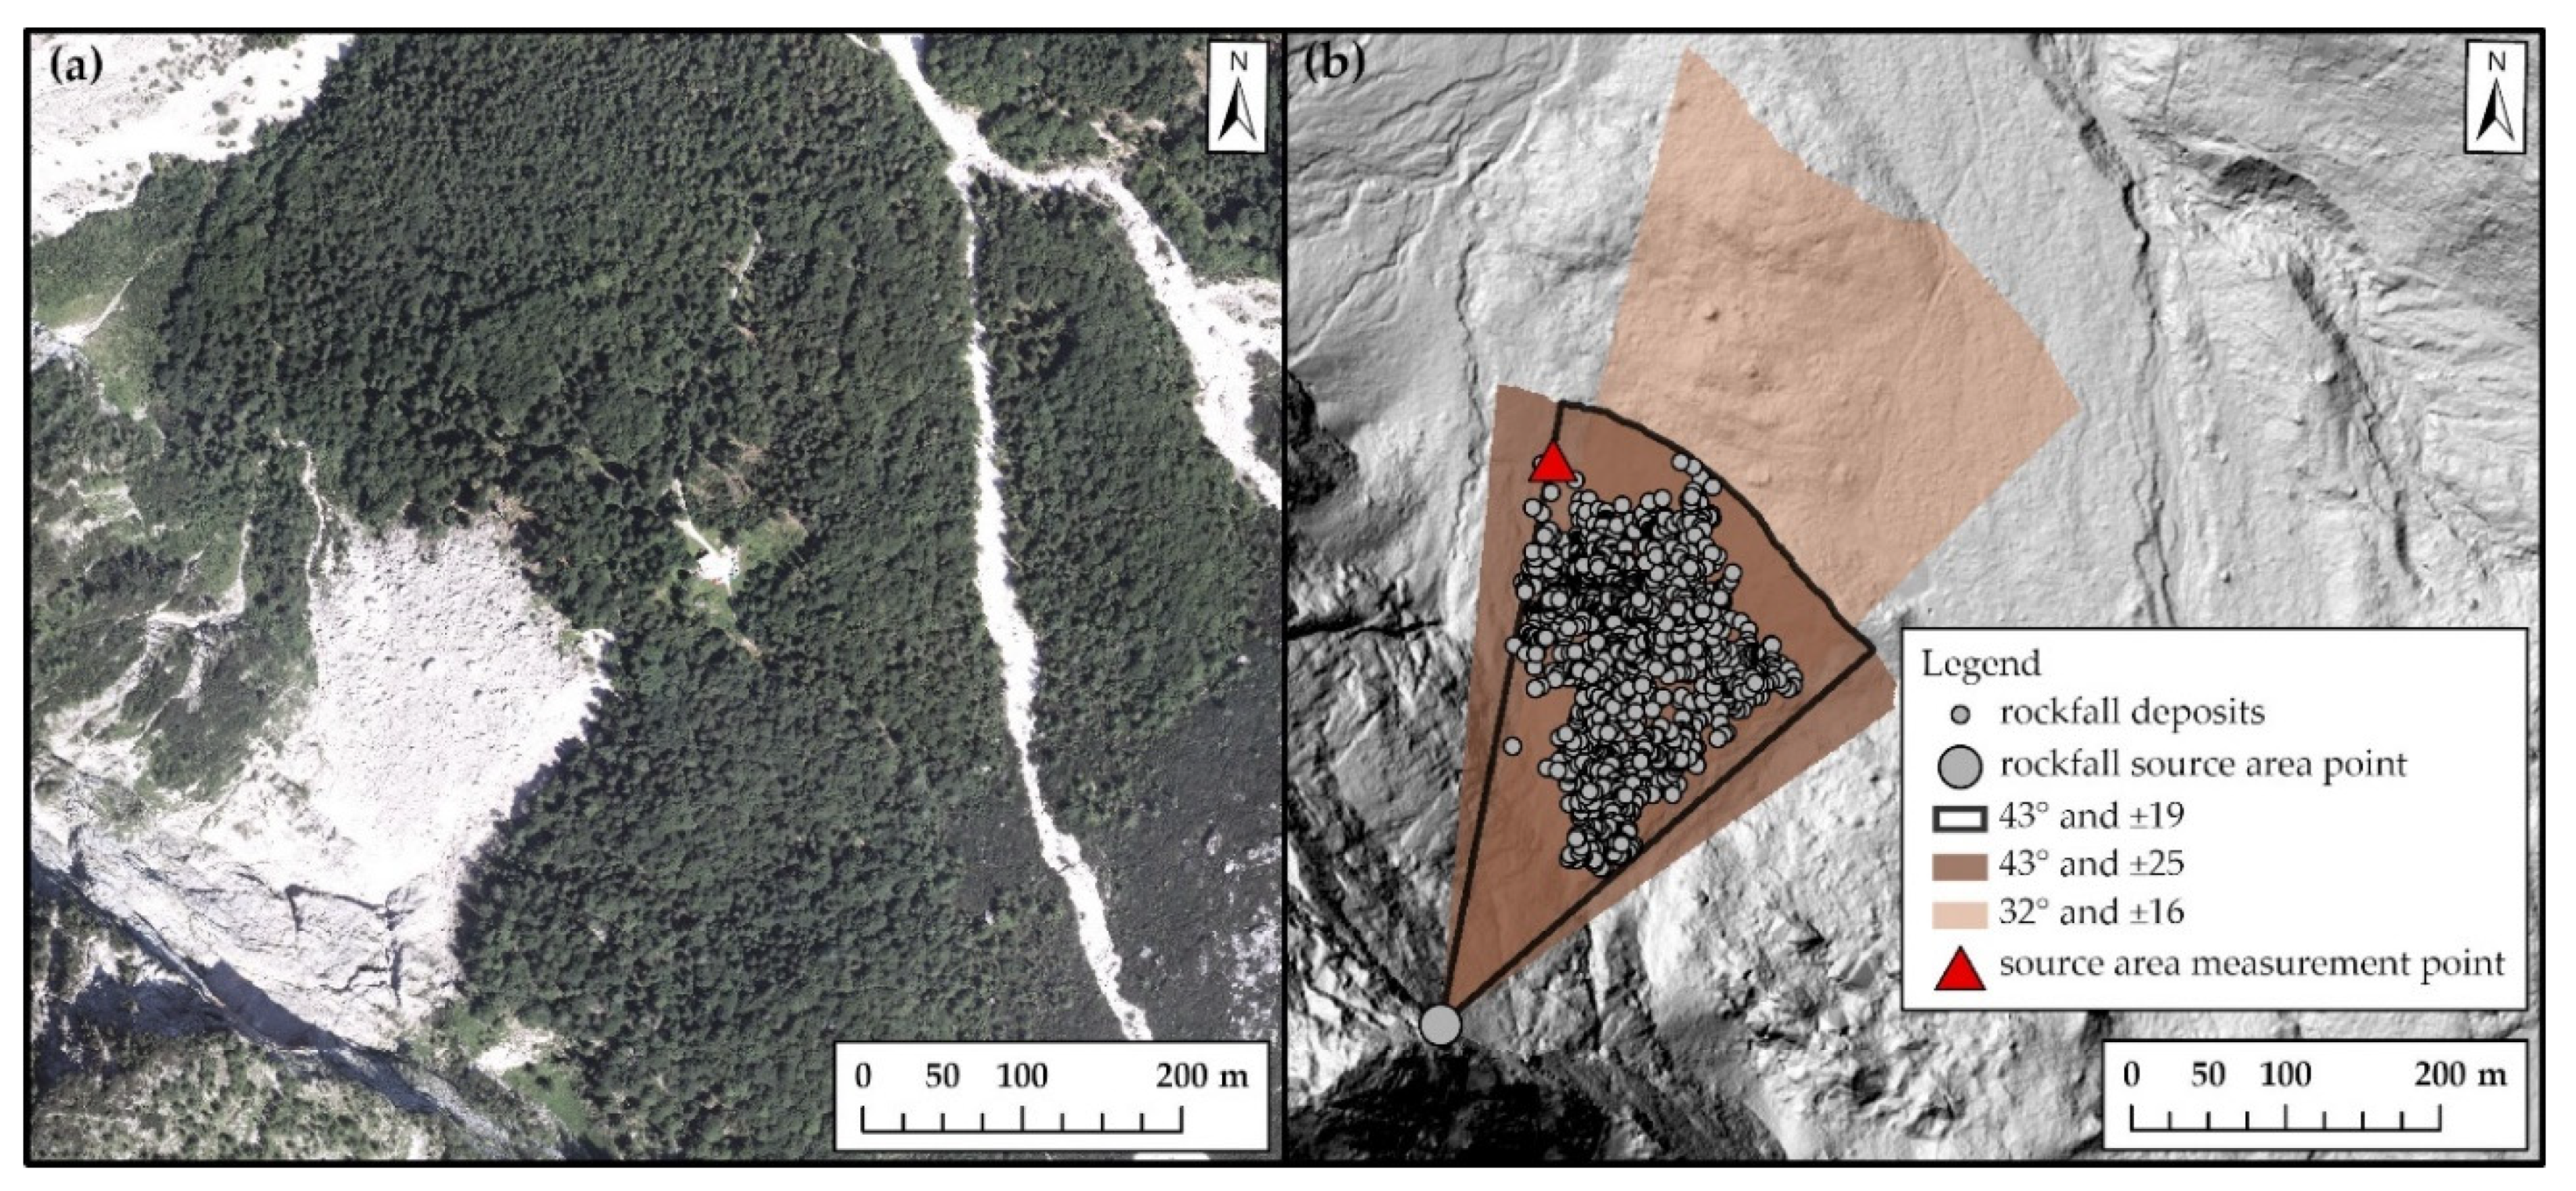
3.2.1. Krnica Rockfall

Using the locations of the rockfall source area and rockfall deposits, and the ELA tool, energy line angles for individual rockfall deposit were calculated for the Krnica rockfall. The average value of energy line angle was 51° with a minimum value being of 43° and a maximum 64°, while the later angle of rockfall deposition zone was ±19°. When modelling with CONEFALL we used three scenarios with different sets of parameters: (i) energy line angle 32° and lateral angle ±16° (since these values are most commonly proposed in the literature) [61], (ii) energy line angle 43° and lateral angle ±19° (calculated based on field measurements), and (iii) energy line angle 43° and lateral angle ±25° (increased lateral angle so that all locations of rockfall deposits are located within the modelled area). The CONEFALL model requires two input datasets: DTM and rockfall source area raster. For DTM we used LiDAR data with a grid cell size 1 × 1 m [62], and for the rockfall source area we used the location (one grid cell) of the actual rockfall source calculated with the ELA tool. Since the model uses the aspect of the surface for calculating the direction of the rockfall runout area, the rockfall source area was given based on the median value of the aspect of the larger rockfall source area determined by mapping using an orthophoto image and positions of rockfall deposits. For the purpose of showing the match between the recorded rockfall deposits, we only used one rockfall grid cell.
The modelling results are shown in Figure 11. When using the combination of values from the literature (32° ± 16°) it can be observed that the model has some predictive power (Table 1) by modelling (AI = 0.78, SI = 0.89) the majority of actual rockfall runout area and capturing the majority of recorded rockfall deposits (95.4%), however the runout area is greatly overestimated at its maximum (in average by 226 m) and in some part also in the lateral direction (on average by 7 m). The predictive power of the model increases significantly once we use the values collected from the field observations. Using the second scenario (43° ± 19°) the model achieves the best ratio between the rockfall deposits located inside the modelled rockfall runout area (AI = 0.92, SI = 0.98), the maximum and lateral rockfall runout extent. At the maximum runout area the model still overestimates by an average 32 m and in the lateral deposition direction of only 9 m while 99.5 % of collected rockfall deposits are located within the modelled area. With the third scenario (43° ± 25°) the model still displays high predictive power (AI = 0.90, SI = 0.93), capturing all the recorded rockfall deposits but with the increased lateral angle the model largely overestimates in the lateral direction (at maximum on average 36 m; in the lateral direction on average 27 m). The SI and AI indices both achieve the highest values with the second scenario where both angles used in the modelling were adjusted completely to the field measurements.

3.2.2. Trenta Rockfall

The Rockyfor3D model requires several input data and parameters to be set before starting the modelling procedure, specifically rockfall source area, DTM, number of simulations, additional fall height from the source area, variation of the rock volume (%), rock density (kg/m3), rock block dimensions (d1, d2, d3), rock block shape, soil types on the surface slope, and surface roughness coefficients (rg70, rg20, rg10) that represent 70%, 20% and 10% of the mean obstacle height (MOH; height of the rocks) on the surface slope [59]. Additionally, the model enables rockfall simulations with the effect of forest and/or simulations using nets.
For the purpose of calibrating the model, we used the proposed methodology for collecting data on dimensions of rockfall deposits (d1, d2, d3), and their shape. Additionally, as our purpose was also to validate the modelled rockfall propagation area, we collected the positions of the rockfall deposits at the maximum outline of rockfall in order to obtain the real shape of the rockfall. After the simulations, the actual rockfall outline was after the simulations compared to the raster map called “propagation probability” which is a simulation result of Rockyfor3D that presents the most realistic spatial distribution of the rockfall event. Along with the collection of the rockfall deposits we also mapped the soil types and rg coefficients. Based on the rg coefficients we divided three areas: (i) scree slope area, and (ii) rocky terrain overgrown by dwarf pines and conifers, and (iii) steep terrain with surface rockiness in the mixed forest. The whole area was set to have one soil type (talus slope with Ø > ~10 cm, or compact soil with large rock fragments). Collection of the rockfall deposits with the proposed methodology and mobile application enabled us to calculate the following realistic data: rock block dimensions that we used in the simulation were set to d1 = 1.4 m, d2 = 0.9 m, d3 = 0.8 m, while the prevailing rock shape of deposits was set to rectangular. Other input data/parameters were set to: DTM with grid cell size 2 × 2 m [62], the number of simulations was 1000, initial fall height to 50 m (calculated based on the height difference using DTM data), variability of rock volume was set to ±0 %, and the modelling was performed by taking into account the effect of forest (input data into the model were the XY coordinates of trees with their DBH).
The surface roughness coefficients were those that have the most effect on the final runout area, and by adjusting its values based on the locations of rockfall deposits we were able to determine the best combination. After fine-tuning the model we have used surface roughness coefficients (rg70, rg20, rg10) of 0.14, 0.36 and 0.65. The model is able to simulate the shape of rockfall propagation and runout area correctly also capturing the trajectories of individual rocks that were stopped in the forest in the northern part of the runout area (Figure 12). The largest overestimation compared to the real rockfall outline are occurred in both lateral directions (on average by 20 m at the southern lateral part, and by 28 m at the northern lateral part). In smaller part at the maximum runout extent the model underestimated the actual rockfall extent on average by 6 m. The GOF indices AI and SI show that the model is able to correctly predict approximately 90 % (Table 1) of the actual rockfall propagation area. One of the outputs of the Rockyfor3D model is also a raster map with the minimum recalculated energy line angles per raster cell in °. In order to validate a correlation between the energy line angle and the rock volumes we compared the following two parameters. As can be observed on Figure 13, there is no correlation between the energy line value and the rockfall deposit volume.

4. Discussion

This paper presents a new methodology for collecting rockfall data directly on the field by using a mobile Esri application Collector for ArcGIS. The main purpose of its use is to collect new rockfall events that have not yet been recorded in the existing databases, which could later on be united with the data of known rockfall sites. It enables the collection of two crucial forms of information about the rockfall: the locations of the source area and rockfall deposits, and additional attributes describing the specifics of each rockfall (e.g., source area type, rockfall deposit shape and stop cause, location in the forest or not etc.). Since the location of the source area is difficult to measure directly in the field, an approach to calculating it based on the azimuth and angle value from the visible spot toward an actual source, in combination with a of digital terrain model (DTM), has been shown. The main advantages of this approach are: (1) the collected data are saved in standard vector file (polygon shapefile, .shp) and can be further analyzed with different GIS software; (2) the collection of data is unified and harmonised meaning that the collection of data is replicable and comparable with different rockfall sites; (3) the collected data can be updated directly in the field with the existing online database and data can be processed in real time; (4) the collected attributes are applicable for calibration and validation of rockfall models. The amount of data and level of detail that can be collected with this approach presents a great advantage compared to traditional field surveying (e.g., using paper application forms).
The collected data are visualised in WebGIS also provided by Esri, and are available online to be accessed by the users at different expert levels, namely we can distinguish between three classes of user:
  • Level 1 user: can access the WebGIS platform only for visualisation of the collected data.
  • Level 2 user: can access the WebGIS platform for visualisation and can use the mobile application for collection of data and for updating the data on the WebGIS platform.
  • Level 3 user: has the same abilities as the Level 2 user, and can additionally operate with the geodatabase by updating it with external data, can control the WebGIS and mobile application, and perform complex queries and analyses on data in the geodatabase.
Generally, the Level 1 users can be labeled as lay public, while Level 2 and 3 users correspond to expert users due to the nature of attributes that need to be collected and the equipment that is required for the collection of data. The further planned upgrade of the WebGIS platform in a way that would allow public participation so that they would only record the location of a new rockfall sitting, and then an expert team could use that information to visit that site and perform a complete survey of that rockfall according to the approach presented in this paper. This would also require the preparation of guidelines for the procedure of data collection for the non-experts, and an establishment of an administrative team that would check the validity of records provided by them. Moreover, use of the application could also be upgraded in the way that other gravitational processes could be collected (e.g., avalanches, landslides, debris slides) in a similar manner in order to collect data on all major natural hazards in alpine areas.
The main purposes of the Results section of this paper was to show that the mobile application: (i) can be used for collection of data at the regional scale (since it was used for creating a database in the Alpine Space); and (ii) can be used for calibration and validation of rockfall models. Based on the collected rockfall events in the Alpine Space, we were able to get an insight to the rockfall statistics at the regional scale which is a first at Alpine scale. Observing the energy line angles, we can detect two peaks in values. First is between energy line angle values 46° to 57°, while the second is between 20° and 36°, which means that the majority of recorded rockfall events had a quite short runout length. There are differences between the recorded number of events in altitude classes between rockfall sources and deposits. If the representation of the rockfall sources is more equalized between the classes (except the altitude class > 2900 m where there are only 11 events), there is a clear difference in classes with rockfall deposits which have by far the highest frequency in the altitude class 900–1500 m. The least records were are for both rockfall areas sources/deposits in the highest altitude class since the high-altitude rockfalls were not recorded in the database. In this study we did not focus on studying the differences in the altitude classes but the main purpose was to show the use of the mobile application for even creating a rockfall database at such scale. However, the results represent the start of future study.
Applicability of the results to rockfall modelling was shown briefly through the use of two models: the empirical model CONEFALL, and the physically-based, probabilistic Rockyfor3D model. We intentionally chose models with completely different modelling approaches in order to portray the versatile use of the collected data by the new methodology. The collected data were crucial for the calibration of both models, and we have shown that without site-specific data the simulation results would model rockfall propagation and runout area in a non-realistic way. Since the CONEFALL model models the rockfall runout area in a conical shape, fine-tuning of the model is of even greater importance. Namely, the modelling method is highly dependent on the geomorphology of the studied area, meaning that the chosen parameters such as the rockfall source area and energy line angle that defines the maximum runout zone must be performed on the basis of local observations [55]. In this sense, the proposed methodology presents an efficient tool for rockfall models that use similar statistical modelling approaches. For empirical models the most important information is the maximum extent of the rockfall area; in these cases, it might suffice to collect rockfall only the maximum outline of deposited rockfall runout. CONEFALL was in the case of this paper used at the local level (one rockfall site) but due to the simple rockfall propagation and runout area it is more appropriate for use at larger regional scales. For the representation purposes of this paper we also used one rockfall source cell meaning that the model was more sensitive for modelling the direction of the rockfall propagation area. With more source cells the neighboring source cells form a joint runout area taking into account the direction of all source cells. More input parameters for modelling with the mobile application were collected for simulations with Rockyfor3D (rock source area, rock deposits shape and dimensions). In the case of models that require more input parameters, calibration of the model required more input, but the final results provide the shape of the rockfall propagation and runout area that for the most part matches with the shape of collected rockfall deposits, proving that the model is suitable for use at the local scale. We have shown that the volume of rockfall deposits does not necessarily correlate with the volume of the rocks which confirms the findings of some authors [63].
The applicability of the collected data with a presented mobile application does not stop only at calibration and validation of the models. What we have shown is just a glimpse of what can be done with the collected rockfall data. The other possible applications could for example studying of rockfall triggering mechanisms and temporal occurrence [32,34,64,65,66,67,68], magnitude-frequency of the events [7,8,15,17,20], lithological characteristics [32,69,70,71], studying the protection effect of forest against rockfalls [72,73,74,75], rockfall distribution at different elevations [32,64], influence of climate change on rockfall activity [64,67,76] etc.

5. Conclusions

In the present study, a new methodology and mobile application for collecting data on past rockfall events (rockfall source areas and rockfall deposits) has been presented. Since existing rockfall databases lack data about past events or are often characterised as incomplete, non-harmonised, and thus uncertain, there is a need for an approach that would solve the presented issues. With the development of technologies, the collection of data via smartphones is increasingly being used, leading our research to form a methodology that would be based on collecting past rockfall events with a mobile device (using the Collector for ArcGIS) which enables a uniform, quick and simple approach to the collection of data in the field. Data that are being collected in the field are temporarily stored on the mobile device and then uploaded to the common database in the ArcGIS Online cloud, meaning two things: (i) the application can be used by an unlimited number of users simultaneously; and (ii) data can be shown and analysed directly, in real-time, on the WebGIS platform. The collected data are further available to various classes of user (based on their user level) and can be applied in different rockfall risk analyses. Using the methodology, the partners of the “ROCKtheALPS” project have built a large (transnational)-scale database and used it to model rockfalls and rockfall protection forests in the Alpine Space. However, the use of the application does not stop here—it has the potential to be used by larger crowds and further expand the barriers on known past rockfall events or even other mass movement processes (e.g., avalanches, landslides, debris flows). Rockfall databases do not only pose great importance to the scientific community but also raise the awareness of the rockfall associated risk to the general public.
As has been shown, the collected attributes of rockfall source and deposits can be used to provide input parameters for the calibration of empirical and process-based rockfall models, and can also be used to validate the modelled rockfall risk by obtaining several rockfall propagation statistics. This methodology is especially suitable for deriving energy line angles which are an important input parameter in empirical models. As energy line angles strongly depend on the geomorphology of the surface they cannot be applied blindly, the choice of appropriate energy line angle must be based on local field observations. By developing a tool for calculating energy line angles based on the rockfall source area and corresponding deposits, this process is greatly simplified. The validation of simulation results needs a lot of ground truth data, the collection of which is a time-consuming activity. Implementing tools are able to support this field survey is of great importance for rockfall risk mapping. Having a large dataset for validating simulation results can help in adopting different solutions, not only limited to an “event validity” approach but allowing the statistical validation of the model.

Author Contributions

Conceptualisation Barbara Žabota and Milan Kobal; Methodology, Barbara Žabota and Milan Kobal; Data Curation, Barbara Žabota and Milan Kobal; Writing-Original, Barbara Žabota and Milan Kobal; Draft Preparation, Barbara Žabota; Writing-Review and Editing, Barbara Žabota and Milan Kobal; Visualisation, Barbara Žabota; Supervision, Milan Kobal; Project Administration, Milan Kobal. All authors have read and agreed to the published version of the manuscript.

Funding

This research was funded by Interreg Alpine Space projects “ROCKtheALPS” (ASP 462) and “GreenRisk4ALPs” (ASP 635).

Acknowledgments

The authors would like to express their gratitude for the joint work of the research team of the ROCKtheALPS project in constructing the Alpine Space rockfall database. The authors also thank anonymous reviewers for helpful comments that improved the original manuscript.

Conflicts of Interest

The authors declare no conflict of interest.

References

  1. Cruden, D.M.; Varnes, D.J. Landslide types and processes. In Landslides Investigation and Mitigation; National Research Council, Transportation Research Board; Special Report 247; Turner, A.K., Schuster, R.L., Eds.; Transportation Research Board: Washington, DC, USA, 1996; pp. 36–75. [Google Scholar]
  2. Lopez-Saez, J.; Corona, C.; Eckert, N.; Stoffel, M.; Bourrier, F.; Berger, F. Impacts of land-use and land-cover changes on rockfall propagation: Insights from the Grenoble conurbation. Sci. Total Environ. 2016, 547, 345–355. [Google Scholar] [CrossRef] [PubMed]
  3. Corominas, J.; Mavrouli, O.; Ruiz-Carulla, R. Rockfall Occurrence and Fragmentation. In Advancing of Living with Landslides, WLF 2017; Sassa, K., Mikoš, M., Yin, Y., Eds.; Springer: Cham, Switzerland, 2017; pp. 75–97. [Google Scholar]
  4. Dorren, L.; Berger, F.; Jonsson, M.; Krautblatter, M.; Mölk, M.; Stoffel, M.; Wehrli, A. State of the art in rockfall—Forest interactions. Schweiz. Z. Forstwes 2007, 158, 128–141. [Google Scholar] [CrossRef] [Green Version]
  5. Volkwein, A.; Schellenberg, K.; Labiouse, V.; Agliardi, F.; Berger, F.; Bourrier, F.; Dorren, L.K.A.; Gerber, W.; Jaboyedoff, M. Rockfall characterization and structural protection—A review. Nat. Hazards Earth Syst. Sci. 2011, 11, 2617–2651. [Google Scholar] [CrossRef] [Green Version]
  6. Crosta, G.B.; Agliardi, F.; Frattini, P.; Lari, S. Key Issues in Rock Fall Modelling, Hazard and Risk Assessment for Rockfall Protection. In Engineering Geology for Society and Territory; Lollino, G., Giordan, D., Crosta, G.B., Corominas, J., Azzam, R., Wasowski, J., Sciarra, N., Eds.; Springer: Cham, Switzerland, 2015; Volume 3, pp. 43–58. [Google Scholar]
  7. Dussauge-Peisser, C.; Helmstetter, A.; Grasso, J.-R.; Hantz, D.; Desvarreux, P.; Jeannin, M.; Giraud, A. Probabilistic approach to rock fall hazard assessment: Potential of historical data analysis. Nat. Hazards Earth Syst. Sci. 2002, 2, 15–26. [Google Scholar] [CrossRef]
  8. Guzzetti, F.; Reichenbach, P.; Wieczorek, G.F. Rockfall hazard and risk assessment in the Yosemite Valley, California, USA. Nat. Hazards Earth Syst. Sci. 2003, 3, 491–503. [Google Scholar] [CrossRef] [Green Version]
  9. Malamud, B.D.; Turcotte, D.L.; Guzzetti, F.; Reichenbach, P. Landslide inventories and their statistical properties. Earth Surf. Process. Landf. 2004, 29, 687–711. [Google Scholar] [CrossRef]
  10. Mateos, R.M.; García-Moreno, I.; Reichenbach, P.; Herrera, G.; Sarro, R.; Rius, J.; Aguiló, R.; Fiorucci, F. Calibration and validation of rockfall modelling at regional scale: Application along a roadway in Mallorca (Spain) and organization of its management. Landslides 2016, 13, 751–763. [Google Scholar] [CrossRef]
  11. Žabota, B.; Repe, B.; Kobal, M. Influence of digital elevation model resolution on rockfall modelling. Geomorphology 2019, 328, 183–195. [Google Scholar] [CrossRef]
  12. Abbruzzese, J.M.; Sauthier, C.; Labiouse, V. Considerations on Swiss methodologies for rock fall hazard mapping based on trajectory modelling. Nat. Hazards Earth Syst. Sci. 2009, 9, 1095–1109. [Google Scholar] [CrossRef] [Green Version]
  13. Lari, S.; Frattini, P.; Crosta, G.B. A probalistic approach for landslide hazard analysis. Eng. Geol. 2014, 182, 3–14. [Google Scholar] [CrossRef] [Green Version]
  14. Mikoš, M.; Petje, U.; Ribičič, M. Application of a Rockfall Simulation Program in an Alpine Valley in Slovenia. In Disaster Mitigation of Debris Flows, Slope Failures and Landslides; Lambrat, S., Nicot, F., Eds.; Universal Academy Press, Inc.: Tokyo, Japan, 2006; pp. 199–211. [Google Scholar]
  15. De Biagi, V.; Lia Napoli, M.; Barbero, M.; Peila, D. Estimation of the return period of rockfalls according to the block size. Nat. Hazards Earth Syst. Sci. 2016, 17, 103–113. [Google Scholar] [CrossRef] [Green Version]
  16. Dussauge, C.; Grasso, J.-R.; Helmstetter, A. Statistical analysis of rockfall volume distributions: Implications for rockfall dynamics. J. Geophys. Res. 2003, 108, 2286. [Google Scholar] [CrossRef] [Green Version]
  17. Brunetti, M.T.; Guzzetti, F.; Rossi, M. Probability distributions of landslide volumes. Nonlinear Process. Geophys. 2009, 16, 179–188. [Google Scholar] [CrossRef]
  18. Corominas, J.; Mavrouli, O.; Ruiz-Carulla, R. Magnitude and frequency relations: Are there geological constrains to the rockfall size? Landslides 2018, 15, 829–845. [Google Scholar] [CrossRef] [Green Version]
  19. Jaboyedoff, M.; Dudt, J.P.; Labiouse, V. An attempt to refine rockfall hazard zoning based on the kinetic energy, frequency and fragmentation degree. Nat. Hazards Earth Syst. Sci. 2005, 5, 621–632. [Google Scholar] [CrossRef]
  20. Hungr, O.; Evans, S.G.; Hazzard, J. Magnitude and frequency of rock falls and rock slides along the main transportation corridors of southwestern British Columbia. Can. Geotech. J. 1999, 36, 224–238. [Google Scholar] [CrossRef]
  21. Rak, G.; Zupančič, G.; Papež, J.; Kozelj, D. Production of hazard, vulnerability and risk maps in the event of avalanches and rockfalls for a section of the Bohinj railway line. UJMA 2012, 26, 130–137. [Google Scholar]
  22. Guzzetti, F.; Reichenbach, P.; Ghigi, S. Rockfall hazard and risk assessment along a transportation corridor in the Nera valley, central Italy. Environ. Manag. 2004, 34, 191–208. [Google Scholar] [CrossRef]
  23. Stoffel, M.; Bollschweiler, M.; Butler, D.R.; Luckman, B.H. Tree Rings and Natural Hazards: An Introduction. In Tree rings and Natural Hazards. Advances in Global Change Research; Stoffel, M., Bollschweiler, M., Butler, D., Luckman, B., Eds.; Springer: Dordrecht International Publishing: Berlin, Germany, 2010; Volume 41, pp. 3–23. [Google Scholar]
  24. Trappmann, D.; Corona, C.; Stoffel, M. Rolling stones and tree rings. Prog. Phys. Geogr. Earth Environ. 2013, 37, 701–716. [Google Scholar] [CrossRef]
  25. Corona, C.; Lopez-Saez, J.; Favillier, A.; Mainieri, R.; Eckert, N.; Trappmann, D.; Stoffel, M.; Bourrier, F.; Berger, F. Modeling rockfall frequency and bounce height from three-dimensional simulation process models and growth disturbances in submontane broadleaved trees. Geomorphology 2017, 281, 66–77. [Google Scholar] [CrossRef]
  26. Favillier, A.; Mainieri, R.; Lopez-Saez, J.; Berger, F.; Stoffel, M.; Corona, C. Dendrogemorphic assessment of rockfall recurrence intervals at Saint Paul de Varces, Western French Alps. Géomophologie Relief Process. Environ. 2017, 23. [Google Scholar] [CrossRef]
  27. Schober, A.; Bannwart, C.; Keuschnig, M. Rockfall modelling in high alpine terrain—Validation and limitations/Steinschlagsimulation in hochalpinem Raum—Validierung und Limitationen. Geomech. Tunn. 2012, 5, 368–378. [Google Scholar] [CrossRef]
  28. Gomez, C.; Purdie, H. UAV-based Photogrammetry and Geocomputing for Hazards and Disaster Risk Monitoring—A Review. Geoenvironmental Disasters 2016, 3, 1–11. [Google Scholar] [CrossRef] [Green Version]
  29. Sarro, R.; Riquelme, A.; García-Davalillo, J.C.; Mateos, R.M.; Tomás, R.; Pastor, J.L.; Cano, M.; Herrera, G. Rockfall simulation based on UAV photogrammetry data obtained during an emergency declaration: Application at a cultural heritage site. Remote Sens. 2018, 10, 1923. [Google Scholar] [CrossRef] [Green Version]
  30. Saroglou, C.; Asteriou, P.; Zekkos, D.; Tsiambaos, G.; Clark, M.; Manousakis, J. UAV-based mapping, back analysis and trajectory modeling of a coseismic rockfall in Lefkada island, Greece. Nat. Hazards Earth Syst. Sci. 2018, 18, 321–333. [Google Scholar] [CrossRef] [Green Version]
  31. Vanneschi, C.; Camillo, M.D.; Aiello, E.; Bonciani, F.; Salvini, R. SFM-MVS photogrammetry for rockfall analysis and hazard assessment along the ancient roman via Flaminia road at the Furlo gorge (Italy). ISPRS Int. J. Geo-Inf. 2019, 8, 325. [Google Scholar] [CrossRef] [Green Version]
  32. Corò, D.; Galgaro, A.; Fontana, A.; Carton, A. A regional rockfall database: The Eastern Alps test site. Environ. Earth Sci. 2015, 74, 1731–1742. [Google Scholar] [CrossRef]
  33. Ferrari, F.; Giacomini, A.; Thoeni, K. Qualitative Rockfall Hazard Assessment: A Comprehensive Review of Current Practices. Rock Mech. Rock Eng. 2016, 49, 2865–2922. [Google Scholar] [CrossRef]
  34. Rupp, S.; Damm, B. A national rockfall dataset as a tool for analyzing the spatial and temporal rockfall occurrence in Germany. Earth Surf. Process. Landf. 2020, 45, 1528–1538. [Google Scholar] [CrossRef]
  35. Ruiz-Carulla, R.; Corominas, J.; Mavrouli, O. A methodology to obtain the block size distribution of fragmental rockfall deposits. Landslides 2015, 12, 815–825. [Google Scholar] [CrossRef] [Green Version]
  36. Marchelli, M.; De Biagi, V. Optimization methods for the evaluation of the parameters of a rockfall fractal fragmentation model. Landslides 2019, 16, 1385–1396. [Google Scholar] [CrossRef]
  37. Budetta, P.; De Luca, C.; Nappi, M. Quantitative rockfall risk assessment for an important road by means of the rockfall risk management (RO.MA.) method. Bull. Eng. Geol. Environ. 2016, 75, 1377–1397. [Google Scholar] [CrossRef]
  38. Copons, R.; Vilaplana, J.M.; Linares, R. Rockfall travel distance analysis by using empirical models (Solà d’Andorra la Vella, Central Pyrenees). Nat. Hazards Earth Syst. Sci. 2009, 9, 2107–2118. [Google Scholar] [CrossRef] [Green Version]
  39. De Biagi, V. Brief communication: Accuracy of the fallen blocks volume-frequency law. Nat. Hazards Earth Syst. Sci. 2017, 17, 1487–1492. [Google Scholar] [CrossRef] [Green Version]
  40. Marchelli, M.; De Biagi, V.; Peila, D. Reliability-Based Design of Protection Net Fences: Influence of Rockfall Uncertainties through a Statistical Analysis. Geosciences 2020, 10, 280. [Google Scholar] [CrossRef]
  41. Zhu, Y.; Zhu, H.; Yu, J.; Cao, J.; Ni, L. Towards truthful mechanisms for mobile crowdsourcing with dynamic smartphones. In Proceedings of the 34th International Conference on Distributed Computer Systems, Madrid, Spain, 30 June–3 July 2014; pp. 11–20. [Google Scholar]
  42. Howe, J. The rise of crowdsourcing. Wired Mag. 2006, 14, 1–4. [Google Scholar]
  43. Meissen, U.; Fuchs-Kittowski, F. Crowdsourcing in Early Warning Systems. In Proceedings of the International Environmental Modelling and Software Society (iEMSs) 7th International Congress on Environmental Modelling and Software, San Diego, CA, USA, 15–19 June 2014; Volume 1, pp. 1–7. [Google Scholar]
  44. Bielski, C.; O’Brien, V.; Whitmore, C.; Ylinen, K.; Juga, I.; Nurmi, P.; Kilpinen, J.; Porras, I.; Sole, J.M.; Gamez, P.; et al. Coupling Early Warning Services, Crowdsourcing, and Modelling for Improved Decision Support and Wildfire Emergency Management. In Proceedings of the IEEE International Conference on Big Data (BIGDATA), Boston, MA, USA, 11–14 December 2017; pp. 217–230. [Google Scholar]
  45. See, L. A review of citizen science and crowdsourcing in applications of pluvial flooding. Front. Earth Sci. 2019, 7, 44. [Google Scholar] [CrossRef] [Green Version]
  46. Choi, C.C.; Cui, Y.; Zhou, G.G.D. Utilizing crowdsourcing to enhance the mitigation and management of landslides. Landslides 2018, 15, 1889–1899. [Google Scholar] [CrossRef]
  47. Olyazadeh, R.; Sudmeier-Rieux, K.; Jaboyedoff, M.; Derron, M.-H.; Devkota, S. An offline-online Web-GIS Android application for fast data acquisition of landslide hazard and risk. Nat. Hazards Earth Syst. Sci. 2017, 17, 549–561. [Google Scholar] [CrossRef] [Green Version]
  48. Kocaman, S.; Gokceoglu, C. A CitSci app for landslide data collection. Landslides 2019, 16, 611–615. [Google Scholar] [CrossRef]
  49. Juang, C.S.; Stanley, T.A.; Kirschbaum, D.B. Using citizen science to expand the global map of landslides: Introducing the cooperative open online landslide repository (COOLR). PLoS ONE 2019, 14, e0218657. [Google Scholar] [CrossRef] [PubMed] [Green Version]
  50. Chu, H.J.; Chen, Y.C. Crowdsourcing photograph locations for debris flow hot spot mapping. Nat. Hazards 2018, 90, 1259–1276. [Google Scholar] [CrossRef]
  51. Collector for ArcGIS, Esri. Available online: http://www.esri.com/products/collector-for-arcgis (accessed on 21 June 2020).
  52. Ancelin, P.; Barthelon, C.; Berger, F.; Cardew, M.; Chauvin, C.; Courbaud, B.; Descroix, L.; Dorren, L.; Fay, J.; Gaudry, P.; et al. Guide des Sylvicultures de Montagne Alpes du Nord. Françaises; Irstea: Publications Scientifiques et Tehniques; Gestion des territoires—CemOA: Paris, France, 2006; p. 289. [Google Scholar]
  53. ArcGIS for Desktop, Esri. Available online: http://desktop.arcgis.com/en/ (accessed on 23 July 2020).
  54. Heim, A. Bergsturz und Menschenleben. Beibl. Vierteljahrsschr. Nat. Ges. Zürich 1932, 20, 218. [Google Scholar]
  55. Jaboyedoff, M.; Labiouse, V. Technical Note: Preliminary estimation of rockfall runout zones. Nat. Hazards Earth Syst. Sci. 2011, 11, 819–828. [Google Scholar] [CrossRef] [Green Version]
  56. RockTheAlps—Alpine Forests Are Rock Stars! Interreg Alpine Space. Available online: https://www.alpine-space.eu/projects/rockthealps/en/home (accessed on 23 July 2020).
  57. University Grenoble Alpes—Zoning of Plant Life in the Mountains. 2018. Available online: https://www.jardinalpindulautaret.fr/garden/exceptional-natural-environment/zoning-plant-life-mountains (accessed on 15 June 2018).
  58. EU-DEM v1.1—Copernicus. 2016. Available online: https://land.copernicus.eu/pan-european/satellite-derived-products/eu-dem/eu-dem-v1.1/view (accessed on 19 August 2019).
  59. Dorren, L.K.A. Rockyfor3D (v5.2) Revealed—Transparent Description of the Complete 3D Rockfall Model; EcorisQ Paper; EcorisQ-International Association: Geneva, Switzerland, 2016; p. 32. [Google Scholar]
  60. Formetta, G.; Capparelli, G.; Versace, P. Evaluating performance of simplified physically based models for shallow landslide susceptibility. Hydrol. Earth Syst. Sci. 2016, 20, 4585–4603. [Google Scholar] [CrossRef] [Green Version]
  61. Larcher, V.; Simoni, S.; Pasquazzo, R.; Strada, C.; Zampediro, G.; Berger, F. PARAmount: WP6 Guidelines, Rockfall and Forest Systems; PARAmount: Los Angeles, CA, USA, 2012; p. 84. [Google Scholar]
  62. SMARS; The Surveying and Mapping Authority of the Republic Slovenia. LiDAR Data in D96/TM Projection. 2014. Available online: http://gis.arso.gov.si/evode/profile.aspx?id=atlas_voda_Lidar@Arso (accessed on 19 August 2019).
  63. Basharat, M.; Rohn, J. Effects on travel distance of mass movements trigged by the 2005 Kashmir earthquake, in the Northeast Himalayas of Pakistan. Nat. Hazards 2015, 77, 273–292. [Google Scholar] [CrossRef]
  64. Saas, O.; Oberlechner, M. Is climate causing increased rockfall frequency in Austria. Nat. Hazards Earth Syst. Sci. 2012, 12, 3209–3216. [Google Scholar] [CrossRef]
  65. Delonca, A.; Gunzburger, Y.; Verdel, T. Statistical correlation between meteorological and rockfall databases. Nat. Hazards Earth Syst. Sci. 2014, 14, 1953–1964. [Google Scholar] [CrossRef] [Green Version]
  66. D’Amato, J.; Hantz, D.; Guerin, A.; Jaboyedoff, M.; Baillet, L.; Mariscal, A. Influence of meteorological factors on rockfall occurrence in a middle mountain limestone cliff. Nat. Hazards Earth Syst. Sci. 2016, 16, 719–735. [Google Scholar] [CrossRef] [Green Version]
  67. Paranunzio, R.; Laio, F.; Chiarle, M.; Nigrelli, G.; Guzzetti, F. Climate anomalies associated with the occurance of rockfalls at high-elevation in the Italian Alps. Nat. Hazards Earth Syst. Sci. 2016, 16, 2085–2106. [Google Scholar] [CrossRef] [Green Version]
  68. Pratt, C.; Macciotta, R.; Hendry, M. Quantitative relationship between weather seasonality and rock fall occurrences north Hope, BC, Canada. Bull. Eng. Geol. Environ. 2019, 78, 3239–3251. [Google Scholar] [CrossRef]
  69. Duarte Menéndez, R.; Marquínez, J. The influence of environmental and lithologic factors on rockfall at a regional scale: An evaluation using GIS. Geomorphology 2002, 43, 117–136. [Google Scholar] [CrossRef]
  70. Borella, J.; Quigley, M.; Krauss, Z.; Lincoln, K.; Attanayake, J.; Stamp, L.; Lanman, H.; Levine, S.; Hampton, S.; Gravley, D. Geologic and geomorphic controls on rockfall hazard: How well do past rockfalls predict future distributions? Nat. Hazards Earth Syst. Sci. 2019, 19, 2249–2280. [Google Scholar] [CrossRef] [Green Version]
  71. Saroglou, C. GIS-Based Rockfall Susceptibility Zoning in Greece. Geosciences 2019, 9, 163. [Google Scholar] [CrossRef] [Green Version]
  72. Berger, F.; Dorren, L.; Kleemayr, K.; Maier, B.; Planinsek, S.; Bigot, C.; Bourrier, F.; Jancke, O.; Toe, D.; Cerbu, G. Eco-Engineering and Protection Forest Against Rockfalls and Snow Avalanches; Cerbu, G., Ed.; InTech: London, UK, 2013; pp. 191–210. [Google Scholar]
  73. Dupire, S.; Bourrier, F.; Monnet, J.-M.; Bigot, S.; Borginet, L.; Berger, F.; Curt, T. Novel quantitative indicators to characterize the protective effect of mountain forests against rockfall. Ecol. Indic. 2016, 67, 98–107. [Google Scholar] [CrossRef] [Green Version]
  74. Moos, C.; Dorren, L.; Stoffel, M. Quantifying the effect of forests on frequency and intensity of rockfalls. Nat. Hazards Earth Syst. Sci. 2017, 17, 291–304. [Google Scholar] [CrossRef] [Green Version]
  75. Lanfranconi, C.; Sala, G.; Frattini, P.; Crosta, G.B.; Valagussa, A. Assessing rockfall protection efficiency of forest at the regional scale. Landslides 2020. [Google Scholar] [CrossRef]
  76. Schlögel, R.; Kofler, C.; Gariano, S.L.; Van Campenhout, J.; Plummer, S. Changes in climate patterns and their association to natural hazard distribution in South Tyrol (Eastern Italian Alps). Sci. Rep. 2020, 10, 5022. [Google Scholar] [CrossRef] [Green Version]
Figure 1. The methodological framework for collecting past rockfall events and calculating rockfall propagation statistics.
Ijgi 09 00514 g001
Figure 2. Logical representation of rockfall data collection: Step 1—concept of defining rockfall source area and deposit areas in the field; Step 2—mobile application Collector for ArcGIS interface (left—entering data for source area, middle—the list of recorded rockfall deposits, right—the collected features presented on the Web Map, red dot- source point, green points—deposit points); Step 3—data that are being collected with the Collector for ArcGIS are being stored to the cloud-based database on the ArcGIS Online Server. With that they are also synchronised with existing web rockfall database (after the field work). Collected data are then directly visualised in the WebGIS Platform as a Web Map that enables displaying, analysing and querying of stored data in the cloud.
Ijgi 09 00514 g002
Figure 3. Model of the rockfall database showing a simplified construction of data within the mobile application. An individual rockfall source area is represented by a single record in the Rockfall_source table and can be related to multiple number of Rockfall_deposit records. Both tables show the possible attributes that can be collected by each feature. Categorical attributes source_type, forest_info, rock_shape, and stop_cause can only be chosen based on the pre-defined classes from the drop-down menus.
Ijgi 09 00514 g003
Figure 4. Conceptual model of calculating an actual rockfall source area point and energy line angles using the energy line angle (ELA) tool. Input data include the location of a field collected rockfall source area, corresponding deposits (calculation performed per rockfall), and a digital terrain model (DTM). Based on the angle and azimuth measurements towards the actual source area, the actual location is calculated using the viewshed analysis. Based on the location of an actual rockfall source area and locations of corresponding rockfall deposits, the distance between individual pairs is calculated which is further used for calculation of energy line angles (together with the change in altitude).
Ijgi 09 00514 g004
Figure 5. The main feature of the WebGIS is a Web Map showing past rockfall events (red dot—rockfall source area, green dot—rockfall deposit). The lower part of the Web Map is built from three elements: a short description of the purpose of the database (left), the number of recorded rockfalls sites (middle) and rockfall deposits (right). The number of recorded rockfall sites and deposits changes with the changed scale of the Web Map and the number is adjusted to the number of records that can be observed on the changed Web Map extent. A navigation pane is located in the upper left corner and it includes the following elements: the information of the Web Map, a layer list, statistics about the data, basemap options, and download section.
Ijgi 09 00514 g005
Figure 6. Pop-up window with attributes of either rockfall source or deposit area. If the feature has an attachment one can open and view the attached pictures.
Ijgi 09 00514 g006
Figure 7. Available statistics about both features (source and deposit area). The statistics can be calculated for the whole Web Map extent or for a spatially limited area that can either be chosen with a different spatial extent of the Web Map or by using a user-defined area (e.g., spatial selection via point, line, or polygon).
Ijgi 09 00514 g007
Figure 8. Energy line angles (°) for rockfall deposits in the Alpine Space.
Ijgi 09 00514 g008
Figure 9. Statistics for (a) rockfall sources and (b) rockfall deposits, located within each vegetation and altitudinal zone in the Alpine Space.
Ijgi 09 00514 g009
Figure 10. The tested rockfalls are located in the north-western part of Slovenia, in the Julian Alps, near the Italian–Austrian border.
Ijgi 09 00514 g010
Figure 11. (a) Orthophoto image of the Krnica rockfall and (b) results of rockfall modelling with the CONEFALL model using different energy line angles and lateral angles.
Ijgi 09 00514 g011
Figure 12. (a) Orthophoto image of the Trenta rockfall and (b) results of rockfall modelling with Rockyfor3D model with marked locations of outline rockfall deposits.
Ijgi 09 00514 g012
Figure 13. Scatter plot showing correlation between the rock deposit volumes (m3) and energy line angles (°).
Ijgi 09 00514 g013
Table 1. Evaluation of the models performances with goodness-of-fit (GOF) indices for (a) the rockfall in Krnica by using the CONEFALL model, and (b) the rockfall in Trenta by using Rockyfor3D model. Both indices have values ranging from 0 to 1 with the optimal value being 1.
(a) Rockfall Krnica
energy line angle, lateral angle
Average Index (AI)Success Index (SI)
32°, ±160.780.89
43°, ±190.920.98
43°, ±250.880.97
(b) Rockfall Trenta0.900.93

