Article

Assessing the Governance Context Support for Creating a Pluvial Flood Risk Map with Climate Change Scenarios: The Flemish Subnational Case

by
Cesar Casiano Flores
* and
Joep Crompvoets
KU Leuven, Public Governance Institute, 3000 Leuven, Belgium
*
Author to whom correspondence should be addressed.
ISPRS Int. J. Geo-Inf. 2020, 9(7), 460; https://doi.org/10.3390/ijgi9070460
Submission received: 27 May 2020 / Revised: 3 July 2020 / Accepted: 15 July 2020 / Published: 21 July 2020

Abstract

:
Climate change has increased pluvial flood risks in cities around the world. To mitigate floods, pluvial risk maps with climate change scenarios have been developed to help major urban areas adapt to a changing climate. In some cases, subnational governments have played a key role to develop these maps. However, governance research about the role of subnational governments in geospatial data development in urban water transitions has received little attention. To address this gap, this research applies the Governance Assessment Tool as an evaluative framework to increase our understanding of the governance factors that support the development of pluvial flood risk maps at the subnational level. For this research, we selected the region of Flanders in Belgium. This region is considered among the frontrunners when it comes to the creation of a pluvial flood risk map with climate change scenarios. Data have been collected through in-depth interviews with steering committee actors involved in the development process of the map. The research identified that the current governance context is supportive of the creation of the flood risk map. The government of Flanders plays a key role in this process. The most supportive qualities of the governance context are those related to the degree of fragmentation (extent and coherence), while the less supportive ones are those related to the “quest for control” (flexibility and intensity). Under this governance context, government actors play the primary role. The Flemish government led the maps’ creation process and it was supported by the lower governmental levels. As the provincial government was an important actor to increase local participation, collaboration with private and non-governmental actors in the steering committee was more limited. The financial resources were also limited and the process required a continuous development of trust. Yet, the Flemish Environmental Agency, with the use of technology, was able to increase such trust during the process.

1. Introduction

Floods cause billions of euros of damage every year and due to climate change, their impact might increase [1]. In Western Europe, temperature could increase between 1.5 °C and 7 °C by the end of the century. This change in temperature might increase precipitation during winter to up to 30% by 2100 [2,3]. This change in precipitation patterns is expected to increase floods frequency and severity [4], estimating damages in Europe to reach 23.5 billion EUR by 2050 [5]. In Europe, ‘fluvial floods’, caused by overflowing rivers, have received important attention, while ‘pluvial floods’, caused in urban areas by extreme rainfall events, have been rarely studied [6]. In the case of Belgium, for example, by 2016, Flanders had only been reporting fluvial floods to the European Commission [7]. Although fluvial floods tend to be more devastating and impressive, their frequency is lower than pluvial floods [6]. Over time, the damage of pluvial floods is similar to fluvial floods [8]. Pluvial effects are expected to affect, to a high degree, the Northern region of Europe [9], and together with other factors, such as land subsidence [10,11], high level of urbanization [12], inadequate infrastructure [13], and inadequate drainage design [14], can increase the effects of pluvial floods. In Belgium, the high percentage of paved and built-up areas decreases the capacity of rainwater infiltration [15]. Actually, cities in Belgium have already struggled more with floods caused by pluvial events rather than tidal causes [16]. Specifically in Flanders, when considering both fluvial and pluvial floods with climate change effects, pluvial floods have a dominant impact and by 2100, it is expected that pluvial floods will damage 2.5 times more buildings, among the most affected being the cities of Antwerp, Gent, Brugge, Leuven, and Kortrijk [7]. These negative consequences of pluvial floods have favored the development of new strategies from the government. Among them, the development of pluvial flood risk maps, legislation based on those maps, and the construction of blue-green infrastructure to decrease negative impacts [17].
These approaches, including the adjustment of new guidelines for floods with climate change scenarios, are recent. Norway, the United Kingdom, Germany, and Belgium are among the first countries in Europe to apply them. Germany and Belgium are among the few cases where changes have been made at the subnational level [9]. Subnational levels are those governmental levels between the local and national levels [18]. The EU’s multi-level system has favored a strong subnational governance dimension that is under-researched [19]. Recent research has identified that subnational levels play a relevant role in environmental transitions and climate adaptation [19,20]. Hence, it could be expected that more subnational governments follow the Belgian and German path to contextualize European directives and to provide lower governmental levels, with tools that can support their climate adaptation.
Climate change adaptation requires strategic investments to deliver sustainable solutions in the long-term [21]. The type of adaptation depends on the cultural, technological, economic, and governance contexts [22]. Therefore, an effective governance system plays a key role when transitioning to a more climate change resilient state [23]. This governance system should support collaboration among different actors due to the complex nature of climate change projects. The implementation of these projects can be more effective if there is proper planning. Geospatial Data (GD) can play a key role to support this transition, as it facilitates urban planning, land administration, and risk management [24]. Availability of GD related to flood risk management can play a crucial role for flood protection [25], can support the development of effective strategies to address key global challenges such as climate change [26], and can be key to optimize interventions by comparing “flood susceptibility” through the comparison of different scenarios [27]. However, GD establishment, sustainable usage, and maintenance face numerous governance challenges. GD itself is becoming key for modern governance as it requires guaranteed access to data by various stakeholders, which has resulted in the creation of GD services with structures that govern data sharing and coordination [28]. Therefore, GD is no longer seen as a technological activity only. It deals with a large number of organizations, institutions and legal factors that are part of a governance context [29,30]. GD has a complex structure and is characterized by a high level of heterogeneity in data formats and models. Therefore, GD processes still require improvement including GD access, harmonization, and analysis [25]. Under these governance challenges, GD is becoming very relevant. For example, the Infrastructure for Spatial Data Information in Europe (INSPIRE) initiative aims to establish GD to support community environmental policies to impact on the environment [25].
Digital flood risk maps are GD and they integrate hydrological, environmental, topographical, and cadastral data; their availability can help to improve protection measures against floods [25]. Modeling maps faces not only technical issues; it also requires a high level of expertise, cultural, and historical understanding of modeling, as well as knowledge of the legislation, including intellectual property rights [30]. This complexity makes the contextualization of models very relevant.
At the international level, different maps have been developed to show possible flood impacts with climate change scenarios. Some examples are the Global Flood Map [31] or the FM Global Flood Map [32]. Those maps present different scenarios depending on the type of flood model and the algorithms used. At the European and national levels, maps presenting flood risk areas are more common now when comparing to a decade ago [33]. Currently, Germany, the Netherlands, and the United Kingdom are good examples of countries that have developed such maps. At the local level, there are also important cases. For example, cities in the Scandinavian region employ maps developed by SCALGO to identify critical flood risk areas, considering climate change effects to plan new infrastructure and urban development [34]. Another example in the same vein is SINTEF, who has developed GIS-based tools [35]. However, many cities in Europe lack the capacity to access these tools. Most of the cities in Europe with climate change adaptation and mitigation plans (17%) are rich cities located in the North part [36], being the Nordic cities among the leaders [20].
It is under this context that subnational governments can play an important role. At the subnational level, maps with information about future flood areas due to climate change are still not common. However, recent reforms regarding climate governance in Europe have shifted authority and competences from national and local governments to subnational governments [20]. When considering the development of pluvial flood risk maps with climate change scenarios, the maps created by subnational governments can offer a higher degree of contextualization than national maps and they can be a supportive tool for cities that do not have the resources to develop such maps. In this sense, maps created by subnational governments can become relevant [37] and can play a key role in the urban water management transition of cities. Subnational governments are closer to local governments than national governments, and they can provide a more integral vision at the basin level than local governments, due to their territorial jurisdiction.
In the urban water transitions literature, the relevance of subnational governments for GD is understudied, while in the environmental governance literature, there are already some studies [19,38,39]. Meanwhile, water governance studies have focused mainly on decentralization and river basin approaches [40]. Studies that focus on subnational governments’ role are important because subnational levels are taking responsibilities from federal and local governments in environmental areas [18,41]. An example in Europe is Flanders, where flood policy has experienced a recentralization at the regional level, which overtook the steering role from the federal level, becoming the main policy entrepreneur [42].
Relevant literature on GD governance has been developed [43]; it has focused on network analysis [44] and the integration of spatial planning and flood risk management [30,45]. However, less attention has been paid to the impact of coordination efforts on the process of sharing GD with different users [46]. In general, studies of GD from a governance perspective are rare [47,48], as well as studies of the impact of GD on spatial planning from both an integral and a multi-level governance perspective [30].
Acknowledging gaps in the literature of subnational governments’ role in urban water transitions and GD governance literature specifically on pluvial flood maps, this paper aims to contribute to the scholarly understanding of the governance factors that support the creation of GD by analyzing the collaborative efforts of the process of sharing and developing GD in the steering committee that participated in the development of the pluvial flood risk map. Within this background, we have posed the following question: How does the governance context support and hinder the creation of the pluvial flood risk map developed by the subnational government? To answer this question, we selected as a case study the pluvial flood risk map with climate change scenarios developed by the Flemish government. By providing more information regarding the future impacts of pluvial floods, the Flemish authorities expect that the map can help cities to plan and build blue-green infrastructure to advance their climate change adaptation. We believe that this article can also contribute, in general terms, to the sustainability transition literature, which requires more research that can support theoretical developments through case studies [49].
This article is divided into six sections. The next section explains the theoretical framework that was employed for this study. This is followed by a description of our case of study. After this description, we present the results of our governance assessment, then, we discuss the results, and finally, we present the conclusions.

2. Materials and Methods

This section is divided into three subsections. The first subsection explains the theoretical framework we used for our governance assessment, the second subsection explains our data collection, and the third subsection describes the case of study.

2.1. Theoretical Framework

To understand the governance factors that supported the creation of the pluvial flood risk map with climate change scenarios, we employed the Governance Assessment Tool (GAT) and analyzed the interaction of the actors in the steering committee. The GAT aims to contribute to the literature of governance in the implementation phase. Both the implementation of regulations from a governance perspective [50] and the relation between science, policy, and implementation [51] have received little attention. The GAT takes into consideration contextual factors, as other frameworks do [50,52,53,54,55], since there is no single type of governance system that can be applied to all sustainability problems [56]. Examples of similar frameworks are Fit-For-Purpose [57] and its derivative frameworks such as the Fit-for-purpose Governance Assessment Framework [58], the Land Governance Assessment Framework [59], the Governance Capacity Framework [51], the Social-Ecological System Framework [60], the Management and Transition Framework [61], and the OECD multi-level governance [62].
The GAT applies a systematization process as a way of sorting through complexity, allowing a framework for practitioners to consider the context and dynamics of their particular settings [63]. The GAT has an institutional approach with contextual considerations [64]. Therefore, GAT can be considered as a context-sensitive framework that is part of the academic response to “panacea” or “universal remedy” frameworks [65]. The GAT has already proven strengths in understanding Western European governance contexts of water and climate change resilience projects [66,67,68,69]. It has also been used by researchers to create an online tool for policymakers in urban water transition projects [70]. The GAT has been created in a European context, has a solid theoretical background [55], since it is based on the Contextual Interaction Theory [71], and sees governance as a context for decision-making and implementation. Therefore, governance can be supportive or restrictive for those implementation processes. Governance here considers five dimensions [64] and these are:
Levels and Scales: refers to the multi-level governance character.
Actors and Networks: refers to the multi-actor character of the issue at stake.
Problem perceptions and Goal ambitions: refers to the multi-faceted character of problems and objectives.
Strategies and instruments: refers to the multiplicity of strategies and instruments that can be employed by the involved actors.
Resources and responsibilities: refers to the multiple resources required for the implementation.
These governance dimensions, together with the qualities of extent, coherence, flexibility, and intensity, assess how supportive the governance context is for the implementation of the policy under study. The four qualities are [64]:
Extent: refers to the inclusiveness of all the elements in the governance dimensions that are relevant and should be considered.
Coherence: refers to the supporting or contradictory character between the different governance dimensions.
Flexibility: refers to the adaptive character of the governance elements to facilitate different strategies that favor the implementation.
Intensity: refers to the degree of support in the elements that constitute the governance context to urge the required changes.
The combination of the five dimensions of governance and the four qualities makes the GAT ‘matrix’ model [71]. See Table 1 below.
The governance literature has emphasized the relevance of including different stakeholders. Currently, complex institutional systems are fragmented due to a lack of overall coordination [72]. One way to decrease coordination is through ‘interactive forms of governance’, meaning the involvement of stakeholders in the decision-making process [73]. This interactive governance requires integration across policy sectors and among different levels [74]. In order to have a better understanding of how the governance context supports integration among the actors, we will assess the governance context analyzing the interaction of the actors in the steering committee, considering the four qualities of the GAT. Many governance structures tend to be fragmented because they have been naturally evolved to include more actors, but there is a lack of coherence [75]. In other words, policy failures can occur due to the lack of elements that should be considered and due to the lack of connection among those elements [76]. Table 1 above presents the relation among the five governance dimensions and the four governance qualities according to GAT. Table 2 shows how Table 1 has been operationalized to assess the restriction or support of the governance factors in the creation of the pluvial flood risk map with climate change scenarios. This type of operationalization presented in Table 2 has been carried out in previous academic research [38,58,77].

2.2. Data Collection

To assess each element of Table 2, this research selected, as an in-depth case study, the steering committee that participated in the map developed by the Flemish government. Case studies help to complement theory and allow generalizations of theoretical prepositions [78]. In-depth case studies can increase our understanding of the sustainability transition dynamics, the creation and enrichment of transition theories and frameworks, and reveal barriers to sustainable transitions [49]. Actually, case studies are a pillar of transition studies and they enhance the explanatory capacity of transition frameworks [49].
The GAT permits a systematic analysis of the governance context by assessing each relationship between the governance dimension and the governance quality individually. To do so, we conducted six interviews with five key stakeholders that were part of the steering committee. Two interviews were with VMM officials in order to have a more comprehensive understanding of the map creation process. The steering committee members were actively participating in the climate change map project from May 2018 to December 2019. Interviews took place between November 2019 and February 2020 and each one lasted between one and two hours, with an average time of one hour and a half. Table 3 shows the affiliation of the interviewees.
The interview consisted of 32 semi-structured questions that aimed to understand the governance factors that supported and hindered the creation of the pluvial flood risk map with climate change scenarios. The questionnaire was based on the GAT (see Table 1 and Table 2) and was divided into 6 sections. Section 1—General context about the creation of the map; Section 2—Collaboration of the different governmental levels during the creation process; Section 3—Collaboration between governmental and non-governmental actors during the creation process; Section 4—Agreements and disagreements between the different actors, considering their perceptions and goals; Section 5—Availability and use of the different policy instruments that could support or hinder the creation process; Section 6—Responsibilities and instruments available and employed by the different actors to support the process.
Based on the interviewees’ answers, each evaluative quality is assessed individually. For each cell, we analyzed first the individual answer and then, we compared it with the rest of the stakeholders’ answers to reach a general conclusion. Secondary sources, such as previous research on the topic [7,28] as well as European [79] and legal documents [80], were used to confirm or complement the information gathered during the interviews. The results are considered reliable, since the interviewees reported in similar and complementary ways. This type of assessment complies with previous GAT applications [38,68,77]. Table 2 above presents the range of conditions within each cell to be assessed from low to high. Within this range, the qualities can be assessed as Low, Low-moderate, Moderate, Moderate-high or High.

2.3. Case of Study

Due to the interest in the role of subnational governments in environmental transitions and based on the insights from the INTERREG project called “Water Sensitive Cities: The Answer To Challenges of Extreme Weather Events” (CATCH 2017-2020) [81], the subnational government of Flanders was selected as an ideal setting to assess GD created at the subnational level. In the Belgian GD context, regional governments play a key role. Previous research has characterized Belgium from a governance perspective as an interesting case of study that has a dual federal structure composed of the federal state and three subnational regions (Brussels capital, Flemish region, and Walloon region) [28]. The regional governments are currently in charge of territorial policies, including urban development, environmental policy [28], and flood protection. Under the regional government, there are 10 provinces (also a subnational government) and 589 communities [28]. In terms of flood risk maps, Belgium has designated seven units of management and each unit has a Flood Risk Management Plan [79].
Flood mapping is part of the measures taken by the Flemish government to meet the requirements of the European Flood and Water Framework Directives. The Directive requires the member states to provide information about the source of flooding to the European Commission [7]. It also requires the members’ states “to assess its territory for significant risk from flooding, to map the flood extent, identify the potential adverse consequences of future floods for human health, the environment, cultural heritage and economic activity in these areas, and to take adequate and coordinated measures to reduce this flood risk” [79]. In general, the Floods Directive has helped to improve flood risk information [82]. The new maps have been the replacement of the first-generation flood maps from 2000, which had important shortcomings. There was a lack of calculation of overland flow paths, the resolution of 5m was limiting the use of a parcel-scale, and there was a lack of regional information regarding the flood extent [7].
For Flanders, the Flemish Integrated Commission on Water Management (CIW) submits the pluvial information to the European Commission. Figure 1 below shows the availability of data regarding pluvial and fluvial flood risks that is reported to the European Commission. The floods of 2016 and their large impact in Flanders, including payments by the Disaster Fund exceeding 500 million EUR, reinforced the need to create the pluvial flood risk maps [7]. The VMM officials believe that the pluvial flood risk map in the climate portal can support the adaptation of Flemish cities to climate change. At the moment of the interviews, the map was still not part of a legal instrument. However, this process is under negotiation, since many important flood policy instruments rely on maps. Some examples are the water assessment and the flood information in real estate transactions in the region of Flanders [7]. The water assessment requires advice from the water manager on the impact of a permit, plan or program on the water system [42]. At the same time, the “duty to inform” instrument requires the dissemination of information regarding the vulnerability to flooding in every real estate transaction [82].
Hence, the regional government plays a key role in terms of flood risk policy and the development of the maps, including pluvial flood risks. Considering this role, since 2016, the Flemish government has led the creation of high-quality maps regarding pluvial flood risks with climate change scenarios via the Environmental Agency (VMM). In order to strengthen the role of the Flemish government, the region of Flanders has undergone reforms in the last decade to increase the capacities of the region in water management and spatial planning. The 2014 reform allowed municipalities to transfer competencies for their watercourses to the provinces [42]. These reforms have helped to decrease fragmentation in water management and spatial planning [42].
In September 2018, the Flemish government released a public map in the climate portal to show climate change-induced flood risk areas by 2100. Figure 2 below shows this information. However governmental actors have continued their development and they can access more detailed information. The information is at a parcel scale on a resolution of 2m; this makes it useful for advisory purposes to issue development permits and to provide legal information for the general public [7].
The interviews with Flemish officials confirmed that the release of this map was also a complex process. Flemish officials consider that as a result of their continuous efforts, the current models are more accurate than those developed by their neighboring countries. The VMM expects that this map can support lower administrative levels to plan and to create strategies that support the adaptation of the cities to climate change. However, this impact is not straight forward, one of the reasons being the high level of uncertainty that flood risk estimations imply [85] and the different capacities of the local governments.
According to the interviews, the VMM officials were inspired to create the map by similar maps developed in England. In 2016, the VMM commissioned a study on 2D pluvial flood modeling and the tests were carried out near the cities of Brussels and Antwerp. The positive results were followed by an extra project, which was commissioned in early 2017, to create a regional pluvial flood map at the end of the same year. This project included return periods of 2, 10, 25, 100, and 1000 years [7]. The project has used several open-source tools and included a simulation of 102 sub-models for all the return periods, incorporating climate in the year 2100. Through the use of the online platform at www.vlagg.be, the Flemish government engaged over 150 Flemish municipalities as well as dozens of river managers and road managers. The high resolution of the 2016 map increased the precision and allowed for the reduction in the pluvial flooding area in 56%, when compared with the 2013 map reported to the European Commission [7]. In this engagement process, the municipalities and sewer managers, among other actors, continued providing feedback to the VMM by marking a positive, negative or neutral score to specific highlighted areas of the map. This feedback helped to improve the quality of the map [7]. More information about the technical aspects of the map collaboration process can be found in Cauwenberghs 2018 [7] and the technical methodology is explained in the document named: Format flood hazards and flood risk maps methodology (Opmaak OverstromingsGevaar en overstromingsRisicoKaarten Methodologie) [86].
The last efforts on the map project took place between 2018 and 2019, with the steering committee being part of it. In this last process, the revision of the map continued and it took between two and three months. During this time, some provincial governments, such as Limburg, played a very active role and visited Flemish municipalities to invite them to provide online feedback on the flood risk maps via an online platform. In order to solve some disagreements or to corroborate the development of the model, the agency hired a company that deploys drones within two hours after heavy rains to mark flooded areas. At the same time, they also compared flood risk models developed in large cities, such as Antwerp, with the VMM map. According to the VMM officials, the European Commission is very satisfied with the current quality of the maps. The following section will present the results of the governance assessment based on the GAT application.

3. Results of the Assessment and Discussion

This section presents the assessment results of the selected case of study, Flanders. These results are displayed considering each governance quality. Therefore, the presentation order is 4.1 extent, 4.2 coherence, 4.3 flexibility, and 4.4 intensity. At the end of this section, we present, in Table 4, the results in a summarized manner.

3.1. Extent

3.1.1. Levels and Scales

Moderate-high: Most relevant actors are involved. The majority of the interviewed actors participated in the process between 2018 and 2019. For this process, various actors were invited by the VMM to follow the project. In the end, the steering committee had representations from the province and municipal governments as well as sewage companies. Some provincial governments encouraged municipal governments to participate in the online process developed by the regional government to provide feedback about the map. In some cases, provincial governments were visiting the municipalities to check the maps with them and to provide the feedback online. Provincial governments consider that if they had not proceeded in this way, the participation of the municipalities would have been lower.

3.1.2. Actors and Networks

Moderate: there is a cross-sectorial collaboration mainly among governmental actors. Relevant governmental actors were involved. Besides the governmental actors, the sewage companies also actively participated in the feedback. There was no participation of non-governmental actors, such as universities or non-governmental organizations, in the steering committee. Currently, the Integrated Water Policy Coordination created a consultation platform that supports the integration process of the policy. There is information available on https://www.integraalwaterbeleid.be/.

3.1.3. Problem Perspectives and Goal Ambitions

Moderate-high: Most of the perspectives of relevant actors are considered. Different perspectives were considered. According to the different interviewed actors, the VMM officials considered the majority of the feedback that they received, although there were some discussions on the methodology that was being used for the creation of the maps. The revision process was important to obtain more information in a bottom-up manner. In this sense, this part of the process was considered as more involving than the previous one, which was perceived as a top-down approach of the VMM. Within the steering committee, the different actors were able to reach agreements.

3.1.4. Strategies and Instruments

Moderate-high: Innovative strategies, including pilots, are considered and implemented by most relevant actors. The creation of the map has been mainly a technical process led and coordinated by the VMM. The interviewed actors mentioned that the agreements always considered a long-term scope. The VMM also adopted technologies such as open-source tools and pilots that took into account a long-term scope. In fact, the creation process evolved naturally from small pilots near the cities of Gent and Antwerp to the introduction of new technologies such as drones and broader stakeholder participation.

3.1.5. Responsibilities and Resources

Moderate-high: The relevant actors have clearly assigned responsibilities and the required, although limited, resources. Responsibilities and resources are clearly assigned. In this case, the VMM took the lead and included more actors as the process evolved. The provinces played a key role to support the engagement of the municipal actors to take part in the process and to provide feedback. Yet, in general, the actors considered that the mapping budget was tight, and more personnel would be beneficial for the municipalities.

3.2. Coherence

3.2.1. Levels and Scales

Moderate-high: Most of the relevant government levels work together and trust each other. According to the interviews, the different governmental levels who participated in the process were working together. Although there were important discussions regarding the models employed in the creation of the map, the interviewed actors agreed that the creation of the map was not affected by political factors. Yet, there were some trust issues regarding how reliable the map can be. In order to increase trust with the municipalities, when possible, the VMM employed drones to reassure the municipalities about its models by contrasting the drone images of floods with the model developed. This action, according to the VMM officials, has increased the trust of the municipalities on the map. Nevertheless, officials are aware that one of the most important challenges will come when the governments try to implement the map, mainly with the aspects related to the water assessment.

3.2.2. Actors and Networks

Moderate: Collaboration is institutionalized, it is stable and there is trust among the actors, being most of them governmental actors. Most of the actors belong to the governmental network. Among the few relevant private actors who participated in the steering committee were the sewage companies from Gent and Antwerp. The members of the steering committee considered that there was trust within the committee. According to some of the interviewed actors, the fact that the steering committee was mostly limited to government officials prevented the other interests from affecting the process.

3.2.3. Problem Perspectives and Goal Ambitions

Moderate-high: Most of the perspectives of relevant actors support each other. The existence of the steering committee made it possible to hear the opinion of different actors and to engage them in the process more directly. The opinions were in its majority constructive, supportive of the process, and helped to improve the maps. Although there were some disagreements related to the technical aspects of the model, in some cases, due to time or budget constraints, the actors realized that certain observations were not possible to implement. For example, the inclusion of existing sewage models. Yet, it is important to highlight that not all cities have such models. Considering this variety of situations, agreements were reached, and some actors were willing to accept the limitations. In the end, the participants considered the maps useful, as they can be an important tool for planning in medium or small size cities that do not have their maps. They also agreed on their goal, which was to produce a good map.

3.2.4. Strategies and Instruments

High: The strategies and instruments do not present overlaps or conflicts. The strategies and instruments related to the creation of the maps do not face overlaps or conflicts that could affect the development process. Actually, the closest example of overlap is found in those cities that have already developed similar maps, such as Antwerp. However, according to the interviews, instead of being perceived as a problem, existing maps have been considered by the different actors as an opportunity to compare their models in order to improve them.

3.2.5. Responsibilities and Resources

Moderate-high: Most relevant actors can combine their resources. Since the creation of the maps is a VMM project, the only institution that directly funded the project was the Flemish government. Yet, some actors have supported the process with their own resources. An example is the provinces who used their resources to visit and support municipalities. Some provinces considered that they would have liked to have more resources for such visits. Municipalities, water boards, and sewage companies also supported the process by appointing some of their personnel to provide the feedback requested by the VMM. Yet, some of the interviewees reported that for some municipalities, this process was complicated, since they did not have enough personnel and, in some cases, they were not properly trained. Although the budget limitations can be seen as a negative aspect, the fact that the rest of the actors understood this situation also helped in some cases to reach agreements.

3.3. Flexibility

3.3.1. Levels and Scales

Low-moderate: It is not possible to move up and down levels, but the regional government has shown openness. It is not possible that lower or higher levels take the lead. The lower governmental levels only act as supporters of the regional government. In this sense, the relationship is hierarchical and the VMM plays the leading role. Yet, it is important to highlight that the VMM has encouraged the participation of other governmental levels.

3.3.2. Actors and Networks

Moderate: It is possible to include new actors. However, it is not possible to shift leadership or to create social capital. It is possible to include different actors in the steering committee. However, during the process, there were no significant changes in the involved actors. The inclusion of actors responds to the interest and capacities of the invited actors. Participation in the steering committee was stable. According to the interviews, the actors who were at the beginning of the process were at the end. However, due to the relevant role played by the governmental actors and limited participation of non-governmental actors, the creation of social capital is limited.

3.3.3. Problem Perspectives and Goal Ambitions

Moderate: Only some specific aspects can be reassessed. The steering committee and the feedback process permitted to assess the map within the boundaries set by the VMM. Within these boundaries, it was possible to make adjustments to the map. The goal of the project was also set by the VMM.

3.3.4. Strategies and Instruments

Moderate-high: There are some limitations to combine different strategies and instruments. There are limited opportunities to combine instruments and strategies. The strategy followed was set by the VMM. In this sense, there are restrictions in the process, one of them being the lack of possibility to integrate local models. Yet, the strategies employed can play an important role in the future, such as the use of open-source tools or the creation of a platform where other actors can provide feedback.

3.3.5. Responsibilities and Resources

Moderate: It is possible to pool resources but not the responsibility. It is possible to contribute with different resources and the VMM is the actor responsible for the project. However, the current strategy tends to take place in a context where the different actors act voluntarily. While this situation demonstrates the commitment of the different actors to collaborate, it also shows that willingness plays an important role.

3.4. Intensity

3.4.1. Levels and Scales

Moderate: The regional and some lower levels have promoted the creation of the map. The governmental level that has played the most active role to promote the creation of the map is the Flemish government through the VMM. They also promote its use and expect that the map will play an important role in climate change adaptation strategy, for example, in relation to other policy instruments that can directly depend on the map, such as the water assessment and the plan and development of blue-green infrastructure. Independently from the Flemish government, frontrunner cities such as Antwerp have been developing their maps.

3.4.2. Actors and Networks

Moderate: There is a limited and fragmented coalition of actors promoting similar innovations. The private actors such as the sewage companies were important, but they did not play the main role in the map creation process or its use. The main role belongs to the governmental actors and more specifically, to the VMM. Due to the revision process, now, more government actors at the lower levels are aware of the map. Yet, as mentioned before, cities such as Antwerp are promoting similar innovations.

3.4.3. Problem Perspectives and Goal Ambitions

Moderate: Some important changes are needed to include more perspectives that favor the project goal. Due to the feedback and participation of the different actors, the final version of the map has had many improvements. In this sense, it is possible to say that the objective of creating good maps has benefited from the collaboration process. Yet, some technical changes that can allow more comprehensive participation are pending. This includes sewage companies’ models.

3.4.4. Strategies and Instruments

Moderate-high: The strategies and instruments are appropriate to reach the objective but there is still room for improvement. In general, the interviewed actors agree with the strategies and instruments that are being used by the VMM, such as the drones and the possibility to provide feedback on the model via online. However, some actors had liked to have the possibility of including existing models at the local level.

3.4.5. Responsibilities and Resources

Moderate: The actors consider that the resources are tight. There are important financial limitations. Budgets are tight at the three levels of government. At the regional level, it limits the options that they can consider or bring to the table to improve the process. At the provincial level, having more resources could have supported the visits to municipalities. Meanwhile, at the municipal level, there were limited resources to invest in revising the map. Table 4 below summarizes the results of our governance assessment. The results are discussed in the next section.

4. Discussion of Results

When looking at the governance dimension of Levels and Scales, our assessment shows that the three governmental levels (regional, provincial, and municipal) were involved in the process. Although it was a collaborative process, it is also important to mention that due to the primary role that the regional government plays, the process still corresponded to a top-down approach, as the quality of flexibility shows. Yet, the regional government has been open enough to invite and involve lower government levels and to strengthen trust. Two important examples are the platform that allowed the municipalities and other governmental actors to provide feedback and the use of drones. This case confirmed previous research that has characterized the governance of GD in the Flemish region as a mixture of hierarchy and network governance [28]. Other aspects worth highlighting are that the government actors were allowed to work together in the steering committee without the influence of political factors that could jeopardize the final results. The active participation of provincial governments helped to increase local participation. In addition, the participation of frontrunner cities such as Antwerp and Gent was considered positive.
In terms of Actors and Networks, it seems that the main actors belong to the governmental network. This level of participation has been enough to produce maps that met the expectation of the European Commission, according to the VMM. It seems that the limited role of private actors and the lack of non-governmental actors in the process might not be a problem in this particular case. However, this diminishes the possibilities of creating social capital. While in this particular context, this does not seem to really hinder the process, it can be more relevant in other contexts where there are fewer resources or capacities. A higher involvement of academic, private, and non-governmental actors could be key to create social capital and to deliver the expected outcome. One example of this is the creation of GD in sub-Saharan countries [58].
When we look at the Problem perspectives and Goal ambitions, we can realize different perspectives are taken into account. While the steering committee allows direct participation where actors can freely provide their opinion, the online platform allowed a high level of participation and direct feedback from the different actors. Yet, it took time to reach this level of participation and it was led by the VMM. As the interviewed actors mentioned, the creation process was mainly top-down at the beginning, which later evolved into a more bottom-up process. One of the reasons for this might be the strategy of the VMM to secure the development of the project in a short time frame, which later could be refined with the collaboration of more actors. Additionally, in some cases, certain perspectives could not be considered due to technological or financial limitations. However, it is important to highlight that the actors shared a common goal. This common goal seems to have played an important role to reach agreements and to be pragmatic. Yet, considering that the maps will be reviewed every six years, it is important to continue developing the channels or platforms that facilitate the incorporation of the different perspectives.
In terms of the Strategies and Instruments, we can see that the strategy was directed by the VMM. The different actors involved in the process acknowledge and support the use of open sources to develop a map. This strategy can have an important impact by facilitating the participation of different actors now and in the long-term. The use of open-source tools has been considered among the best and more sustainable practices when developing GD [87]. It is also very interesting to see how in the Flemish context, the development of maps at the municipal level is seen as a positive aspect by both governmental levels. Both governmental levels take it as an opportunity to share their experiences in order to improve their models. At the same time, this comparison provides lessons that can be applied to other cases in the region where there are no such maps. In the same vein, the use of drones to increase trust appears to have had a positive effect. Previous studies have identified that “a history of successful past cooperation can create social capital and high levels of trust that produce a virtuous cycle of collaboration” [52].
Regarding the Responsibilities and Resources dimension, we can see that the collaboration between the different governmental levels creates a positive impact. The lead of the regional levels is respected and supported by the lower levels. While the provincial level played a key role to incentivize the participation of the municipal level, the municipal level engaged in the process and helped to increase the quality of the map. Each level assumed its role in a positive manner. However, the willingness of the actors is crucial. More resources could be considered in order to strengthen this relationship. For example, the possibility of integrating more accurate models of cities who are frontrunners could help to increase the quality of the map developed by the regional government. In this sense, there is still a challenge regarding data harmonization. Similarly, more economic resources to train government officials who are not familiar with the development of the maps could help to decrease the gap between municipalities and support a sustainable process. This becomes even more relevant, since the objective is to review and update the map every six years.

5. Conclusions

The analysis of the interactions in the steering committee allowed us to conduct a governance assessment focused on the collaborative efforts of the process of sharing and developing GD and on the role of subnational governments in GD development. By addressing these gaps, this research has contributed to the scholarly understanding of the governance factors that support the creation of GD in the Flemish context. To reach this objective, we asked the following research question: How does the governance context support and hinder the creation of the pluvial flood risk map developed by the subnational government?
Based on the results in Table 4, this research found that the governance context supported the creation of the pluvial flood risk map through the four evaluative qualities. However, the degree of support provided by each quality had variation. The most supportive qualities of the governance context were extent and coherence and the least supportive were flexibility and intensity. A supportive governance context requires a high extent and high coherence [88]. A high coherence means that all governance dimensions are supporting and strengthening each other, while a high extent means that there is a complete governance structure where all relevant uses and users are part of the process [88]. In this sense, we consider that the Flemish governance system has been successful to decrease fragmentation through the different reforms that were implemented. These reforms took place in recent years to increase coherence and collaboration regarding GD management in Flanders [28]. There has been an important integration among governmental actors.
The qualities of flexibility and intensity are related to the “quest for control” dilemma, focused on distrust or uncertainty against the “learning by doing approach”, which is based on trust and understanding [89]. Through our research, we identified that the Flemish governance context for GD is under this “quest for control” transition. This finding corroborates recent studies that identified a similar situation in terms of hierarchy, network, and market [28]. Based on our results, we can conclude that the governance context still responds mainly to a hierarchical and top-down approach. Such situation hinders the participation of local levels, mainly those whose capacities and resources could enrich the map development further. For example, if the VMM had developed the map involving frontrunner cities and their sewage companies since the beginning, early involvement might have helped to include local maps into the VMM map. However, on one side, this could have slowed the process. On the other side, this situation also shows the challenge regarding the heterogeneity in data formats and models.
Intensity is important to achieve the intended objective of the project and it also indicates the degree needed to move away from “business as usual” practices [89]. From our results, we can conclude that in the steering committee, collaboration is limited. A broader involvement of private and non-governmental actors in the future could be a possibility to increase social capital. This is relevant considering the limitation of financial resources. Whilst at the regional level a “learning by doing” approach seems well developed, the inclusion of other actors in this dynamic is still pending. The composition of the steering committee exemplifies the limits of participation. While the Flemish government was open for participation in the committee, the actors who attended were mainly those that were not only interested but also had the capacity to attend to those meetings. These meetings require specialized personnel who have the means to attend. Therefore, it is mainly the frontrunners or “rich cities” who participate; in this regard, it is not surprising that Antwerp was in the committee.
It is also important to point out that the creation of the portal by the Flemish government allowed lower governmental levels to be able to provide feedback to the developed map and this was a key factor to increase the precision. However, in order to increase participation, a deeper involvement of the other subnational government was required—the provincial level. The interviewed actors agree that the creation of the committee helped to increase the quality of the map. Taking into consideration this experience and considering governance as a social function with a social purpose [90], we can determine that the transition to polycentric governance still requires a shift towards more balanced modes. This is a relevant aspect, as recent research has shown that success in European Union climate governance depends not only on the member states, but on cities and subnational actions, meaning a shift towards a polycentric network [20].
The case study demonstrates that the subnational government can play a key role to favor the collaboration between the different governmental levels and to develop tools for climate adaptation. The case in Flanders also helps to exemplify the role that subnational governments can play to contextualize European directives. The subnational governments play a relevant role when local levels lack capacity, and they can contextualize local needs [38] by promoting platforms that encourage collaboration mechanisms that can be tailored considering local needs.
Subnational governments can also provide a larger regional vision than local governments due to their territorial capacities and can facilitate tools that can support lower governmental levels in their sustainable transition. In the words of an interviewed actor, “the maps are mainly important for the small municipalities”. This statement is aligned with recent research that has identified medium and small size cities in terms of climate governance dependent on subnational governments [20]. It also confirms that fewer local governments have the capacity to develop pluvial flood maps with climate change scenarios. While in Nordic countries or in the Netherlands, some local governments have such capacity, the large majority of small and medium size cities in Europe do not. This is important, since research has identified that the role of subnational governments in Europe regarding climate change governance is becoming more relevant. Therefore, the participation of the subnational governments can be key to provide tools that can support the transition of small and medium cities. In this sense, the Flemish case provides an example that can be considered by European governments in countries where territorial planning competencies are entrusted to subnational entities, such as regions or autonomous communities [91]. Among these countries are Spain, Italy, and France [91].
Yet, some challenges still require further studies, such as the adoption of the maps by small and medium size cities in urban development, and to plan and develop blue-green infrastructure projects is to be seen. Some issues regarding data harmonization are still present, while the development of trust needs to be continued. Therefore, we recommend future research to focus on how to address those challenges and on assessing the impact of this map in terms of planning and climate change adaptation projects at the municipal level. We also recommend similar studies in more hierarchical and more polycentric governance contexts in order to have a deeper understanding of the role of the governance context in the creation of GD. This could be in contexts where there is not a steering committee or where committees have the capacity to be more inclusive.

Author Contributions

Writing—Original Draft Preparation, Cesar Casiano Flores; Writing—Review and Editing, Joep Crompvoets. All authors have read and agreed to the published version of the manuscript.

Funding

KU Leuven Postdoctoral Mandate PDM/18/051.

Acknowledgments

We express our gratitude to KU Leuven for supporting this research through a Postdoctoral Mandate (PDM) grant. We also would like to thank officials from the Flanders Environmental Agency (VMM), Bram Vogels and Kris Cauwenberghs; their support was key to contact the members of the steering committee. We also want to thank the interviewed actors and the reviewers whose comments have improved the quality of our article. The interviewed actors did not have any involvement in the study design, analysis, interpretation of the data, writing of the article and in the decision to submit the article for publication.

Conflicts of Interest

The authors declare no conflict of interest.

References

  1. Ward, P.J.; Jongman, B.; Aerts, J.C.J.H.; Bates, P.D.; Botzen, W.J.W.; DIaz Loaiza, A.; Hallegatte, S.; Kind, J.M.; Kwadijk, J.; Scussolini, P.; et al. A global framework for future costs and benefits of river-flood protection in urban areas. Nat. Clim. Chang. 2017, 7, 642–646. [Google Scholar] [CrossRef]
  2. OECD. Water and Climate Change Adaptation: Policies to Navigate Uncharted Waters; OECD Publishing: Paris, France, 2013. [Google Scholar]
  3. Roudier, P.; Andersson, J.C.M.; Donnelly, C.; Feyen, L.; Greuell, W.; Ludwig, F. Projections of future floods and hydrological droughts in Europe under a + 2 °C global warming. Clim. Chang. 2016, 135, 341–355. [Google Scholar] [CrossRef] [Green Version]
  4. Zhou, Q.; Mikkelsen, P.S.; Halsnæs, K.; Arnbjerg-Nielsen, K. Framework for economic pluvial flood risk assessment considering climate change effects and adaptation benefits. J. Hydrol. 2012, 414–415, 539–549. [Google Scholar] [CrossRef]
  5. Interreg 2 Seas Mers Zeeën Short Term Adaptation for Long Term Resilience to Climate Change. Available online: https://www.interreg2seas.eu/en/star2cs (accessed on 3 November 2018).
  6. Van Ootegem, L.; Verhofstadt, E.; Van Herck, K.; Creten, T. Multivariate pluvial flood damage models. Environ. Impact Assess. Rev. 2015, 54, 91–100. [Google Scholar] [CrossRef]
  7. Cauwenberghs, K.; Feyaerts, T.; Hunter, N.; Dewelde, J.; Vansteenkiste, T.; Huybrighs, M.; Vaes, G.; Berry, R. Collaborative development of high resolution pluvial flood maps for flanders. In Proceedings of the HIC 2018, 13th International Conference on Hydroinformatics, Palermo, Italy, 1–6 July 2018; pp. 381–388. [Google Scholar]
  8. Veldhuis, J.A.E. How the choice of flood damage metrics influences urban flood risk assessment. J. Flood Risk Manag. 2011, 4, 281–287. [Google Scholar] [CrossRef] [Green Version]
  9. Madsen, H.; Lawrence, D.; Lang, M.; Martinkova, M.; Kjeldsen, T.R. Review of trend analysis and climate change projections of extreme precipitation and floods in Europe. J. Hydrol. 2014, 519, 3634–3650. [Google Scholar] [CrossRef] [Green Version]
  10. Yin, J.; Yu, D.; Wilby, R. Modelling the impact of land subsidence on urban pluvial flooding: A case study of downtown Shanghai, China. Sci. Total Environ. 2016, 544, 744–753. [Google Scholar] [CrossRef] [PubMed]
  11. Diaz-Nieto, J.; Lerner, D.N.; Saul, A.J.; Blanksby, J. GIS Water-balance approach to support surface water flood-risk management. J. Hydrol. Eng. 2012, 17, 55–67. [Google Scholar] [CrossRef] [Green Version]
  12. Kellens, W.; Vanneuville, W.; Verfaillie, E.; Meire, E.; Deckers, P.; De Maeyer, P. Flood Risk management in flanders: Past Developments and future challenges. Water Resour. Manag. 2013, 27, 3585–3606. [Google Scholar] [CrossRef] [Green Version]
  13. Akter, T.; Quevauviller, P.; Eisenreich, S.J.; Vaes, G. Impacts of climate and land use changes on flood risk management for the Schijn River, Belgium. Environ. Sci. Policy 2018, 89, 163–175. [Google Scholar] [CrossRef]
  14. Willems, P. Revision of urban drainage design rules after assessment of climate change impacts on precipitation extremes at Uccle, Belgium. J. Hydrol. 2013, 496, 166–177. [Google Scholar] [CrossRef]
  15. Raadgever, G.T.; Booister, N.; Steenstra, M.K. The Relevance of Flood Risk Management and Governance. In Flood Risk Management Strategies and Governance; Springer International Publishing: Cham, Switzerland, 2018; pp. 85–92. [Google Scholar]
  16. Mees, H.; Suykens, C.; Beyers, J.-C.; Crabbé, A.; Delvaux, B.; Deketelaere, K. Analysing and Evaluating Flood Risk Governance in Belgium: Dealing with Flood Risks in an Urbanised and Institutionally Complex Country; STAR-FLOOD Consortium Publisher, Utrecht University Repository: Utrecht, The Netherlands, 2016. [Google Scholar]
  17. Brears, R.C. Blue and Green Cities: The Role of Blue-green Infrastructure in Managing Urban Water Resources; Palgrave Macmillan: London, UK, 2018; ISBN 9781349959181. [Google Scholar]
  18. Van den Brande, K.; Bruyninckx, H.; Happaerts, S. Introduction. In Sustainable Development and Subnational Governments Policy-Making and Multi-Level Interactions; Bruyninckx, H., Happaerts, S., van den Brande, K., Eds.; Palgrave Macmillan: Basingstoke, UK, 2012; pp. 1–24. ISBN 9781349347865. [Google Scholar]
  19. Jänicke, M.; Wurzel, R.K.W. Leadership and lesson-drawing in the European Union’s multilevel climate governance system. Environ. Polit. 2019, 28, 22–42. [Google Scholar] [CrossRef]
  20. Kern, K. Cities as leaders in EU multilevel climate governance: Embedded upscaling of local experiments in Europe. Environ. Polit. 2019, 28, 125–145. [Google Scholar] [CrossRef]
  21. Brown, R.; Keath, N.; Wong, T. Transitioning to water sensitive cities: Historical, current and future transition states. In Proceedings of the 11th International Conference on Urban Drainage, Edinburgh, Scotland, UK, 31 August–5 September 2008; pp. 1–10. [Google Scholar]
  22. Adger, W.N.; Arnell, N.W.; Tompkins, E.L. Successful adaptation to climate change across scales. Glob. Environ. Chang. 2005, 15, 77–86. [Google Scholar] [CrossRef]
  23. Rijke, J.; Farrelly, M.; Brown, R.; Zevenbergen, C. Configuring transformative governance to enhance resilient urban water systems. Environ. Sci. Policy 2013, 25, 62–72. [Google Scholar] [CrossRef]
  24. Wu, D.; Georgiadou, Y.; Kapur Keeble, O.; Bennett, R.; Brussel, M.; Lance, K.; Noort, M.; Sliuzas, R.; Verplanke, J.; van Westen, C. Geospatial Science and technology for development, With a Focus on Urban Development, Land Administration and Disaster Risk Management; UNCTAD: Geneva, Switzerland, 2012. [Google Scholar]
  25. Kliment, T.; Gálová, L.; Ďuračiová, R.; Fencík, R.; Kliment, M. Geospatial information relevant to the flood protection available on the mainstream web. Slovak J. Civ. Eng. 2014, 22, 9–18. [Google Scholar] [CrossRef] [Green Version]
  26. Crompvoets, J.; Ho, S. To Develop a Framework and Guidelines in Support of National Institutional Arrangements in Geospatial Information Management for Member States. United Nations Committee of Experts on Global Geospatial Information Management; UNECE: Geneva, Switzerland, 2017. [Google Scholar]
  27. Adnan, M.S.G.; Talchabhadel, R.; Nakagawa, H.; Hall, J.W. The potential of Tidal River Management for flood alleviation in South Western Bangladesh. Sci. Total Environ. 2020, 731, 138747. [Google Scholar] [CrossRef]
  28. Chantillon, M.; Crompvoets, J.; Peristeras, V. The Governance Landscape of Geospatial E-Services—The belgian case. ISPRS Int. J. Geo Inf. 2017, 6, 282. [Google Scholar] [CrossRef] [Green Version]
  29. Vandenbroucke, D.; Crompvoets, J.; Dessers, E.; Janssen, K.; Vancauwenberghe, G.; Vanhaverbeke, L. SDI at Work—The Flood Mapping Case; SPATIALIST: Leuven, Belgium, 2011. [Google Scholar]
  30. Ran, J.; Nedovic-Budic, Z. Integrating spatial planning and flood risk management: A new conceptual framework for the spatially integrated policy infrastructure. Comput. Environ. Urban. Syst. 2016, 57, 68–79. [Google Scholar] [CrossRef] [Green Version]
  31. Global Flood Map. Available online: http://globalfloodmap.org (accessed on 13 May 2020).
  32. FM Global Natural Hazards Map. Available online: https://www.fmglobal.com/research-and-resources/nathaz-toolkit/flood-map (accessed on 13 May 2020).
  33. de Moel, H.; van Alphen, J.; Aerts, J. Flood maps in Europe—Methods, availability and use. Nat. Hazards Earth Syst. Sci. 2009, 9, 289–301. [Google Scholar] [CrossRef] [Green Version]
  34. SCALGO Live Flood Risk. Available online: https://scalgo.com/en-US/live-flood-risk (accessed on 17 June 2020).
  35. SINTEF New Tool Shows Best Location for Blue-Green Infrastructure. Available online: https://www.sintef.no/en/latest-news/new-tool-shows-best-location-for-blue-green-infrastructure/ (accessed on 17 June 2020).
  36. Reckien, D.; Salvia, M.; Heidrich, O.; Church, J.M.; Pietrapertosa, F.; De Gregorio-Hurtado, S.; D′Alonzo, V.; Foley, A.; Simoes, S.G.; Krkoška Lorencová, E.; et al. How are cities planning to respond to climate change? Assessment of local climate plans from 885 cities in the EU-28. J. Clean. Prod. 2018, 191, 207–219. [Google Scholar] [CrossRef]
  37. Rajabifard, A.; Binns, A.; Masser, I.; Williamson, I. The role of sub-national government and the private sector in future spatial data infrastructures. Int. J. Geogr. Inf. Sci. 2006, 20, 727–741. [Google Scholar] [CrossRef] [Green Version]
  38. Casiano Flores, C.; Özerol, G.; Bressers, H.; Kuks, S.; Edelenbos, J.; Gleason, A. The state as a stimulator of wastewater treatment policy: A comparative assessment of three subnational cases in central Mexico. J. Environ. Policy Plan. 2019. [Google Scholar] [CrossRef]
  39. Happaerts, S.; Bruyninckx, H.; Van den Brande, K. The state of sustainable development: Perspectives from the subnational level. In Sustainable Development and Subnational Governments Policy-Making and Multi-Level Interactions; Bruyninckx, H., Happaerts, S., van den Brande, K., Eds.; Palgrave Macmillan: Basingstoke, UK, 2012; pp. 239–262. ISBN 9781349347865. [Google Scholar]
  40. Özerol, G.; Vinke-De Kruijf, J.; Briboise, M.; Casiano Flores, C.; Corentin, G.; Knieper, C.; Ortega, M.; Mirnezami, J.; Ranjan, P.; Schroeder, N.; et al. Comparative studies on water governance: A systematic review. Ecol. Soc. 2018, 23. [Google Scholar] [CrossRef] [Green Version]
  41. Lester, J.P.; Goggin, M.L. Back to the future: The rediscovery of implementation studies. Policy Curr. 1998, 8, 1–9. [Google Scholar]
  42. Mees, H.; Crabbé, A.; Suykens, C. Belgian flood risk governance: Explaining the dynamics within a fragmented governance arrangement. J. Flood Risk Manag. 2018, 11, 271–280. [Google Scholar] [CrossRef]
  43. Masser, I.; Rajabifard, A.; Williamson, I. Spatially enabling governments through SDI implementation. Int. J. Geogr. Inf. Sci. 2008, 22. [Google Scholar] [CrossRef]
  44. Vandenbroucke, D.; Crompvoets, J.; Vancauwenberghe, G.; Dessers, E.; Van Orshoven, J. A network perspective on spatial data infrastructures: Application to the sub-national SDI of flanders (Belgium). Trans. GIS 2009, 13, 105–122. [Google Scholar] [CrossRef]
  45. Saunders, W.; Kilvington, M. Innovative land use planning for natural hazard risk reduction: A consequence-driven approach from New Zealand. Int. J. Disaster Risk Reduct. 2016, 18. [Google Scholar] [CrossRef] [Green Version]
  46. Vancauwenberghe, G.; Dessers, E.; Crompvoets, J.; Vandenbroucke, D. Realizing data sharing: Open Government; Springer: New York, NY, USA, 2014; pp. 155–169. [Google Scholar]
  47. Sjoukema, J.; Bregt, A.; Crompvoets, J. Evolving spatial data infrastructures and the role of adaptive governance. Evol. Spat. Data Infrastruct. Role Adapt. Gov. 2017, 6, 254. [Google Scholar] [CrossRef] [Green Version]
  48. Crompvoets, J.; Vancauwenberghe, G.; Ho, S.; Masser, I.; de Vries, W. Governance of national spatial data infrastructures in Europe. Int. J. Spat. Data Infrastruct. Res. 2018, 13, 253–285. [Google Scholar] [CrossRef]
  49. de Haan, F.J.; Rogers, B.C.; Frantzeskaki, N.; Brown, R.R. Transitions through a lens of urban water. Environ. Innov. Soc. Transit. 2015, 15, 1–10. [Google Scholar] [CrossRef]
  50. Van Rijswick, M.; Edelenbos, J.; Hellegers, P.; Kok, M.; Kuks, S. Ten building blocks for sustainable water governance: An integrated method to assess the governance of water. Water Int. 2014, 39, 725–742. [Google Scholar] [CrossRef] [Green Version]
  51. Koop, S.H.A.; Koetsier, L.; Doornhof, A.; Reinstra, O.; Van Leeuwen, C.J.; Brouwer, S.; Dieperink, C.; Driessen, P.P.J. Assessing the governance capacity of cities to address challenges of water, waste, and climate change. Water Resour. Manag. 2017, 31, 3427–3443. [Google Scholar] [CrossRef] [Green Version]
  52. Ansell, C.; Gash, A. Collaborative governance in theory and practice. J. Public Adm. Res. Theory 2008, 18, 543–571. [Google Scholar] [CrossRef] [Green Version]
  53. Pahl-Wostl, C. A conceptual framework for analysing adaptive capacity and multi-level learning processes in resource governance regimes. Glob. Environ. Chang. 2009, 19, 354–365. [Google Scholar] [CrossRef]
  54. Thiel, A.; Egerton, C. Re-scaling of resource governance as institutional change: The case of water governance in Portugal. J. Environ. Plan. Manag. 2011, 54, 383–402. [Google Scholar] [CrossRef]
  55. Bressers, H.; Kuks, S. Water governance regimes: Dimensions and dynamics. Int. J. Water Gov. 2013, 1, 133–156. [Google Scholar] [CrossRef]
  56. Ostrom, E.; Janssen, M.; Anderies, J. Going beyond panaceas. Proc. Natl. Acad. Sci. USA 2007, 104, 15176–15178. [Google Scholar] [CrossRef] [PubMed] [Green Version]
  57. Enemark, S.; McLaren, R.; Lemmen, C.; Antonio, D.; Gitua, J. Scaling Up Responsible Land Governance: A Guide for Building Fit-for-Purpose Land Administration Systems in Less Developed Countries. In Proceedings of the World Bank Conference on Land and Poverty, Washington, DC, USA, 14–18 March 2016. [Google Scholar]
  58. Casiano Flores, C.; Tan, E.; Buntinx, I.; Crompvoets, J.; Stöcker, C.; Zevenbergen, J. Governance assessment of the UAVs implementation in Rwanda under the fit-for-purpose land administration approach. Land Use Policy 2020, 99, 104725. [Google Scholar] [CrossRef]
  59. World Bank Land Governance Assessment Framework/Welcome. Available online: http://web.worldbank.org/WBSITE/EXTERNAL/EXTDEC/EXTRESEARCH/EXTPROGRAMS/EXTARDR/EXTLGA/0,,contentMDK:23381112~pagePK:64168445~piPK:64168309~theSitePK:7630425,00.html (accessed on 3 September 2018).
  60. McGinnis, M.D.; Ostrom, E. Social-ecological system framework: Initial changes and continuing challenges. Ecol. Soc. 2014, 19, 30. [Google Scholar] [CrossRef] [Green Version]
  61. Pahl-Wostl, C.; Holtz, G.; Kastens, B.; Knieper, C. Analyzing complex water governance regimes: The management and transition framework. Environ. Sci. Policy 2010, 13, 571–581. [Google Scholar] [CrossRef]
  62. Akhmouch, A.; Correia, F.N. The 12 OECD principles on water governance—When science meets policy. Util. Policy 2016, 43, 14–20. [Google Scholar] [CrossRef]
  63. O′Toole, L.J. The theory–practice issue in policy implementation research. Public Adm. 2004, 82, 309–329. [Google Scholar] [CrossRef]
  64. Bressers, H.; Bressers, N.; Kuks, S.; Larrue, C. The governance assessment tool and its use. In Governance for Drought Resilience; Bressers, H., Bressers, N., Larrue, C., Eds.; Springer International Publishing: Cham, Switzerland, 2016; ISBN 978-3-319-29669-2. [Google Scholar]
  65. Pahl-Wostl, C. Water Governance in the Face of Global Change: From Understanding to Transformation; Springer: Berlin/Heidelberg, Germany, 2015. [Google Scholar]
  66. de Boer, C.; de Vinke Kruijf, J.; Özerol, G.; Bressers, H. Collaborative water resource management: What makes up a supportive governance system? Environ. Policy Gov. 2016, 26, 229–241. [Google Scholar] [CrossRef]
  67. Lordkipanidze, M.; Bressers, H.; Lulofs, K. Governance assessment of a protected area: The case of the Alde Feanen National Park. J. Environ. Plan. Manag. 2019, 62, 647–670. [Google Scholar] [CrossRef] [Green Version]
  68. Vikolainen, V.; Flikweert, J.; Bressers, H.; Lulofs, K. Governance context for coastal innovations in England: The case of sandscaping in North Norfolk. Ocean. Coast. Manag. 2017, 145, 82–93. [Google Scholar] [CrossRef]
  69. Lordkipanidze, M.; Bressers, H.; Lulofs, K. Comparative assessment of water governance in protected areas. Water 2020, 12, 740. [Google Scholar] [CrossRef] [Green Version]
  70. CATCH an Interreg North Sea Region; European Union “Water Sensitive Cities: The Answer to Challenges of Extreme Weather Events”. Available online: https://northsearegion.eu/catch/ (accessed on 13 January 2020).
  71. Bressers, H.; Bressers, N.; Browne, A.; Furusho, C.; Lajeunesse, I.; Larrue, C.; Özerol, G.; Ramos, M.-H.; Stein, U.; Tröltzsch, J.; et al. Benefit of Governance in Drought Adaptation: Governance Assessment Guide; Bressers, H., Bressers, N., Eds.; DROP Project European Union Publisher: Enschede, The Netherlands, 2015. [Google Scholar]
  72. Lubell, M. Collaborative partnerships in complex institutional systems. Curr. Opin. Environ. Sustain. 2015, 12, 41–47. [Google Scholar] [CrossRef]
  73. Edelenbos, J.; Van Meerkerk, I. Normative theory. In Handbook on Theories of Governance; Ansell, C., Torfing, J., Eds.; Edward Elgar Publishing: Cheltenham, UK, 2016; pp. 402–415. [Google Scholar]
  74. OECD. Policy Coherence for Sustainable Development 2019; OECD Publishing: Paris, France, 2019; ISBN 9789264445277. [Google Scholar]
  75. Bressers, H.; Kuks, S. Integrated Governance and Water Basin Management: Conditions for Regime Change Towards Sustainability; Kluwer Academic Publishers: London, UK, 2004. [Google Scholar]
  76. Pahl-Wostl, C.; Conca, K.; Kramer, A.; Maestu, J.; Schmidt, F. Missing links in global water governance: A processes-oriented analysis. Ecol. Soc. 2013, 18. [Google Scholar] [CrossRef] [Green Version]
  77. Casiano Flores, C.; Crompvoets, J.; Ibarraran Viniegra, M.E.; Farrelly, M. Governance assessment of the flood’s infrastructure policy in San Pedro Cholula, Mexico: Potential for a leapfrog to water sensitive. Sustainability 2019, 11, 7144. [Google Scholar] [CrossRef] [Green Version]
  78. Yin, R. Case Study Research: Design and Methods, 4th ed.; Sage Publications: Thousand Oaks, CA, USA, 2009; ISBN 9781412960991. [Google Scholar]
  79. European Commission. First Flood Risk Management Plans—Member State: Belgium. Report from the Commission to the European Parliament and the Council; European Commission: Brussels, Belgium, 2019. [Google Scholar]
  80. Coördinatiecommissie Integraal Waterbeleid Regelgeving. Available online: https://www.integraalwaterbeleid.be/nl/regelgeving (accessed on 4 February 2020).
  81. Özerol, G.; Dolman, N.; Bormann, H.; Bressers, H.; Lulofs, K.; Böge, M. Urban water management and climate change adaptation: A self-assessment study by seven midsize cities in the North Sea Region. Sustain. Cities Soc. 2020, 102066. [Google Scholar] [CrossRef]
  82. Pettersson, M.; van Rijswick, M.; Suykens, C.; Alexander, M.; Ek, K.; Priest, S. Assessing the legitimacy of flood risk governance arrangements in Europe: Insights from intra-country evaluations. Water Int. 2017, 42, 929–944. [Google Scholar] [CrossRef] [Green Version]
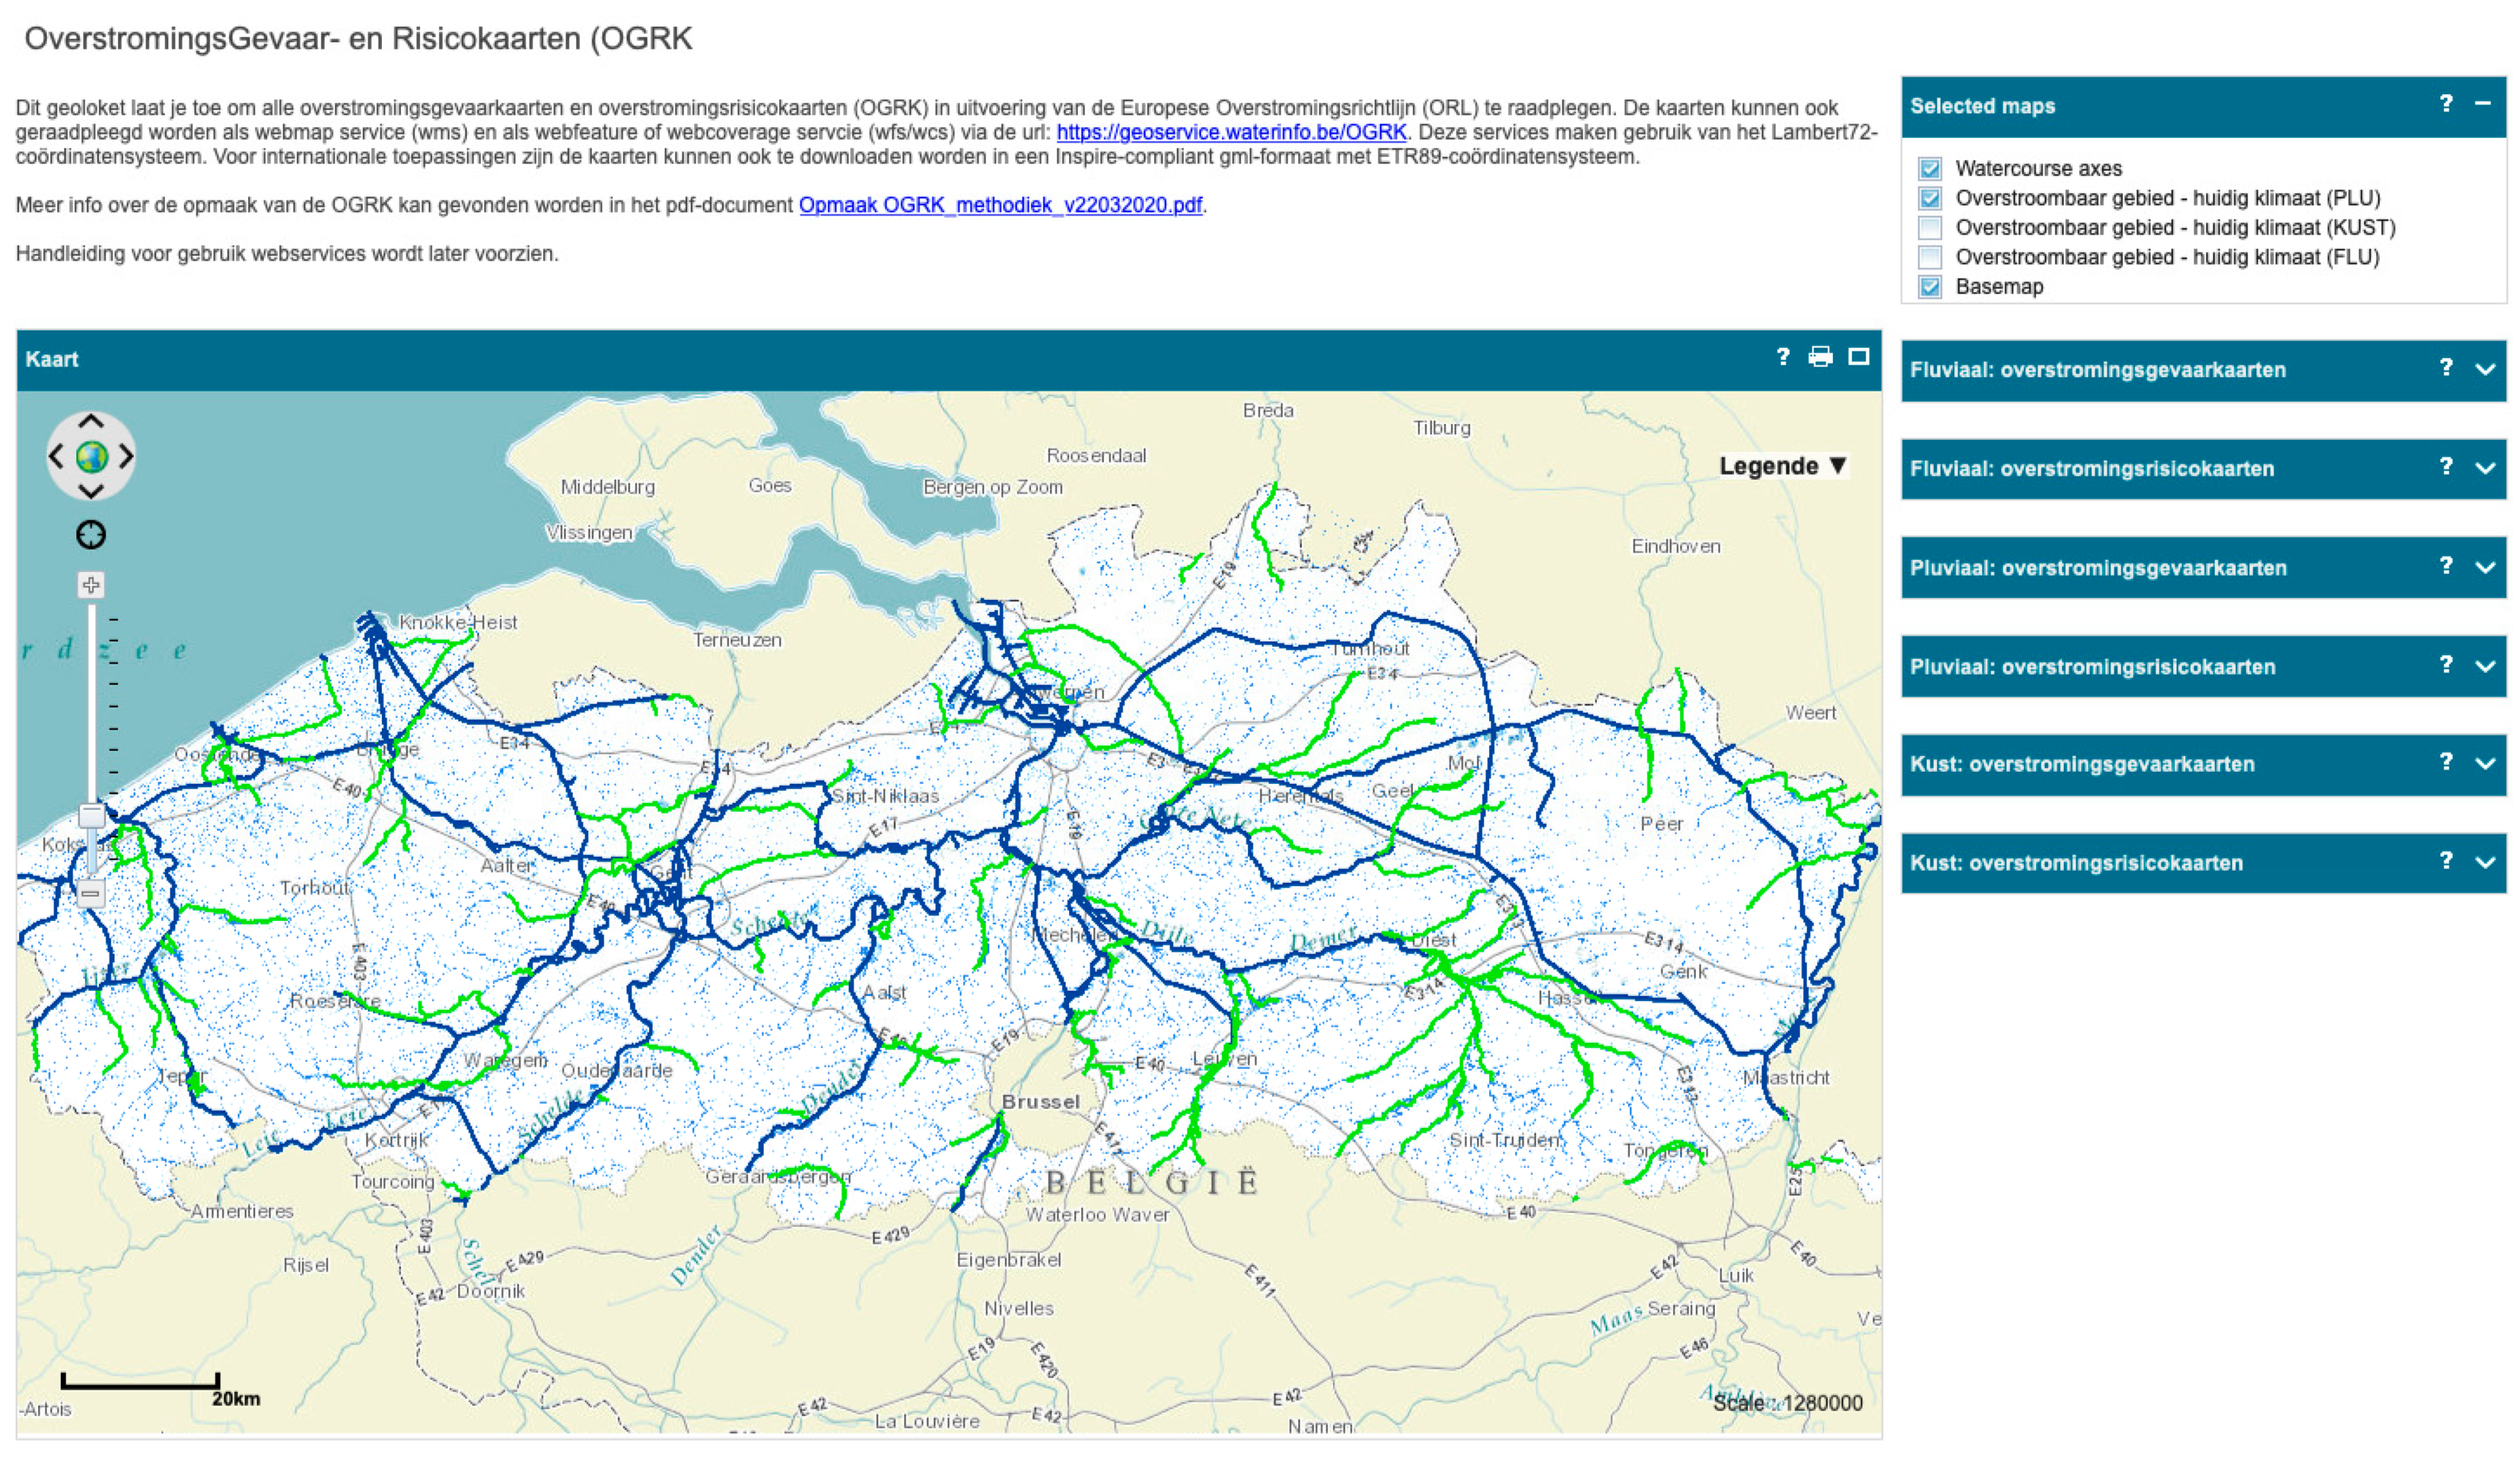
  83. Flemish Government OverstromingsGevaar-en Risicokaarten (OGRK). Available online: https://www.waterinfo.be/default.aspx?path=NL/Loketten/overstromingsrichtlijn (accessed on 22 June 2020).
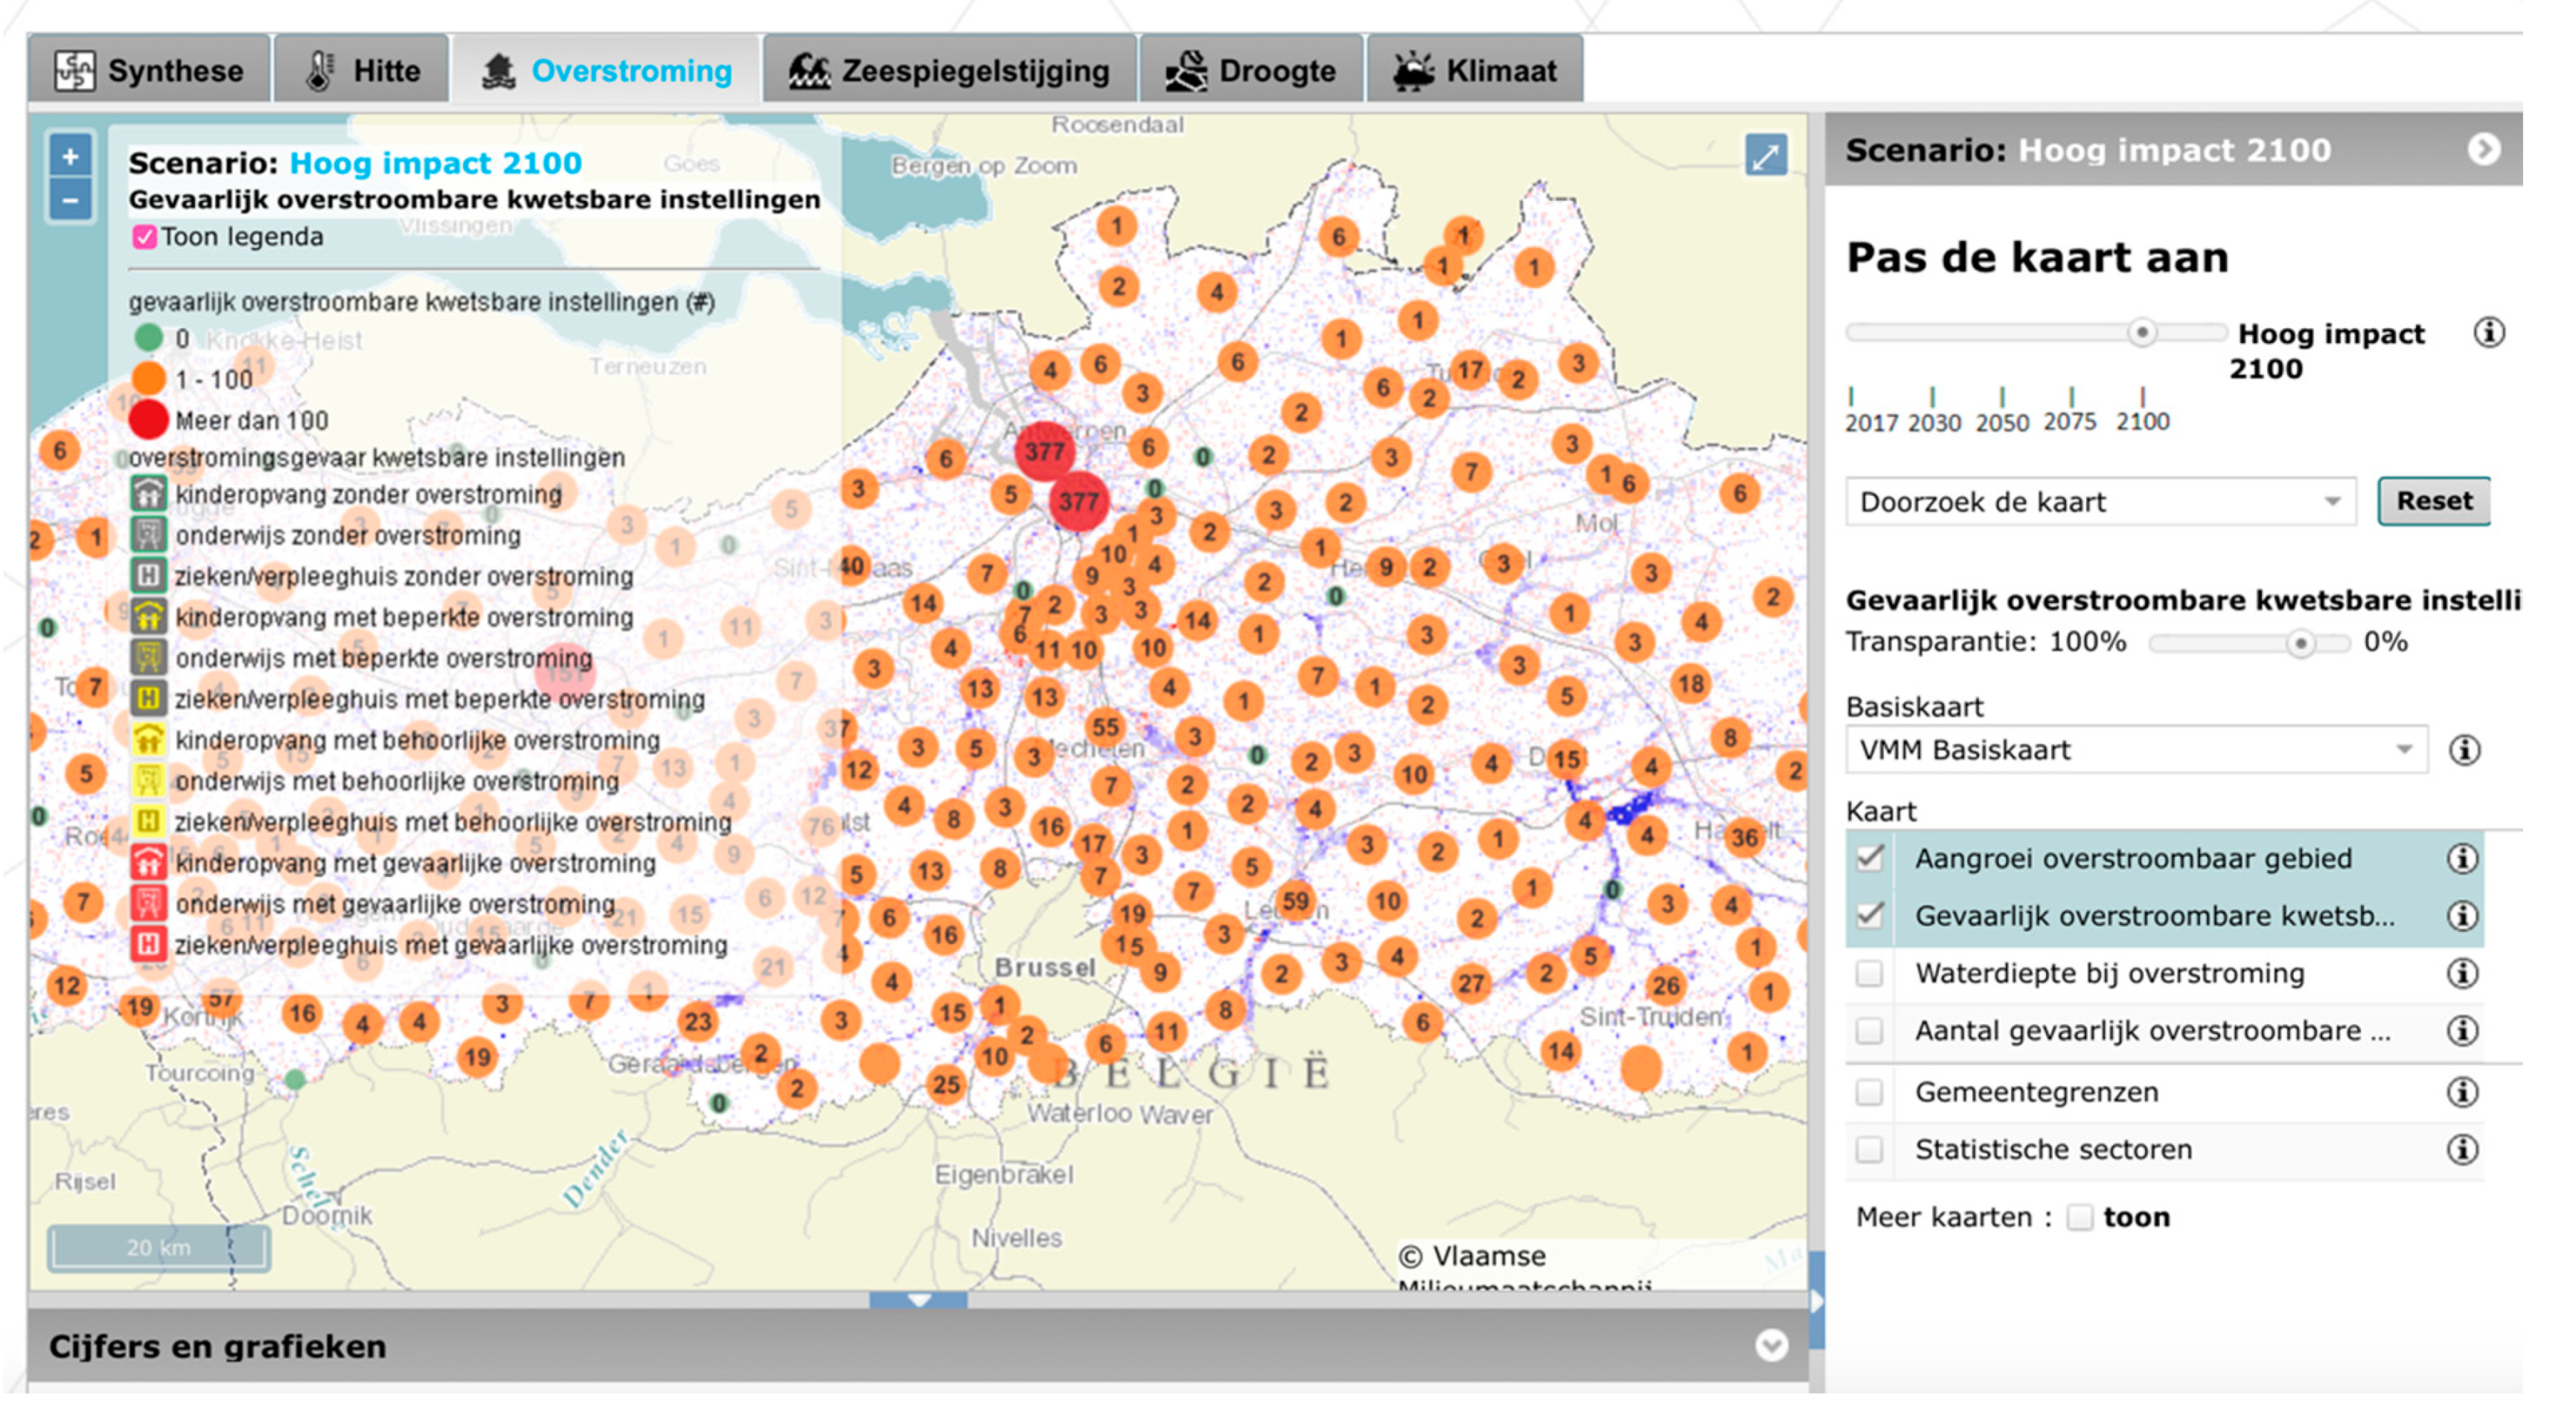
  84. VMM Scenario: Hoog Impact 2100. Available online: https://klimaat.vmm.be/kaartapplicatie-thema-2 (accessed on 5 May 2020).
  85. Molinari, D.; De Bruijn, K.; Castillo, J.; Giuseppe, A.; Laurens, B. Review article: Validation of flood risk models: Current practice and innovations. Nat. Hazards Earth Syst. Sci. 2017. [Google Scholar] [CrossRef] [Green Version]
  86. CIW. Opmaak OverstromingsGevaar-en Overstromingsrisicokaarten Methodologie; CIW: Flanders, Belgium, 2020. [Google Scholar]
  87. Crompvoets, J.; Ho, S. Developing a framework for national institutional arrangements in geospatial information management. In Sustainable Development Goals Connectivity Dilemma; Rajabifard, A., Ed.; CRC Press: Boca Raton, FL, USA, 2019; pp. 141–161. [Google Scholar]
  88. Vinke-de Kruijf, J.; Kuks, S.; Augustijn, D. Governance in support of integrated flood risk management? The case of Romania. Environ. Dev. 2015, 16, 104–118. [Google Scholar] [CrossRef]
  89. de Boer, C. Contextual Water Management: A Study of Governance and Implementation Processes in Local Stream Restoration Projects; Universiteit Twente: Enschede, The Netherlands, 2012. [Google Scholar]
  90. Pahl-Wostl, C. The role of governance modes and meta-governance in the transformation towards sustainable water governance. Environ. Sci. Policy 2019, 91, 6–16. [Google Scholar] [CrossRef]
  91. Durà, A.; Camonita, F.; Berzi, M.; Noferini, A. Euroregions, Excellence and Innovation Across EU Borders: A Catalogue of Good Practices; UAB: Barcelona, Spain, 2018. [Google Scholar]
Figure 1. Pluvial and fluvial flood risks in Flanders [83] (Website of the map: https://www.waterinfo.be/overstromingsrichtlijn).
Ijgi 09 00460 g001
Figure 2. Pluvial flood risk map with climate change scenarios from 2017 to 2100 [84] ( Website of the map: https://klimaat.vmm.be/nl/kaartapplicatie-thema-2).
Ijgi 09 00460 g002
Table 1. Water governance matrix (adapt from [71]).
Qualities of the Governance Regime
Governance DimensionExtentCoherenceFlexibilityIntensity
Levels and ScalesIs there a participation of all the relevant government levels?Are the government levels working together?Is it possible that given the issue at stake, lower or higher government levels take the lead?Is there a government level or levels promoting the innovative projects?
Actors and NetworksAre all relevant actors involved?Are government and non-government actors working together and trust each other?Is it possible to include new actors to create social capital and to support each other’s task?Is there a non-government actor or a coalition of actors promoting the innovative projects?
Problem Perspectives and Goal AmbitionsAre the different perspectives being considered?Are the key actors sharing a similar goal and vision?Are there opportunities to re-assess goals?How different are the goals from the status quo?
Strategies and InstrumentsAre all the instruments and strategies being considered?Are there overlaps or conflicts among the different strategies and instruments?Are there opportunities to combine different instruments or strategies?Are the current strategies and instruments appropriate for the innovative projects?
Responsibilities and ResourcesAre responsibilities clearly assigned with sufficient resources?Is there collaboration across institutions to support each other’s responsibilities and to combine resources?Is it possible to pool responsibilities and resources without jeopardizing accountability?Are the resources sufficient to implement the measures needed for the intended change?
Table 2. Operationalization of Table 1.
Governance DimensionExtentCoherenceFlexibilityIntensity
Levels and ScalesHigh—All the relevant government levels are involved.
Moderate—Most the relevant government levels are involved.
Low—Few relevant government levels are involved.
High—All the relevant government levels work together and trust each other.
Moderate—Most of the relevant government levels work together and trust each other.
Low—Few relevant government levels work together and trust each other.
High—It is possible to move up and down levels, depending on the issue to be led, in a pragmatic manner.
Moderate—It is possible to move up and down levels, depending on the issue to be led. However, this requires institutional agreements that can be time consuming.
Low—It is not possible to move up and down levels even. The system is hierarchical.
High—All levels are promoting innovation.
Moderate—Most of the levels are promoting innovation.
Low—A minority of levels are promoting innovation.
Actors and NetworksHigh—There is cross-sectoral collaboration among all the different networks of actors.
Moderate—There is cross-sectoral collaboration among few networks of actors.
Low—Only a specific network of actors collaborates.
High—Collaboration is institutionalized, stable and with trust among the different networks of actors.
Moderate—Collaboration is institutionalized. It is stable and there is trust among few networks of actors.
Low—The collaboration is not institutionalized and there is not trust among the different networks of actors.
High—It is possible to include new actors, shift leadership and to create social capital.
Moderate—It is possible to include new actors. However, it is not possible to shift leadership or to create social capital.
Low—It is not possible to include new actors, shift leadership, and to create social capital.
High—Coalition of different networks of actors promoting innovation.
Moderate—Limited coalition of actors promoting innovation.
Low—No coalition of actors promoting innovation.
Problem Perspectives and Goal AmbitionsHigh—The perspectives of all relevant actors are considered.
Moderate—Few perspectives of relevant actors are considered.
Low- Only the perspective of the main actor is considered.
High—The perspectives of all relevant actors support each other.
Moderate—Few perspectives of relevant actors support each other.
Low—The perspectives of relevant actors contradict each other.
High—It is possible to reassess the project during the process.
Moderate—Only some aspects can be reassessed.
Low—It is not possible to reassess the project during its implementation.
High—The current perspectives favor the project goal.
Moderate—Minor changes are needed to include more perspectives that favor the project goal.
Low—Major changes are needed to include more perspectives that favor the project goal.
Strategies and InstrumentsHigh—Innovative strategies, including pilots, are considered and implemented by all the relevant actors.
Moderate—Innovative strategies, including pilots, are considered and implemented by few relevant actors.
Low—Innovative strategies, including pilots, are neither considered nor implemented by relevant actors.
High—The strategies and instruments do not present overlaps or conflicts.
Moderate—Some strategies and instruments present overlaps or conflicts.
Low—The strategies and instruments present overlaps and conflicts.
High—It is possible to combine different strategies and instruments for pragmatic reasons.
Moderate—There are some limitations to combine different strategies and instruments.
Low—It is not possible, or the actors are discouraged to combine different strategies and instruments.
High—The strategies and instruments are appropriate to reach the objective.
Moderate—The strategies and instruments require minor changes to reach the objective.
Low—The strategies and instruments require major changes to reach the objective.
Responsibilities and ResourcesHigh—The relevant actors have clearly assigned responsibilities and the required resources.
Moderate—Responsibilities are clearly assigned but there are not the required resources.
Low—The relevant actors do not have clearly assigned responsibilities nor the required resources.
High—The relevant actors can combine their resources.
Moderate—Only few relevant actors can combine their resources.
Low—The relevant actors cannot combine their resources.
High—It is possible to pool different resources and to share responsibility with effective accountability mechanisms.
Moderate—It is possible to pool resources but not responsibility.
Low—It is not possible to pool resources nor responsibility.
High—The actors consider there are the appropriate resources to implement the project.
Moderate—The actors consider the resources are tight to implement the project.
Low—The actors consider the resources are insufficient to implement the project.
Table 3. Affiliation of the actors interviewed.
City GovernmentProvincial GovernmentRegional GovernmentCompany
Urban Development, AntwerpIntegrated Water Policy Service, Antwerp
Water and Domains services, Limburg
Flanders Environmental Agency (VMM)FARYS, Gent
Table 4. Results of the governance assessment.
Governance DimensionsExtentCoherenceFlexibilityIntensity
Levels and ScalesModerate-highModerate-highLow-moderateModerate
Actors and NetworksModerateModerateModerateModerate
Problem perspectives and Goal ambitionsModerate-highModerate-highModerateModerate
Strategies and InstrumentsModerate-highHighModerate-highModerate-high
Responsibilities and ResourcesModerate-highModerate-highModerateModerate

