Urban Ageing in Europe—Spatiotemporal Analysis of Determinants


Faculty of Economics and Sociology, University of Lodz, Rewolucji 1905 r. 37 Street, 90-214 Lodz, Poland
*
Author to whom correspondence should be addressed.
ISPRS Int. J. Geo-Inf. 2020, 9(7), 413; https://doi.org/10.3390/ijgi9070413
Submission received: 15 May 2020
/
Revised: 25 June 2020
/
Accepted: 25 June 2020
/
Published: 27 June 2020
Abstract
:The aim of this study was to identify determinants of the population ageing process in 270 European cities. We analyzed the proportion of older people: men and women separately (aged 65 or above) in city populations in the years 1990–2018. To understand territorially-varied relationships and to increase the explained variability of phenomena, an explanatory spatial data analysis (ESDA) and geographically weighted regression (GWR) were applied. We used ArcGIS and GeoDa software in this study. In our research, we also took into account the spatial interactions as well as the structure of cities by size and level of economic development. Results of the analysis helped to explain why some urban areas are ageing faster than others. An initial data analysis indicated that the proportion of the elderly in the population was spatially diversified and dependent on gender, as well as the size and economic development of a unit. In general, elderly individuals were more willing to live in larger and highly developed cities; however, women tended to live in large areas and men in medium-sized to large urban areas. Then, we conducted the urban ageing modelling for men and women separately. The application of GWR models enabled not only the specification of the city population ageing determinants, but also the analysis of the variability in the strength and direction of dependencies occurring between the examined variables in individual cities. Significant differences were noted in the analysis results for specific cities, which were often grouped due to similar parameter values, forming clusters that divided Europe into the eastern and western parts. Moreover, substantial differences in results were obtained for women and men.

1. Introduction
Population ageing and urbanization are major global trends shaping the world today and will shape the decades to come. More than 54% of people live in cities and this percentage will rise to 66% by 2050 [1]. The world’s urban population is also ageing rapidly. The WHO defines an ageing society as a society where the proportion of people in post-working age (aged 65 years or more) exceeds 7% of the total population [2]. The seniors’ population in European and Asian cities is the fastest growing population in the world [3]. The proportion of urban inhabitants aged 65 or above in the total population increased in Europe from 6% in 1990 to 12% in 2018, while the number of elderly Asians rose from 3% to 11% [4]. The literature indicates that long-term downtrends in fertility [5], longer life expectancies [6], a higher standard of living [7], lower birth rates [8], a higher level of education, migration [9] and environmental protection [10] are the main reasons for the constantly accelerating population ageing process.
The ageing trend is not uniform across countries or across all areas of rural and urban communities [11,12,13,14,15,16]. Hence, as the older population are expected to fully participate in an ageing and urbanizing society, the process of urban ageing has a number of implications for public and private spending on pensions, healthcare, education, economic growth and welfare [17]. By making cities and human settlements safe and resilient for the elderly, governments have been raising the issue of international development strategies. The Agenda 2030, Sustainable Development Goals, World Humanitarian Summit, Policy of Healthy Ageing in Cities, and the New Urban Agenda are programs united in calling for inclusive and sustainable urbanization [1].
Men and women both experience urban ageing and many of the same diseases or conditions, but the ways they face them differ in terms of the rates, trends, and disease types or subtypes. Many disparities result from actual physiological differences, thus a full understanding of ageing (and health) demands a perspective that accounts for gender disparities beyond those in the body. For example, cardiovascular disease (CVD) is the primary cause of mortality among the elderly of both sexes in most countries worldwide [2]. However, in many cities, particularly in low and lower middle-income countries, CVD is regarded as a “male disease” and thus is significantly underdiagnosed in women, creating a disparity in avoidable lives lost [18]. Further, although women tend to live longer than men, socioeconomic factors in many cultures and environments result in a lower quality of life for women as they age. Another varying factor is that men are more likely than women to delay or avoid seeking medical help, resulting in worse outcomes when men do develop treatable health problems. Older men who become widowers also tend to be more socially isolated than women, a risk factor for poorer health and mortality; conversely for widows, some specific cultural practices such as exclusion make it more likely that older widowed women will experience financial hardship or even violence or abuse [19]. Such differences between women and men, and many other differing circumstances and gender-specific problems, should be accounted for. This assertion is strongly supported by the Department of Ageing and Life Course (ALC), who urge that a gender analysis must be applied to any issue under discussion [2].
The issue of challenges, opportunities and the impact of the urban population ageing on cities’ socioeconomic development has been widely discussed in the literature. Many researchers have studied the effectiveness of age-friendly urban policies as a way to foster the development of the active ageing community [20,21,22,23,24,25]. Recent scientific publications recognize and clarify the importance of accessibility, mobility and visibility of older people in civic spaces [26,27,28,29,30,31]. Many authors also characterize the potential of ageing populations and identify their important role in the future silver city economies [32,33,34]. Some studies focus on the healthy and active ageing of older residents and verify the relationship between the way older people maintain the continuity of their activities and independence, within the limits of their personal resources, and the changing urban environment [3,35,36,37]. Finally, some studies examine the spatiotemporal trend changes in older urban population data [25,38,39,40,41,42,43,44].
However, analyses dealing with reasons for the ageing process in cites have been rather limited to date. Only a few studies concentrated on, e.g., factors associated with the successful ageing of the socially-active elderly in the metropolitan regions of China [16], Brazil [45] Finland and Spain [46], Poland [47], Germany [39], Slovenia, Lithuania and the UK [48]. There is still a lack of comprehensive European studies exploring the mechanism of the process, and that take into account the influence of particular characteristics that may vary across cities. Within the regions and cities, the population ageing is territorially divergent and strongly connected with local determinants of the process. This transforms into the need to adjust urban policies and urban planning based on local old age conditions. The European Grouping on Territorial Cooperation in the ACPA (Adapting European Cities to Population Ageing: Policy Challenges and Best Practices) highlights that the older population is growing faster in urban areas than in rural areas [49]. This means that the regions will have to face a number of specific social and economic challenges due to population ageing. In sum, the population ageing process in urban areas does not require “one-size-fits-all” solutions that are not effective when taking into account the urban ageing process. In-depth case empirical investigations are useful to draft a “practical guide” with policy recommendations that can enable the transferability of the outcomes among cities, as well as target actors and policy-makers in stakeholder cities and at national levels.
The main purpose of the research was to identify determinants of the population ageing process in the selected 270 European cities. We analyzed the proportion of older people: men and women (aged 65 or above) in the population of the cities in the years 1990–2018. We applied geographically weighted regression (GWR) and explanatory spatial data analysis methods to control and understand the territorially-varied relationships between urban ageing and selected factors. In a preliminary data analysis, we suggested over 30 determinants that could affect population ageing in urban areas of Europe. This study also took into account spatial interactions as well as the city structure by size and economic development level. The use of the GWR model enabled the specification of population ageing determinants in European cities. Additionally, it allowed us to analyze the variability in the strength and direction of dependencies occurring between the analyzed variables in individual cities. Performing the analyses separately for men and women enabled the identification of gender differences. The analyses were carried out on the basis of statistical data obtained from Eurostat, the WHO (World Health Organization), OECD (the Organization for Economic Co-operation and Development), World Bank and National Statistical Offices. This research was a continuation of the analysis that examined the dynamics of the population ageing process in Europe [44].
We contributed to the literature in several ways. By using a geographically weighted regression, we searched for urban ageing determinants (for women and men separately), which, with varying force and in varying directions, affected the studied variable in Europe. Moreover, we performed a robustness analysis from temporal, spatial and other perspectives. We considered the long-term dynamic trajectory of ageing in metropolitan areas (1990–2018), the size of the cities and the spatial neighboring effects on the phenomena among urban areas. Finally, we examined the impact of a wide range of possible determinants (from economic and demographic through environmental, touristic and educational, up to cultural and medical factors) that decelerated or accelerated the phenomenon of ageing, not only in a studied unit but also in neighboring cities during the study period. The findings indicate that geographical differences should be considered when investigating the empirical relationships between the selected factors and European ageing of men and women. In sum, a study adopting such a broad approach has never been carried out before, but should be relevant as it makes urban ageing trends fairly predictable in a practical way, which may allow cities to prepare for changes.
The study consists of five parts. Section 2 presents a databank used in the study as well as the results of a preliminary analysis applying exploratory spatial data statistics and a GIS (Geographic Information System). Section 3 describes the method applied in the main part of the study—the geographically weighted regression. Section 4 shows and discusses the outcomes of urban population ageing modelling in European cities. The last section provides further directions for research and general conclusions, and indicates some policy recommendations based on the results.
2. Data Analysis
2.1. Urban Population Ageing Data
We carried out this multidimensional study of the urban ageing process in Europe, based on the statistical data obtained from Eurostat, on the proportion of the population on the 1st of January (65 years and over) in the total population (in %) in several cross-sections:
- by gender: as a proportion of the female population on the 1st of January (65 years and over) in the total female population and the proportion of the male population on the 1st of January (65 years and over) in the total male population (both variables in %);
- by size of the city: below 100,000 inhabitants, between 100,000 and 250,000, between 250,000 and 500,000, between 500,000 and 1,000,000, and above 1,000,000 people [50];
- by the level of economic development: lower-middle income, upper-middle income, and high-income units [51].
The analysis was conducted for the years 1990–2018, and used cities from 31 European countries: Austria (AT), Belgium (BE), Bulgaria (BG), Croatia (HR), Cyprus (CY), the Czech Republic (CZ), Denmark (DK), Estonia (EE), Finland (FI), France (FR), Germany (DE), Greece (EL), Hungary (HU), Ireland (IE), Italy (IT), Latvia (LV), Lithuania (LT), Luxembourg (LU), Malta (MT), the Netherlands (NL), Poland (PL), Portugal (PT), Romania (RO), Slovakia (SK), Slovenia (SI), Spain (ES), Sweden (SE), the United Kingdom (UK), Lichtenstein (LI), Norway (NO), and Switzerland (CH).
The sample of selected cities was constructed, maintaining the structure of the urban areas in Europe [52]. We gained comparable data for 270 cities (35% of all European units). The sample in its structure was characterized by representativeness according to the analyzed population of urban settings, Figure 1.
In the years 1990–2018, there were 5 p.p (percentage points). more women than men aged 65 or above, and the diversification of the analyzed cities, measured with the coefficient of variation in terms of the phenomenon, was high (CV = 21.5% (Table 1)). In general, seniors more willingly lived in medium-sized and upper-middle income cities. Nevertheless, there were no strictly specified living preferences among elderly women regarding either the city size or the economic development level.
We used the ANOVA Kruskal–Wallis (one-way ANOVA) and Mann–Whitney U tests to investigate the differences between the urban ageing of men and women depending on the size of the city and level of economic development. Both tests are non-parametric methods and do not assume a normal distribution of the variables (unlike the analogous one-way analysis of variance and Student’s t-tests) [53].
The ANOVA Kruskal–Wallis did not reveal statistically significant differences between the average share of older females in cities of different sizes or income levels (Table 1). In turn, in the case of men, there were statistically significant differences in the numbers of the elderly depending on the city size and development level. The greatest proportion of older men lived in larger cities, i.e., from 100,000 to 500,000 inhabitants, in the category of upper-middle income.
However, statistically significant differences were observed with regard to the share of the elderly men versus women in both indicated cross-sections (Mann–Whitney U), Table 1.
2.2. Dynamics of Urban Ageing
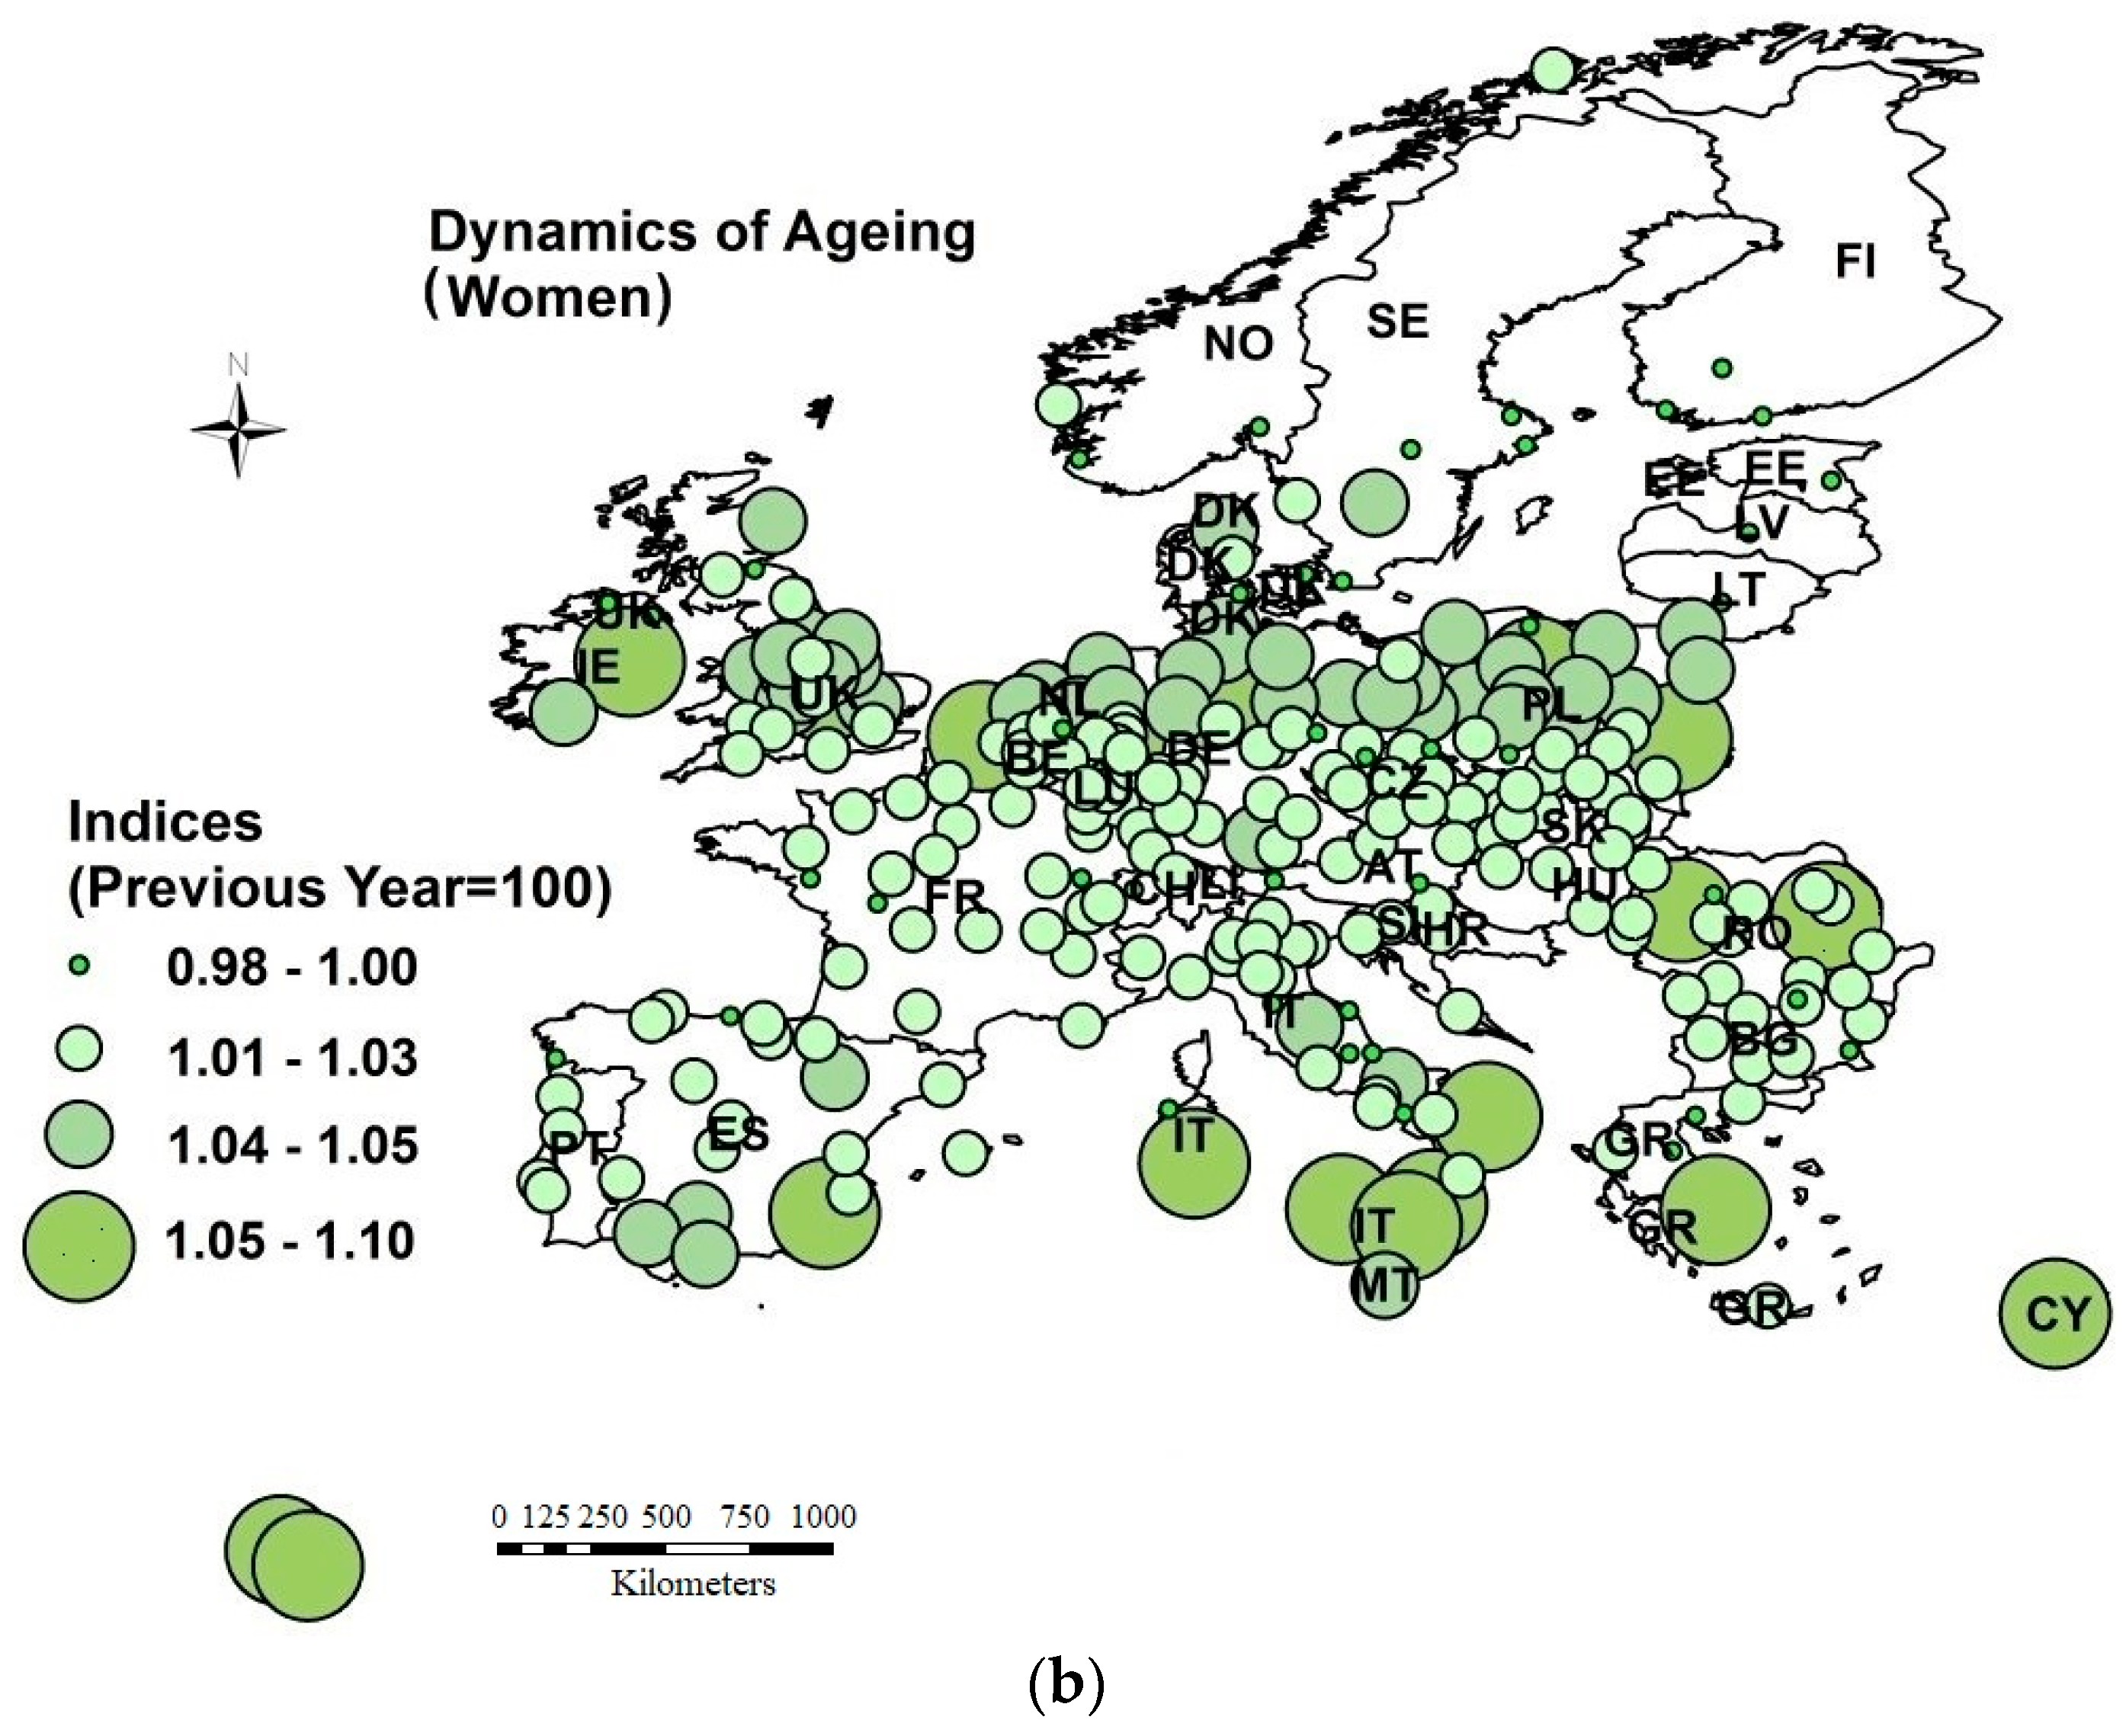
Over the years 1990–2018, most of the analyzed cities had ageing populations (93% of 270 units). However, the process unfolded at different rates for men and women (those findings were previously proved by Antczak and Lewandowaska-Gwarda [44]). The average annual pace of changes in women’s ageing growth was 2 p.p. higher than it was in men. The highest annual growth in share for both men and women aged 65 or above was clearly marked in cities in Spain, Italy, the UK, Ireland, Poland and Germany (from 5% to 10%). However, the data shown on the maps indicate that men living in cities in the Netherlands and Sweden aged faster, which, in turn, was not observed in women, whereas a markedly faster annual rate was observed in women aged 65 or above (from 5% to 10%) when compared to men living in cities in Belgium, Greece and Cyprus.
On the other hand, an annual fall in the share of the elderly was noted in 9% of cities: 42 cities for women and 16 cities for men. The slowest ageing process, both for women and men aged 65 or above, took place in Stockholm and cities in Norway, Finland, Lithuania, Latvia, Austria, Hungary and Estonia (a 2% average annual drop in the phenomenon was observed there (Figure 2)).
2.3. Spatial Concentration of Ageing Process
Yang et al. [16], Sabater et al. [43], Antczak and Lewandowska-Gwarda [44] and Kula et al. [47] concluded that the urban ageing of a population may be associated with a certain tendency towards the spatial concentration (autocorrelation) of the process determinants. Data presented on maps in Figure 2 show that the dynamics of the ageing process groups European cities into homogeneous areas. Therefore, we applied the explanatory spatial data analysis (ESDA) tools: the global and local (local indicators of spatial association, LISA) spatial autocorrelation measures of Moran I were used to explore the regional variation in the proportion of older people (aged 65 or above) in the population of the European city in the analyzed time span [54].
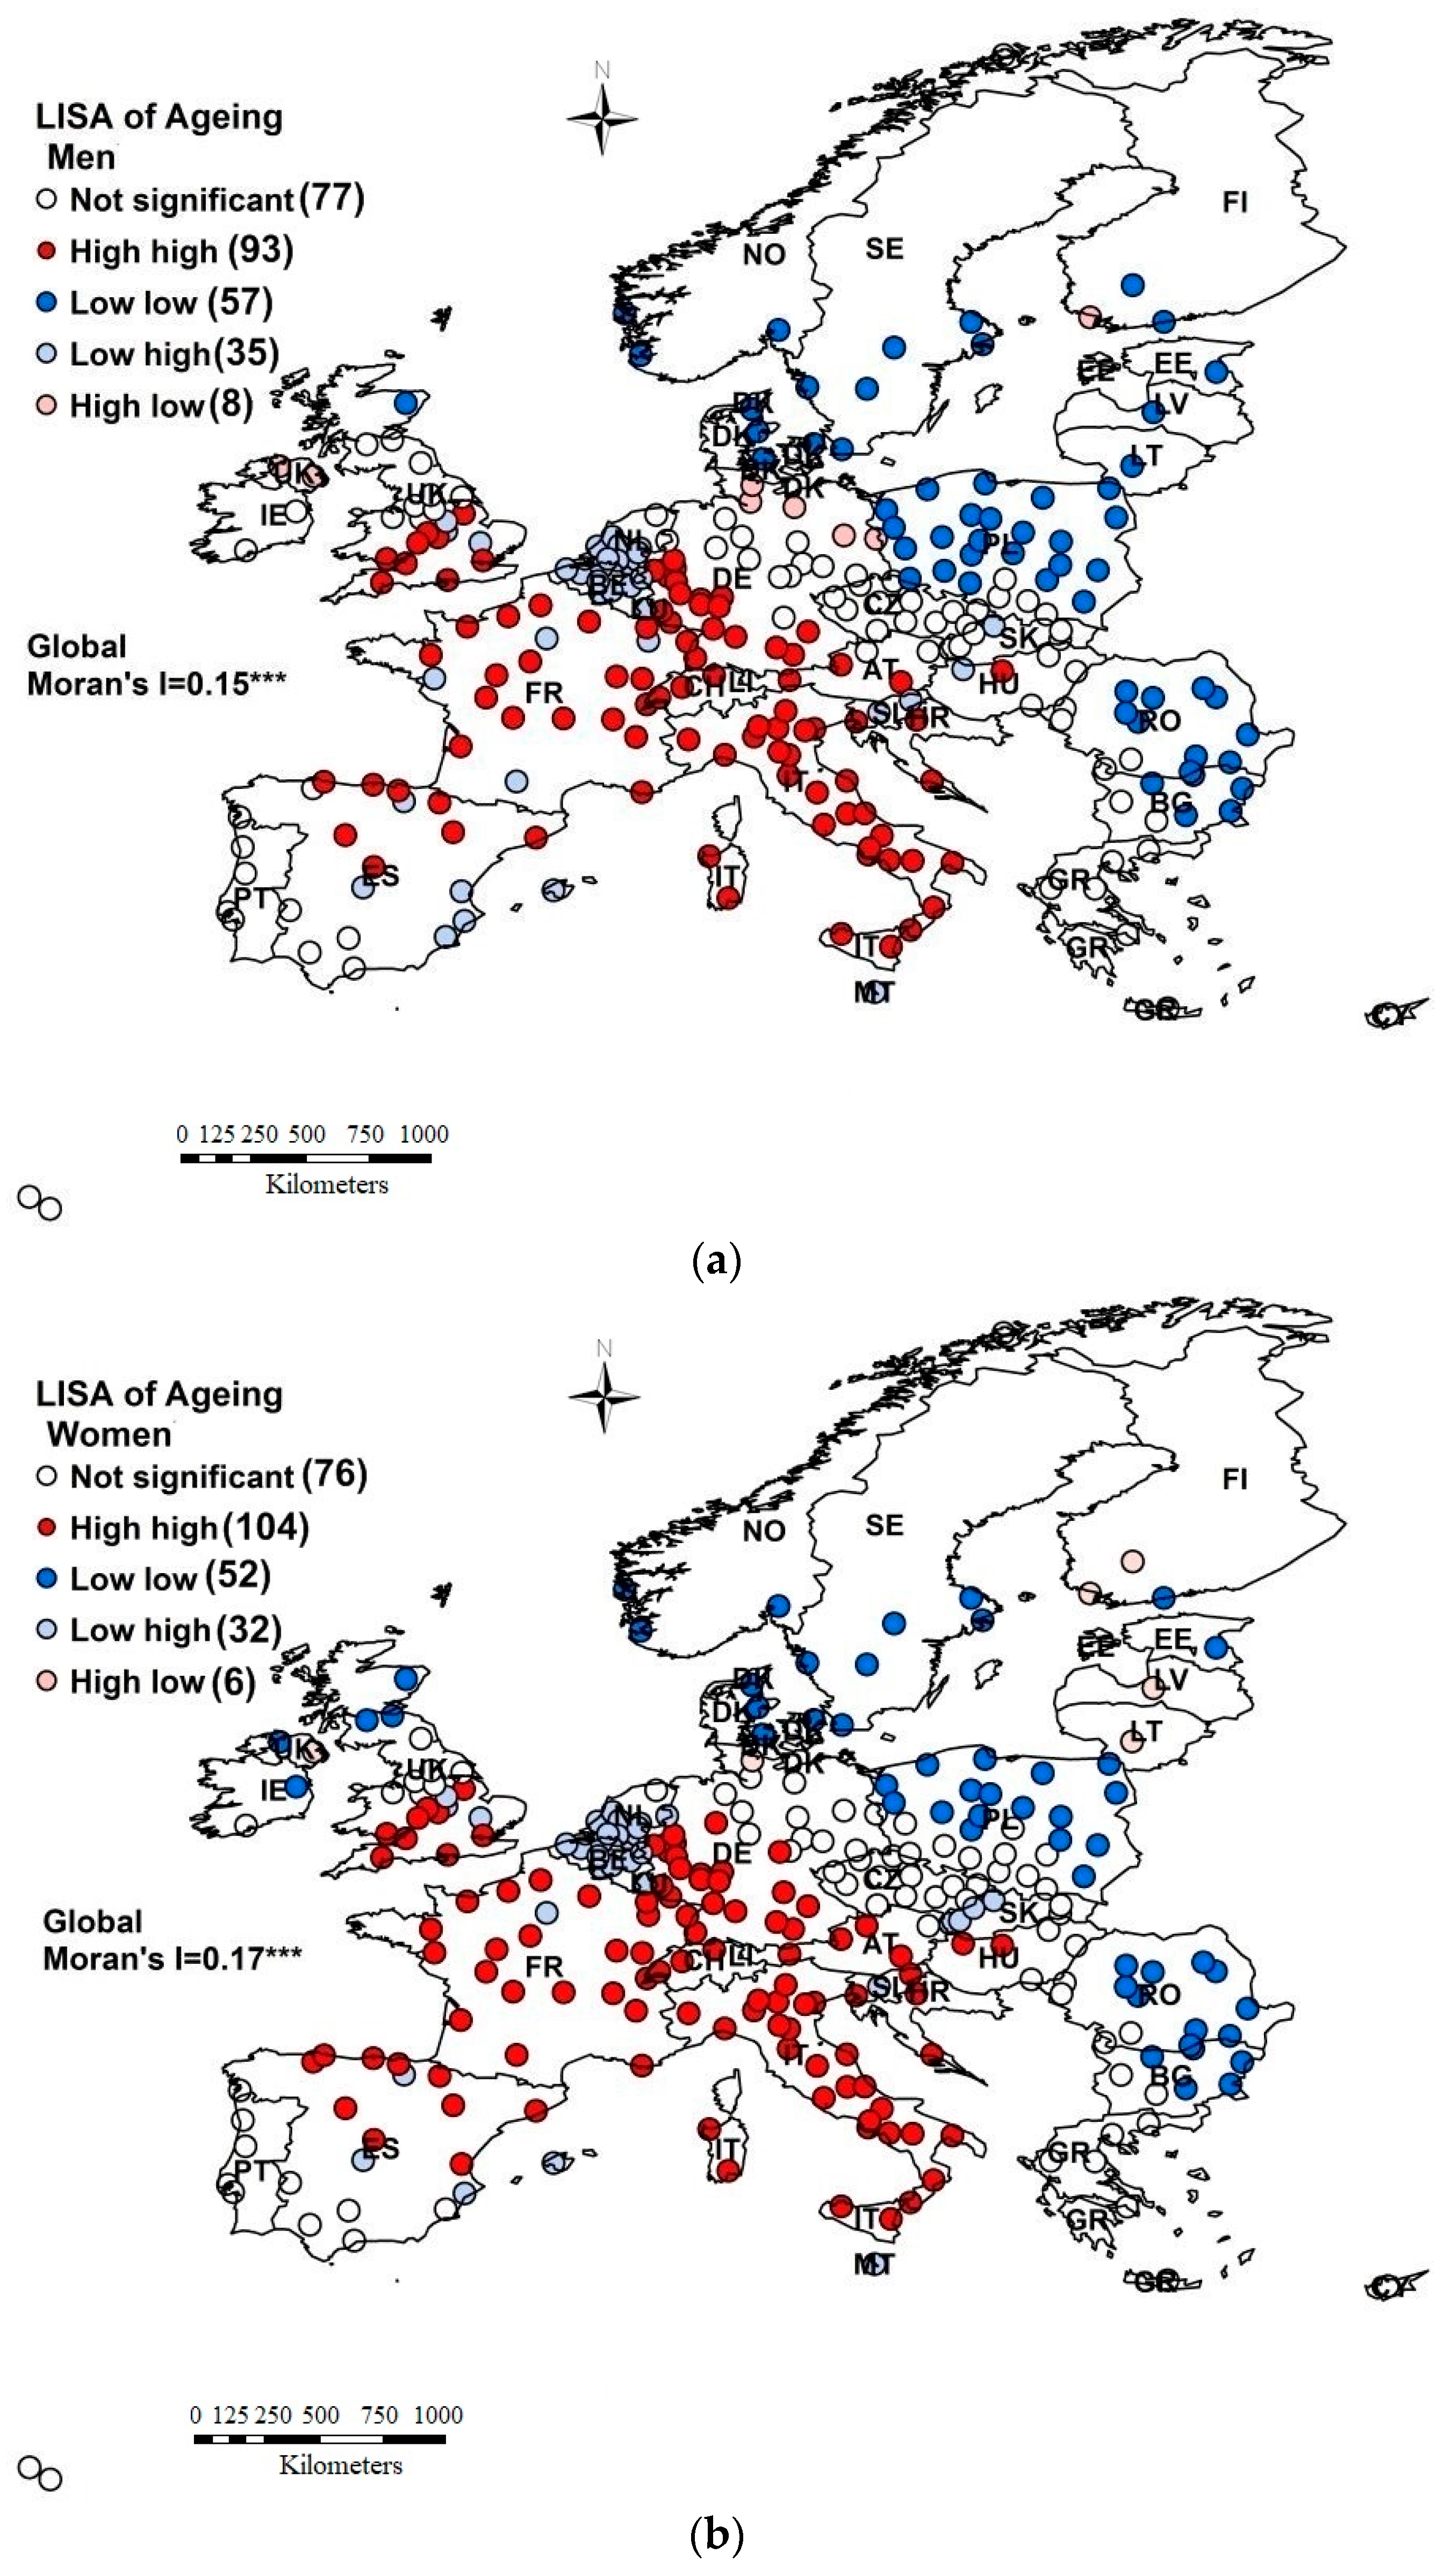
The indices of LISA Moran I (Figure 3) show that adjacent cities tended to cluster according to the analyzed phenomena in the years 1990–2018.
Irrespective of the gender of the elderly person, the highest spatial concentration of urban units (high-high clusters) with the greatest share of seniors (from 11% to 24%) occurred in Italy, France, Spain, Germany, Croatia and Malta. Distinct clusters of cities with low phenomenon values (characterized by the proportion of individuals aged 65 or above from 4% to 10%) were situated in Poland, Romania, Estonia, Sweden, Lithuania and Latvia (low-low LISA indices). An interesting example is the above-mentioned cities in Poland. On the one hand, they were characterized by a small share of the elderly in the population (as compared to the other analyzed cities), but, on the other hand, the dynamics of the phenomenon growth in Poland in the studied period was one of the highest in Europe (Figure 2).
The LISA results also revealed certain differences in the degree of concentration of cities with regard to the predominance of older men and women. In Spain, France, Italy and Hungary, there were vaster clusters of cities with a higher proportion of senior females than males (in the city population). In turn, in Poland, the UK, Lithuania and Latvia, clusters of cities with a low proportion of males aged 65 or above were vaster than clusters of urban units with a similar share of female seniors.
The preliminary analysis showed that urban ageing is gender-specific, and the differences with regard to elderly men and women should therefore be included in the modelling.
2.4. Potential Determinants of European Urban Ageing
As previously noted (Section 2.1, Section 2.2 and Section 2.3), the urban ageing process has been strongly related to gender and city size, shows high relative regional variability (spatial non-stationary), and has many variables that could be possible determinants of the phenomena, both within and outside individual control. Therefore, we suggested a range of factors for the urban European male and female ageing process defined in the literature (more in the introduction to this paper). We also took into account the availability of urban audit statistical information in Eurostat, the WHO, OECD and National Statistical Offices. The data were classified into ten groups and are presented in Table 2.
It can be clearly seen that the panel data set (Table 2) is not complete because of the gaps in some variables for the 1990–2018 period, with panel estimates being impossible for our dataset. We averaged the values of all the variables. We conducted several stepwise regressions to identify the predictive variables of the phenomena over the time span. Finally, to overcome all these problems, we estimated the GWR function to explain the process of elderly people ageing (for men and women) in European cities. We used ArcGIS software.
3. Methodology
Spatial data are more complicated in their structure than in their time series. Analyzed spatial units are often heterogeneous—they are diverse in terms of their size and economic or social potential. This is confirmed by this study, where the database consisted of both smaller towns with fewer than 100,000 inhabitants and large cities with more than 1,000,000 residents. Moreover, the cities differed significantly in their level of economic and social development (Figure 1). The relationships modelled in such cases are often not consistent, which causes heteroscedasticity of the random component in OLS (ordinary least squares) regression. The literature indicates many ways of solving such problems. One of them is to use the geographically weighted regression (GWR) model, which considers spatial heterogeneity. This method enables the identification of the variability of regression coefficients in the geographical space by generating a separate regression equation for each observation (for each analyzed city in our case).
The GWR model can be expressed as follows [56]:
where i represents the spatial unit—a city in our case, yi is the dependent variable, (ui,vi) is the co-ordinate location of i, 0 is the intercept, k represents the coefficients, xik represents the independent variables, and i is the error term.
The estimator for the model takes the form of:
where W(ui,vi) is the square matrix of weights relative to the position of (ui,vi) in the study area, XTW(ui,vi)X is the geographically weighted variance–covariance matrix (the estimation requires its inverse to be obtained) and Y is the vector of values for the dependent variable [57].
The W(ui,vi) matrix contains the geographical weights in its leading diagonal and 0 in its off-diagonal elements [58]:
where n is the number of observations (spatial units).
Each equation was calibrated using different weights of observations contained in the dataset. According to Tobler’s first law of geography (“everything is related to everything else, but near things are more related than distant things") [59], it is assumed that observations near one another have a greater influence on one another’s parameter estimates than observations farther apart, which means that the impact decreases with distance [56]. The weight assigned to each observation was based on a distance decay function centered around observation i [60]. The choice of the spatial weighting scheme, in particular the kernel bandwidth, is one of the most important steps of the analysis because it actually determines the final results [56]. In this study, the adaptive type of the spatial kernel was used to provide geographic weighting in the model due to the fact that the density of observations varied across the study area [58]. A key coefficient in the kernel is the bandwidth, which controls the size of the kernel. The corrected Akaike Information Criterion (ACIc) method was applied in this study to determine the bandwidth (the bandwidth for which the statistic takes the lowest values is considered to be optimal) as it is recommended in the literature [61].
The GWR produces not only localized parameter estimates, but also localized versions of all standard regression diagnostics, which can be mapped. Maps generated on the basis of this information play a key role in the interpretation of obtained results and understanding studied relationships, in particular from the spatial perspective [60].
4. Results and Discussion
The main purpose of this research was to identify determinants of the population ageing process in 270 European cities. Therefore, an attempt was made to build econometric models describing the impact of selected economic, social and environmental factors (Table 2) on the proportion of older people: men and women (aged 65 or above) in the cities’ populations in the years 1990–2018. In the first step of the analysis, the correlation between the dependent variables and potential determinants, which are listed in Table 2, was examined. The highest values were observed for the: crude birth rate (CBR), crude death rate (CDR), infant mortality rate (IMR (demography)), average area of living accommodation (AEOL), lone-pensioner households (LPH (living conditions)), city, cinema seats (CS (culture and tourism)), foreigners as a proportion of the population (FP (migration)), medical doctors, nurses, midwives and physiotherapists (MD_N_P) and the number of registered cars (RC (health)). Then, various forms of functions and different sets of explanatory variables were considered. The final version of regression was selected based on the analysis of collinearity in the model, Akaike Information Criterion and the coefficient of determination. In order to compare the results of the GWR model, the parameters of the global model (OLS), producing one coefficient for each variable, were also estimated.
Global models, for both women and men, were characterized by a low coefficient of determination: 0.41 and 0.37, respectively. Although the Jarque–Bera Statistic indicated that residuals were normally distributed, the Moran’s I statistic showed spatial autocorrelation in the OLS residuals (initially, it was confirmed by the ESDA results, Figure 3). Moreover, the Koenker (BP) statistic indicated that the modelled relationships were not consistent either due to nonstationarity or heteroscedasticity (Table 3).
The application of GWR models significantly improved the results. All measures indicated that the GWRs had a markedly better fit to the empirical data. The value of AICc (Akaike Information Criterion) for women declined from 1461.56 in the global model to 1351.97 in the GWR; for men, it ranged from 1325.30 to 1199.77. The value of R-squared improved as well. For women, it increased from 0.41 in OLS to 0.66 (the average value of the adjusted local R-squared) in GWR, for men, it rose from 0.37 to 0.66. As noted by Yu, a GWR usually produces better fitting models than a global OLS, as it takes into account spatial heterogeneity of the relationship between the dependent and independent variables [62]. Nevertheless, there is still a high unexplained variation, which must be addressed in future studies. Importantly, the Moran’s I test was not statistically significant (p-value < 0.01), for both women’s and men’s GWR. Therefore, there was no spatial autocorrelation in residuals (Table 3).
In global models, variance inflation factors (VIF) did not exceed 1.35 for all variables, which meant that there was no issue of collinearity (a VIF of five and above indicates a high correlation among regressors that may be problematic (Table 4)) [63]. However, in GWR models, the problem of collinearity is more complex and difficult to test. When data are spatially heterogeneous, some localities may exhibit collinearity, while others may not. The effects of collinearity can be more pronounced with smaller spatial samples used in each local estimation [64]. ArcMap software solves this problem and simply does not present results when there is either global or local multicollinearity in the model. Based on the results of the study, it can be stated that there is no issue of collinearity in estimated models: neither global or GWR.
Table 4 presents preliminary OLS results. In the case of women, the parameter for the city was not statistically significant, hence the variable was removed from the model. Generally, it can be clearly seen that the impact of the analyzed exogenous variables was much higher for women than for men. Nevertheless, the global model did not reflect the complexity of the studied phenomenon.
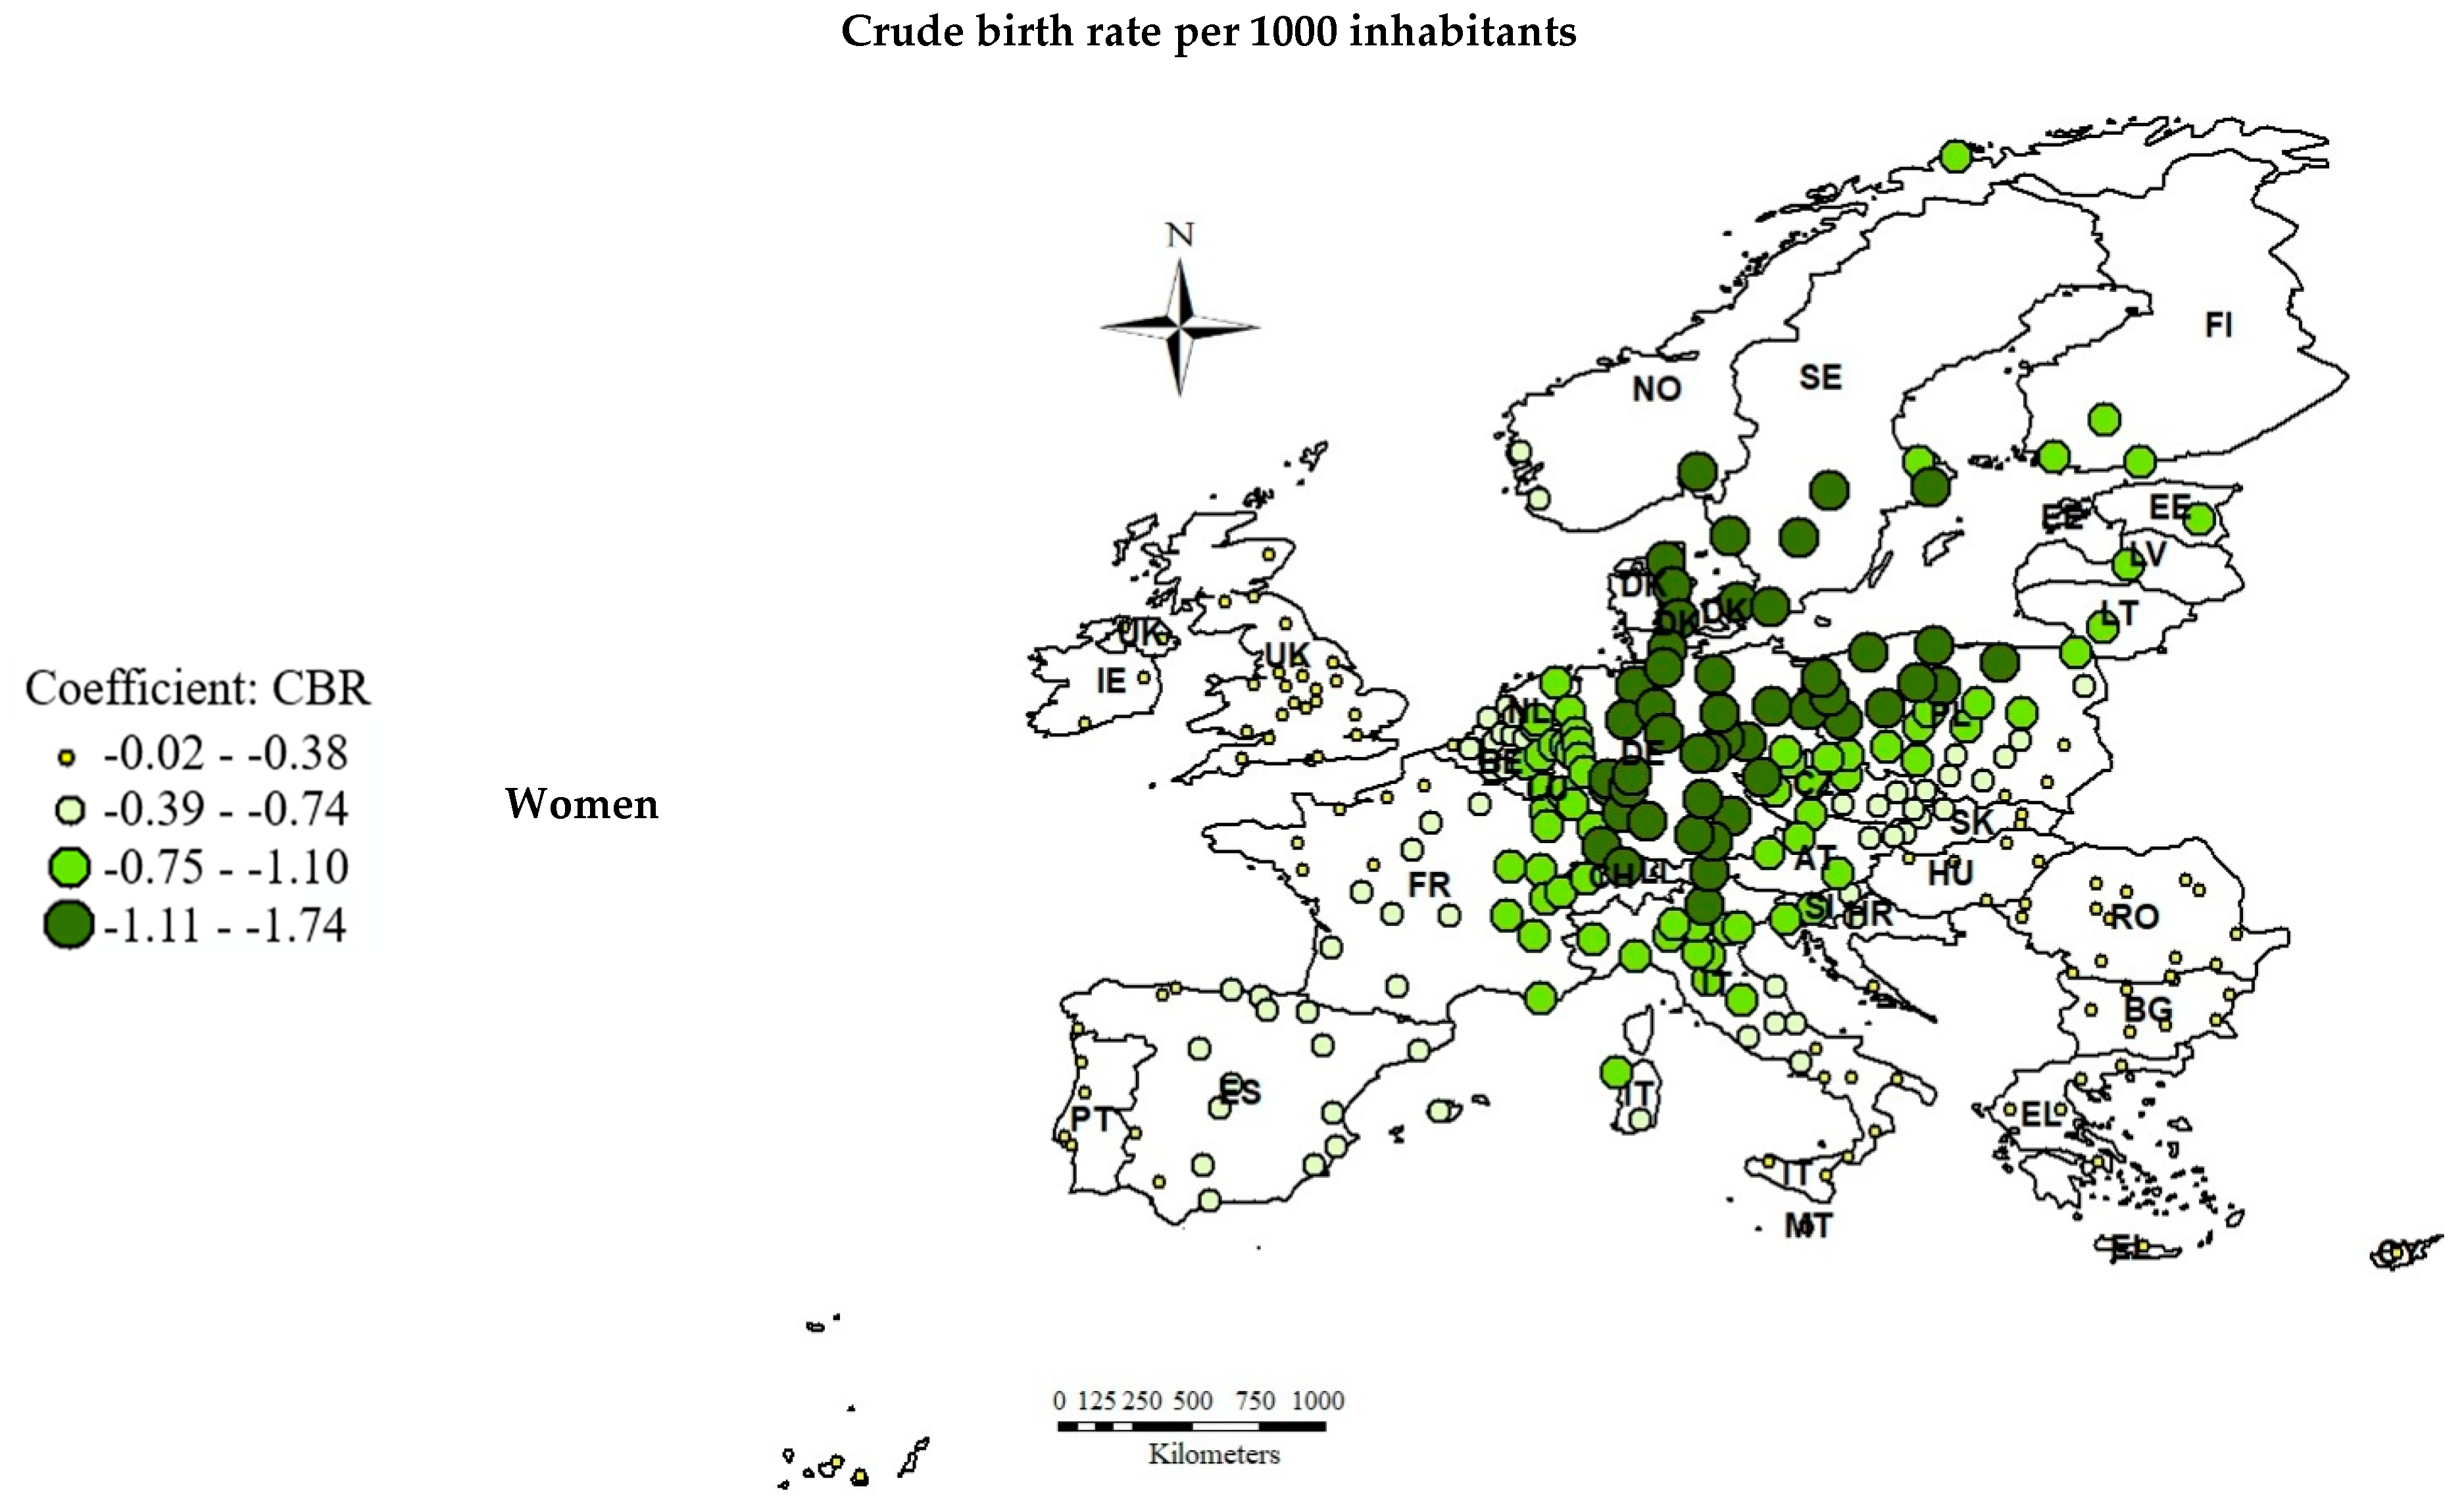
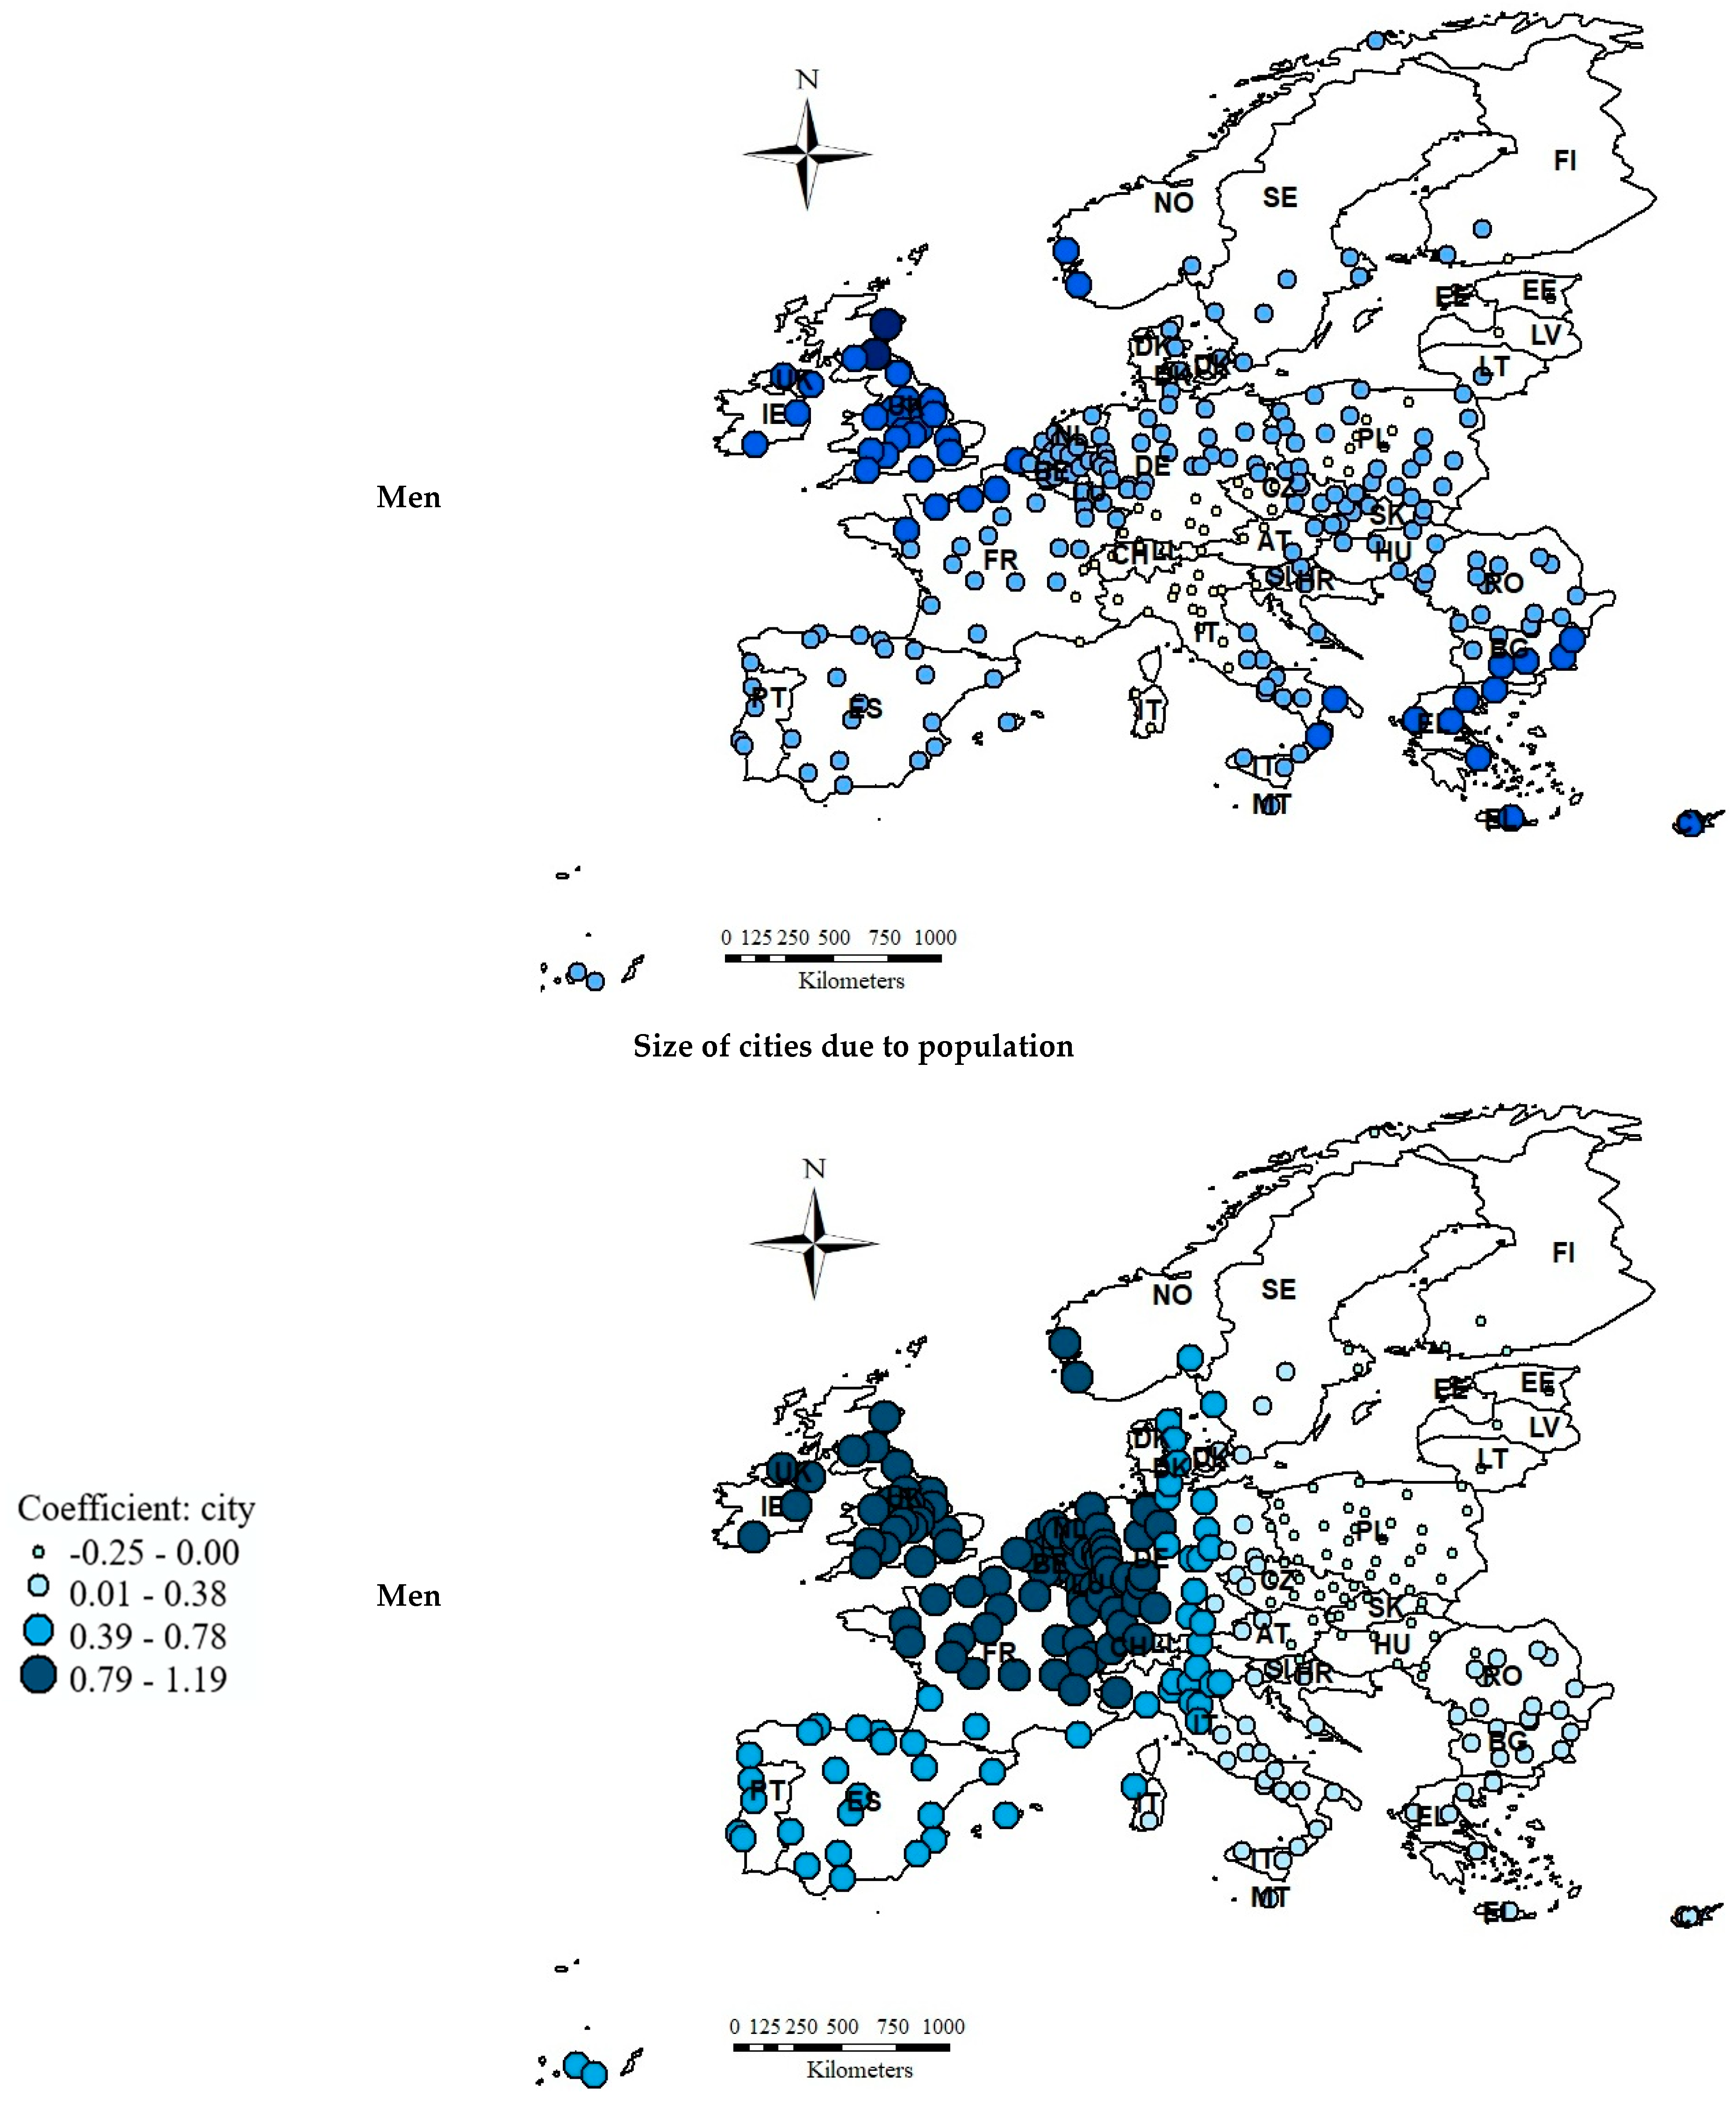
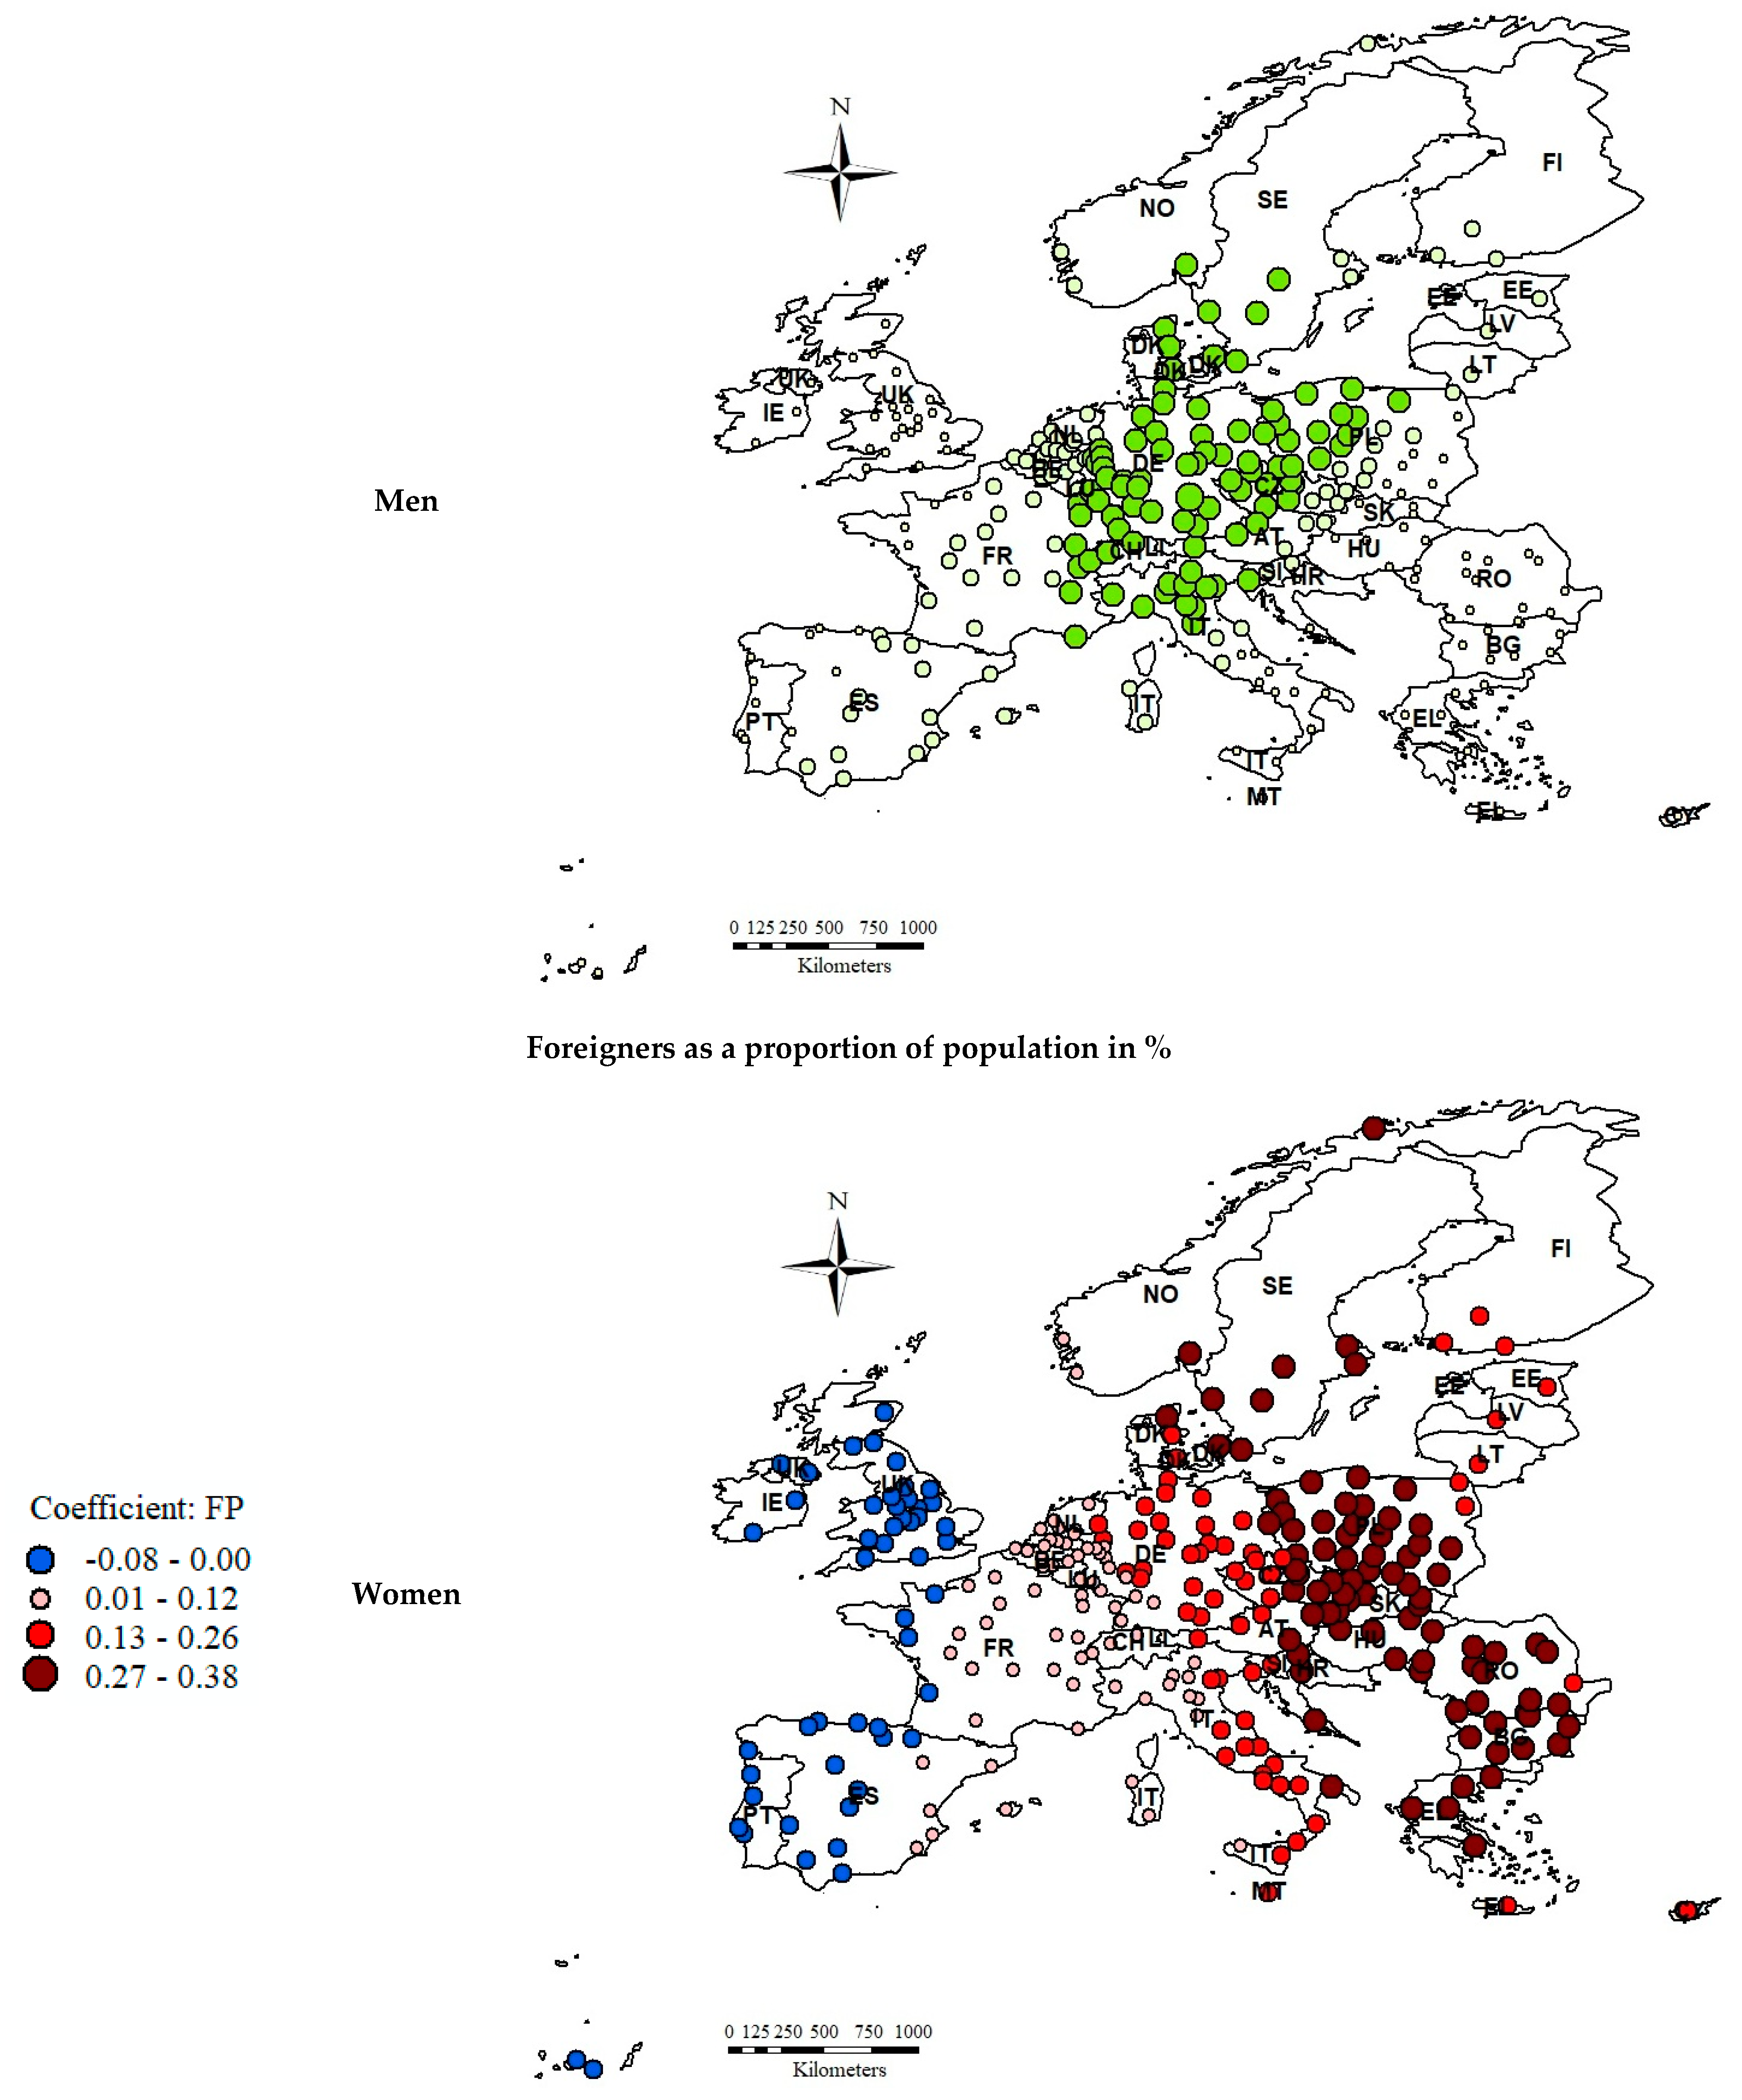
The local values of coefficients in the GWR models are presented in Figure 4. To capture the differences in parameter values between women and men, the same scale was used for each variable on the maps.
A negative correlation between the crude birth rate per 1000 inhabitants and the proportion of older people, both men and women (aged 65 or above), in the population was observed in all the analyzed cities. The strongest relationship occurred for women in cities forming a cluster in Central Europe: in Germany, Denmark, eastern Norway, Sweden, north-western Poland, northern Italy and Switzerland, whereas the weakest—for women and men—was noticed in Eastern Europe (eastern Poland and Slovakia, Hungary, Romania, Bulgaria, Greece, Croatia and southern Italy) and the westernmost territories: Portugal, western France, the United Kingdom and Ireland. The birth rate is one of the most important factors affecting the structure of the population. A higher birth rate certainly improves the demographic structure, causing the proportion of the elderly in the population to decline, which is very important for social and economic development [65]. According to data presented by the World Bank [66], the crude birth rate in the European Union steadily declined from the mid-1960s to the mid-1990s (from 19.209 to 10.437), then stabilized at around 10. The average value of the crude birth rate per 1000 inhabitants in the analyzed cities between the years 1991 and 2018 was 10.768. The highest rate was observed in Greek cities, such as Ioannina, Irakleio, Larisa, Kavala and Athina (from 26 to 19), while the lowest was observed in Italian cities, such as Cagliari, Genove, Trieste, Salerno and Compobasso (around 7). The average fertility rate in the European Union in the analyzed period was 1.55 [67], which certainly did not guarantee a generational replacement or a significant decrease in the proportion of older people in the population.
A negative correlation between foreigners as a proportion of the population and the share of women aged 65 or above in the population was noticed in a mere 50 out of 270 analyzed cities, located in Ireland, the United Kingdom, western France, Spain and Portugal. In the case of men, the relationship was noticed for 96 cities, located in the Netherlands, Belgium, France, and on the Italian island, Sardinia. The relationship indicated the desired impact of migration on the population structure. A decrease in the share of older people in the population caused by the influx of foreigners means a rejuvenation of the society. For men, the effect applied to a much larger area of Western Europe than for women. Perhaps this is due to the fact that migrants are mostly young adults, and the proportion of male immigrants in European countries is slightly higher than the proportion of females, but since the number of men is generally lower, the effect is more pronounced in their case. A positive relationship between these two variables was noticed in Central and Eastern Europe; the highest impact was observed for women in cities located in the western part of the continent—starting from Norway and Sweden, through Poland, Slovakia, Hungary, Croatia, Romania, Bulgaria up to Greece. For men, the highest impact was observed solely in southern Poland, Slovakia and Hungary. At the same time, the share of foreigners in the population of the analyzed cities located in Eastern Europe was much lower than that of Western Europe. For example, it did not even exceed 1% in most Polish, Bulgarian and Romanian cities. The reason for this dependence may be the more varied age distribution of migrants, as in the case of refugee flows, thus the final impact on population age structures remains equivocal and can even affect the population ageing [68].
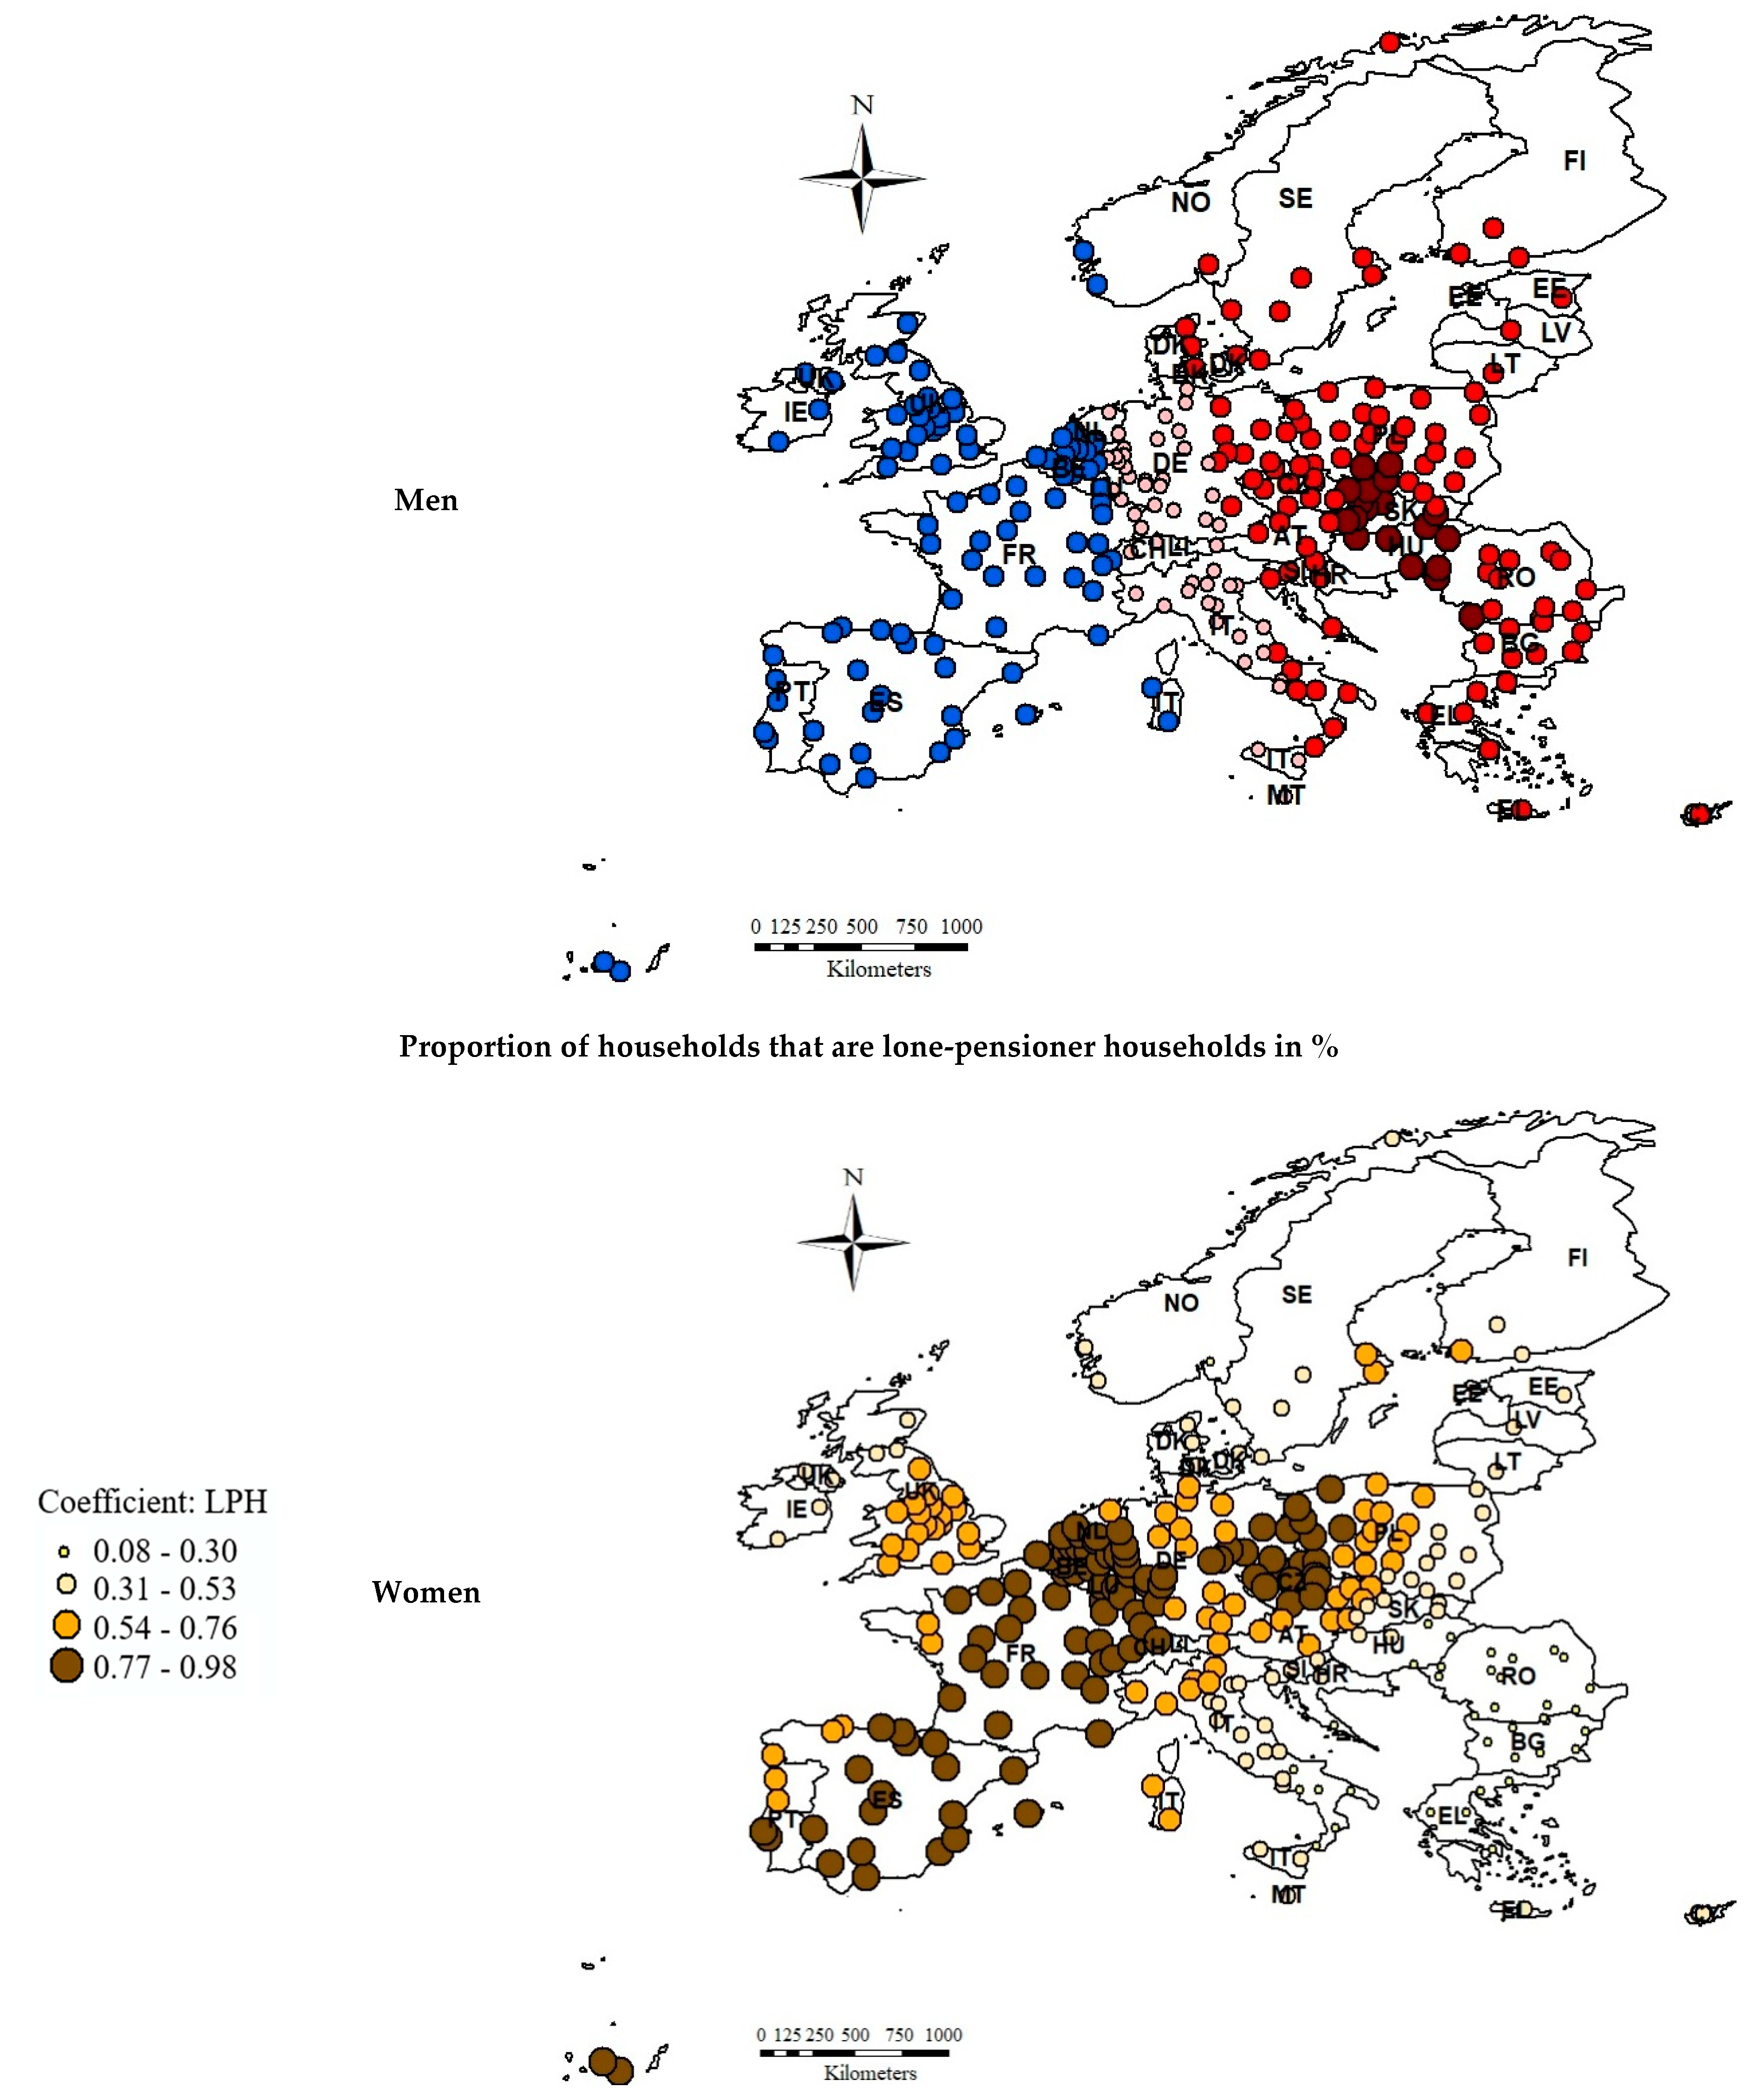
There was a positive correlation between the proportion of lone-pensioner households and the dependent variable in all the analyzed cities. The highest values of coefficients were observed for women in cities located in western Poland, the Czech Republic, the eastern and western parts of Germany, the Netherlands, Belgium, Luxembourg, Switzerland, France, Spain and southern Portugal—these cites formed a cluster throughout Europe, from east to west. The lowest impact was observed for men in eastern Europe, especially in cities located in Estonia, Lithuania, Latvia, eastern Poland, Slovakia, Hungary, Croatia, Romania, Bulgaria, Greece, and central and southern Italy. The lowest values of coefficients were also noticed in Ireland and the north of the United Kingdom. The problem of living alone at old age affects women much more often than men. This is mainly due to the fact that women generally live longer than men. The average life expectancy was 83.7 years for women and 78.2 years for men in the European Union in 2018 [69]. As a result of this phenomenon, there are more women than men in the European Union. In each analyzed city, the average proportion of women aged 65 or above in the population was significantly higher than that of men in the years 1991–2018. The highest differences in favor of women were recorded in Latvia (Riga, 42%), Estonia (Tallinn, 40.5%), Lithuania (Kaunas, 39%), Poland (Lodz, 37.7%) and Switzerland (Lausanne, 36.8%). In turn, the lowest differences were observed in Greece (Ioannina, 9.9%; Larisa, 11.6%; Kavala, 16.4%), Cyprus (Lefkosia, 13.6%) and Belgium (Brugge, 17.5%). Nevertheless, whether people live alone in later life largely depends on cultural conditions and cultivated traditions in individual countries/regions. A larger scale of this phenomenon is observed in highly developed Western European countries, which is the result of loosening social bonds [70], which has not been widely adopted in Eastern Europe. Elderly people, especially those who have lost their spouses, often stay with their families, which is confirmed by the spatial diversity of parameters.
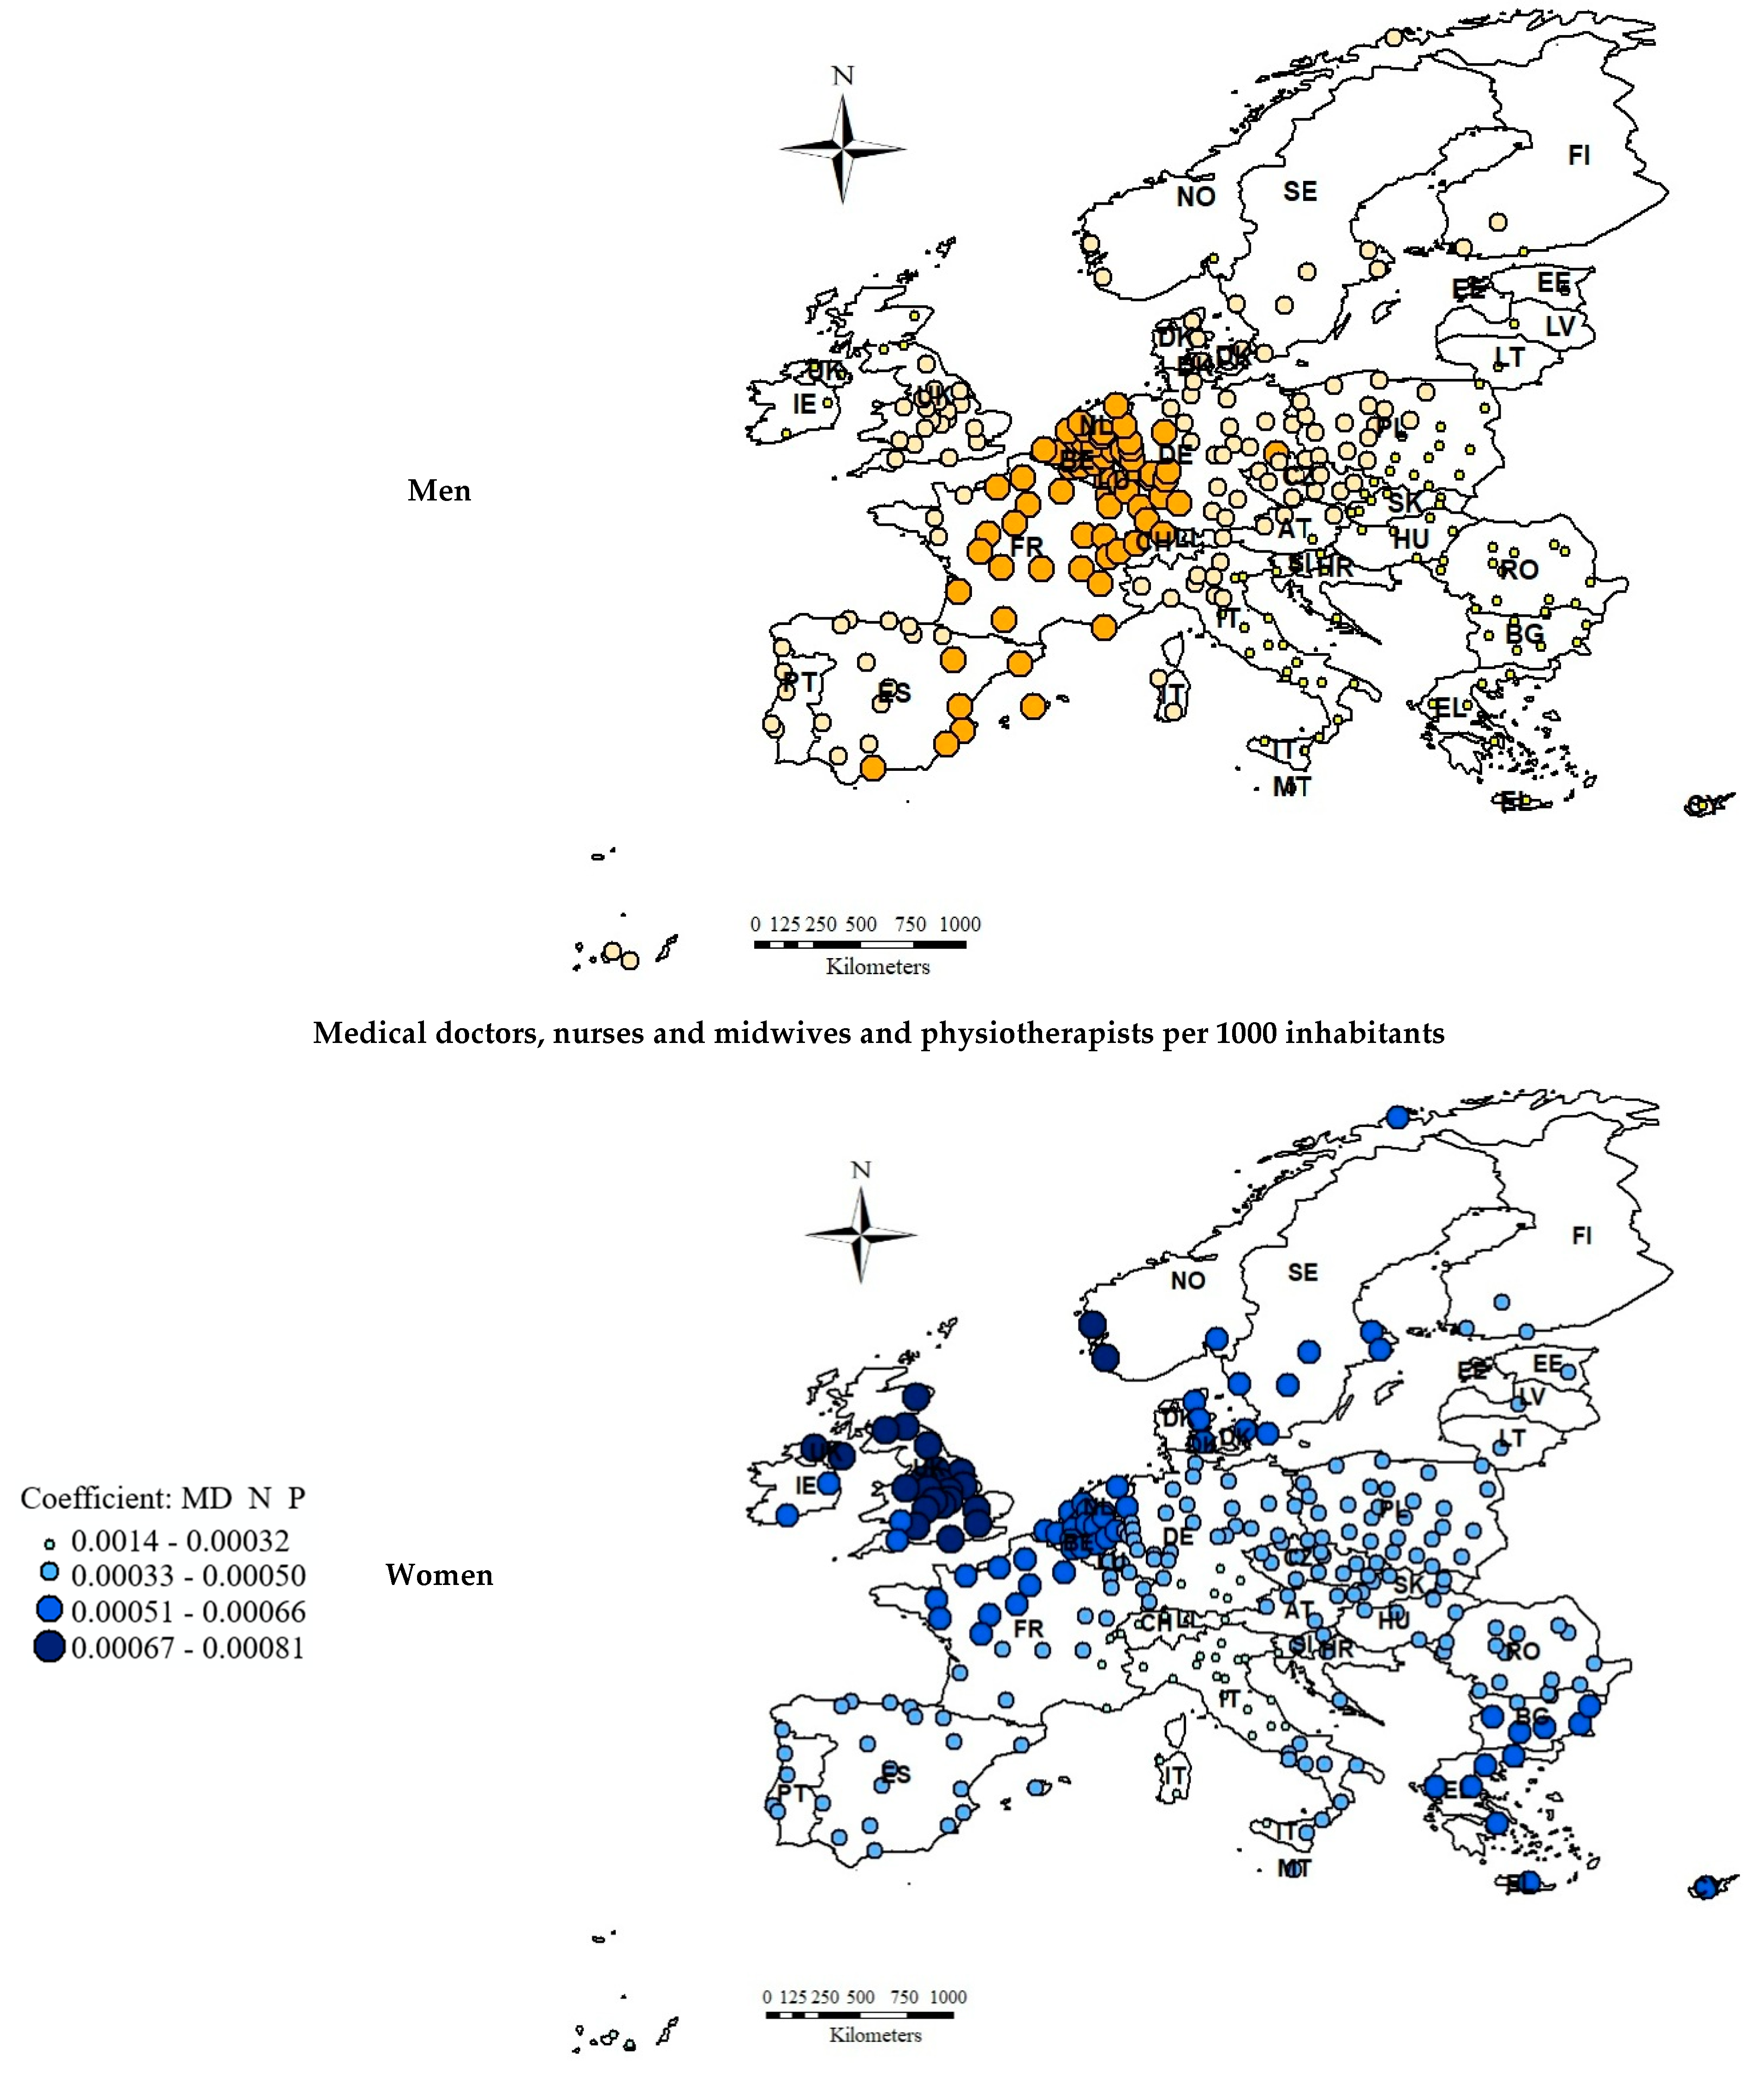
In the case of healthcare (medical doctors, nurses, midwives and physiotherapists per 1000 inhabitants), the relationship with the dependent variable was positive, but very weak for both women and men in all the analyzed cities. Nonetheless, the highest parameter values were recorded for women in cities located in the United Kingdom, Ireland and Norway. The lowest values, both for women and men, were noticed in southern Germany, Switzerland, eastern France, northern and central Italy and, additionally, in men alone, in central Poland, the Czech Republic and Austria. It is obvious that people live longer thanks to significant advances in healthcare. In addition to the technological progress made in medicine, access to qualified medical staff—doctors, nurses, physiotherapists, etc.—is of the utmost importance. Professional medical care not only extends people’s lives, but also improves their quality of life. Unfortunately, according to the World Health Organization, the number of healthcare workers in Europe may not be sufficient to cover the future health needs of the ageing population, despite an increase in the number of health workers in the past decade [71]. In addition, there is a large imbalance of healthcare professionals; for example, the largest number of medical doctors, nurses, midwives and physiotherapists per 1000 inhabitants in the analyzed period was recorded in German cities (Weimar, Frankfurt, Schwerin, Trier and Koblenz), while the lowest was recorded in Malta (Valletta), Latvia (Riga), Cyprus (Lefkosia), Estonia (Tallinn) and Croatia (Zagreb)—this difference is more than eightfold. The adjustment of the healthcare and long-term care systems, which require investment not only in medical research and new technologies, but also in qualified medical personnel, is now a big challenge which seems to be impossible to overcome despite a consistent increase in expenditure on healthcare in all European countries.
The last variable was statistically significant only for men. A negative correlation between the size of cities by population and the proportion of older men (aged 65 or above) in the population was observed in the south-eastern part of Europe—in Finland, Estonia, Latvia, Lithuania, Poland, Slovakia, Hungary, eastern Austria and the Czech Republic. The rest of the analyzed cities were characterized by a positive relationship between the two aforementioned variables. The highest coefficient values were noted in cities forming a cluster in the north-western parts of Europe, mostly in Ireland, the United Kingdom, France, the Netherlands, Belgium, Denmark and Switzerland. According to one of the Sustainable Development Goals, set by the United Nations General Assembly in 2015—Sustainable Cities and Communities—it is cities that give older people the chance to live longer and healthier lives. In large and developed cities, people have greater access to medicine, social care, long-term care, all kinds of services, shops and pharmacies, transport and communication. Living in such an environment enables people, despite some age restrictions, to remain active and self-sufficient [7]. Of course, the development of a senior-friendly environment requires high social awareness, high commitment from the authorities and actions in many sectors, which demand huge financial outlays. Perhaps that is why a positive relationship between the analyzed variables was recorded in the western part of Europe, which is characterized by higher socio-economic developments than the eastern part.
5. Conclusions
The main purpose of the research was to identify determinants of the population ageing process in 270 European cities in 1990–2018. The results indicate that the ageing process affected most of the analyzed cities (93%) and was strongly related to gender and city size. However, ageing took place in Europe at different rates for men and women. The average annual ageing rate of women was higher than that of men. The highest annual growth in the share of both men and women (aged 65 and above) was clearly marked in cities in Spain, Italy, the UK, Ireland, Poland and Germany. However, men living in cities in the Netherlands and Sweden aged faster which, in turn, was not observed for women. On the other hand, a markedly higher annual rate of growth in the number of women aged 65 or above than in the number of men of the same age was reported in cities in Belgium, Greece and Cyprus.
To understand the process of the urban ageing of men and women, we suggested a range of economic, demographic, social, transport, health and environmental factors. Based on the conducted research, it was proven that the ageing observed in European cities was highly spatially diverged. Thus, it was not possible to carry out the analysis of determinants using the OLS model. Therefore, the GWR approach was used, as it enabled us to analyze the variability in the strength and direction of dependencies occurring between the analyzed variables in individual cities. Separate models were built for women and men to show gender differences. The obtained results indicate significant differences between them; generally, the relationships among variables were stronger for women, although the size of cities by population turned out to be statistically significant only for men. The parameters in the models were characterized by large spatial diversity, which highlights the variety of the variables’ impact on the population ageing (separately for women and men) in individual cities. In most cases, similar parameter values were grouped in a geographical space forming city clusters, which were not confined to the territories of countries, but often divided Europe into western and eastern parts.
In the first step of the regression analysis, we suggested over 30 economic, social and environmental factors that could affect the population ageing of European cities in the years 1990–2018. Eventually, five of them were analyzed in the models. Based on the conducted research, it can be concluded that the decrease in the share of older people (both women and men) in the population was affected by the growth in crude birth rates per 1000 inhabitants in all the analyzed cities, whereas the increase in the levels of the analyzed variables was influenced by the increase in the proportion of lone-pensioner households as well as the number of medical doctors, nurses, midwives and physiotherapists per 1000 inhabitants in all the analyzed cities. In the case of two variables—cities by population and foreigners as a proportion of the population—both positive and negative correlations with the dependent variables were noted for selected cities (these results divided Europe into western and eastern parts). Therefore, it was proven that, e.g., international mobility could contribute to the process of population rejuvenation or ageing.
The urban ageing observed in Europe is a fact, however, in different European regions it takes on a different pace. This diversity is the result of local determinants or case-specific barriers to development. Therefore, there is no single universal concept of urban growth which could explain the ageing process in a given city. It is certain that diagnosing the reasons for ageing lies within the competence of local communities. Even though the objectives of ageing policies are created at national levels, many decisions should be made at a local municipal stage by local representatives, who know best the specific situation in their city. Hence, the results of this research may be relevant to institutional policy-makers and local self-governments that make efforts to search for solutions tailored to the challenges of the demographic situation they are faced with and will face in the future.
We are currently dealing with the coronavirus (COVID-19) worldwide epidemic, including Europe, where Spain, Italy, Germany, the United Kingdom and France are suffering the most. The elderly are at a greater risk of the disease, with mortality among them being the highest. Thus, we can expect changes in the population structure after 2019. For this reason, the continuation of research on the share of older people in the European population at various levels of administrative division (for countries, regions, cities), as well as the analysis of the phenomenon determinants is fully justified. Moreover, the preparation of a survey to obtain the self-reported data will be an opportunity to enrich future studies on urban ageing and life satisfaction of the elderly population. Finally, the analysis of the effects of COVID-19 in that regard will be needed and of great interest.
Author Contributions
Conceptualization, Karolina Lewandowska-Gwarda and Elżbieta Antczak; Methodology, Karolina Lewandowska-Gwarda and Elżbieta Antczak; Software, Karolina Lewandowska-Gwarda and Elżbieta Antczak; Validation, Karolina Lewandowska-Gwarda and Elżbieta Antczak; Formal analysis, Karolina Lewandowska-Gwarda and Elżbieta Antczak; Investigation, Karolina Lewandowska-Gwarda and Elżbieta Antczak; Resources, Karolina Lewandowska-Gwarda and Elżbieta Antczak; Data curation, Karolina Lewandowska-Gwarda and Elżbieta Antczak; Writing—original draft preparation, Karolina Lewandowska-Gwarda and Elżbieta Antczak; Writing—review and editing, Karolina Lewandowska-Gwarda and Elżbieta Antczak; Visualization, Karolina Lewandowska-Gwarda and Elżbieta Antczak; Supervision, Karolina Lewandowska-Gwarda and Elżbieta Antczak; Project administration, Karolina Lewandowska-Gwarda and Elżbieta Antczak; Funding acquisition, Karolina Lewandowska-Gwarda and Elżbieta Antczak. All authors have read and agreed to the published version of the manuscript.
Funding
This research received no external funding.
Conflicts of Interest
The authors declare no conflict of interest.
References
- Jones, S.E. Ageing and the City: Making Urban Spaces Work for Older People; HelpAge International: London, UK, 2016; Available online: http://www.nwtseniorssociety.ca/wp-content/uploads/2013/11/Ageing-and-City-Low-Res.pdf (accessed on 2 February 2020).
- World Health Organization. Available online: https://www.who.int/healthinfo/survey/ageingdefnolder/en/ (accessed on 2 February 2020).
- World Health Organization. Global Age-Friendly Cities: A Guide. Available online: https://www.who.int/ageing/publications/Global_age_friendly_cities_Guide_English.pdf (accessed on 2 February 2020).
- OECD. Available online: https://stats.oecd.org/viewhtml.aspx?datasetcode=CITIES&lang=en# (accessed on 2 February 2020).
- Monnier, A. Baby boomers: Towards the end of an era. Popul. Soc. 2007, 431, 1. [Google Scholar]
- Costa, D.L. Causes of improving health and longevity at older ages: A review of the explanations. Genus 2005, 61. [Google Scholar] [CrossRef]
- World Health Organization. Global Health and Ageing. Available online: https://www.who.int/ageing/publications/global_health.pdf (accessed on 2 February 2020).
- ESHRE Capri Workshop Group. Europe the continent with the lowest fertility. Hum. Reprod. Update 2010, 16, 590–602. [Google Scholar] [CrossRef] [PubMed] [Green Version]
- United Nations. World Population Ageing 2017. Available online: https://www.un.org/en/development/desa/population/publications/pdf/ageing/WPA2017_Highlights.pdf (accessed on 1 February 2020).
- Geller, A.M.; Zenick, H. Ageing and the environment: A research framework. Environ. Health Perspect. 2005, 113, 1257–1262. [Google Scholar] [CrossRef] [PubMed] [Green Version]
- Rogers, A.; Raymer, J. Immigration and the Regional Demographics of the Elderly Population in the United States. J. Geront. 2001, 56, 44–55. [Google Scholar] [CrossRef] [PubMed] [Green Version]
- Evans, B.; Palacios, R. Who is Poorer? Poverty by Age in the Developing World; World Bank: Washington, DC, USA, 2015. [Google Scholar]
- Kashnitsky, I.; de Beer, J.; van Wissen, L. Decomposition of regional convergence in population ageing across Europe. Genus 2017, 73, 2. [Google Scholar] [CrossRef] [Green Version]
- Leeson, G.W. The Growth, Ageing and Urbanisation of our World. Popul. Ageing 2018, 11, 107–115. [Google Scholar] [CrossRef] [Green Version]
- Šídlo, Ľ.; Šprocha, B.; Klapková, M. Regional differences in population ageing in Europe viewed through prospective indicators. Erdkune 2019, 73, 225–240. [Google Scholar] [CrossRef]
- Yang, L.; Zhao, K.; Fan, Z. Exploring Determinants of Population Ageing in Northeast China: From a Socio-Economic Perspective. Int. J. Environ. Res. Public Health 2019, 16, 4265. [Google Scholar] [CrossRef] [Green Version]
- Foster, L. Active Ageing, Pensions and Retirement in the UK. J. Popul. Ageing 2018, 11, 117–132. [Google Scholar] [CrossRef] [Green Version]
- Regan, J.C.; Partridge, L. Gender and longevity: Why do men die earlier than women? Comparative and experimental evidence. Best Pract. Res. Clin. Endocrinol. Metab. 2013, 27, 467–479. [Google Scholar] [CrossRef] [PubMed]
- Windhager, S.; Mitteroecker, P.; Rupić, I.; Lauc, T.; Polašek, O.; Schaefer, K. Facial aging trajectories: A common shape pattern in male and female faces is disrupted after menopause. Am. J. Phys. Anthropol. 2019, 169, 678–688. [Google Scholar] [CrossRef] [PubMed] [Green Version]
- Plouffe, L.; Kalache, A. Towards global age-friendly cities: Determining urban features that promote active ageing. J. Urban Health 2010, 87, 733–739. [Google Scholar] [CrossRef] [PubMed] [Green Version]
- Buffel, T.; Phillipson, C.; Scharf, T. Ageing in urban environments: Developing ‘age-friendly’ cities. Crit. Soc. Policy 2012, 32, 597–617. [Google Scholar] [CrossRef] [Green Version]
- Steels, S. Key characteristics of age-friendly cities and communities: A review. Cities 2015, 47, 45–52. [Google Scholar] [CrossRef] [Green Version]
- Moulaert, T.; Garon, S. Age-Friendly Cities and Communities in International Comparison: Political Lessons, Scientific Avenues, and Democratic Issues; Springer: Cham, Switzerland, 2016. [Google Scholar]
- Van Hoof, J.; Kazak, J.K.; Perek-Białas, J.M.; Peek, S.T.M. The Challenges of Urban Ageing: Making Cities Age-Friendly in Europe. Int. J. Environ. Res. Public Health 2018, 15, 2473. [Google Scholar] [CrossRef] [PubMed] [Green Version]
- Burian, J.; Zimmermannová, J.; Macků, K. Demographic Development Planning in Cities. In Spationomy; Pászto, V., Jürgens, C., Tominc, P., Burian, J., Eds.; Springer: Cham, Switzerland, 2020. [Google Scholar]
- Verderber, S.; Fine, D.J. Healthcare Architecture in an Era of Radical Transformation; Yale University Press: New Haven, CT, USA, 2000. [Google Scholar]
- Feddersen, E.; Lüdtke, I. Living for the Elderly: A Design Manual; Birkhäuser: Basel, Switzerland, 2009. [Google Scholar]
- Farrelly, L. Designing for the Third Age: Architecture Redefined for a Generation of “Active Agers”; John Wiley & Sons: Hoboken, NJ, USA, 2014. [Google Scholar]
- Simpson, D. Young-Old: Urban Utopias of an Ageing Society; Lars Muller Publishers: Baden, Switzerland, 2015. [Google Scholar]
- Park, J.; Porteus, J. Age-Friendly Housing: Future Design for Older People; RIBA Publishing: London, UK, 2018. [Google Scholar]
- Bowering, T. Ageing, Mobility and the City: Objects, Infrastructures and Practices in Everyday Assemblages of Civic Spaces in East London. Popul. Ageing 2019, 12, 151–177. [Google Scholar] [CrossRef] [Green Version]
- OECD. Demographic Change in the Netherlands: Strategies for Resilient Labour Markets. Available online: https://www.oecd.org/cfe/leed/Demo_change_netherlands_highlights.pdf (accessed on 2 February 2020).
- Cox, E.; Hendersonand, G.; Bake, R. Silver Citiesrealising the Potential of Ourgrowing Older Population. Available online: https://www.ippr.org/files/publications/pdf/silver-cities_Dec2014.pdf (accessed on 2 February 2020).
- Laperche, B.; Boutillier, S.; Djellal, F.; Ingham, M.; Liu, Z.; Picard, F.; Reboud, S.; Tanguy, C.; Uzunidis, D. Innovating for elderly people: The development of geront’innovations in the French silver economy. Technol. Anal. Strateg. Manag. 2019, 31, 462–476. [Google Scholar] [CrossRef]
- Beard, J.R.; Petitot, C. Ageing and Urbanization: Can Cities be Designed to Foster Active Ageing? Public Health Rev. 2010, 32, 427–450. [Google Scholar] [CrossRef] [Green Version]
- Galčanová, L.; Sýkorová, D. Socio-spatial aspects of ageing in an urban context: An example from three Czech Republic cities. Ageing Soc. 2015, 35, 1200–1220. [Google Scholar] [CrossRef]
- Jackisch, J.; Zamaro, G.; Green, G.; Huber, M. Is a healthy city also an age-friendly city? Health Promot. Int. 2015, 30, 108–117. [Google Scholar] [CrossRef] [PubMed] [Green Version]
- Turok, I.; Mykhnenko, V. Resurgent European cities? Urban Res. Pract. 2008, 1, 54–77. [Google Scholar] [CrossRef]
- Swiaczny, F.; Graze, F.; Schloemer, C. Spatial Impacts of Demographic Change in Germany—Urban Population Processes Reconsidered. Z. Bevoelkerungswissenschaft 2008, 33, 181–206. [Google Scholar] [CrossRef]
- Atkins, T.M.; Tonts, M. Exploring Cities through a Population Ageing Matrix: A spatial and temporal analysis of older adult population trends in Perth, Australia. Aust. Geogr. 2016, 47, 65–87. [Google Scholar] [CrossRef]
- Zainol, R.; Pettit, J.C. Elderly and Community Health Care Facilities: A Spatial Analysis. Geography 2016, 5. [Google Scholar] [CrossRef]
- Han, J.H.; Kim, J.-H. Variations in Ageing in Home and Ageing in Neighbourhood. Aust. Geogr. 2017, 48, 255–272. [Google Scholar] [CrossRef]
- Sabater, A.; Elspeth, G.; Finney, N. The Spatialities of Ageing: Evidencing Increasing Spatial Polarisation between Older and Younger Adults in England and Wales. Demogr. Res. 2017, 36, 731–744. [Google Scholar] [CrossRef] [Green Version]
- Antczak, E.; Lewandowska-Gwarda, K. How Fast Is Europe Getting Old? Analysis of Dynamics Applying the Spatial Shift–Share Approach. Sustainability 2019, 11, 5661. [Google Scholar] [CrossRef] [Green Version]
- Moraes, J.F.D.; Souza, V.B.A. Factors associated with the successful ageing of the socially-active elderly in the metropolitan region of Porto Alegre. Rev. Bras. Psiquiatr. 2005, 27, 302–308. [Google Scholar] [CrossRef]
- Raggi, A.; Corso, B.; Minicuci, N.; Quintas, R.; Sattin, D. Determinants of Quality of Life in Ageing Populations: Results from a Cross-Sectional Study in Finland, Poland and Spain. PLoS ONE 2016, 11, 1–17. [Google Scholar] [CrossRef] [Green Version]
- Kula, G.; Wójcik, P.T. Local Determinants of Population Ageing in Poland. Acta Univ. Lodz. Folia Oeconomica 2017, 3, 93–110. [Google Scholar]
- Stanojević-Jerković, O.; Skirmante, S.; Linas, Š.; Christopher, B.; Janko, K. Determinants of self-rated health in elderly populations in urban areas in Slovenia, Lithuania and UK: Findings of the EURO-URHIS 2 survey. Eur. J. Public Health 2015, 1–6. Available online: https://academic.oup.com/eurpub/article-lookup/doi/10.1093/eurpub/ckv097 (accessed on 20 March 2020).
- ACPA. Adapting European Cities to Population Ageing: Policy Challenges and Best Practices 2019. Available online: https://www.espon.eu/ACPA (accessed on 2 February 2020).
- Dijkstra, L.; Poelman, H. Cities in Europe the New OECD-EC Definition. Available online: https://ec.europa.eu/regional_policy/sources/docgener/focus/2012_01_city.pdf (accessed on 4 February 2020).
- World Bank. Available online: http://blogs.worldbank.org/opendata/new-country-classifications-income-level-2018-2019 (accessed on 4 February 2020).
- Nabielek, K.; Hamers, D. Cities in Europe Facts and Figures on Cities and Urban Areas. Available online: https://ec.europa.eu/futurium/en/system/files/ged/pbl_2016_cities_in_europe_23231.pdf (accessed on 4 February 2020).
- Kruskal, W.H.; Wallis, W.A. Use of ranks in one-criterion variance analysis. J. Am. Stat. Assoc. 1952, 47, 583–621. [Google Scholar] [CrossRef]
- Anselin, L.; Florax, R.J. New Directions in Spatial Econometrics; Springer Science & Business Media: Berlin, Germany, 1995. [Google Scholar]
- Getis, A.; Jared, A. Constructing the Spatial Weights Matrix Using a Local Statistic. Geogr. Anal. 2004, 36, 90–104. [Google Scholar] [CrossRef]
- Brunsdon, C.; Fotheringham, A.S.; Charlton, M. Geographically Weighted Regression: A Method for Exploring Spatial Nonstationarity. Geogr. Anal. 1996, 28, 281–298. [Google Scholar] [CrossRef]
- Charlton, M.; Fotheringham, A.S. Geographically Weighted Regression. Available online: http://gwr.nuim.ie/downloads/GWR_WhitePaper.pdf (accessed on 20 March 2020).
- Fotheringham, A.S.; Brunsdon, C.; Charlton, M. Geographically Weighted Regression: The Analysis of Spatially Varying Relationships; John Wiley & Sons: Hoboken, NJ, USA, 2003. [Google Scholar]
- Tobler, W. A computer movie simulating urban growth in the Detroit region. Econ. Geogr. 1970, 46, 234–240. [Google Scholar] [CrossRef]
- Mennis, J. Mapping the Results of Geographically Weighted Regression. Cartogr. J. 2006, 43, 171–179. [Google Scholar] [CrossRef] [Green Version]
- Charlton, M.; Fotheringham, A.S. Geographically Weighted Regression. A Tutorial on Using GWR in ArcGIS 9.3. Available online: https://www.geos.ed.ac.uk/~gisteac/fcl/gwr/gwr_arcgis/GWR_Tutorial.pdf (accessed on 20 March 2020).
- Yu, D.-L. Spatially varying development mechanisms in the Greater Beijing area: A geographically weighted regression investigation. Ann. Reg. Sci. 2006, 40, 173–190. [Google Scholar] [CrossRef]
- Akinwande, M.O.; Dikko, H.G.; Samson, A. Variance Inflation Factor: As a Condition for the Inclusion of Suppressor Variable(s) in Regression Analysis. Open J. Stat. 2015, 5, 754–767. [Google Scholar] [CrossRef] [Green Version]
- Wheeler, D.; Tiefelsdorf, M. Multicollinearity and Correlation among Regression Coeffcients in Geographically Weighted Regression. J. Geogr. Syst. 2005, 7, 161–187. [Google Scholar] [CrossRef]
- European Commission. The 2015 Ageing Report. Economic and budgetary projections for the 28 EU Member States (2013–2060). Eur. Econ. 2015, 3, 2015. [Google Scholar]
- The World Bank. Available online: https://data.worldbank.org/indicator/SP.DYN.CBRT.IN?locations=XC (accessed on 9 April 2020).
- Eurostat. Available online: https://ec.europa.eu/eurostat/tgm/table.do?tab=table&init=1&plugin=1&pcode=tps00199&language=en (accessed on 9 April 2020).
- Fihel, A.; Janicka, A.; Kloc-Nowak, W. The direct and indirect impact of international migration on the population ageing process: A formal analysis and its application to Poland. Demogr. Res. 2018, 38, 1303–1338. [Google Scholar] [CrossRef]
- Eurostat. Available online: http://appsso.eurostat.ec.europa.eu/nui/submitViewTableAction.do (accessed on 15 April 2020).
- Reher, D.; Requena, M. Living Alone in Later Life: A Global Perspective. Popul. Dev. Rev. 2018, 44, 427–454. [Google Scholar] [CrossRef] [Green Version]
- World Health Organization. Available online: http://www.euro.who.int/en/health-topics/Health-systems/health-workforce/data-and-statistics (accessed on 15 April 2020).
Figure 1.
Structure of the analyzed selected European cities.

Figure 2.
Dynamics of the men (a) and women (b) ageing process in European cities in the years 1990–2018 (annual averaged indices). Source: Own elaboration in ArcGIS (ArcMap 10.5).
Figure 2.
Dynamics of the men (a) and women (b) ageing process in European cities in the years 1990–2018 (annual averaged indices). Source: Own elaboration in ArcGIS (ArcMap 10.5).
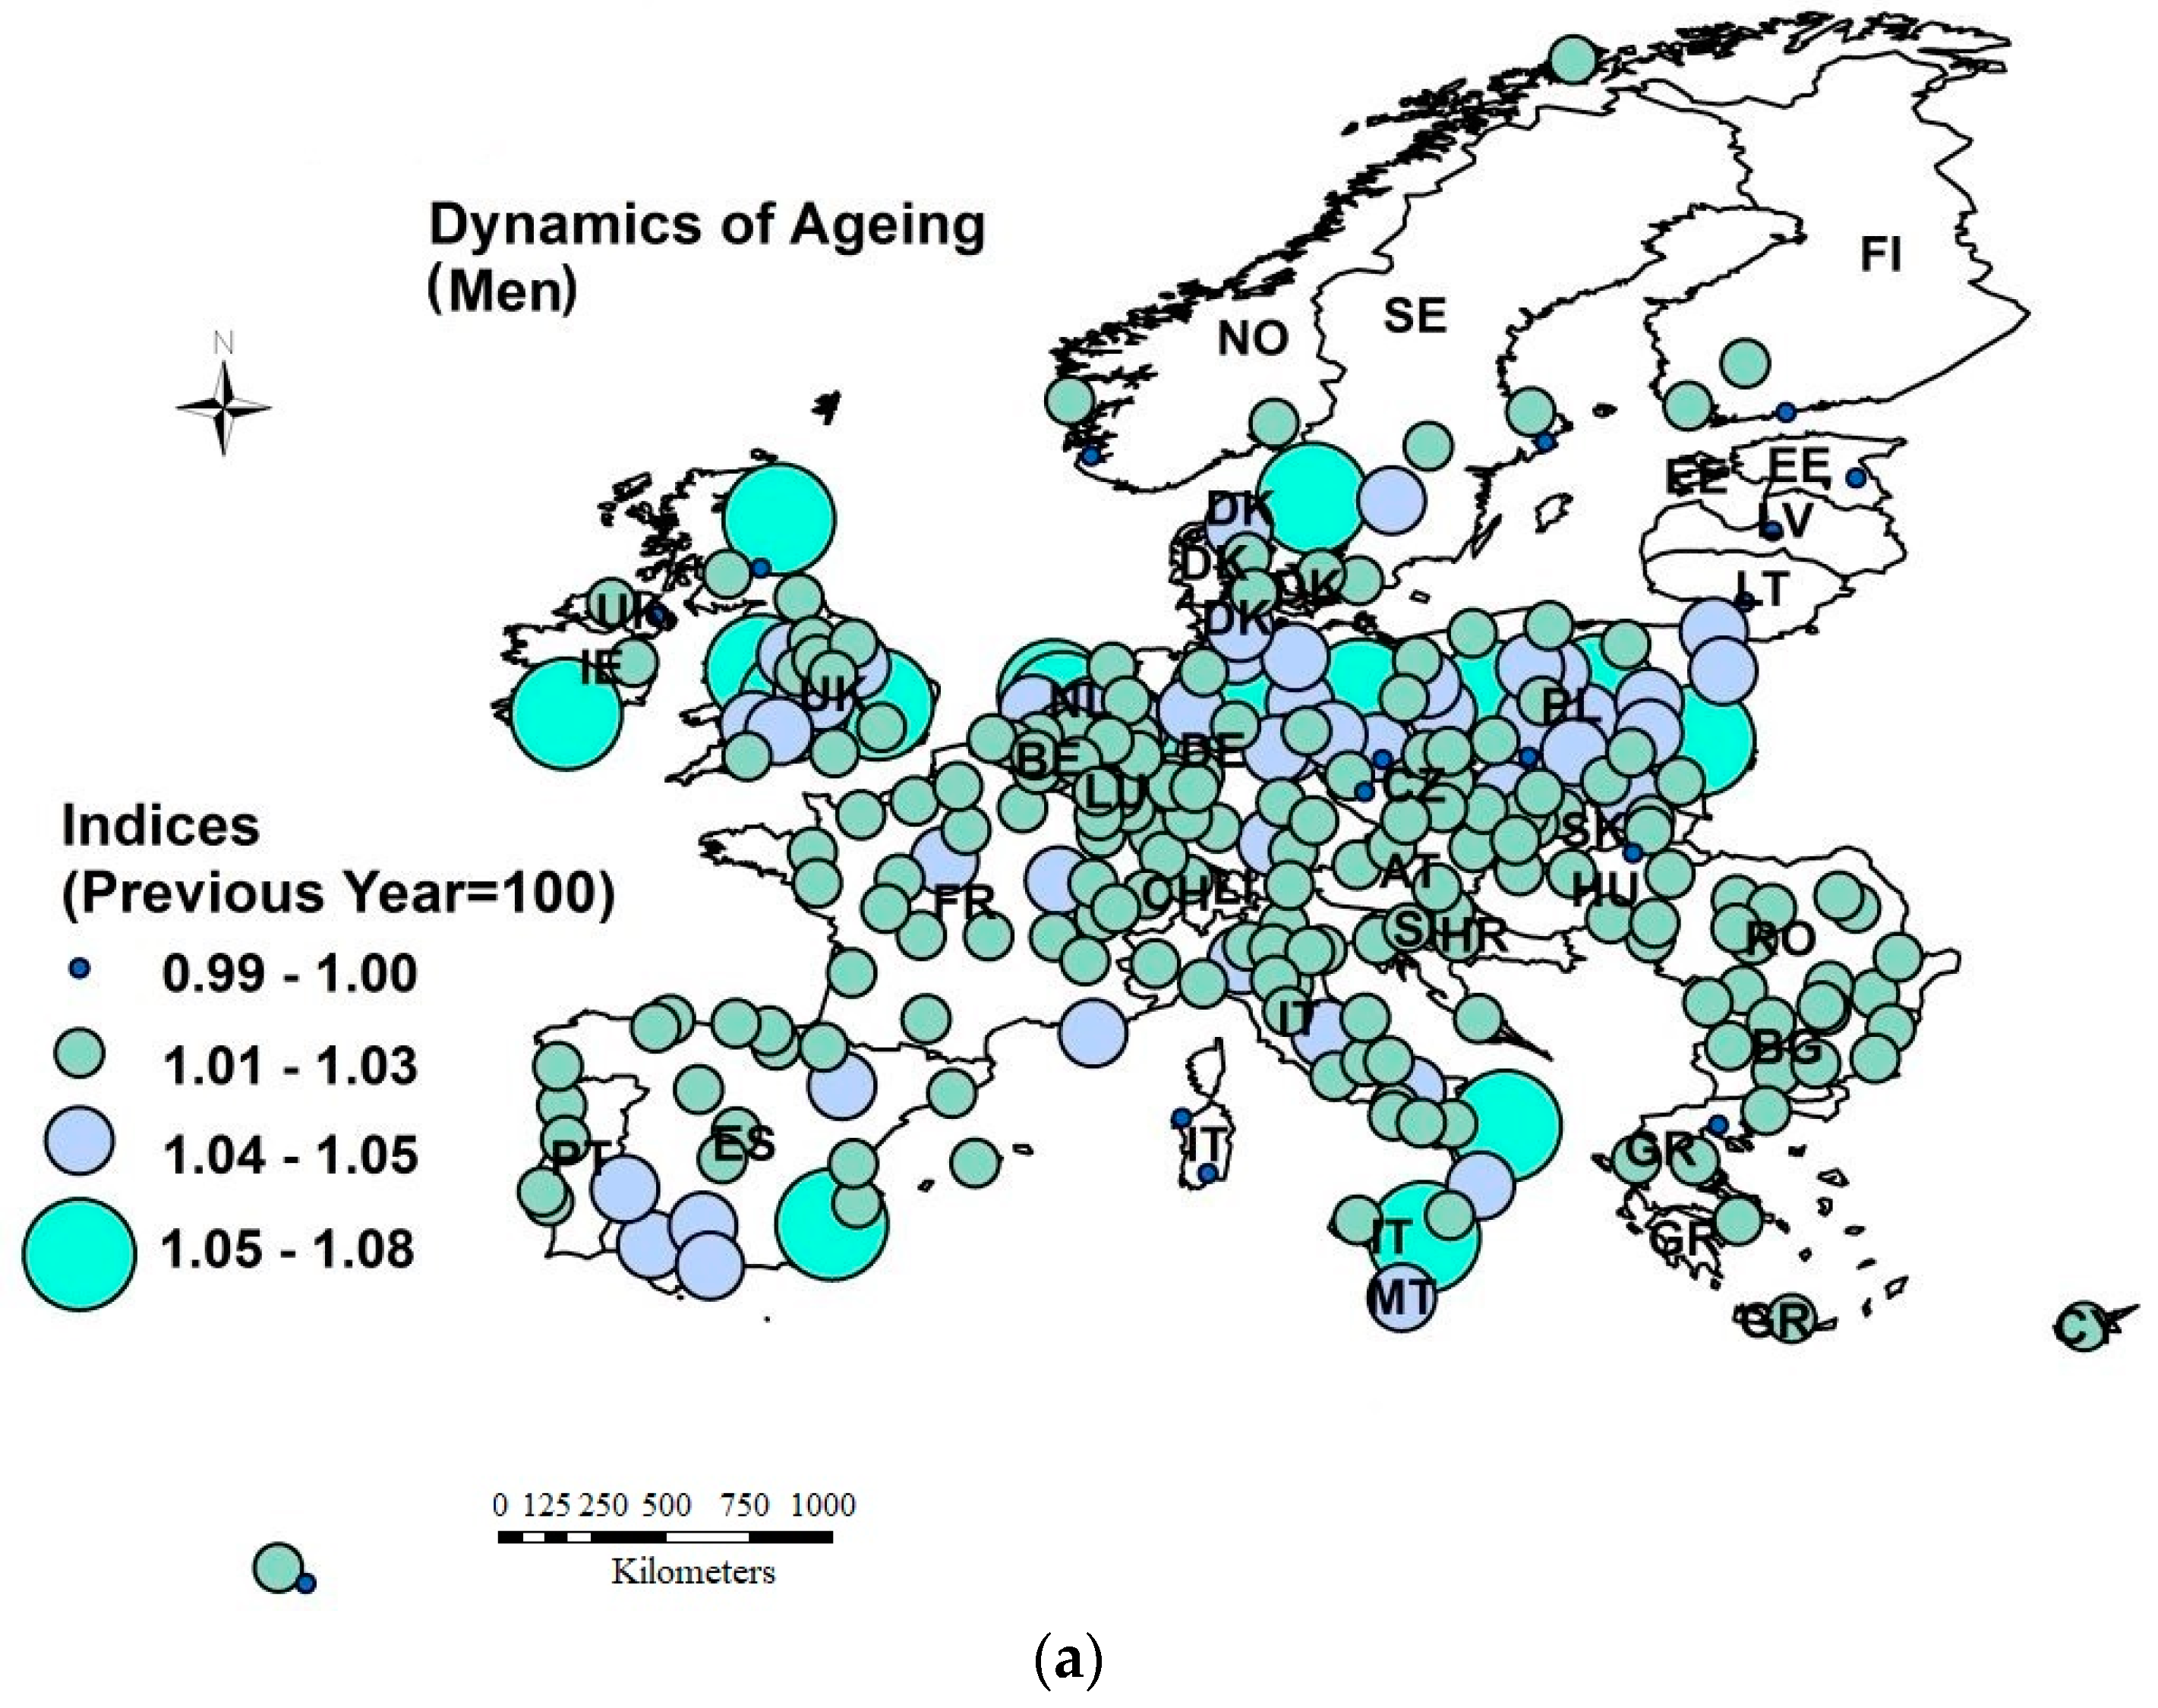

Figure 3.
The spatial autocorrelation of the proportion of older men (a) and women (b) aged 65 or above measured by Moran’s I statistic (averaged over the years 1990–2018). Source: Own elaboration in GeoDa and ArcGIS (ArcMap 10.5). Note: significance level: α = 0.01***; we used the threshold distance of 962 km and row standardized spatial matrix [55]. A comprehensive spatial weighting scheme for LISA (local indicators of spatial association) is available by email. In brackets we indicted the number of cities characterized by the LISA indices.

Figure 4.
Local values of coefficients in the GWR models. Source: Own elaboration in ArcGIS (ArcMap 10.5).
Figure 4.
Local values of coefficients in the GWR models. Source: Own elaboration in ArcGIS (ArcMap 10.5).


Table 1.
Statistics of the population of older people (aged 65 or above) data by gender, size of city and level of economic development (average over years 1990–2018).
Table 1.
Statistics of the population of older people (aged 65 or above) data by gender, size of city and level of economic development (average over years 1990–2018).
| Men | ||||||
| Mean | Median | CV | Min | Max | ANOVA Kruskal-Wallis | |
| Total | 13.1 | 12.9 | 21% | 7.7 | 20.1 | |
| <100,000 inhabitants | 14.2 | 14.2 | 14% | 10.7 | 19.0 | |
| 100,000–250,000 | 15.0 | 14.7 | 18% | 8.8 | 22.9 | |
| 250,000–500,000 | 14.4 | 13.8 | 27% | 8.2 | 23.3 | 71.21 *** |
| 500,000–1,000,000 | 11.7 | 11.1 | 20% | 7.9 | 18.3 | |
| >1,000,000 people | 12.4 | 12.8 | 12% | 9.2 | 14.5 | |
| Lower–middle income | 13.5 | 13.7 | 7% | 12.3 | 14.9 | |
| Upper–middle income | 15.2 | 15.3 | 14% | 8.8 | 19.0 | 29.63 *** |
| High income | 13.9 | 13.1 | 23% | 7.9 | 23.3 | |
| Women | ||||||
| Mean | Median | CV | Min | Max | ANOVA Kruskal-Wallis | |
| Total | 18.1 | 18.2 | 22% | 10.0 | 27.3 | |
| <100,000 inhabitants | 20.0 | 19.0 | 13% | 12.4 | 26.1 | |
| 100,000–250,000 | 19.1 | 19.0 | 17% | 13.1 | 29.5 | 1.71 |
| 250,000–500,000 | 18.5 | 18.1 | 21% | 12.7 | 29.4 | |
| 500,000–1,000,000 | 19.8 | 18.4 | 25% | 10.3 | 30.6 | |
| >1,000,000 people | 20.0 | 20.3 | 10% | 12.5 | 31.5 | |
| Lower–middle income | 19.0 | 19.2 | 6% | 16.7 | 20.1 | |
| Upper–middle income | 20.1 | 18.9 | 13% | 12.4 | 26.1 | 2.15 |
| High income | 19.1 | 19.5 | 22% | 10.3 | 31.5 | |
| Men versus women | ||||||
| Mean | Median | CV | Min | Max | Mann–Whitney U | |
| Total | 15.0 | 15.1 | 34% | 5.5 | 23.5 | 13,250 *** |
| <100,000 inhabitants | 16.1 | 16.3 | 22% | 11.0 | 26.3 | 191 *** |
| 100,000–250,000 | 17.0 | 16.6 | 23% | 9.2 | 27.5 | 2893 *** |
| 250,000–500,000 | 16.9 | 16.8 | 17% | 12.0 | 24.3 | 591 *** |
| 500,000–1,000,000 | 17.0 | 15.8 | 21% | 10.6 | 26.0 | 212 *** |
| >1,000,000 people | 16.9 | 17.3 | 17% | 12.5 | 21.2 | 58 *** |
| Lower–middle income | 16.1 | 15.5 | 16% | 13.1 | 20.4 | 17 *** |
| Upper–middle income | 16.7 | 17.0 | 18% | 10.5 | 24.0 | 411 *** |
| High income | 17.0 | 16.5 | 22% | 9.2 | 27.5 | 8383 *** |
Note: n = 270 cities; CV is the coefficient of variation; significance level: α = 0.01 ***; we used non-parametric statistics because the carried out test of normality (here the Shapiro–Wilk test) rejected the null hypothesis for most of the variables; we also conducted the post-hoc analysis for Kruskal–Wallis (the Dunn’s multiple comparison test) [53]. The Dunn’s test was not statistically significant for the share of elderly women with regards to either the city size or the economic development level; however, it confirmed the differences in the proportion of the male population in cities of different sizes or income levels. The results are available via e-mail.
Table 2.
Potential determinants of the proportion of elderly people (aged 65 or above) who live in European cities.
Table 2.
Potential determinants of the proportion of elderly people (aged 65 or above) who live in European cities.
| Variable | Description | Time Span | Group |
|---|---|---|---|
| IM | Infant mortality per year | 1991–2018 | Demography |
| CDR | Crude death rate per 1000 inhabitants | 1991–2018 | Demography |
| CBR | Crude birth rate per 1000 inhabitants | 1991–2018 | Demography |
| IMR | Infant mortality rate per 1000 live births | 1991–2018 | Demography |
| AEOL | Average area of living accommodation in m2/person | 1992–2018 | Living conditions |
| MI | Median disposable annual household income in EUR per capita | 1991–2019 | Living conditions |
| DHI | Average disposable annual household income in EUR per capita | 1998–2019 | Living conditions |
| VLWI | Share of persons living in households with very low work intensity in % | 2008–2018 | Living conditions |
| ROPST | Share of persons at risk of poverty after social transfers in % | 2008–2018 | Living conditions |
| LPH | Proportion of households that are lone-pensioner households in % | 1991–2018 | Living conditions |
| SHE | Share of students in higher education in the total population (per 1000 persons) | 1990–2018 | Education |
| WAP3_4 | Proportion of working age population qualified at level 3 or 4 ISCED in % | 1996–2018 | Education |
| EDU25_64 | Proportion of population aged 25–64 qualified at level 5 to 8 ISCED, from 2014 onwards in % | 1996–2018 | Education |
| city | Size of cities due to population: 2—below 100,000, 3—between 100,000–250,000, 4—between 250,000–500,000, 5—between 500,000–1,000,000, 6—above 1,000,000; | 1990–2018 | City size |
| PL | Number of public libraries (all distribution points) | 1990–2018 | Culture and tourism |
| CS | Number of cinema seats per 1000 residents | 1990–2018 | Culture and tourism |
| AB | Number of available beds per 1000 residents | 1990–2018 | Culture and tourism |
| TNS | Total nights spent in tourist accommodation establishments per resident population | 1990–2018 | Culture and tourism |
| UR | Unemployment rate | 1991–2018 | Labour market |
| AR | Activity rate | 1996–2018 | Labour market |
| PAF | Proportion of employment in agriculture fishery in % | 1991–2018 | Labour market |
| PEI | Proportion of employment in industries in % | 1991–2018 | Labour market |
| NP | Nationals as a proportion of population in % | 1991–2018 | Migration |
| FP | Foreigners as a proportion of population in % | 2000–2018 | Migration |
| BIC | Length of bicycle network (dedicated cycle paths and lanes in km) | 2001–2018 | Transport |
| RC | Number of registered cars per 1000 population | 1991–2019 | Transport |
| PCRA | People killed in road accidents per 10,000 pop. | 1996–2019 | Transport |
| SUN | Total number of hours of sunshine per day | 1990–2018 | Environment |
| PM10_EXC | Number of days particulate matter PM10 concentrations exceed 50 µg/m3 | 1996–2013 | Environment |
| AACPM10 | Annual average concentration of PM10 (µg/m3) | 1996–2013 | Environment |
| CPW | Share of population connected to potable drinking water system in % | 2008–2016 | Environment |
| STS | Share of population connected to sewerage treatment system in % | 2004–2016 | Environment |
| GUASL | Share of land (in %): green urban areas and sports and leisure facilities | 2012–2014 | Environment |
| NA | Share of land (in %): natural areas | 2012–2014 | Environment |
| MD_N_P | Medical doctors, nurses, midwives and physiotherapists per 1000 inhabitants | 1993–2018 | Health |
Note: we are aware that more factors, such as self-reported data of health and urban life satisfaction, affecting the elderly are also relevant in this analysis. However, the poor availability of urban ageing statistics determined us to prepare a survey to obtain this information in the future.
Table 3.
Ordinary least squares (OLS) and geographically weighted regression (GWR) diagnostics.
| Diagnostics | Women | Men | ||
|---|---|---|---|---|
| Global Regression (OLS) | GWR | Global Regression (OLS) | GWR | |
| R-Squared | 0.41 | 0.66 | 0.37 | 0.65 |
| Adjusted R-Squared | 0.40 | 0.62 | 0.36 | 0.61 |
| AICc | 1461.56 | 1351.97 | 1325.30 | 1199.77 |
| Moran’s I | 0.085 (0.00) * | 0.008 (0.67) | 0.114 (0.00) * | 0.005 (0.48) |
| Joint Wald Statistics | 247.76 (0.00) * | 169.82 (0.00) * | ||
| Koenker (BP) Statistic | 21.80 (0.00) * | 15.62 (0.00) * | ||
| Jarque-Bera Statistics | 3.65 (0.17) | 0.52 (0.77) | ||
Note: p-values are given in brackets; * statistically significant at level: α = 0.05.
Table 4.
Summary of OLS results.
| Variable | Women | Men | ||||
|---|---|---|---|---|---|---|
| Coefficient | t-Statistic | VIF | Coefficient | t-Statistic | VIF | |
| Intercept | 11.26 | 8.29 | 7.31 | 6.12 | ||
| CBR | −0.40 | −4.72 | 1.13 | −0.24 | −3.63 | 1.13 |
| FP | 0.14 | 4.12 | 1.24 | 0.08 | 3.10 | 1.32 |
| LPH | 0.46 | 5.68 | 1.18 | 0.24 | 3.70 | 1.22 |
| MD_N_P | 0.00059 | 7.60 | 1.06 | 0.00054 | 8.18 | 1.28 |
| city | - | - | 0.40 | 2.44 | 1.34 | |
© 2020 by the authors. Licensee MDPI, Basel, Switzerland. This article is an open access article distributed under the terms and conditions of the Creative Commons Attribution (CC BY) license (http://creativecommons.org/licenses/by/4.0/).
Share and Cite
MDPI and ACS Style
Lewandowska-Gwarda, K.; Antczak, E. Urban Ageing in Europe—Spatiotemporal Analysis of Determinants. ISPRS Int. J. Geo-Inf. 2020, 9, 413. https://doi.org/10.3390/ijgi9070413
AMA Style
Lewandowska-Gwarda K, Antczak E. Urban Ageing in Europe—Spatiotemporal Analysis of Determinants. ISPRS International Journal of Geo-Information. 2020; 9(7):413. https://doi.org/10.3390/ijgi9070413
Chicago/Turabian StyleLewandowska-Gwarda, Karolina, and Elżbieta Antczak. 2020. "Urban Ageing in Europe—Spatiotemporal Analysis of Determinants" ISPRS International Journal of Geo-Information 9, no. 7: 413. https://doi.org/10.3390/ijgi9070413
Note that from the first issue of 2016, this journal uses article numbers instead of page numbers. See further details here.