Affective Communication of Map Symbols: A Semantic Differential Analysis


Abstract
1. Introduction
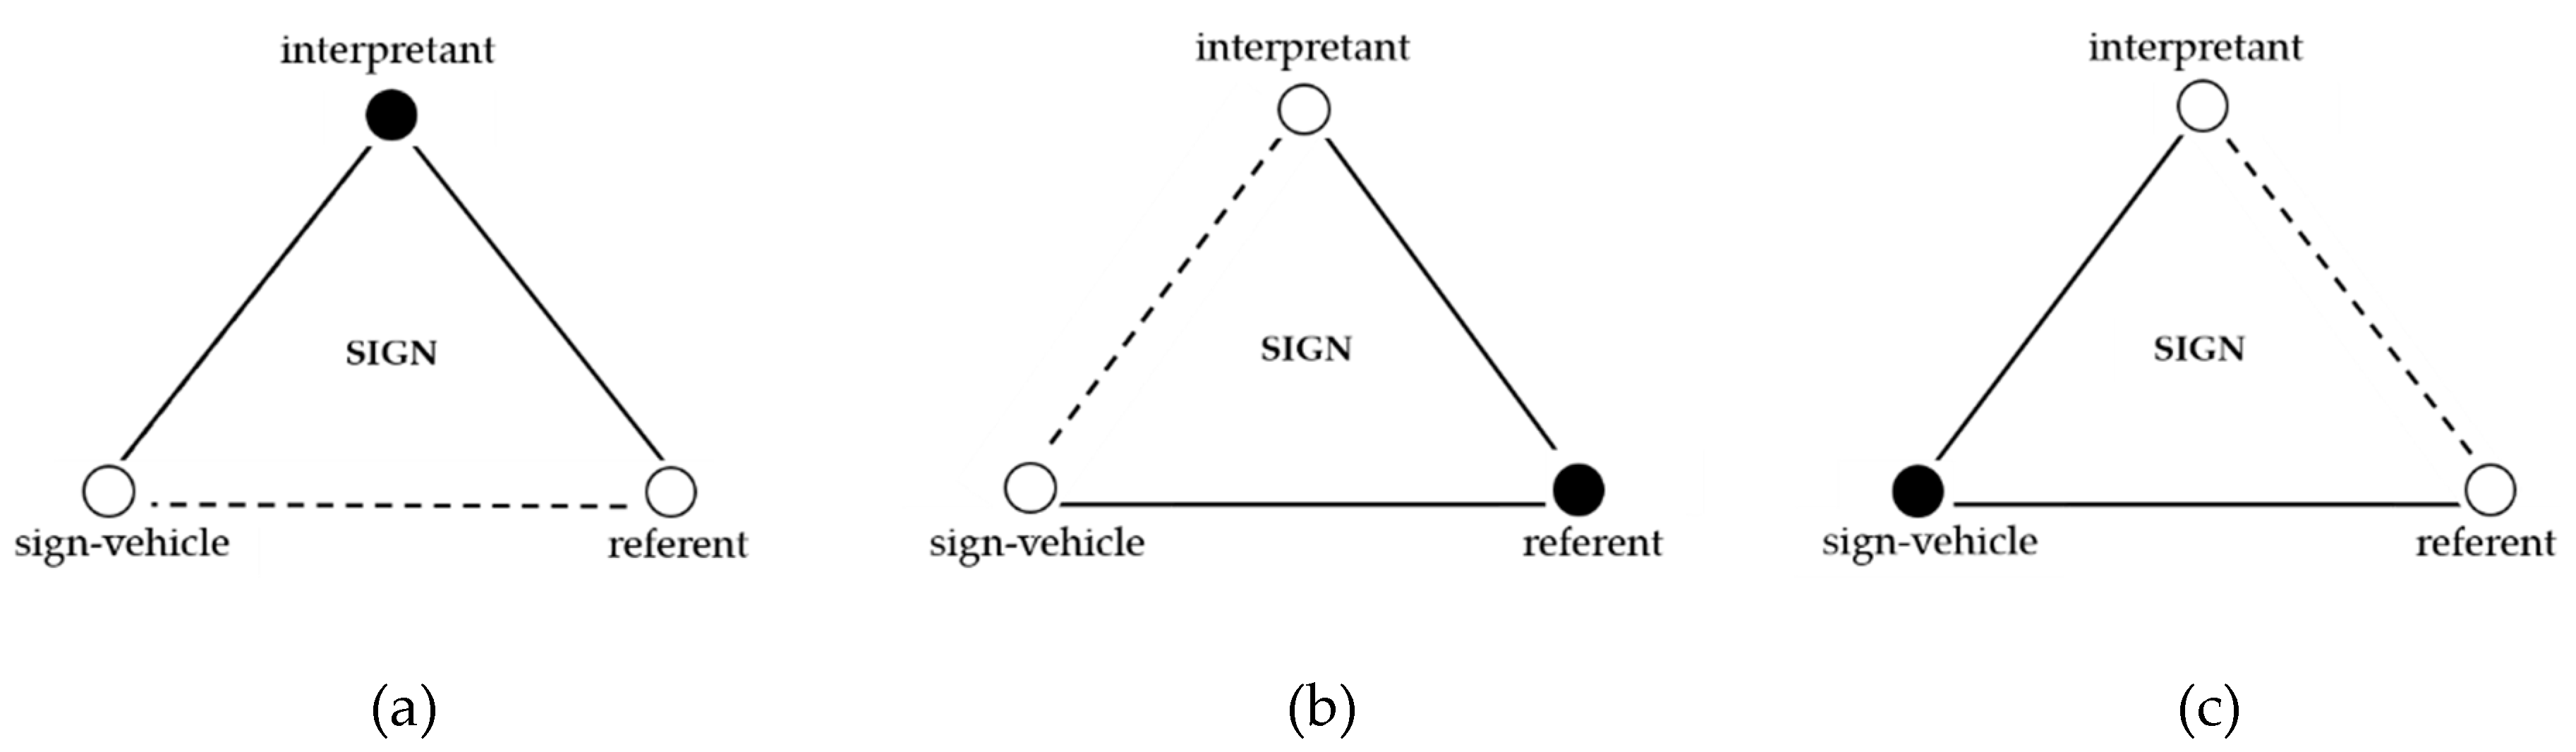
2. Theoretical Background
3. Materials and Methods
3.1. Materials and Study Design
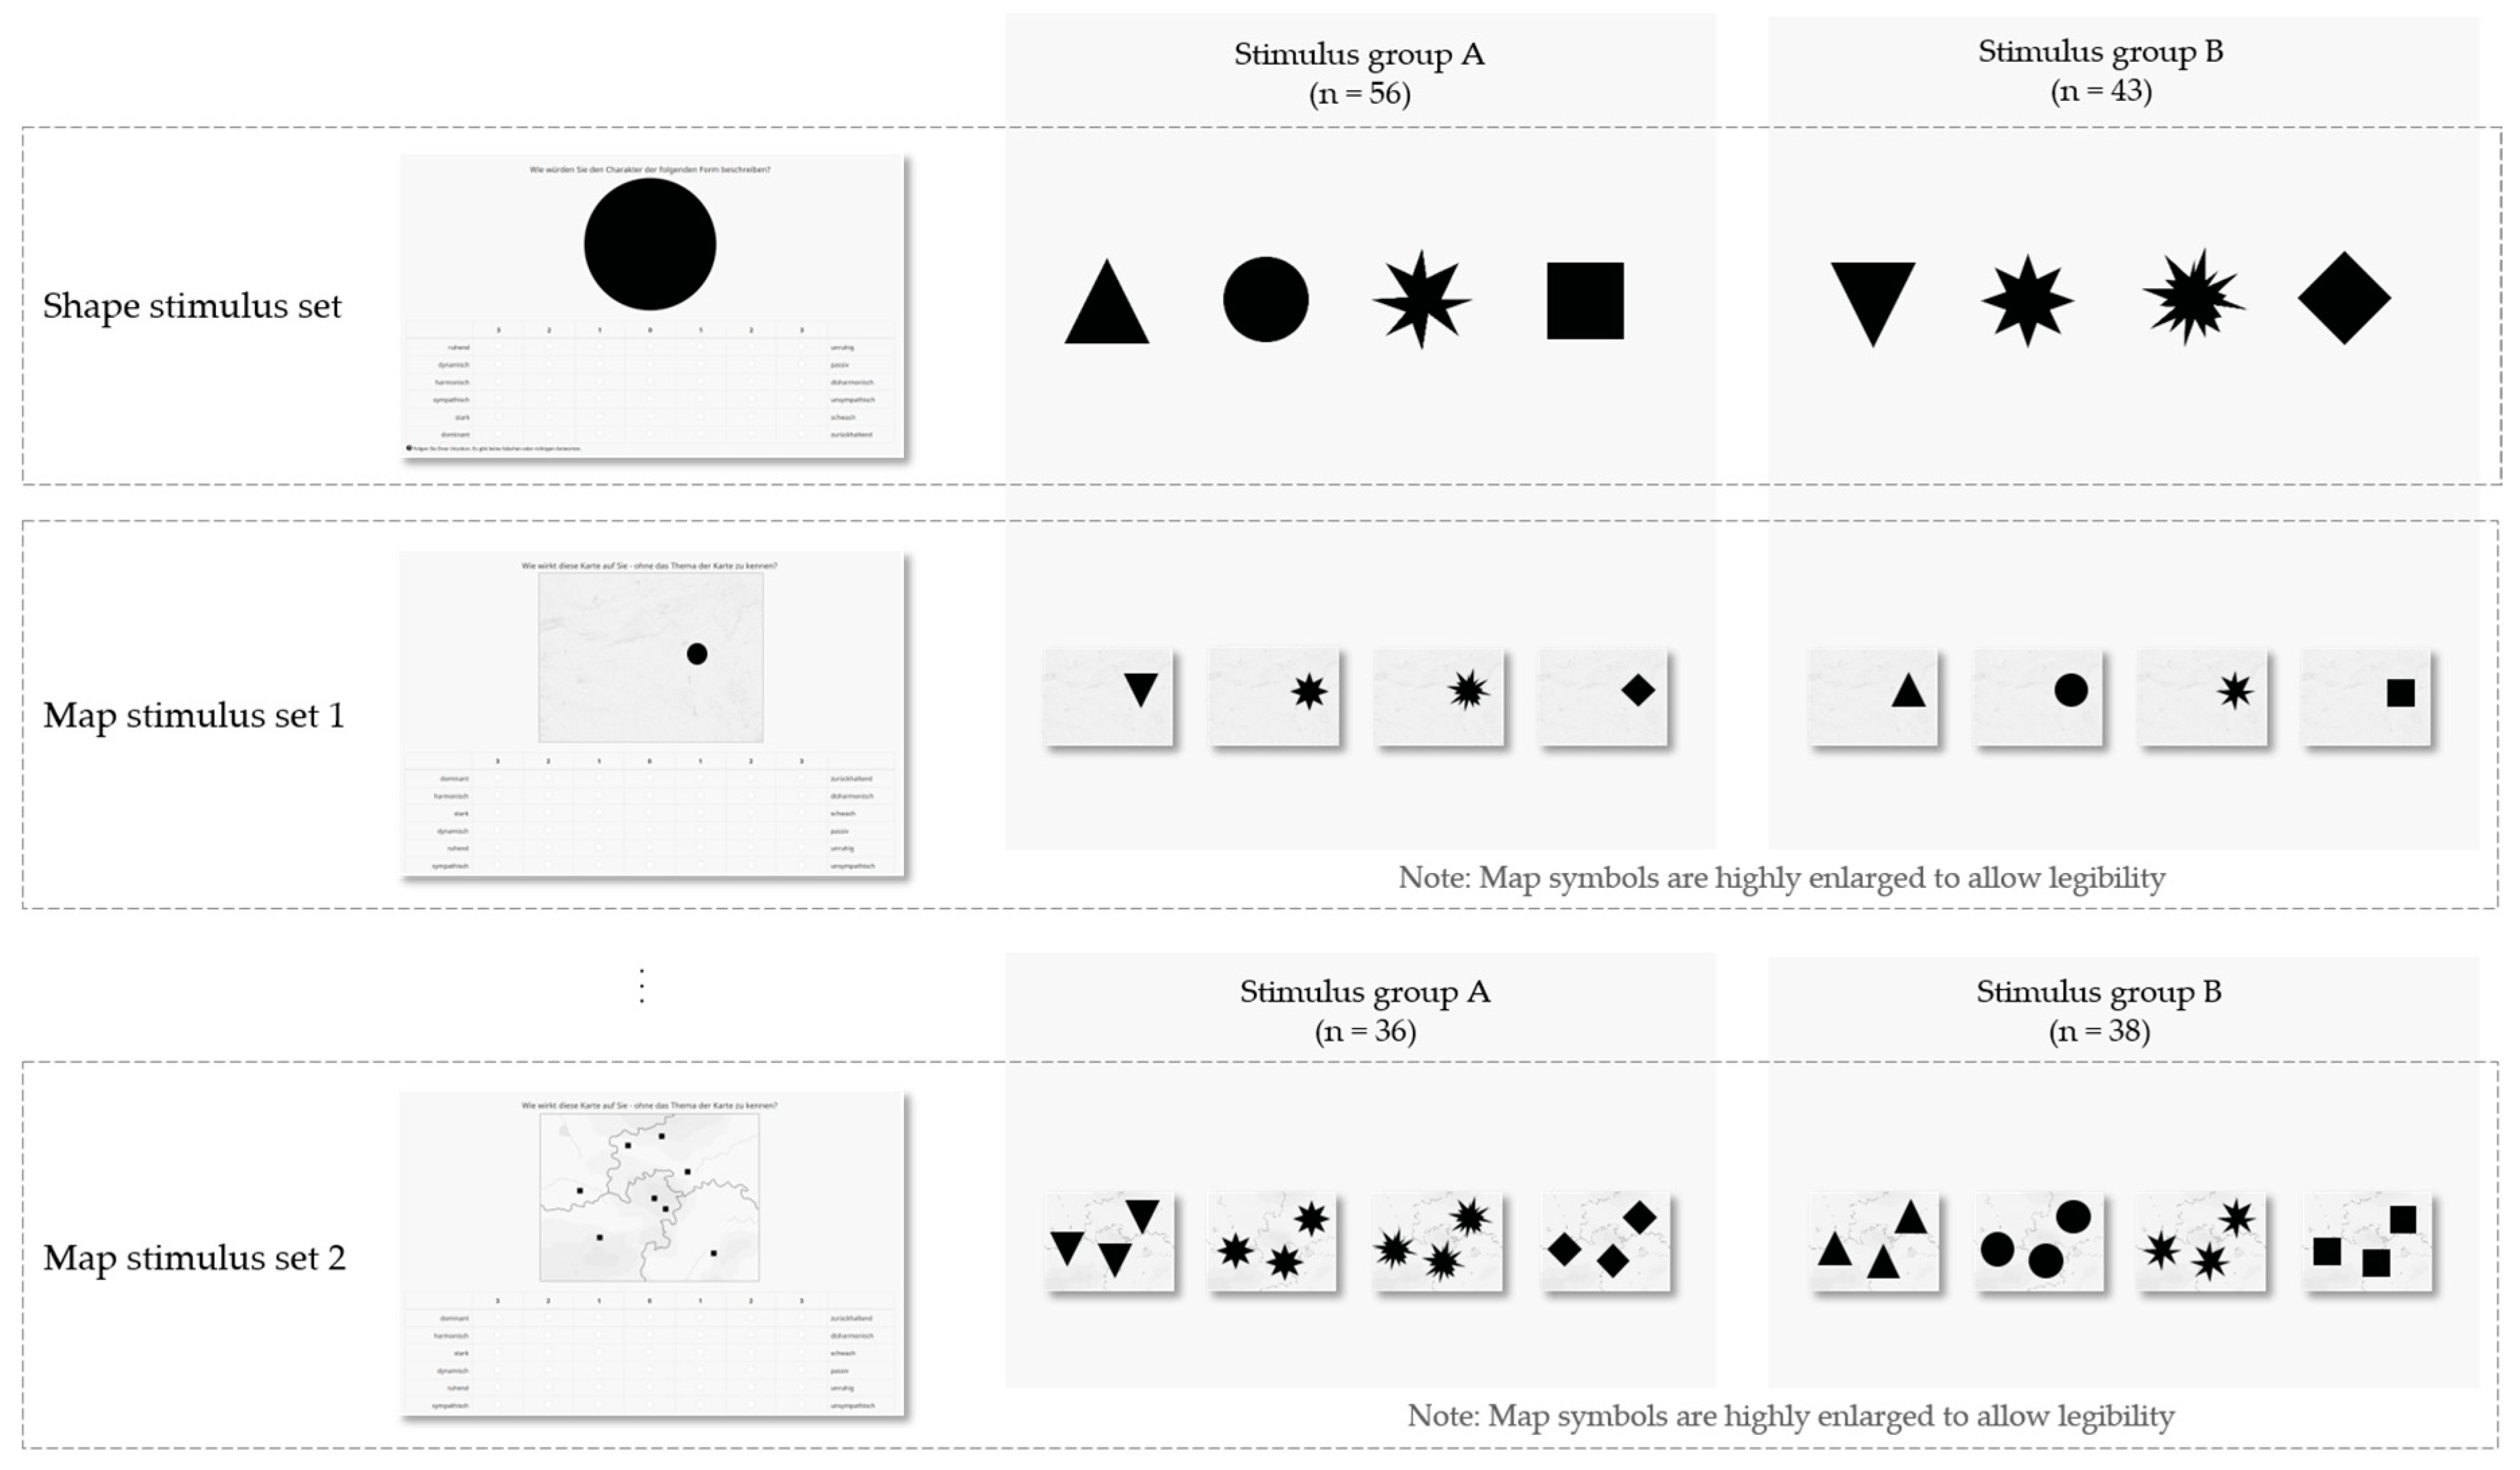
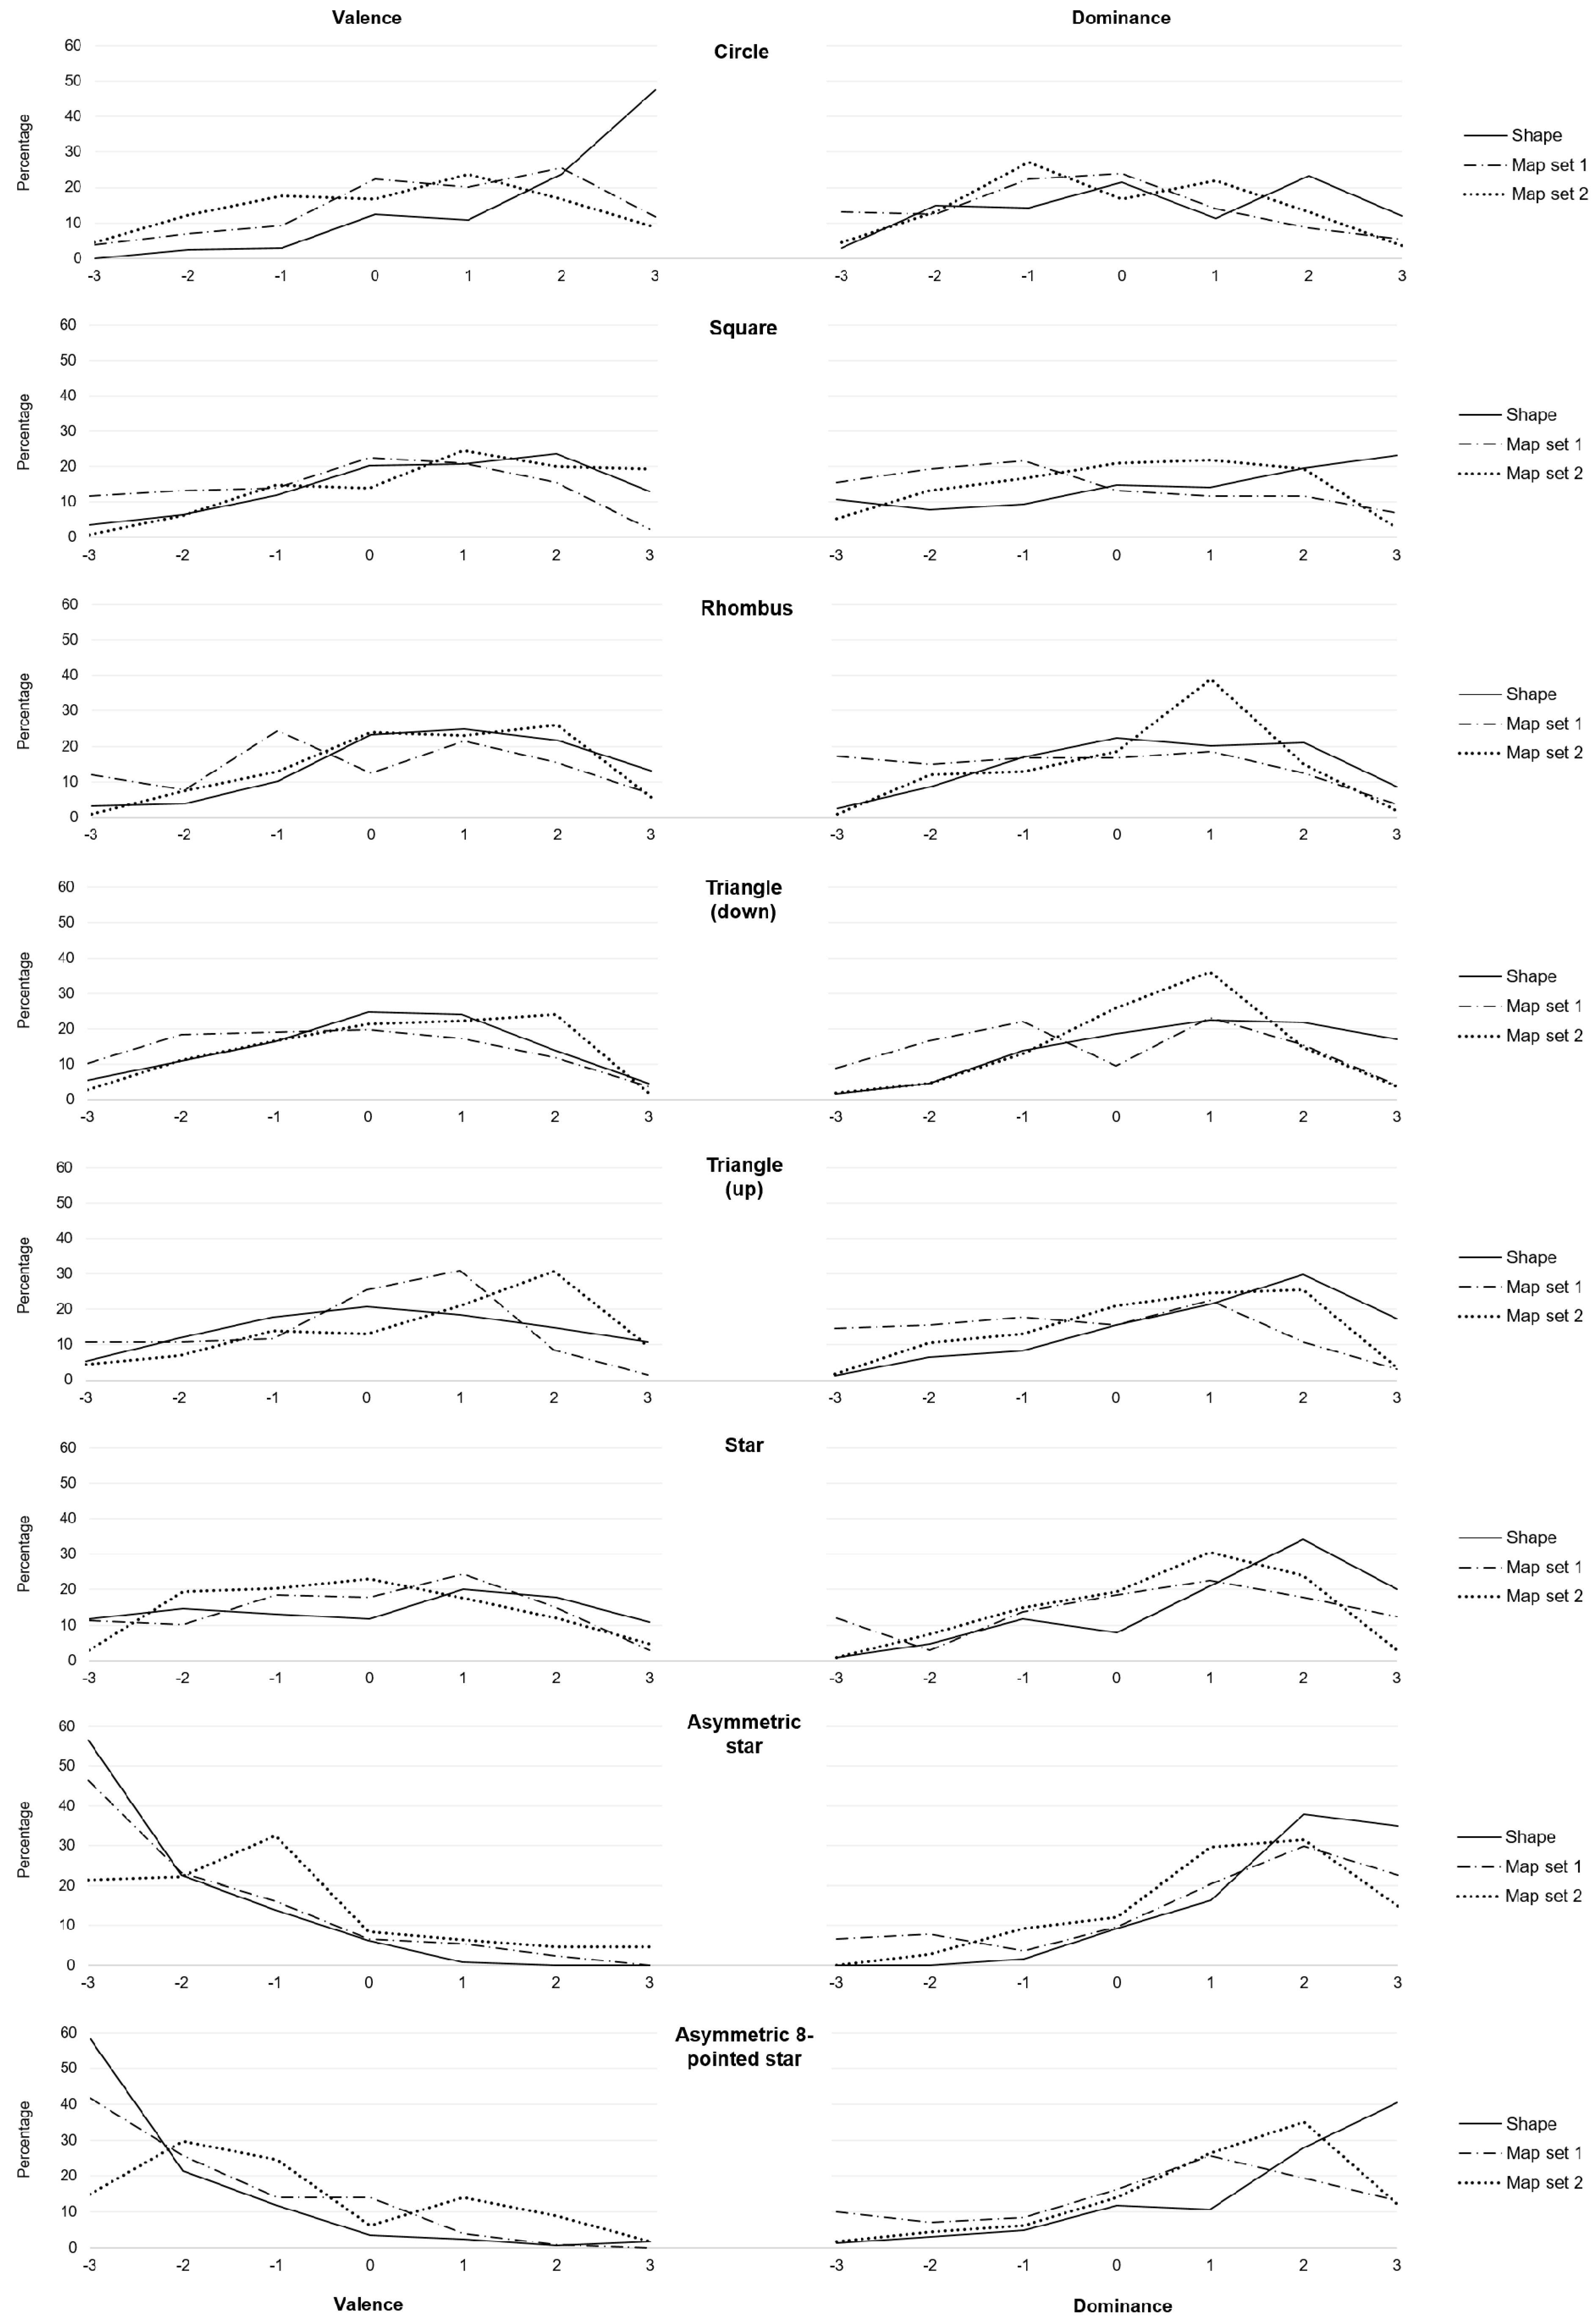
- Shape stimulus set: The shape stimulus set comprised the basic eight achromatic shape stimuli. The stimuli were presented in black on a light-grey background at a size of 300 × 300 pixels embedded in an online survey. Each shape was displayed successively, in a randomized order.
- Map stimulus set 1: In map stimulus set 1, the eight basic shape stimuli were set in a cartographic context. Each shape was depicted on a basemap in greyscale. Each map presented one shape-symbol at the exact same location on each map to control for confounding influences. Maps were presented as part of an online survey, at a size of 500 × 377 pixels, displayed successively, and in a randomized order.
- Map stimulus set 2: In map stimulus set 2, the eight basic shape stimuli were again presented on a basemap in greyscale, yet, each map depicted one type of shape-symbol at eight exact positions on each map to control for confounding influences. The maps were, again, embedded in an online survey, and presented successively, in a randomized order, at a size of 500 × 384 pixels.
3.2. Participants
4. Results
4.1. Semantic Differential: Factor Analysis
- (1)
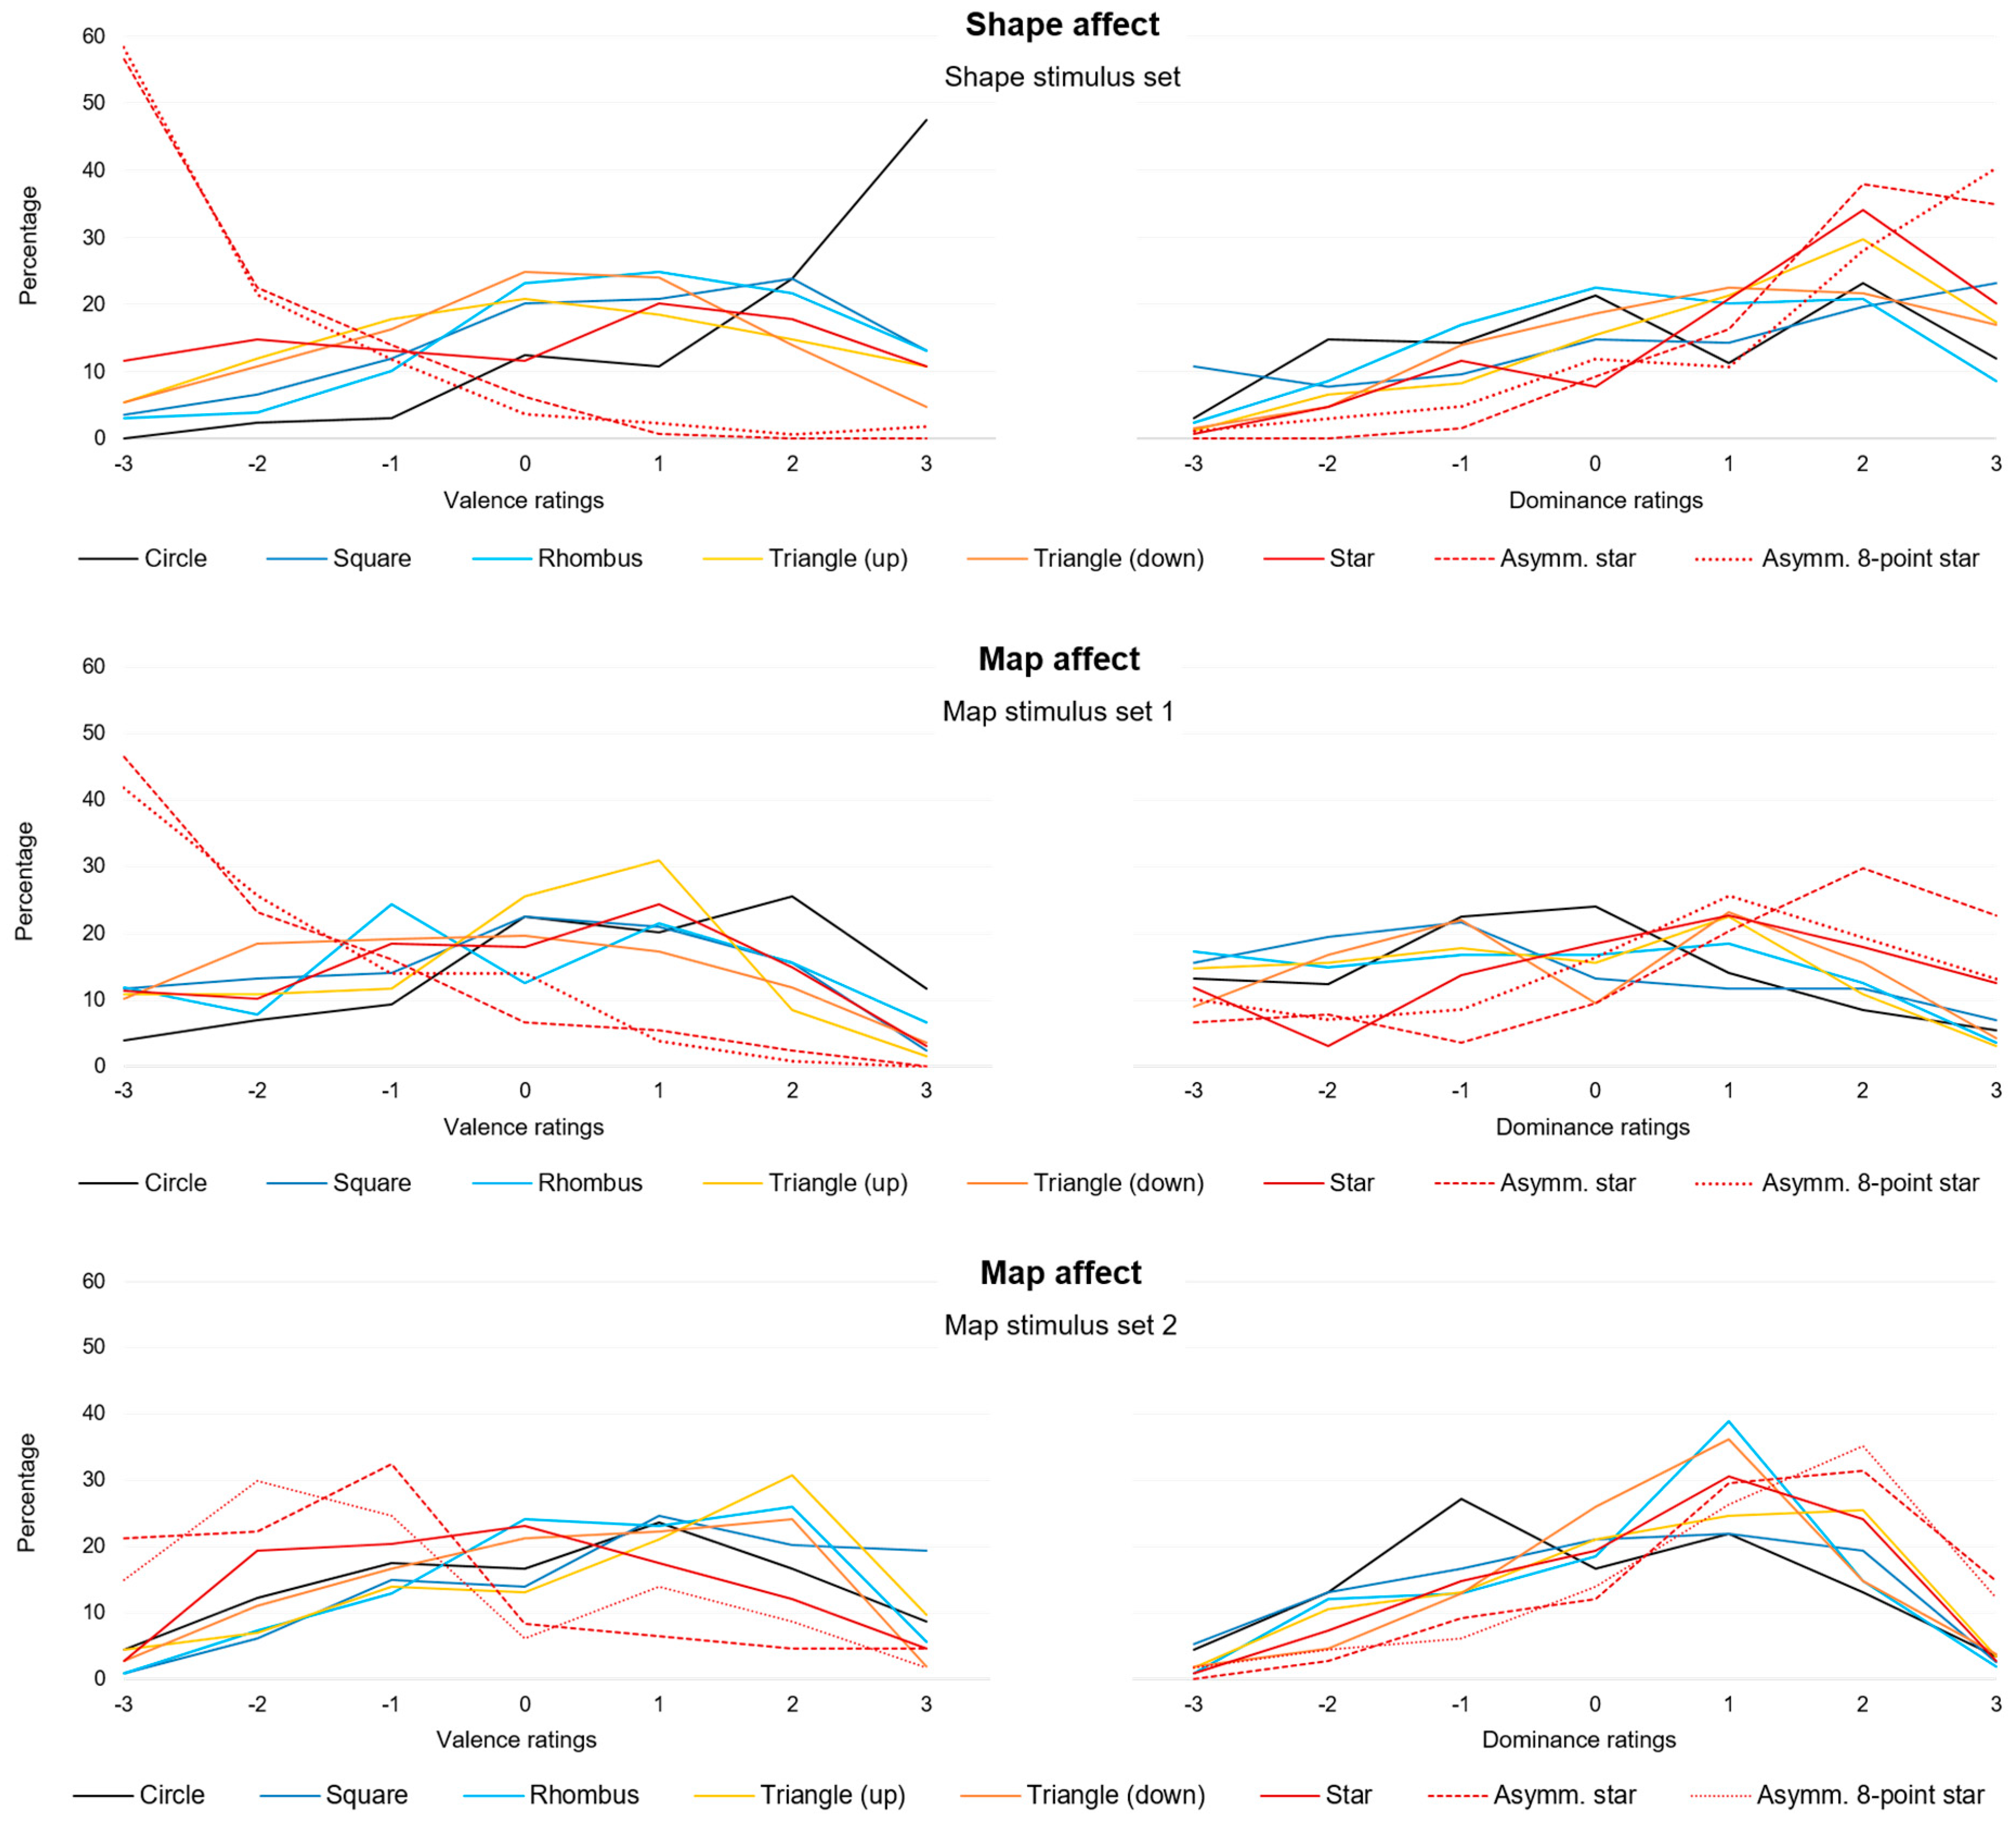
- Component 1 loaded high on the following bipolar items: Harmonic, disharmonic; appealing, unappealing; and calm, agitated. Component 1 will, therefore, be labeled as the affective dimension of valence.
- (2)
- Component 2 loaded high on the items: Weak, strong; unobtrusive, dominant; and passive, dynamic. Component 1 will be labeled as the affective dimension of dominance.
4.2. Affective Differentiation: Within-Group Analysis
4.2.1. Shape Stimulus Set
4.2.2. Map Stimulus Set 1
4.2.3. Map Stimulus Set 2
4.3. Affective Differentiation: Between-Group Analysis
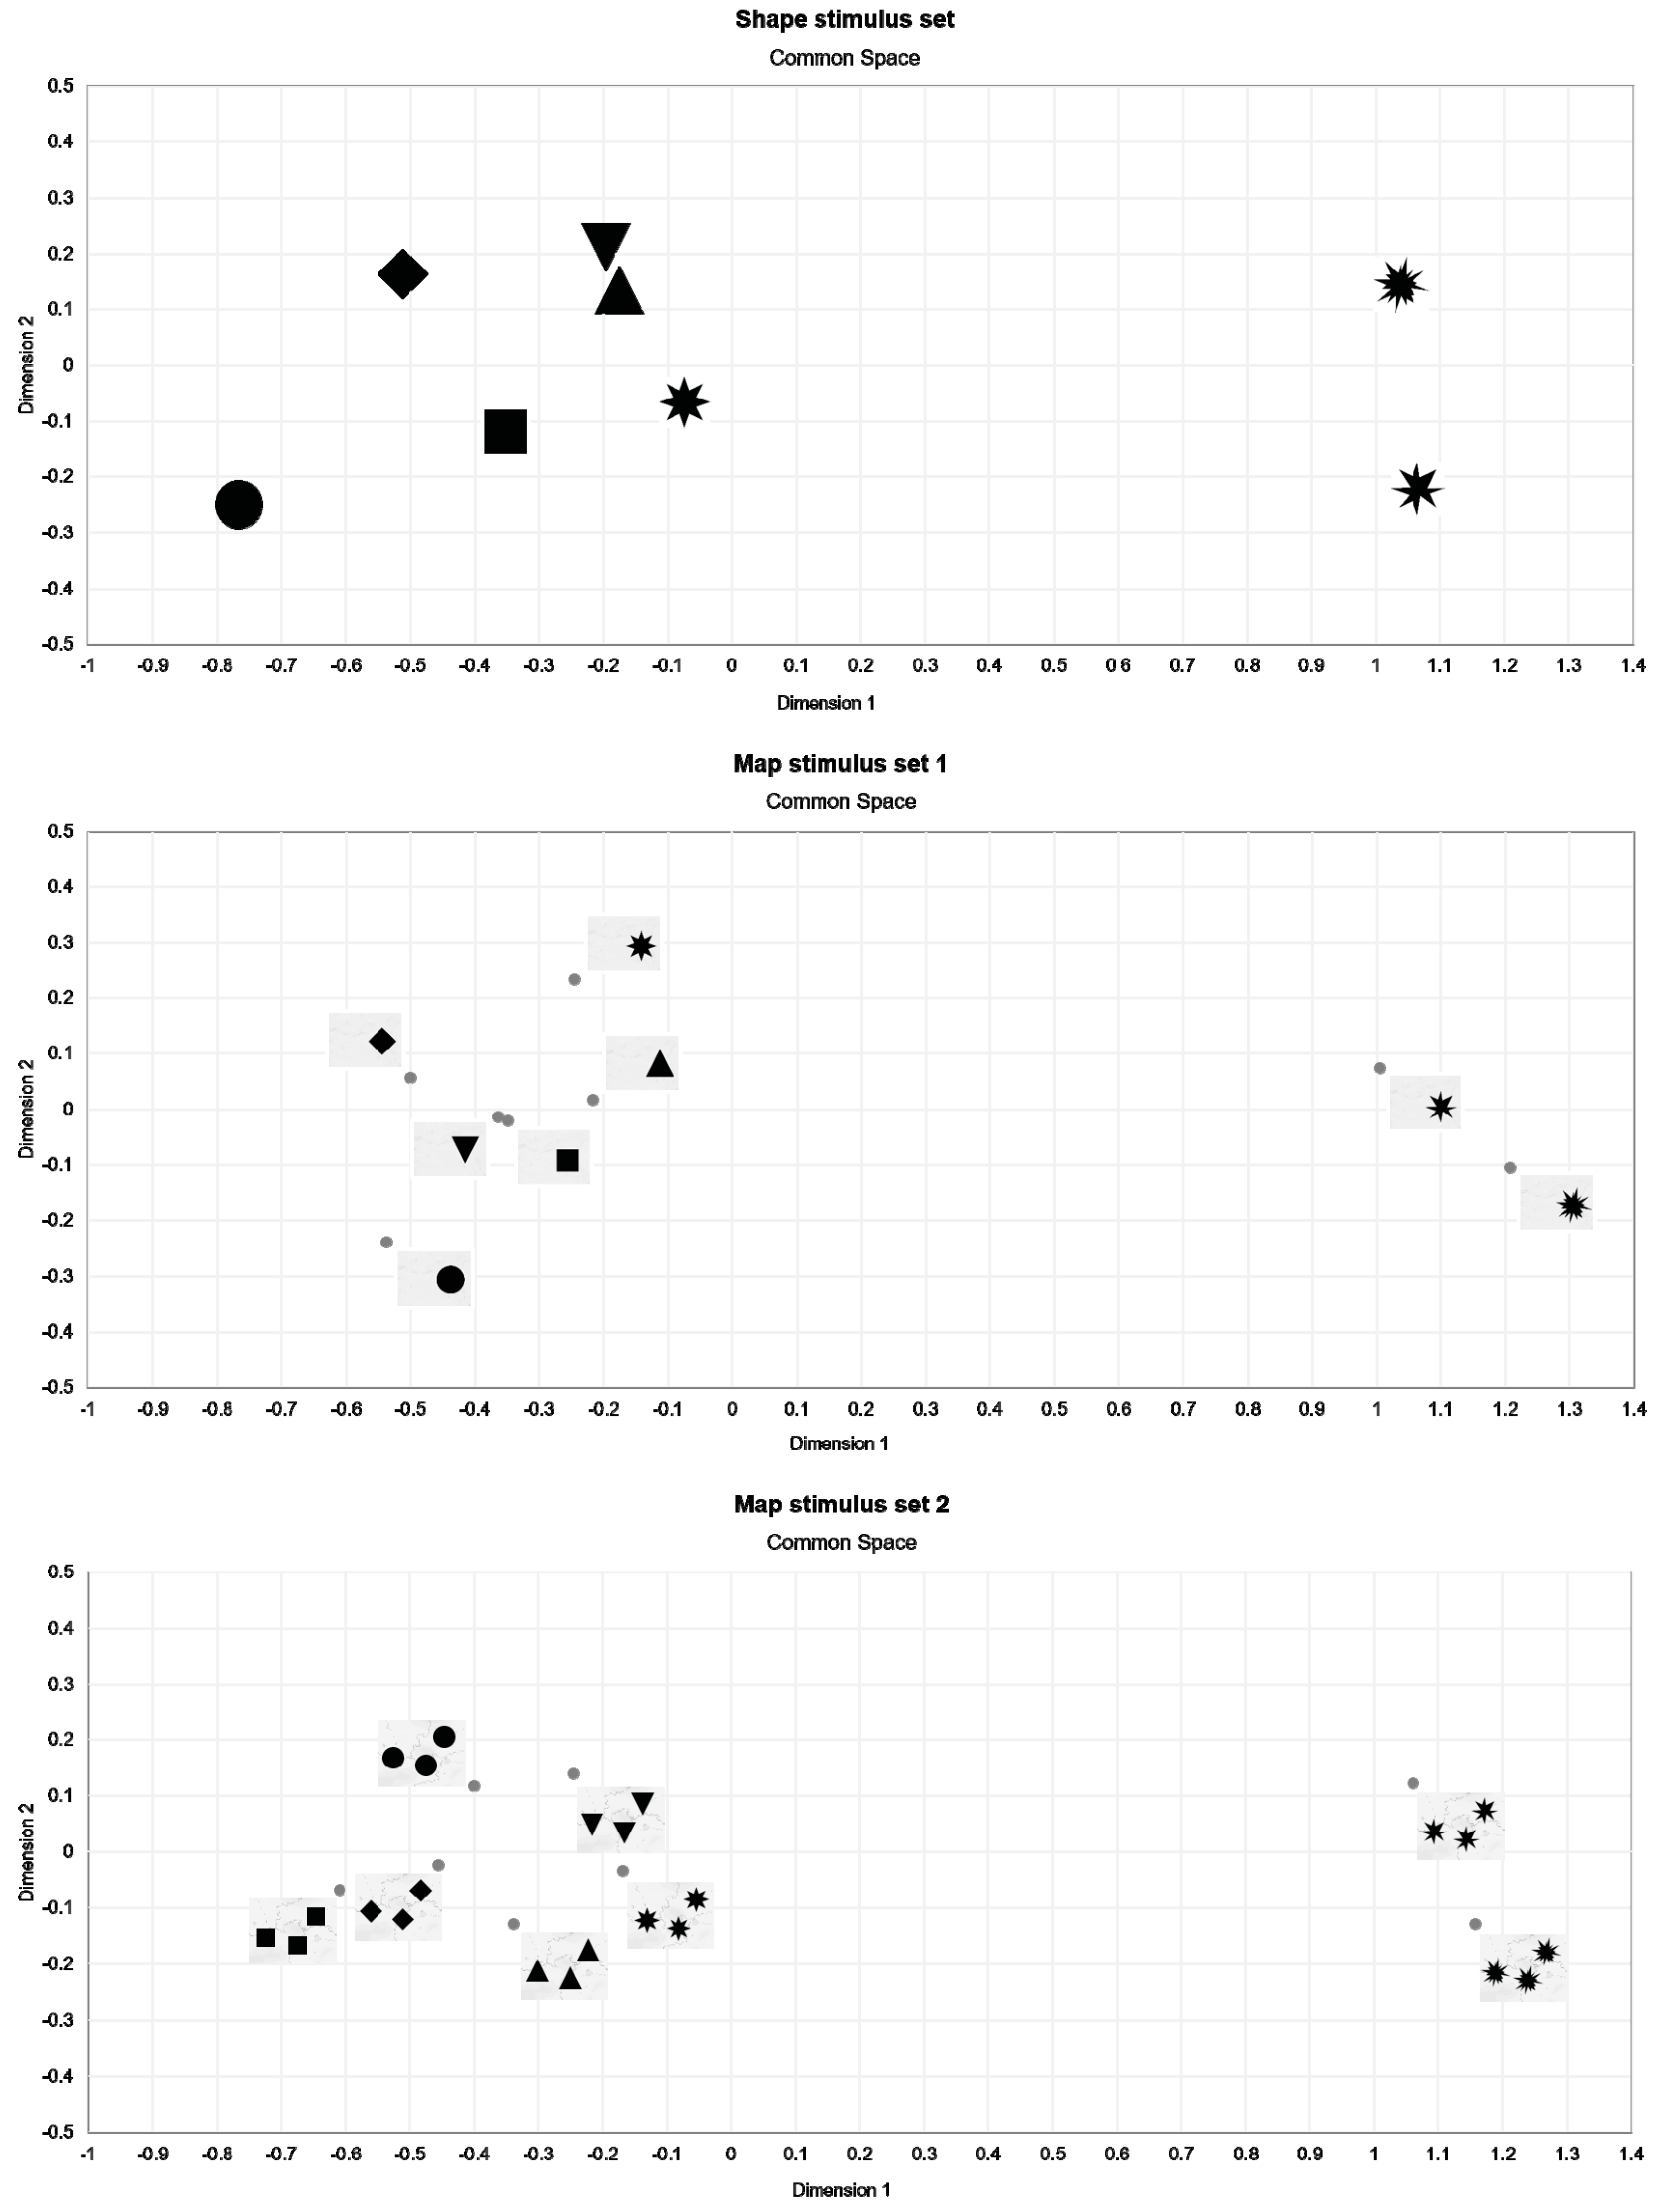
4.4. Multidimensional Scaling
5. Discussion
6. Conclusions
Supplementary Materials
Funding
Acknowledgments
Conflicts of Interest
Appendix A

References
- Krauss, R.M. The Psychology of Verbal Communication. In International Encyclopedia of the Social and Behavioral Sciences; Smelser, N.J., Baltes, P., Eds.; Elsevier: Amsterdam, The Netherlands, 2002. [Google Scholar]
- Howard, V.A. Theory of representation: Three questions. In Processing of Visible Language; Springer US: Boston, MA, USA, 1980; pp. 501–515. [Google Scholar]
- Petchenik, B. Cognition in Cartography. Cartogr. Int. J. Geogr. Inf. Geovisualization 1977, 14, 117–128. [Google Scholar] [CrossRef]
- Eide, Ø. Media Boundaries and Conceptual Modelling: Between Texts and Maps; Palgrave Macmillan: London, UK, 2016; ISBN 978-1349566235. [Google Scholar]
- Harley, J.B. Maps, knowledge, and power. In Geographic Thought: A Praxis Perspective; Henderson, G., Waterstone, M., Eds.; Routledge: Abingdon-on-Thames, UK, 2009. [Google Scholar]
- Wood, D. Rethinking the Power of Maps; The Guilford Press: New York, NY, USA, 2010. [Google Scholar]
- Thompson, M.A.; Lindsay, J.M.; Gaillard, J. The influence of Probabilistic Volcanic Hazard map Properties on Hazard Communication. J. Appl. Volcanol. 2011, 4, 6. [Google Scholar] [CrossRef]
- Monmonier, M. How to Lie with Maps; The University of Chicago Press: Chicago, IL, USA, 1996. [Google Scholar]
- Bertin, J. Graphische Semiologie: Diagramme, Netze, Karten; Walter de Gruyter: Berlin, Germany, 1974. [Google Scholar]
- Klee, P. Schöpferische Konfession: Paul Klee. In Tribüne der Kunst und Zeit—Eine Schriftensammlung, Band XIII; Edschmid, K., Ed.; Erich Reiß Verlag: Berlin, Germany, 1920; pp. 28–40. [Google Scholar]
- Arnheim, R. Art and Visual Perception: A Psychology of the Creative Eye; University of California Press: Berkeley, CA, USA, 1974; ISBN 0520243838. [Google Scholar]
- Nöth, W. Handbook of Semiotics; Indiana University Press: Blomington, IN, USA, 1995; ISBN 978-0-253-20959-7. [Google Scholar]
- Morris, C.W. Foundations of the Theory of Signs; The University of Chicago Press: Chicago, IL, USA, 1938; pp. 1–59. [Google Scholar]
- Morris, C.W. Signs, Language And Behavior, 1st ed.; George Braziller, Inc.: New York, NY, USA, 1946. [Google Scholar]
- MacEachren, A.M. How Maps Work: Representation, Visualization, and Design; The Guilford Press: New York, NY, USA, 1995; ISBN 0-89862-589-0. [Google Scholar]
- Osgood, C.E.; Suci, G.J.; Tannenbaum, P.H. The Measurement of Meaning; University of Illinois Press: Urbana, IL, USA, 1967. [Google Scholar]
- Keates, J.S. Understanding Maps, 2nd ed.; Addison Wesley Longman Limited: New York, NY, USA, 1996. [Google Scholar]
- Barrett, L.F.; Bliss-Moreau, E. Affect as a Psychological Primitive. Adv. Exp. Soc. Psychol. 2009, 41, 167–218. [Google Scholar]
- Sianipar, A.; Van Groenestijn, P.; Dijkstra, T. Affective Meaning, Concreteness, and Subjective Frequency Norms for Indonesian Words. Front. Psychol. 2016, 7, 1907. [Google Scholar] [CrossRef]
- Loftus, E.F.; Palmer, J.C. Reconstruction of Automobile Deconstruction: An Example of the Interaction Between Language and Memory. J. Verbal Learn. Verbal Behav. 1974, 13, 585–589. [Google Scholar] [CrossRef]
- Osgood, C.E.; Luria, Z. A blind analysis of a case of multiple personality using the Semantic Differnetial. J. Abnorm. Soc. Psychol. 1954, 49, 579–591. [Google Scholar] [CrossRef]
- Mehrabian, A.; Russell, J.A. An Approach to Environmental Psychology; The Massachusetts Institute of Technology: Cambridge, MA, USA, 1974. [Google Scholar]
- Espe, H. A cross-cultural investigation of the graphic differential. J. Psycholinguist. Res. 1985, 14, 97–111. [Google Scholar] [CrossRef]
- Bakker, I.; Van Der Voordt, T.; Vink, P.; De Boon, J. Pleasure, arousal, dominance: Mehrabian and Russell revisited. Curr. Psychol. 2014, 33, 405–421. [Google Scholar] [CrossRef]
- Russell, J.A. A Circumplex Model of Affect. J. Pers. Soc. Psychol. 1980, 39, 1161–1178. [Google Scholar] [CrossRef]
- Wunth, W. Grundriss der Psychologie, 5th ed.; Wilhelm Engelmann: Leipzig, Germany, 1902. [Google Scholar]
- Russell, J.A. Core Affect and the Psychological Construction of Emotion. Psychol. Rev. 2003, 110, 145–172. [Google Scholar] [CrossRef]
- Feldman Barrett, L.; Mesquita, B.; Ochsner, K.N.; Gross, J.J. The Experience of Emotion. Annu. Rev. Psychol. 2007, 58, 373–403. [Google Scholar] [CrossRef]
- Griffin, A.L.; McQuoid, J. At the Intersection of Maps and Emotion: The Challenge of Spatially Representing Experience. Kartogr. Nachr. 2012, 6, 291–299. [Google Scholar]
- Nold, C. Emotional Cartography: Technologies of the Self; Space Studios: London, UK, 2009. [Google Scholar]
- Klettner, S.; Huang, H.; Schmidt, M.; Gartner, G. Crowdsourcing affective responses to space. J. Cartogr. Geogr. Inf. 2013, 2, 66–72. [Google Scholar]
- Fabrikant, S.I.; Christophe, S.; Papastefanou, G.; Maggi, S. Emotional Response to Map Design Aesthetics. In Proceedings of the 7th International Conference on Geographical Information Science, Columbus, OH, USA, 18–21 September 2012. [Google Scholar]
- Christophe, S.; Hoarau, C. Expressive Map Design Based on Pop Art: Revisit of Semiology of Graphics? Cartogr. Perspect. 2013, 61–74. [Google Scholar] [CrossRef]
- Muehlenhaus, I. If Looks Could Kill: The Impact of Different Rhetorical Styles on Persuasive Geocommunication. Cartogr. J. 2012, 49, 361–375. [Google Scholar] [CrossRef]
- Muehlenhaus, I. The Design and Composition of Persuasive Maps. Cartogr. Geogr. Inf. Sci. 2013, 40, 404–414. [Google Scholar] [CrossRef]
- Jenny, B.; Stephen, D.M.; Muehlenhaus, I.; Marston, B.E.; Sharma, R.; Zhang, E.; Jenny, H. Design Principles for Origin-destination Flow Maps. Cartogr. Geogr. Inf. Sci. 2018, 45, 62–75. [Google Scholar] [CrossRef]
- Stachoň, Z.; Šašinka, Č.; Čeněk, J.; Angsüsser, S.; Kubíček, P.; Štěrba, Z.; Bilíková, M. Effect of Size, Shape and Map Background in Cartographic Visualization: Experimental Study on Czech and Chinese Populations. ISPRS Int. J. Geo-Inf. 2018, 7, 427. [Google Scholar] [CrossRef]
- MacEachren, A.M.; Roth, R.E.; O’Brien, J.; Li, B.; Swingley, D.; Gahegan, M. Visual Semiotics and Uncertainty Visualization: An Empirical Study. IEEE Trans. Vis. Comput. Graph. 2012, 18, 2496–2505. [Google Scholar] [CrossRef]
- Padilla, L.M.; Ruginski, I.T.; Creem-Regehr, S.H. Effects of ensemble and summary displays on interpretations of geospatial uncertainty data. Cogn. Res. Princ. Implic. 2017, 2, 40. [Google Scholar] [CrossRef]
- Kinkeldey, C.; MacEachren, A.M.; Schiewe, J. How to Assess Visual Communication of Uncertainty? A Systematic Review of Geospatial Uncertainty Visualisation User Studies. Cartogr. J. 2014, 51, 372–386. [Google Scholar] [CrossRef]
- Cheong, L.; Bleisch, S.; Kealy, A.; Tolhurst, K.; Wilkening, T.; Duckham, M. Evaluating the impact of visualization of wildfire hazard upon decision-making under uncertainty. Int. J. Geogr. Inf. Sci. 2016, 30, 1377–1404. [Google Scholar] [CrossRef]
- Chandler, D. Semiotics: The Basics; Routledge: Abingdon-on-Thames, UK, 2007. [Google Scholar]
- Arnheim, R. Kunst Und Sehen: Eine Psychologie des Schöpferischen Auges; Walter de Gruyter: Berlin, Germany, 1978; ISBN 3110066823. [Google Scholar]
- Treisman, A.; Gormican, S. Feature Analysis in Early Vision: Evidence From Search Asymmetries. Psychol. Rev. 1988, 95, 15. [Google Scholar] [CrossRef]
- Limesurvey GmbH. LimeSurvey: An Open Source Survey Tool; LimeSurvey GmbH: Hamburg, Germany, 2019. [Google Scholar]
- Russell, J.A.; Pratt, G. A Description of the Affective Quality Attributed to Environments. J. Pers. Soc. Psychol. 1980, 38, 311–322. [Google Scholar] [CrossRef]
- Klettner, S. Why Shape Matters—On the Inherent Qualities of Geometric Shapes for Cartographic Representations. ISPRS Int. J. Geo-Inf. 2019, 8, 217. [Google Scholar] [CrossRef]
- IBM Corp. IBM SPSS Statistics for Windows; Version 25.0; IBM Corp: Armonk, NY, USA, 2017. [Google Scholar]
- Addinsoft XLSTAT 2020; Addinsoft: New York, NY, USA, 2020.
- Field, A. Discovering Statistics Using IBM SPSS Statistics, 3rd ed.; SAGE Publications Ltd: Thousand Oaks, CA, USA, 2009. [Google Scholar]
- Chatfield, M.; Mander, A. The Skillings-Mack test (Friedman test when there are missing data). Stata J. 2009, 9, 299–305. [Google Scholar] [CrossRef] [PubMed]
- Conover, W.J.; Iman, R.L. On Multiple-Comparisons Procedures; Los Alamos National Lab: Los Alamos, NM, USA, 1979. [Google Scholar]
- Heise, D.R. The Semantic Differential and Attitude Research. Attitude Meas. 1970, 4, 235–253. [Google Scholar]
- Hout, M.C.; Papesh, M.H.; Goldinger, S.D. Multidimensional Scaling. Wiley Interdiscip. Rev. Cogn. Sci. 2013, 4, 93–103. [Google Scholar] [CrossRef]
- Russell, J.A.; Lewicka, M.; Niit, T. A Cross-Cultural Study of a Circumplex Model of Affect. J. Pers. Soc. Psychol. 1989, 57, 848–856. [Google Scholar] [CrossRef]
- Eisenman, R.; Rappaport, J. Complexity preference and semantic differential ratings of complexity-simplicity and symmetry-asymmetry. Psychon. Sci. 1967, 7, 147–148. [Google Scholar] [CrossRef]
- Friedenberg, J.; Bertamini, M. Aesthetic Preference for Polygon Shape Contour Variation and Perceived Beauty of Polygon Shape Polygons and Art. Empir. Stud. Arts 2015, 33, 144–160. [Google Scholar] [CrossRef]
- Kraak, M.J.; Ormeling, F. Cartography: Visualization of Spatial Data; Guilford Press: New York, NY, USA, 2011; ISBN 9781609181932. [Google Scholar]
- Anderson, C. The Influence of Affectively Congruent Color Assignment in Categorical Map; Penn State University: State College, PA, USA, 2018. [Google Scholar]


| Bipolar Items | Bipolar Items in German (Original) |
|---|---|
| unappealing – appealing | unsympatisch – sympathisch |
| disharmonic – harmonic | disharmonisch – harmonisch |
| unobtrusive – dominant | zurückhaltend – dominant |
| weak – strong | schwach – stark |
| calm – agitated | ruhend – unruhig |
| passive – dynamic | passiv – dynamisch |
| Stimulus | Frequency | Sum of ranks | Mean of ranks | Groups (Valence) | ||||
| Circle | 168 | 155604.50 | 926.22 |  A A | ||||
| Rhombus | 129 | 94532.50 | 732.81 |  B B | ||||
| Square | 168 | 120860.00 | 719.40 |  B B | C | |||
| Triangle (up) | 168 | 106916.00 | 636.40 |  C C | D | |||
| Star | 129 | 79942.50 | 619.71 |  D D | ||||
| Triangle (down) | 129 | 79567.50 | 616.80 |  D D | ||||
| Asymm. 8-point star | 168 | 39855.50 | 237.24 |  E E | ||||
| Asymm. star | 129 | 28987.50 | 224.71 |  E E | ||||
| Stimulus | Frequency | Sum of ranks | Mean of ranks | Groups (Dominance) | ||||
| Asymm. 8-point star | 129 | 100290.00 | 777.44 | A | ||||
| Asymm. star | 168 | 125539.00 | 747.26 | A | B | |||
| Star | 129 | 81415.50 | 631.13 | B | C | |||
| Triangle (up) | 168 | 99149.50 | 590.18 | C | ||||
| Triangle (down) | 129 | 70898.50 | 549.60 | C | D | |||
| Square | 168 | 90942.00 | 541.32 | C | D | |||
| Circle | 168 | 78421.50 | 466.79 | D | ||||
| Rhombus | 129 | 59610.00 | 462.09 | D | ||||
| Stimulus | Frequency | Sum of ranks | Mean of ranks | Groups (Valence) | |||
| Circle | 129 | 105739.00 | 819.68 |  A A | |||
| Rhombus | 168 | 114192.50 | 679.72 |  B B | |||
| Star | 168 | 113034.00 | 672.82 |  B B | |||
| Triangle (up) | 129 | 86270.50 | 668.76 |  B B | |||
| Square | 129 | 85176.50 | 660.28 |  B B | |||
| Triangle (down) | 168 | 104689.00 | 623.15 |  B B | |||
| Asymm. 8-point star | 129 | 43106.50 | 334.16 |  C C | |||
| Asymm. star | 168 | 54058.00 | 321.77 |  C C | |||
| Stimulus | Frequency | Sum of ranks | Mean of ranks | Groups (Dominance) | |||
| Asymm. star | 168 | 133241.50 | 793.10 | A | |||
| Asymm. 8-point star | 129 | 88048.50 | 682.55 | A | B | ||
| Star | 168 | 111135.50 | 661.52 | B | C | ||
| Triangle (down) | 168 | 93561.50 | 556.91 | C | D | ||
| Triangle (up) | 129 | 66187.50 | 513.08 | D | |||
| Circle | 129 | 65608.50 | 508.59 | D | |||
| Rhombus | 168 | 85052.00 | 506.26 | D | |||
| Square | 129 | 63431.00 | 491.71 | D | |||
| Stimulus | Frequency | Sum of ranks | Mean of ranks | Groups (Valence) | ||
| Square | 114 | 64620.50 | 566.85 |  A A | ||
| Triangle (up) | 114 | 61362.00 | 538.26 |  A A | ||
| Rhombus | 108 | 56467.00 | 522.84 |  A A | ||
| Triangle (down) | 108 | 51321.00 | 475.19 |  A A | B | |
| Circle | 114 | 53840.50 | 472.29 |  A A | B | |
| Star | 108 | 44328.00 | 410.44 |  B B | ||
| Asymm. 8-point star | 114 | 33732.00 | 295.89 |  C C | ||
| Asymm. star | 108 | 29045.00 | 268.94 |  C C | ||
| Stimulus | Frequency | Sum of ranks | Mean of ranks | Groups (Dominance) | ||
| Asymm. star | 108 | 61100.50 | 565.75 | A | ||
| Asymm. 8-point star | 114 | 63355.00 | 555.75 | A | ||
| Star | 108 | 48153.00 | 445.86 | B | ||
| Triangle (up) | 114 | 49661.00 | 435.62 | B | C | |
| Triangle (down) | 108 | 46351.00 | 429.18 | B | C | |
| Rhombus | 108 | 44182.50 | 409.10 | B | C | |
| Square | 114 | 42927.00 | 376.55 | B | C | |
| Circle | 114 | 38986.00 | 341.98 | C | ||
| Triangle (up) | Triangle (down) | Circle | Star | Square | Rhomb | Asymm. star | Asymm. 8-pt star | |
|---|---|---|---|---|---|---|---|---|
| Valence: | ||||||||
| Shape – Map ss | 0.36 | 0.46 | 1.22 | 0.20 | 0.88 | 0.84 | 0.36 | 0.36 |
| Map ss – Map ms | 0.83 | 0.63 | 0.43 | 0.03 | 1.09 | 0.65 | 0.81 | 0.93 |
| Map ms – Shape | 0.48 | 0.17 | 1.65 | 0.23 | 0.21 | 0.20 | 1.17 | 1.29 |
| Dominance: | ||||||||
| Shape – Map ss | 1.47 | 1.05 | 0.80 | 0.86 | 1.17 | 0.91 | 0.86 | 1.23 |
| Map ss – Map ms | 0.86 | 0.65 | 0.32 | 0.14 | 0.61 | 0.78 | 0.13 | 0.62 |
| Map ms – Shape | 0.61 | 0.40 | 0.48 | 0.72 | 0.56 | 0.12 | 0.73 | 0.61 |
© 2020 by the author. Licensee MDPI, Basel, Switzerland. This article is an open access article distributed under the terms and conditions of the Creative Commons Attribution (CC BY) license (http://creativecommons.org/licenses/by/4.0/).
Share and Cite
Klettner, S. Affective Communication of Map Symbols: A Semantic Differential Analysis. ISPRS Int. J. Geo-Inf. 2020, 9, 289. https://doi.org/10.3390/ijgi9050289
Klettner S. Affective Communication of Map Symbols: A Semantic Differential Analysis. ISPRS International Journal of Geo-Information. 2020; 9(5):289. https://doi.org/10.3390/ijgi9050289
Chicago/Turabian StyleKlettner, Silvia. 2020. "Affective Communication of Map Symbols: A Semantic Differential Analysis" ISPRS International Journal of Geo-Information 9, no. 5: 289. https://doi.org/10.3390/ijgi9050289
APA StyleKlettner, S. (2020). Affective Communication of Map Symbols: A Semantic Differential Analysis. ISPRS International Journal of Geo-Information, 9(5), 289. https://doi.org/10.3390/ijgi9050289