Spatial Analysis of the Rural-Urban Structure of the Spanish Municipalities


Abstract
1. Introduction
2. Materials and Methods
2.1. Study Area
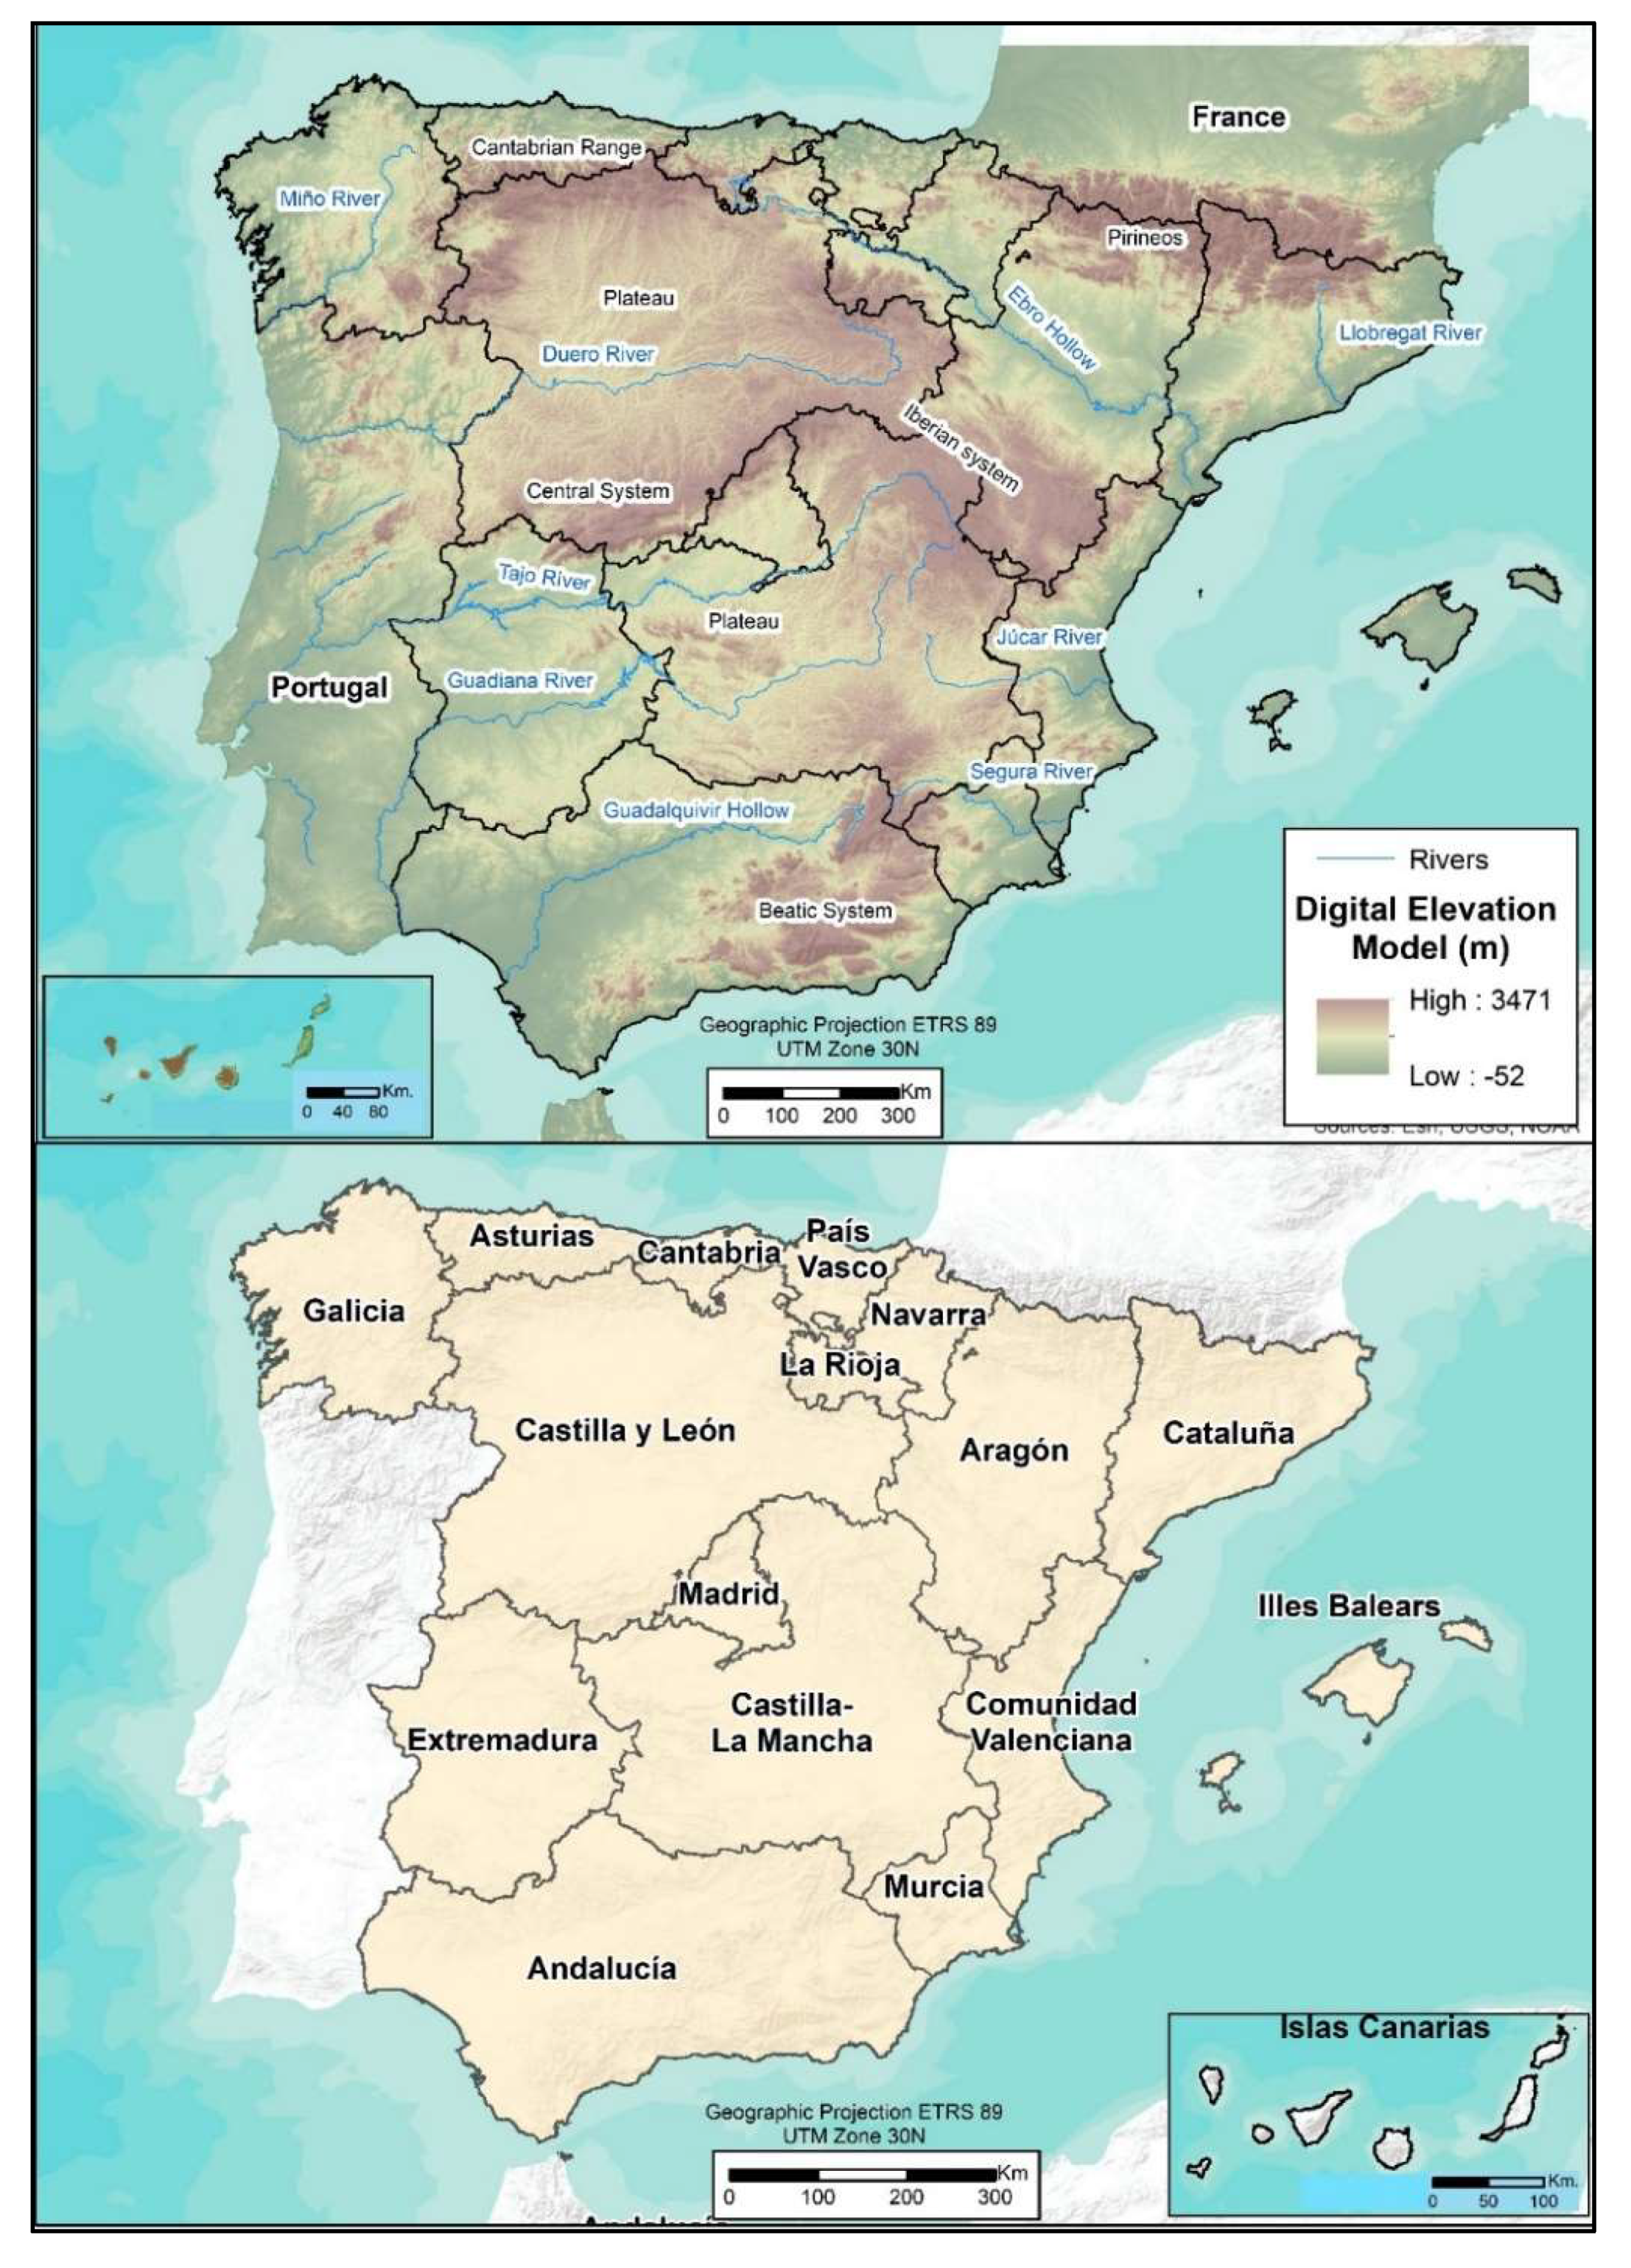
2.1.1. Characteristics of the Spanish Territory
- Cantabrian coast. This is a space with an oceanic climate, abundant vegetation, and wide coastline that presents a diminished productive homogeneity. In this region, the cities form three subsystems (Gijón-Oviedo-Avilés, Santander, and Bilbao-Vitoria-San Sebastián) with great economic development related with an industrial and tertiary sector.
- Ebro Valley. It is located diagonally between País Vasco and Cataluña, centered in Zaragoza, and well connected with Madrid, so it benefits from this unbeatable location. This region has good road infrastructure with the largest flows of goods and travelers from the Spanish State. Its productive composition is characterized by intensive agriculture, an outstanding industry, and services focused mainly on transport. The great urban center is Zaragoza and the GDP (Gross Domestic Product) is higher than the national average.
- Mediterranean axis. This axis extends from Cataluña to Almería. Development levels clearly descend from north to south. It is an axis linked to the great axis of southern Europe or the Mediterranean with good infrastructure, high flows of goods, and travelers, powerful cities, and metropolitan areas (Barcelona, Valencia, Alicante-Elche, etc.), high population density, and diversified productive structure (agriculture in Almeria, Murcia, and Valencia with agroindustry supported by SMEs (Small and medium-sized enterprises), important export economy, tourism, etc.).
- Andalucía. Some authors include it in the Mediterranean axis [57]. It is a space with great possibilities because it is a connection land between Europe and North Africa. However, political strategies are not aimed at this. For example, the construction of the A92 highway, which is the backbone of the community but inside, leaving the Mediterranean coast off the hook despite its urban, tourist, and agricultural importance. Thus, Andalucía shows signs of being the periphery of the periphery (of Spain and Europe) in all socioeconomic variables.
- The Plateau. This is a space formed by the plateaus of Castilla-La Mancha, Castilla y León, and Extremadura. These regions present the worst socioeconomic perspectives: low population densities, production and incomes below average, high agricultural rates, little industry, and public services that do not reach 30%.
- Madrid. This is a small territory in the middle of the Plateau that has grown thanks to being the capital of the country, thus has received strong investments, agglutinating a large part of the officials, strengthening infrastructure, leisure and cultural equipment, industrializing and accumulating advanced services and headquarters of large financial, commercial, and technological companies. It exerts a great power of attraction of the main business movements and is an obligatory knot of communication (especially aerial) as well as having great influence on the entire Plateau and even Andalucía.
- Archipelagos. They constitute their own spaces with characteristics closely linked to tourism. Baleares (in the Mediterranean Sea) stands out for its high socioeconomic power linked to tourism with high purchasing power.
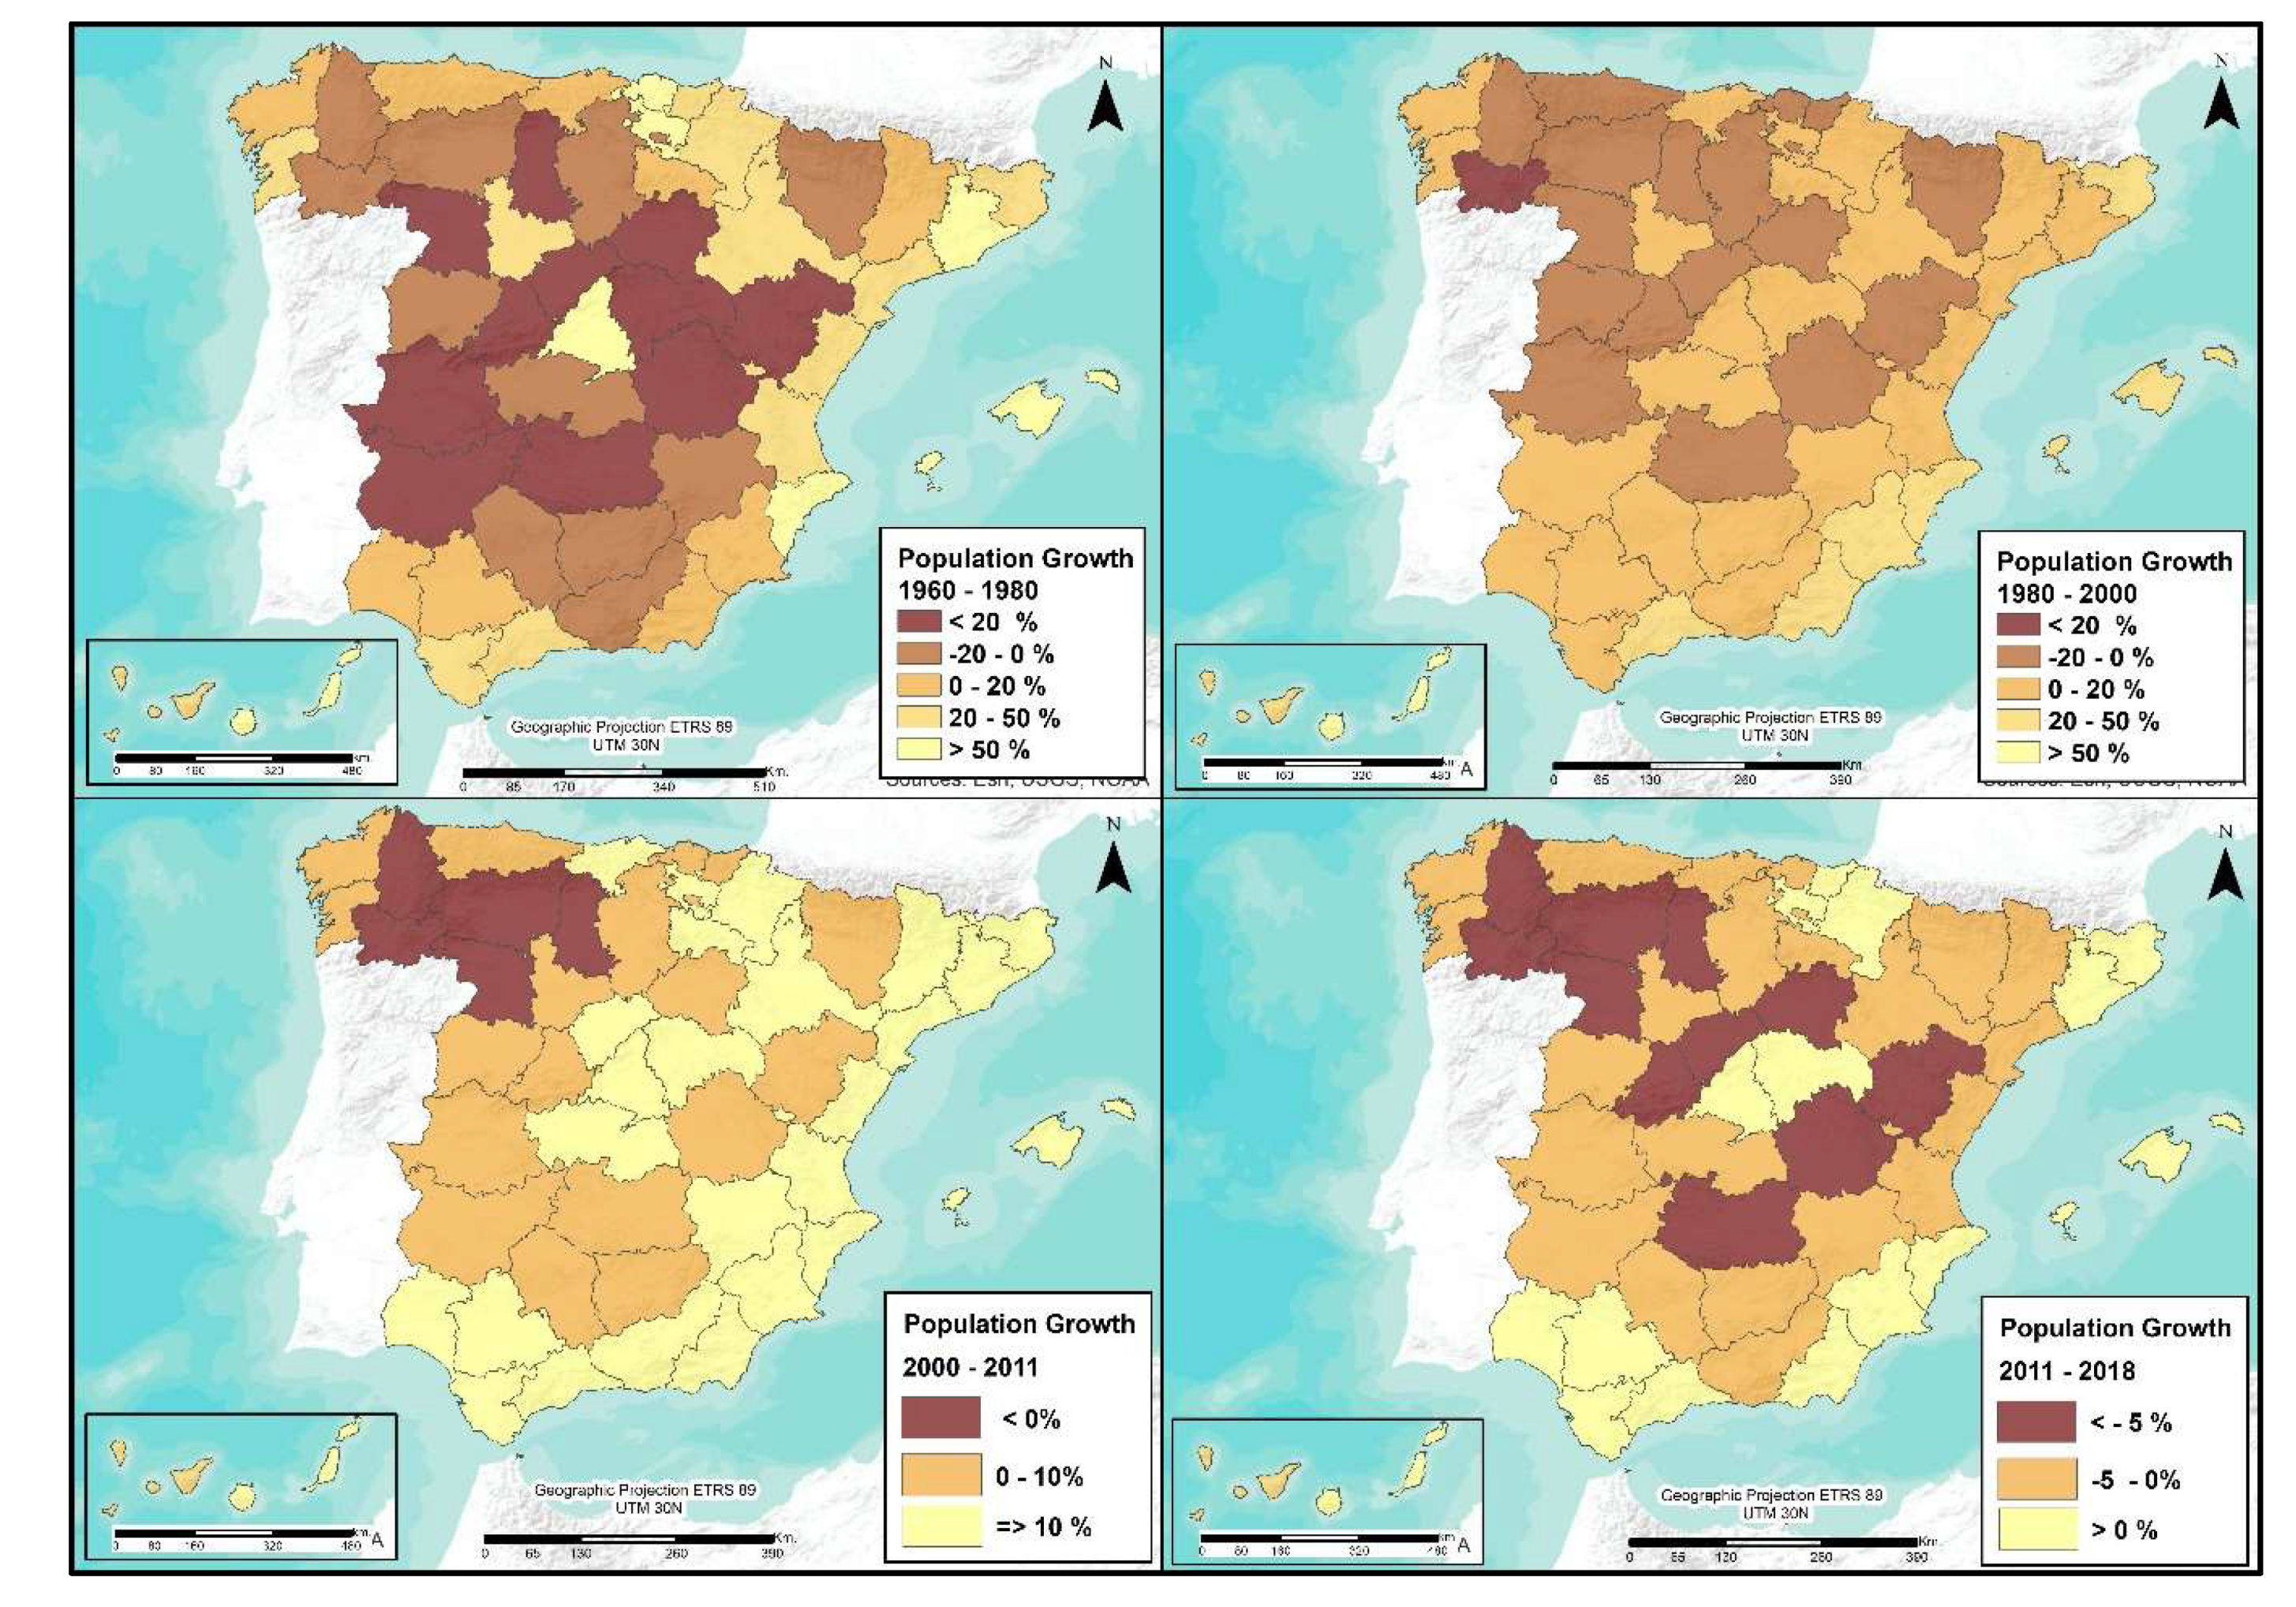
2.1.2. General demographic characteristics of the Spanish Regions and Municipalities
2.2. Methods
2.2.1. Alphanumeric and Cartographic Dataset
- Demographic data obtained from the different population registers of the years 2001, 2011, and 2018 of the NSI. In addition, the old age index, the percentage of population growth, and population density were calculated with these population data.
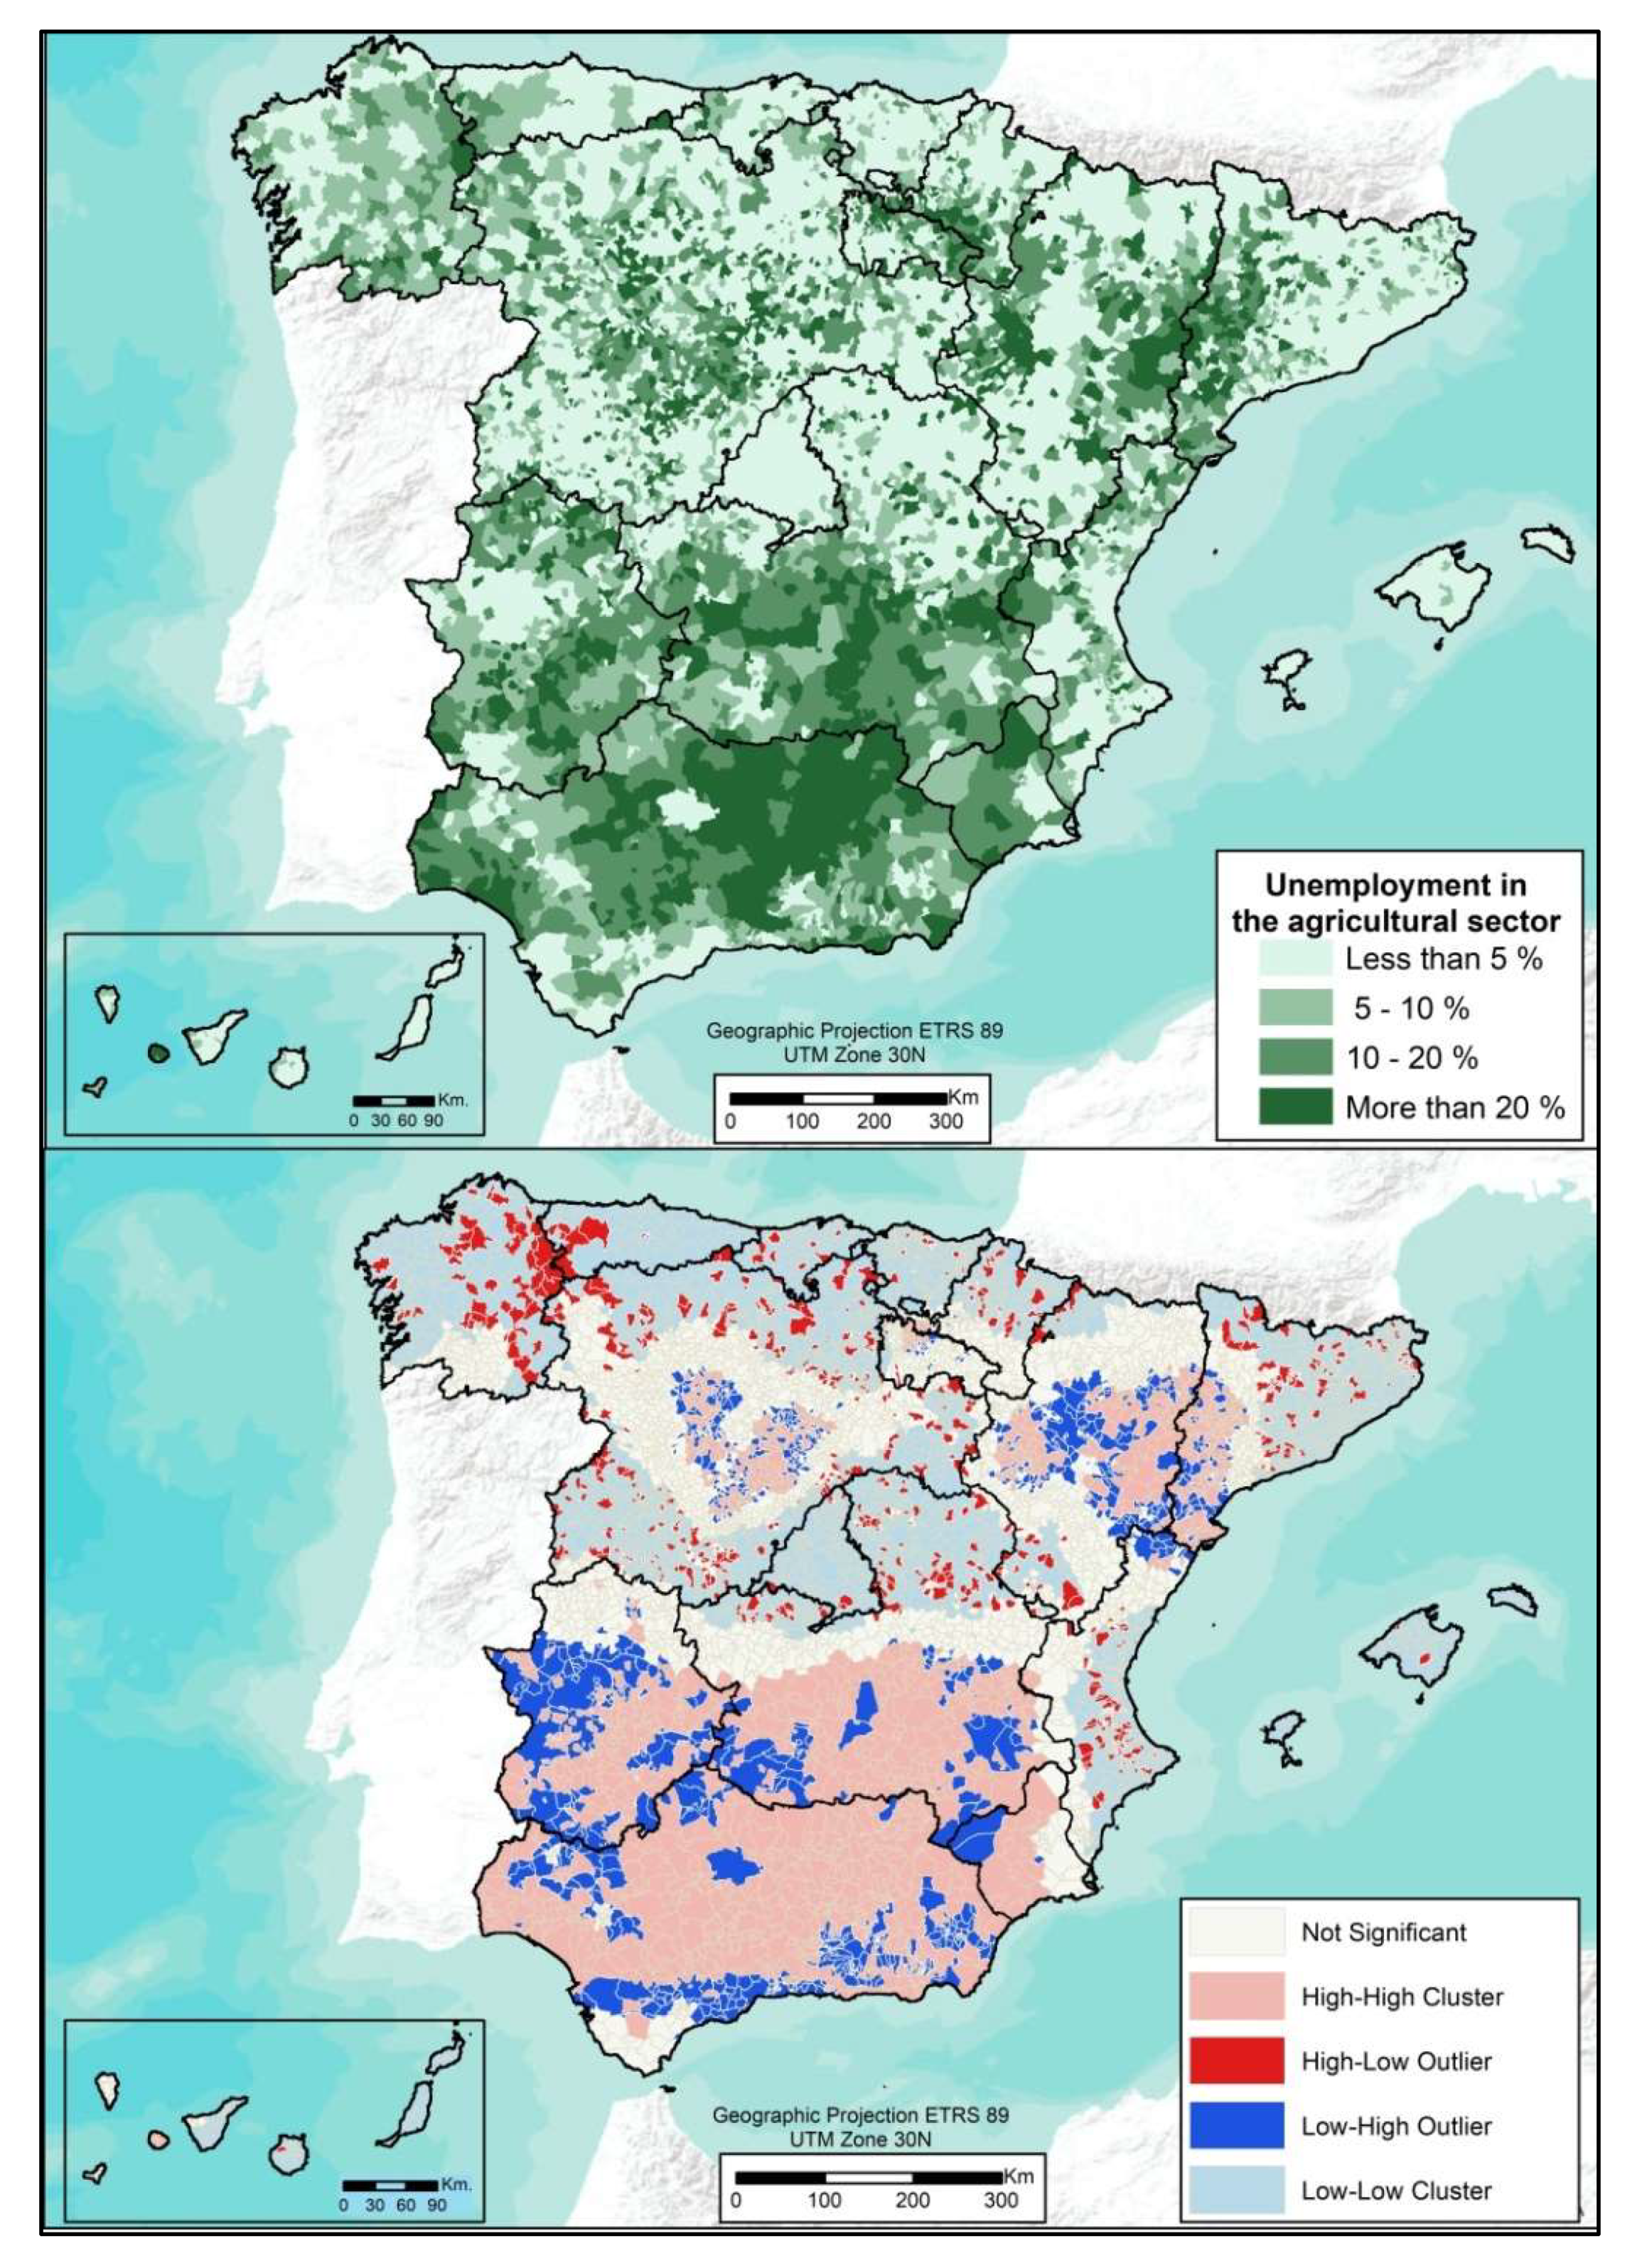
- Data of job seekers. These were obtained from the Public State Employment Service (PSSE) for 2018. The unemployment rate was calculated taking into account the possible active population (population between 16 and 64 years old) because the data of the active population at the municipal level were not available. The percentage of job seekers by activity sectors was also calculated to study that corresponding to the primary sector.
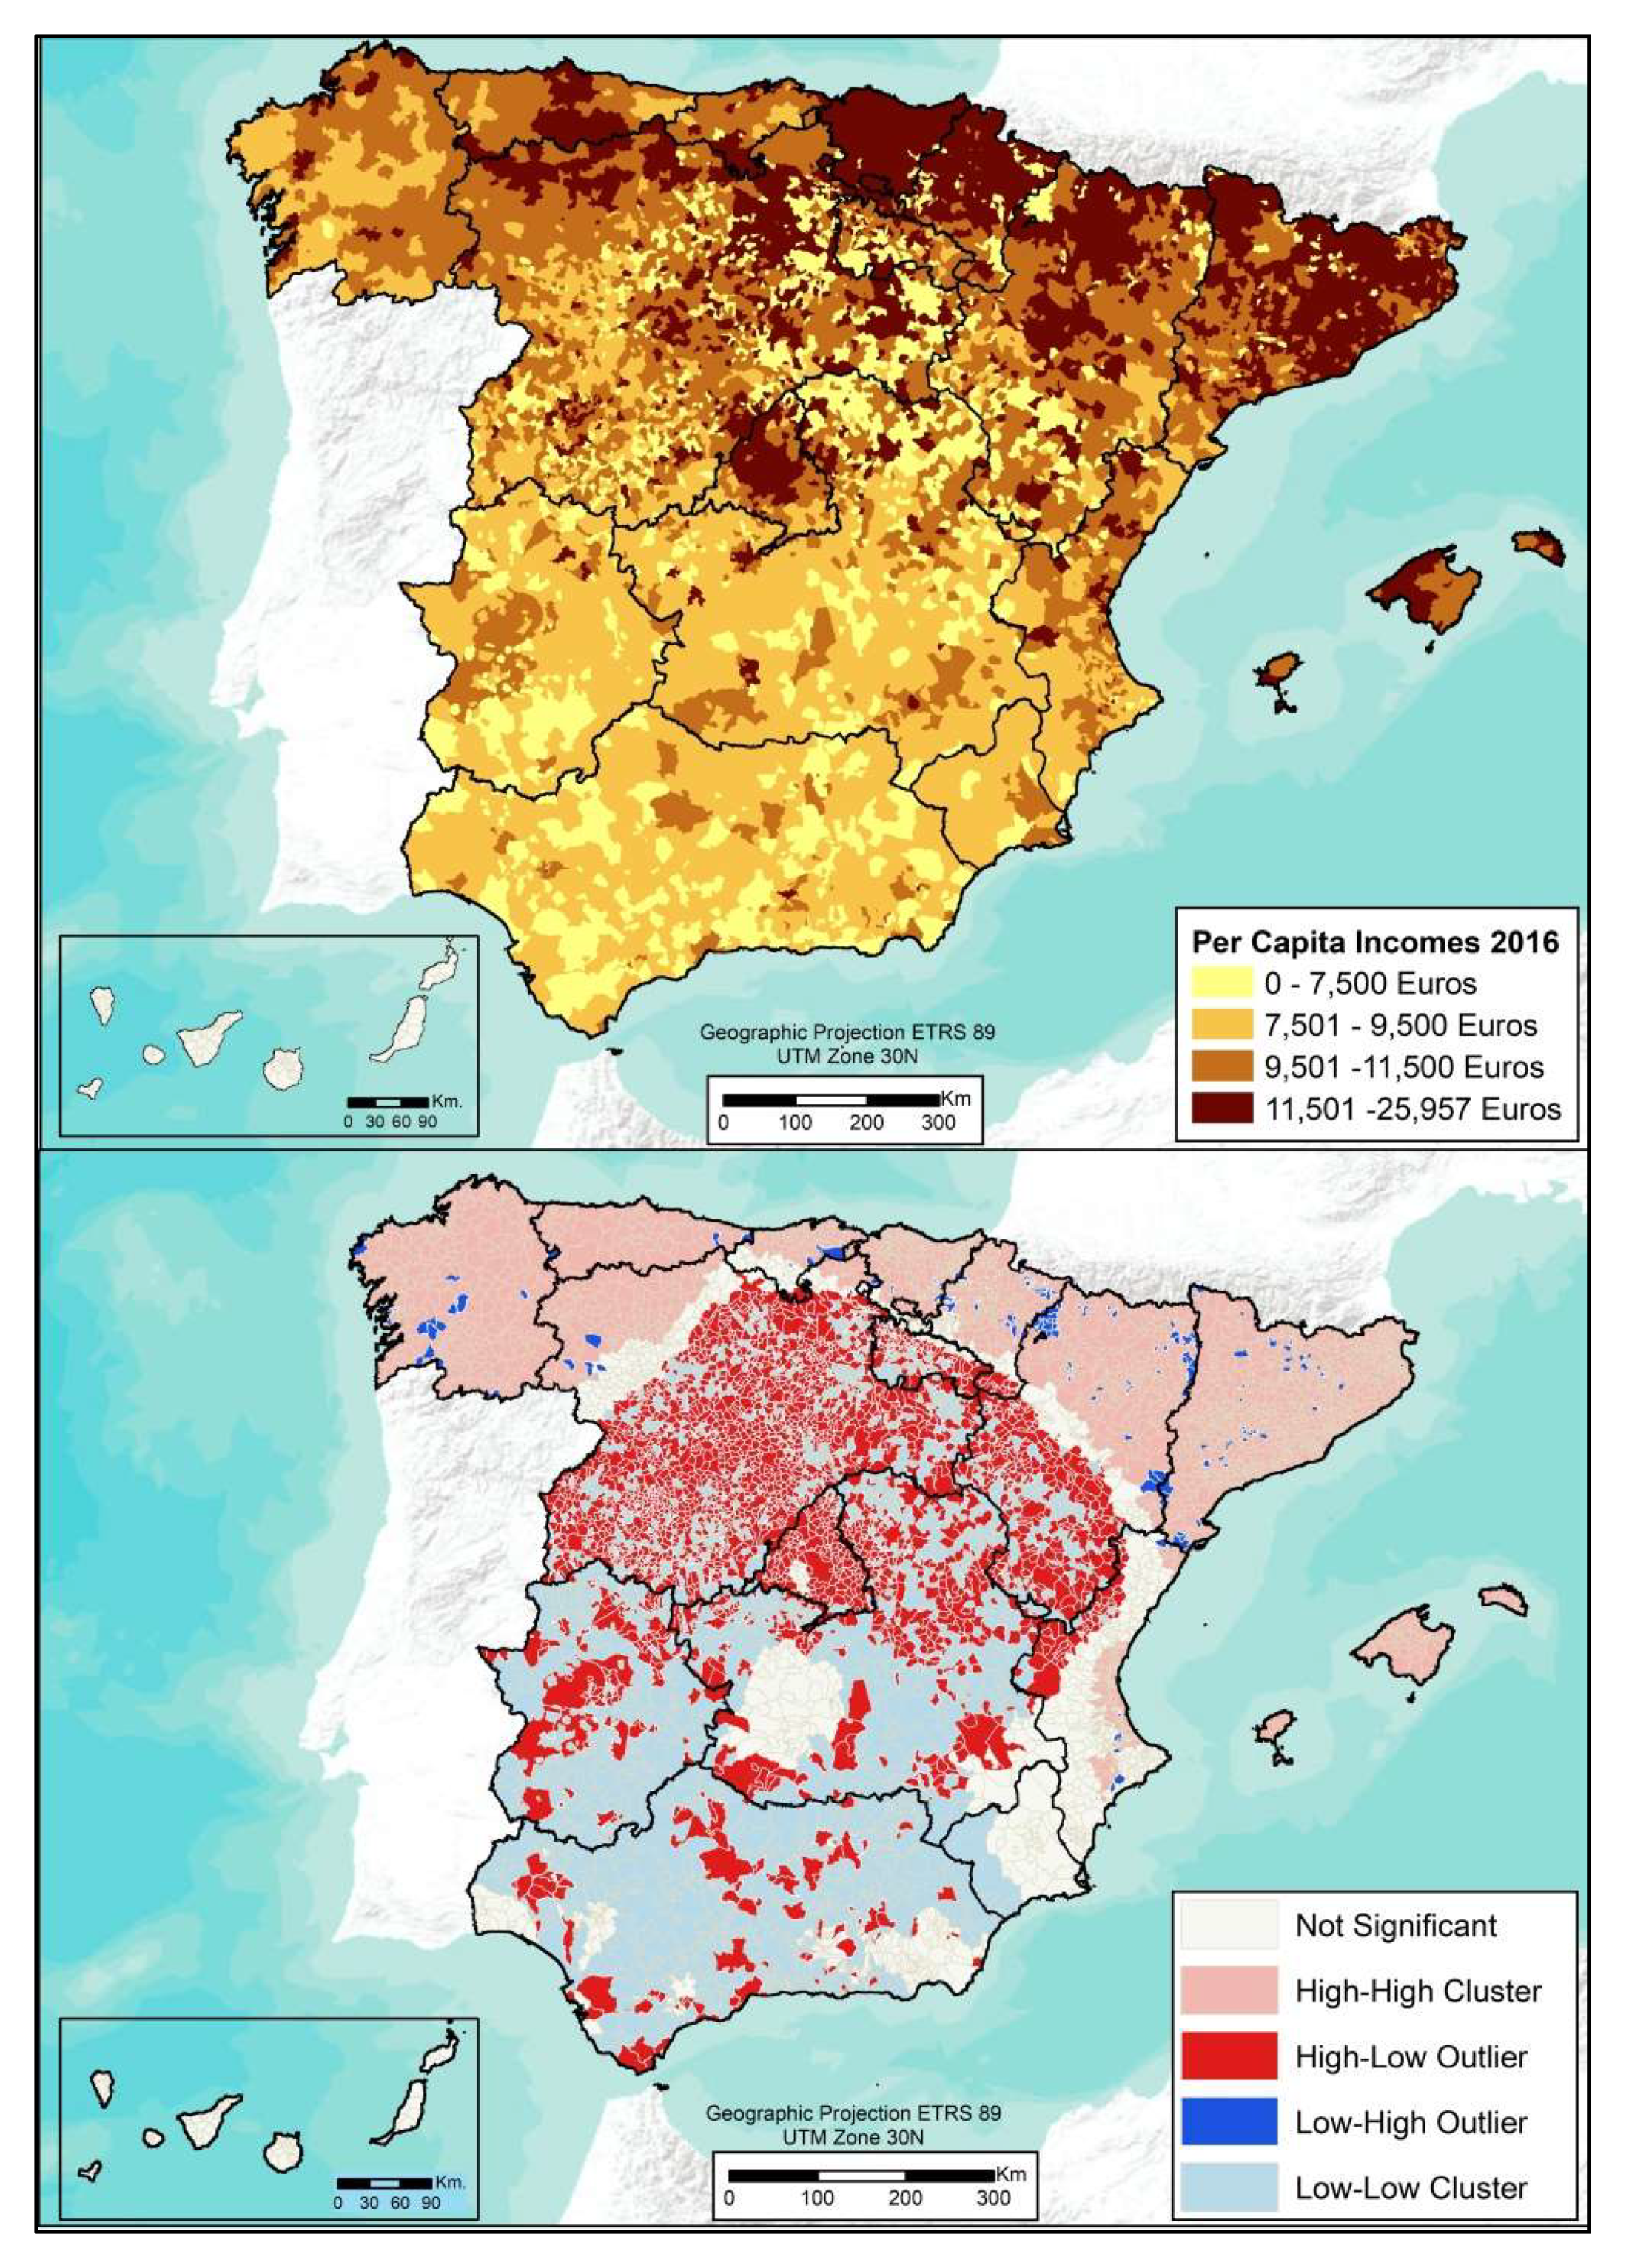
- Economic variables published in the Experimental Atlas of the National Statistics Institute. The average income per capita of 2016 was the chosen variable to be analyzed.
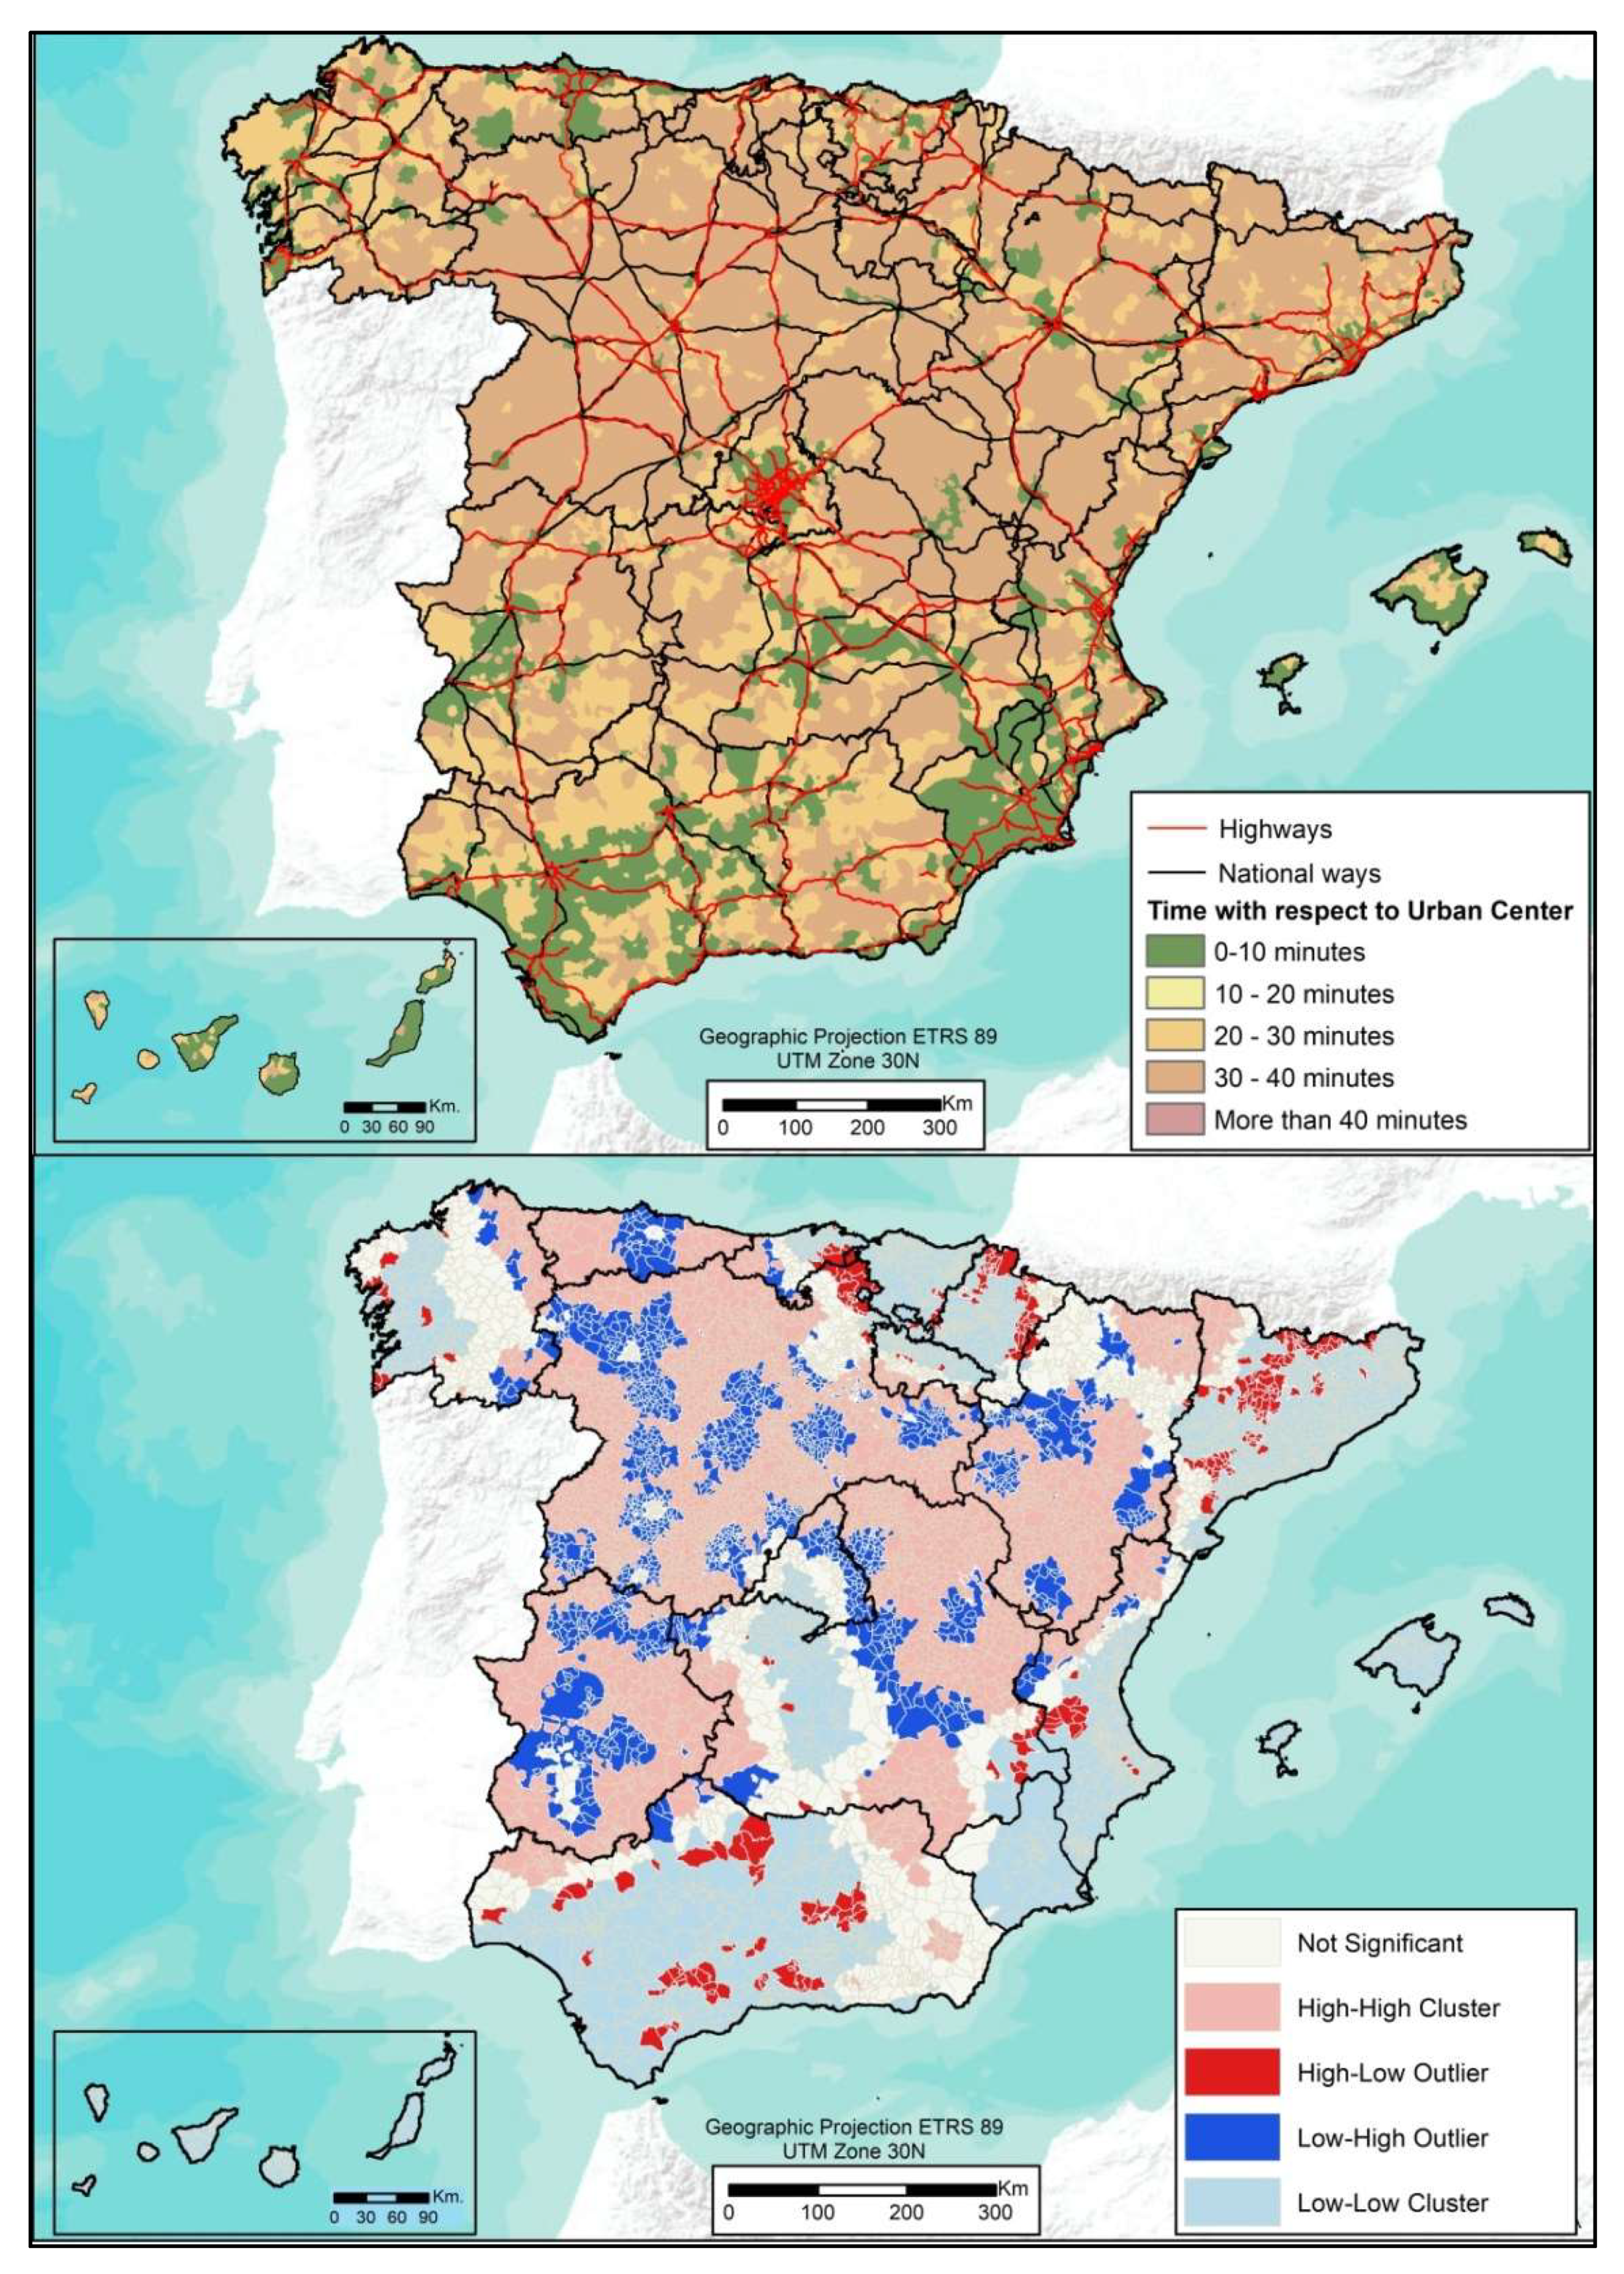
- The national roads and the main road network of Spain were obtained from the National Download Center (NDC) of the National Geographic Institute (NGI) cartographic information on transport networks in 2019.
2.2.2. Accessibility Calculation
2.2.3. Spatial autocorrelation analysis
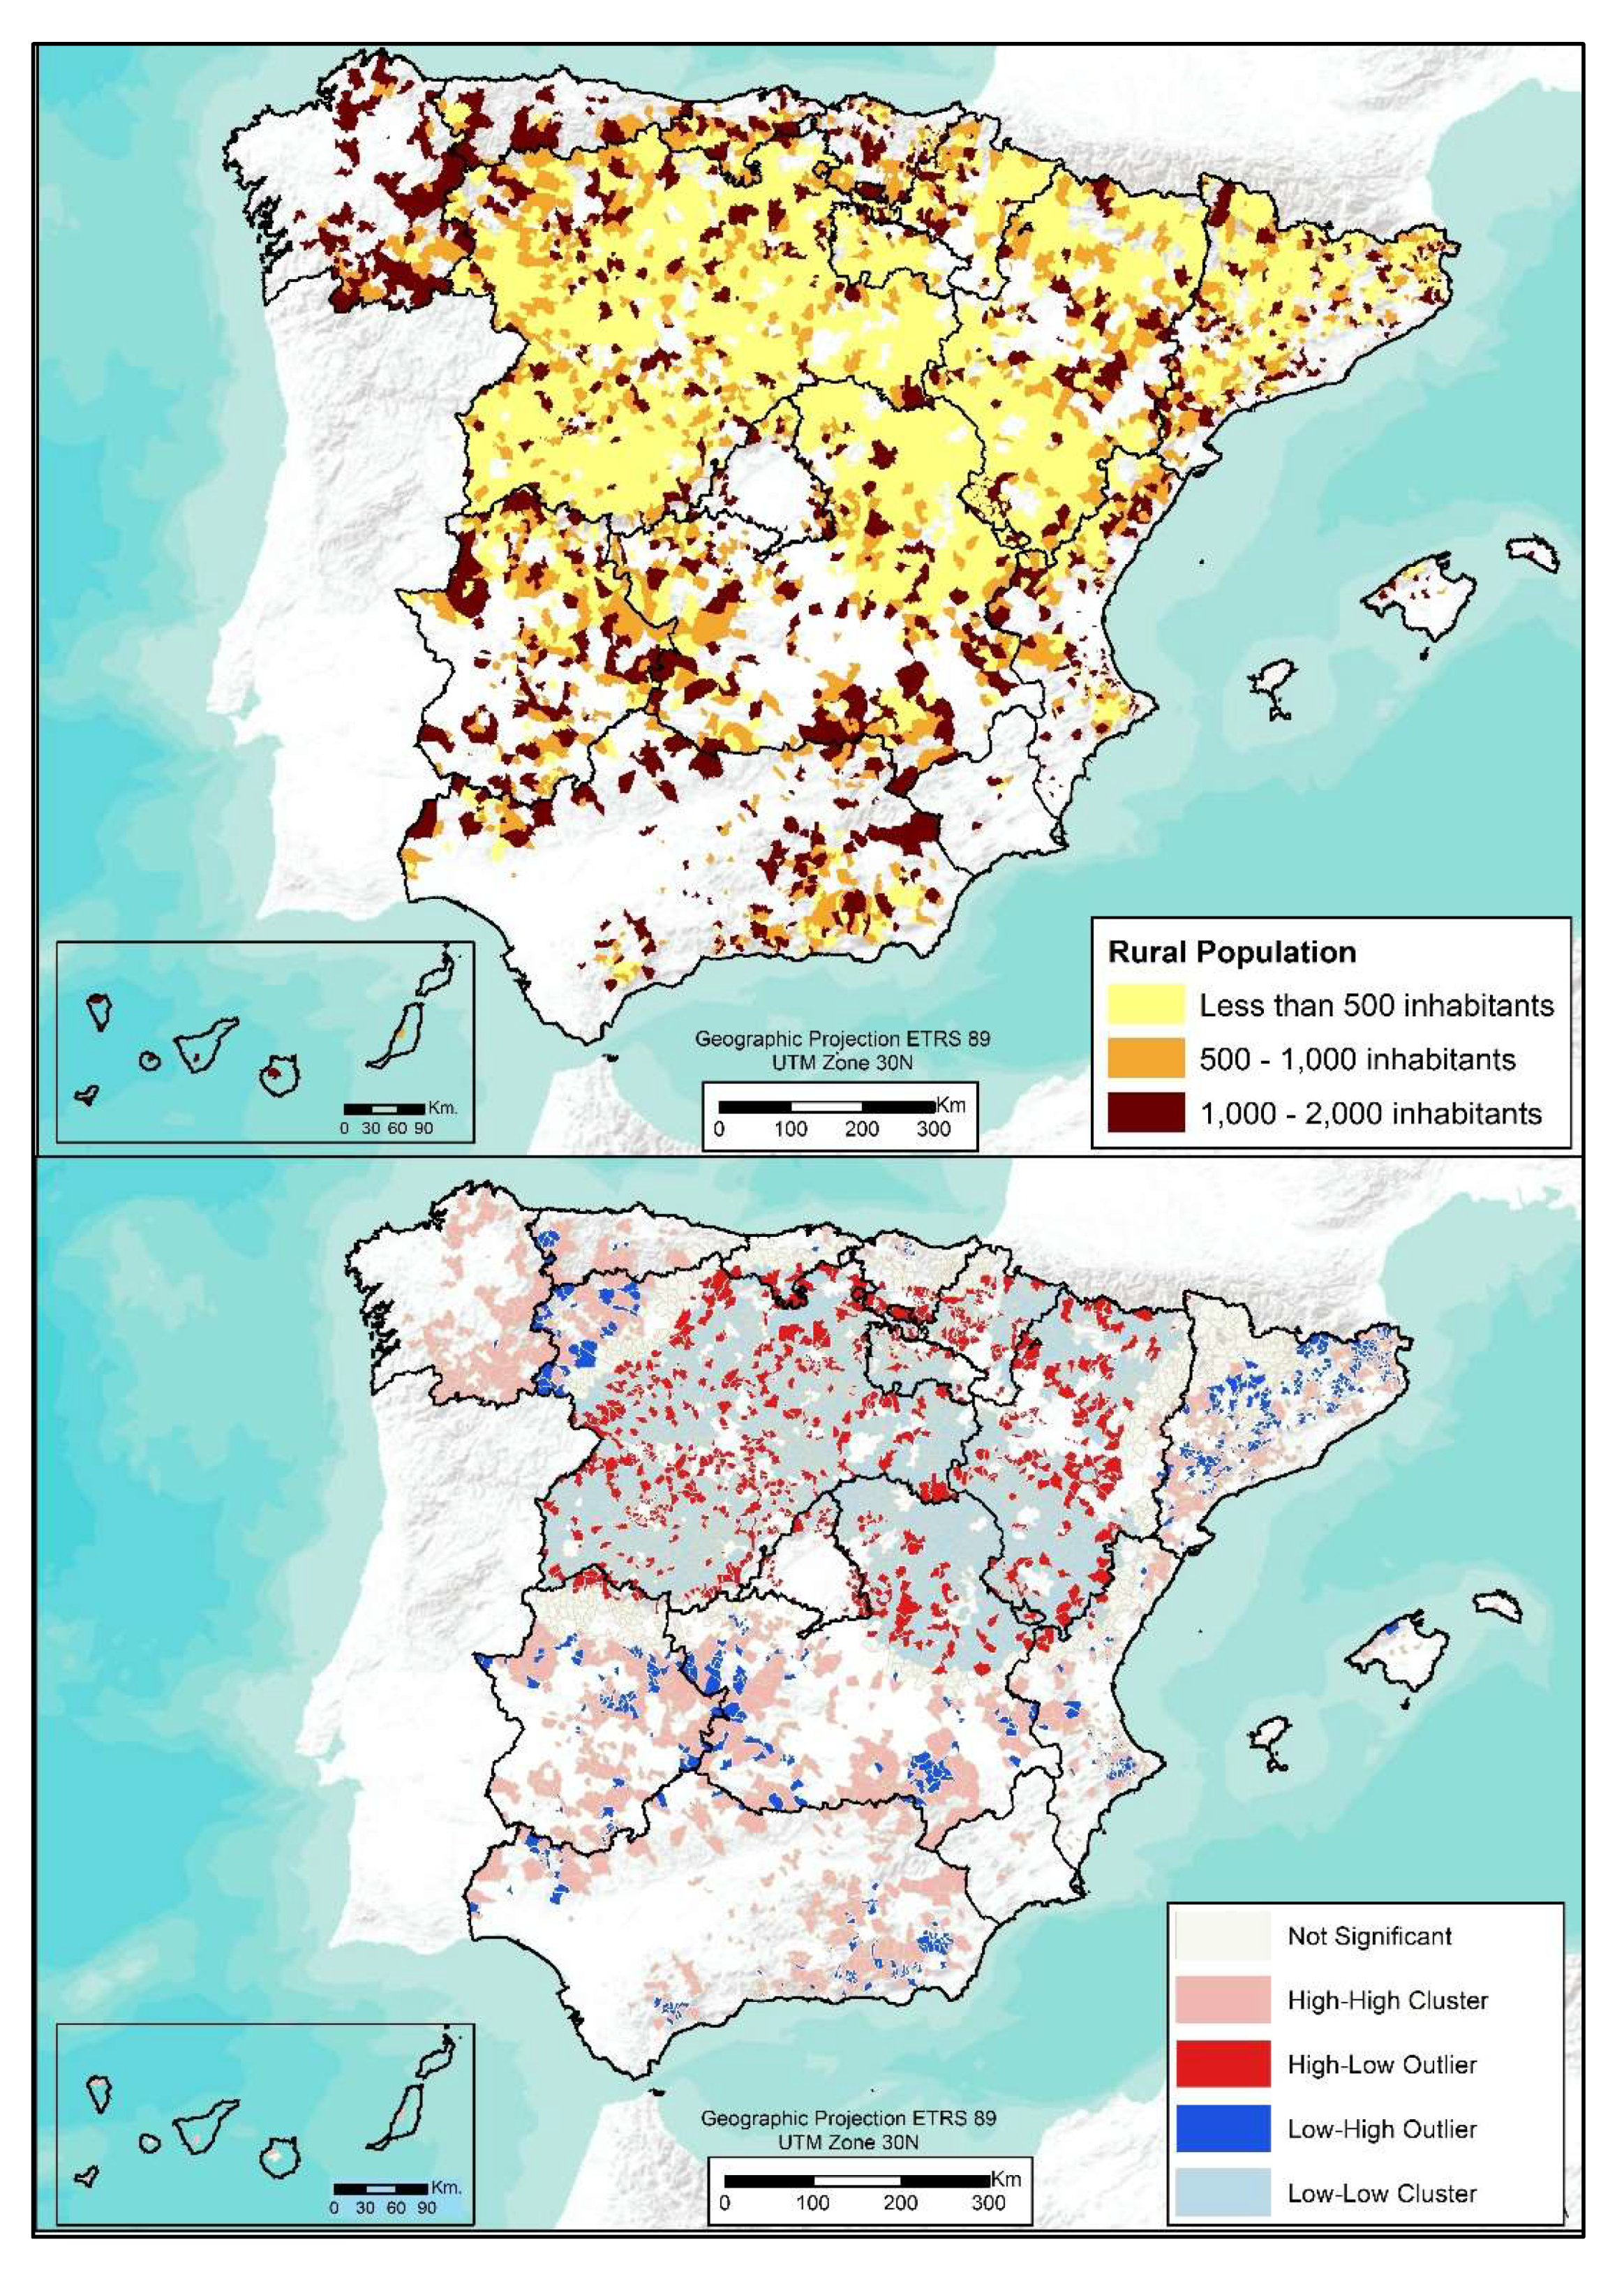
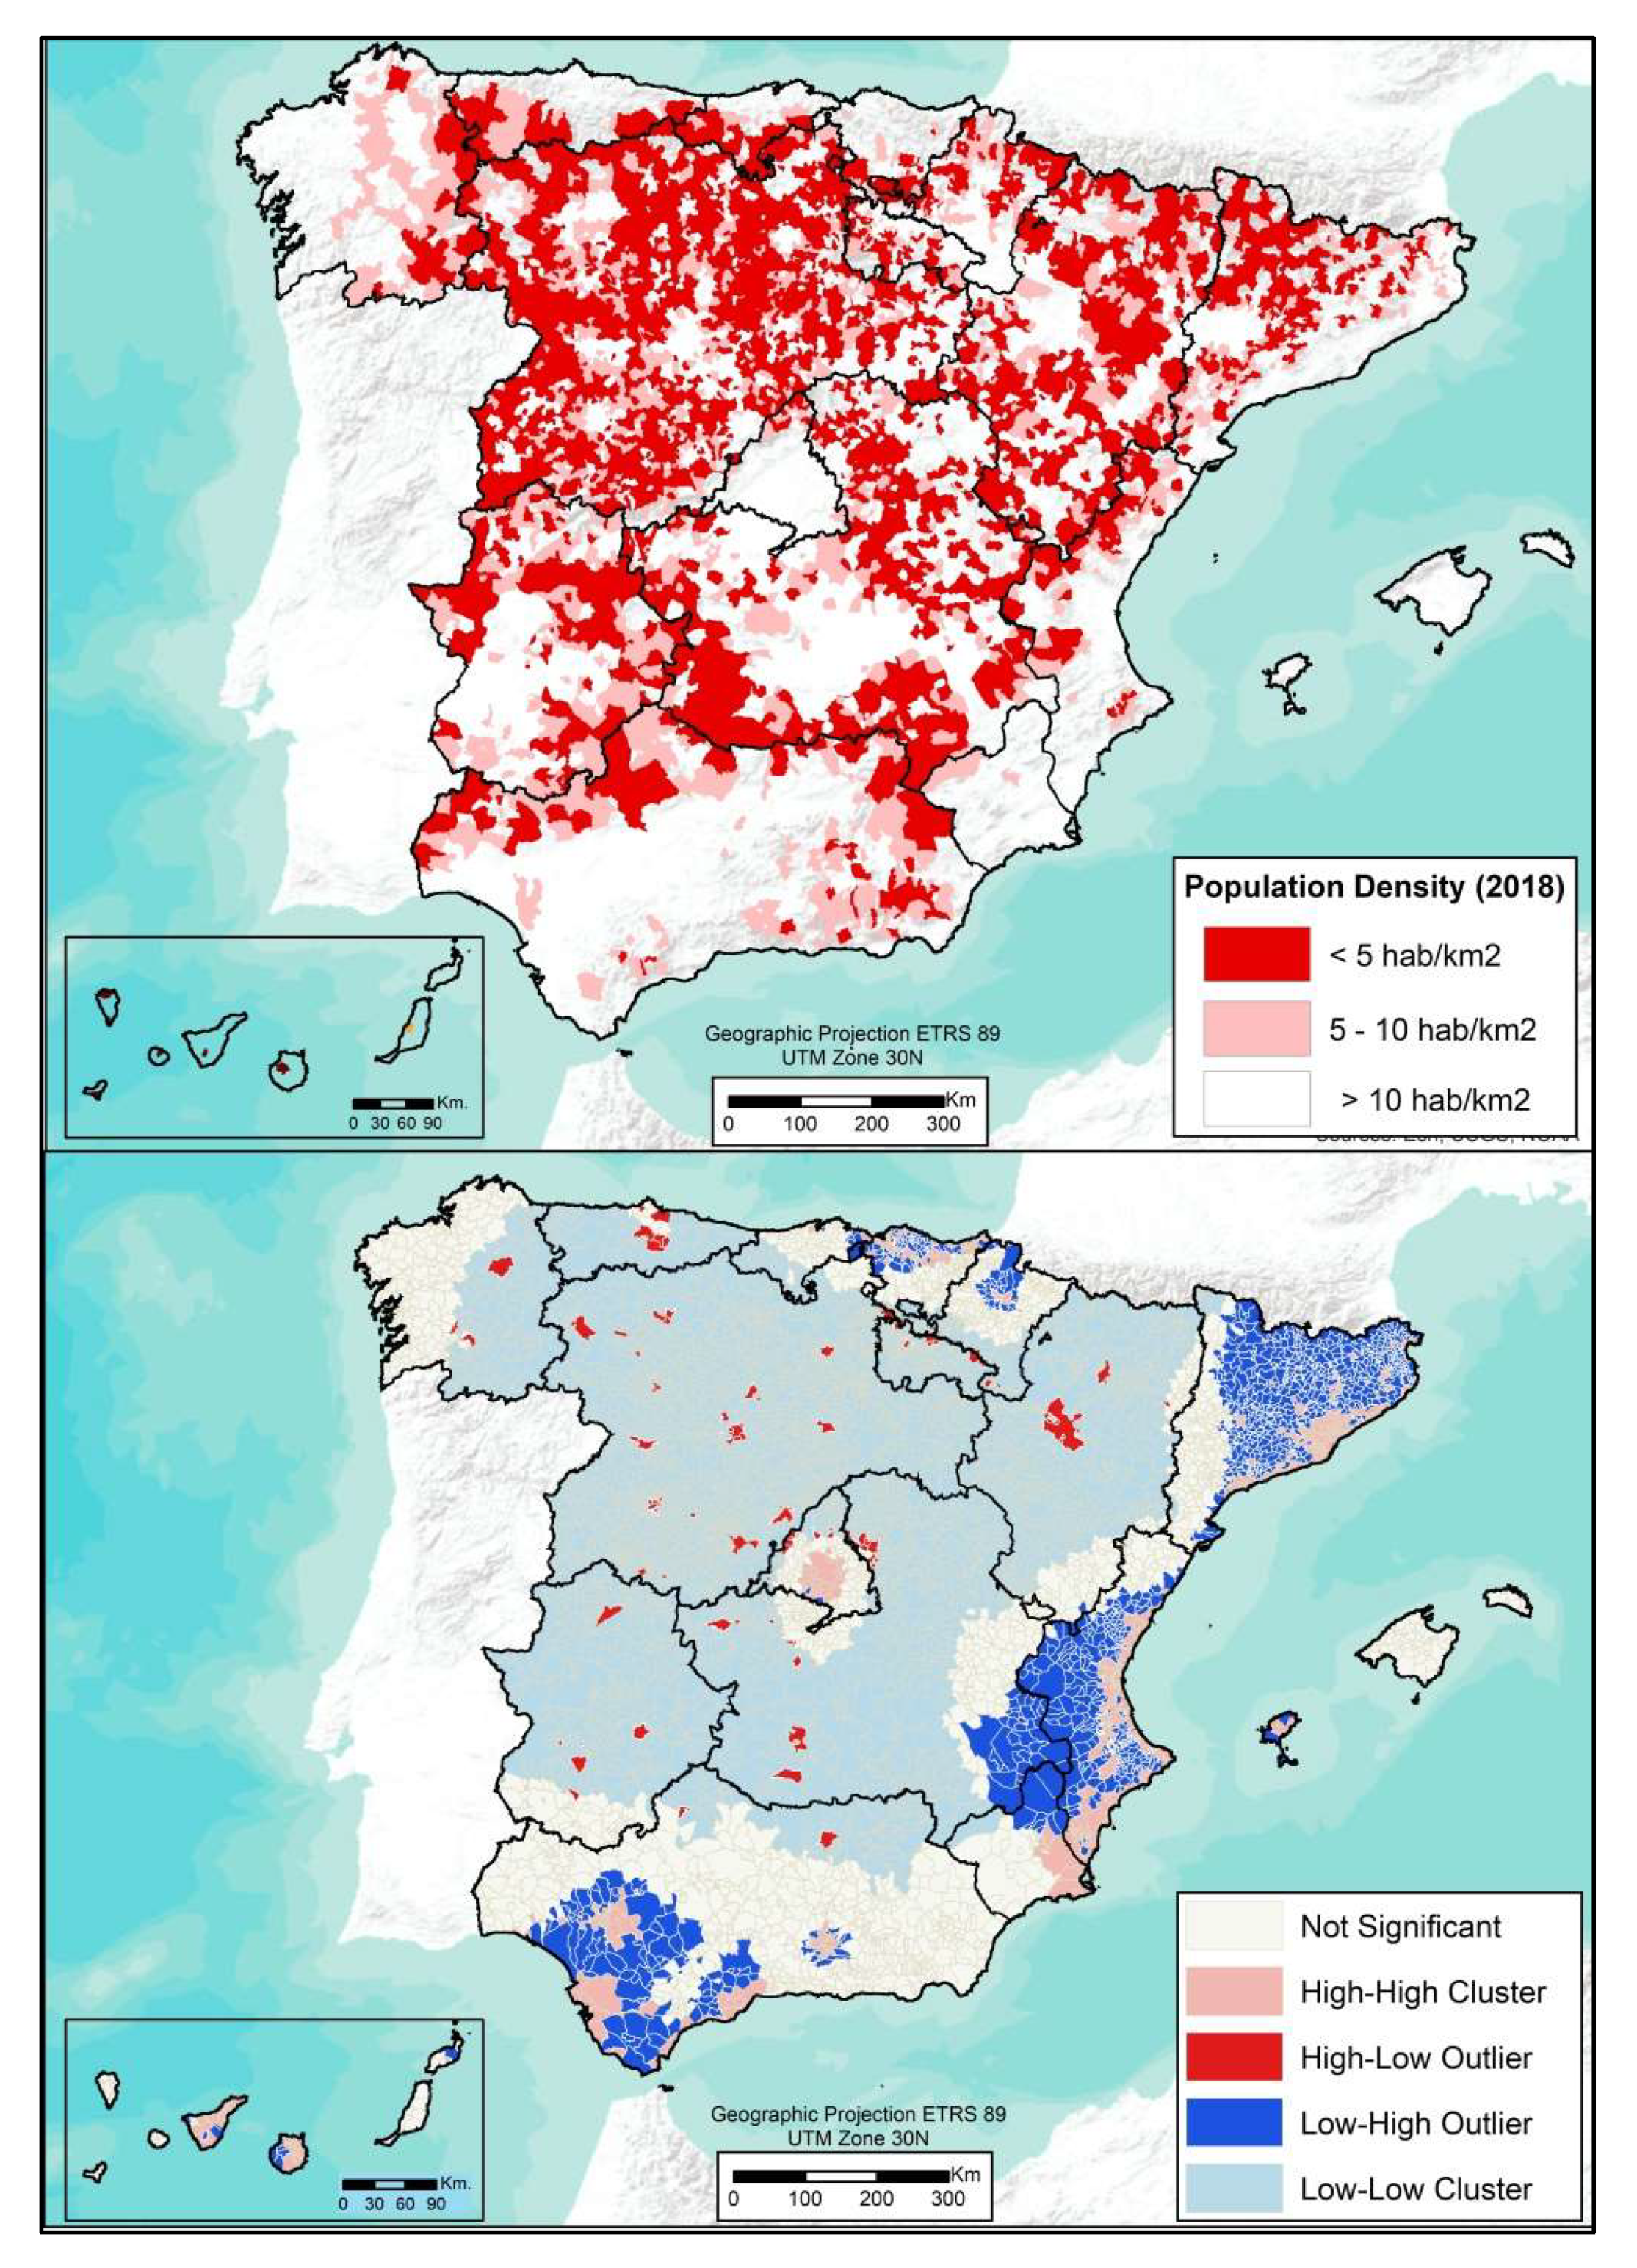
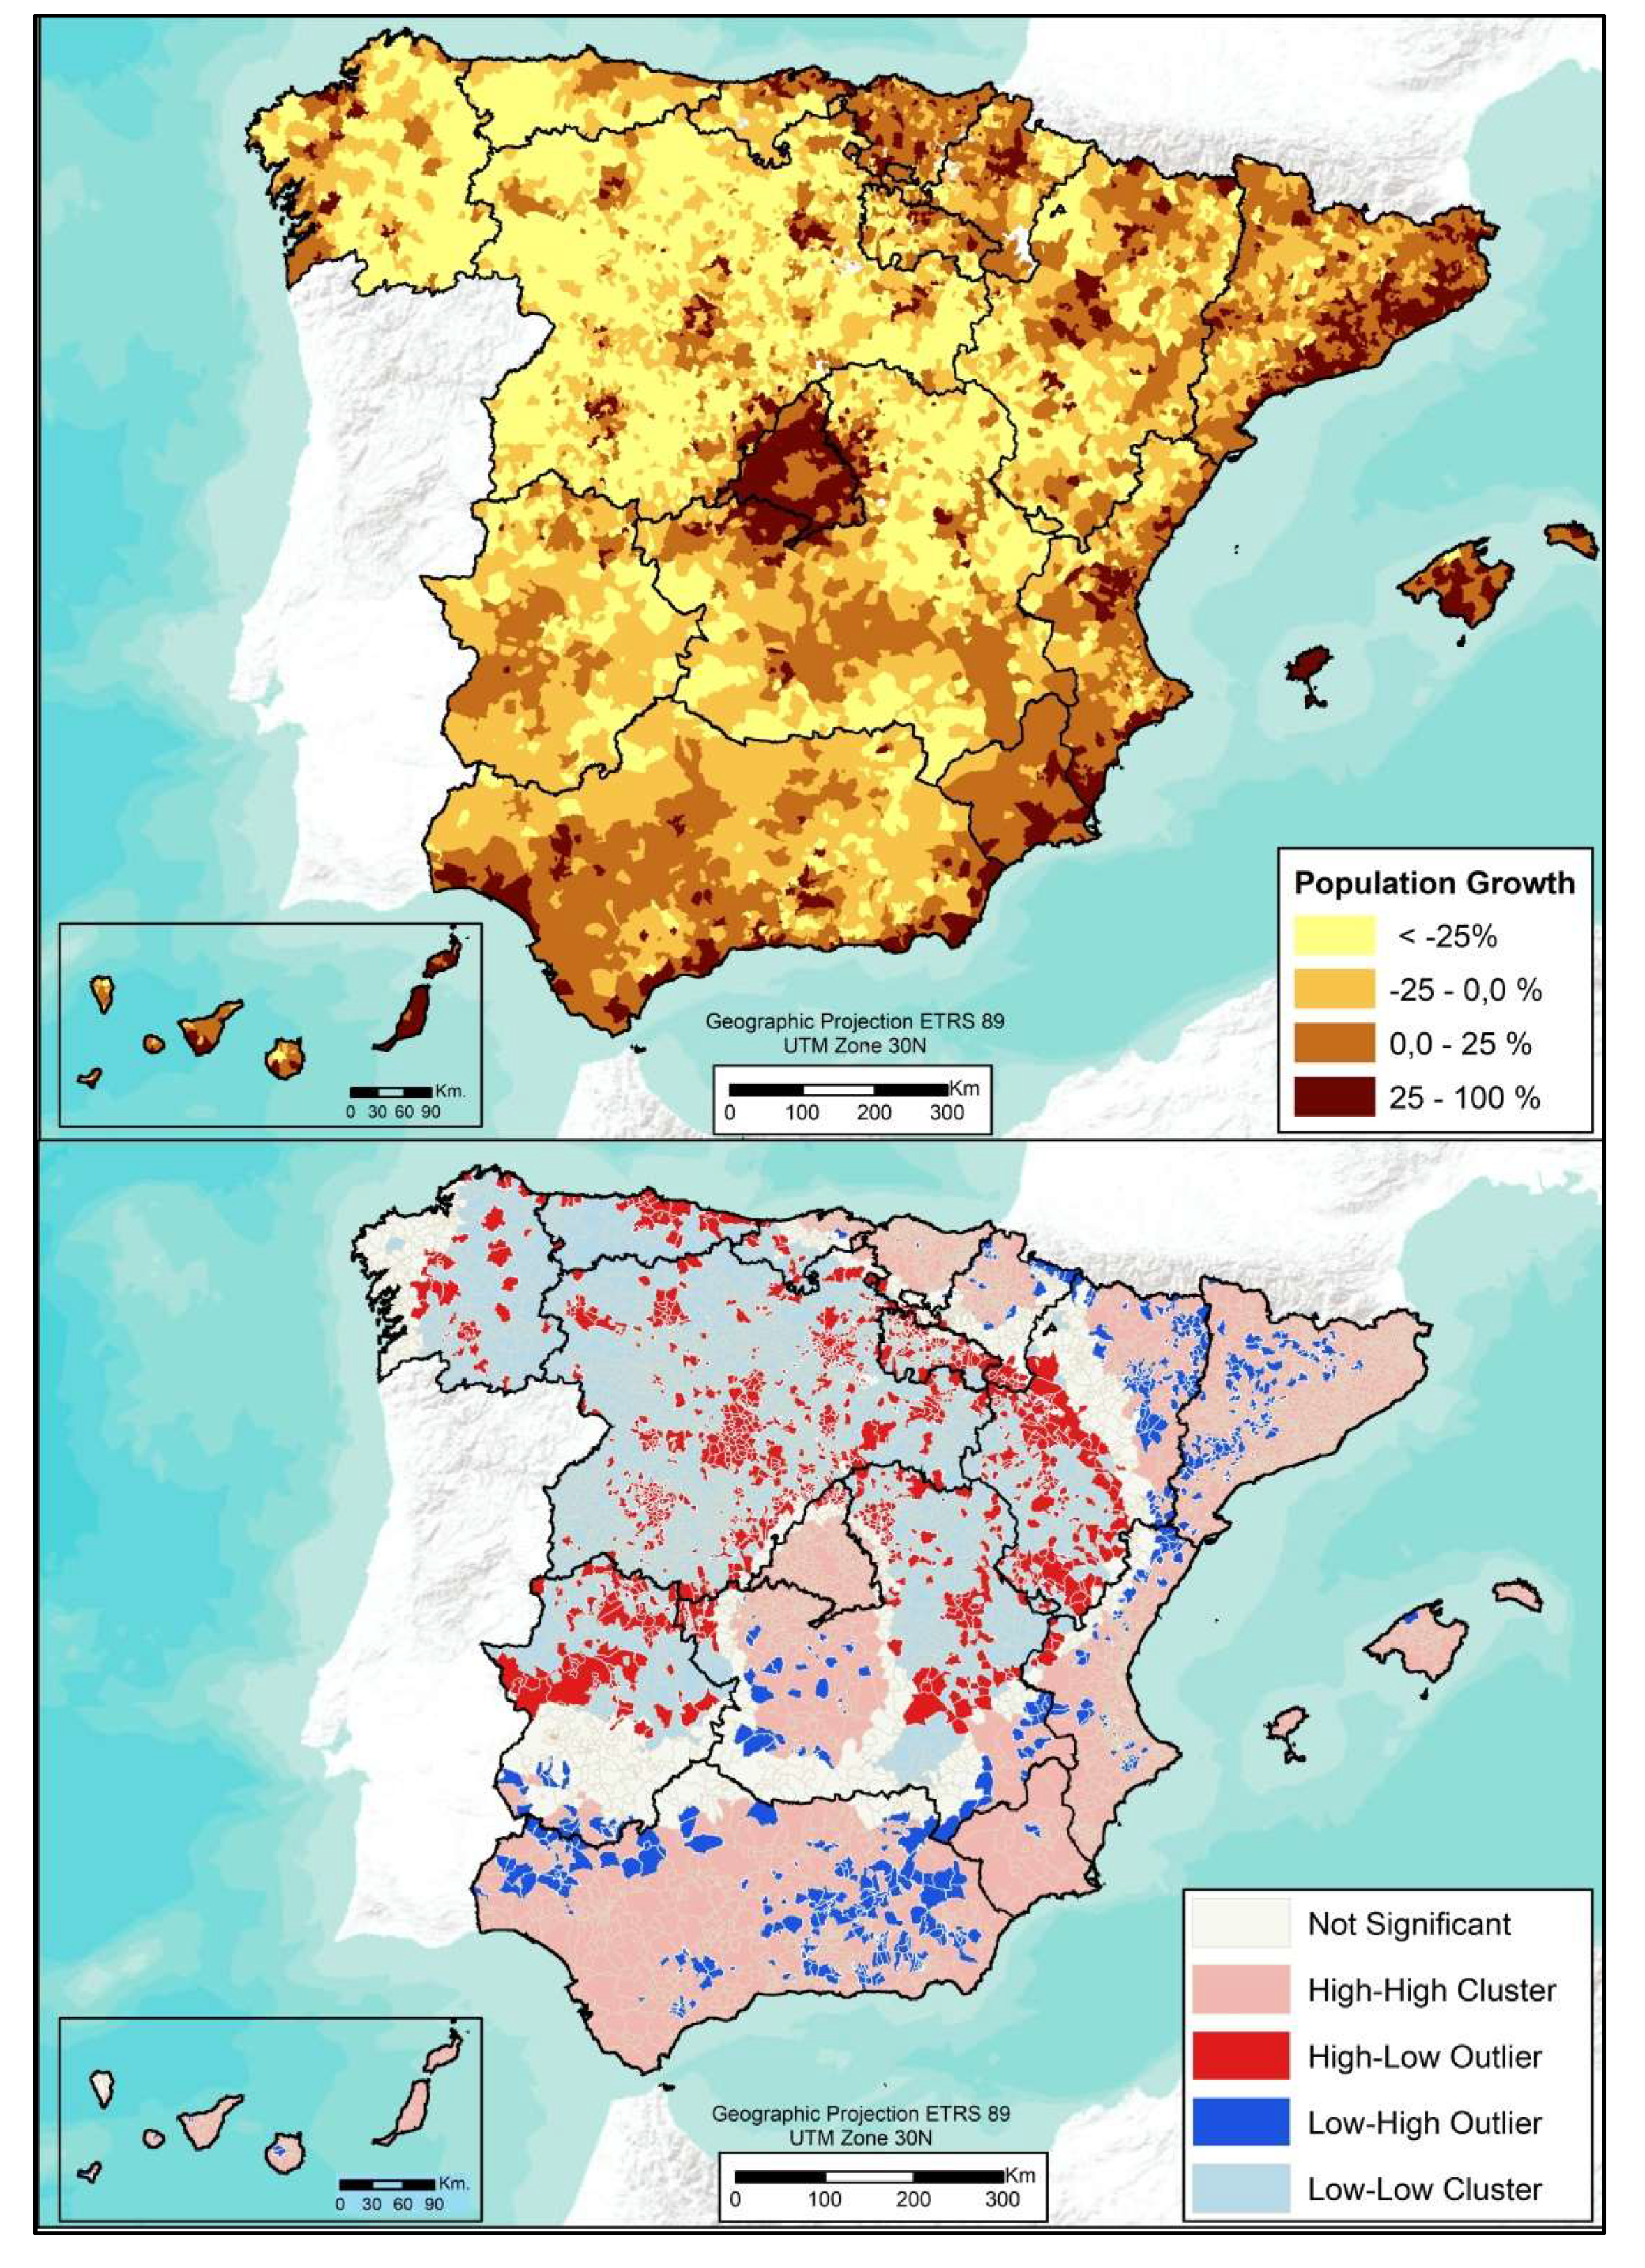
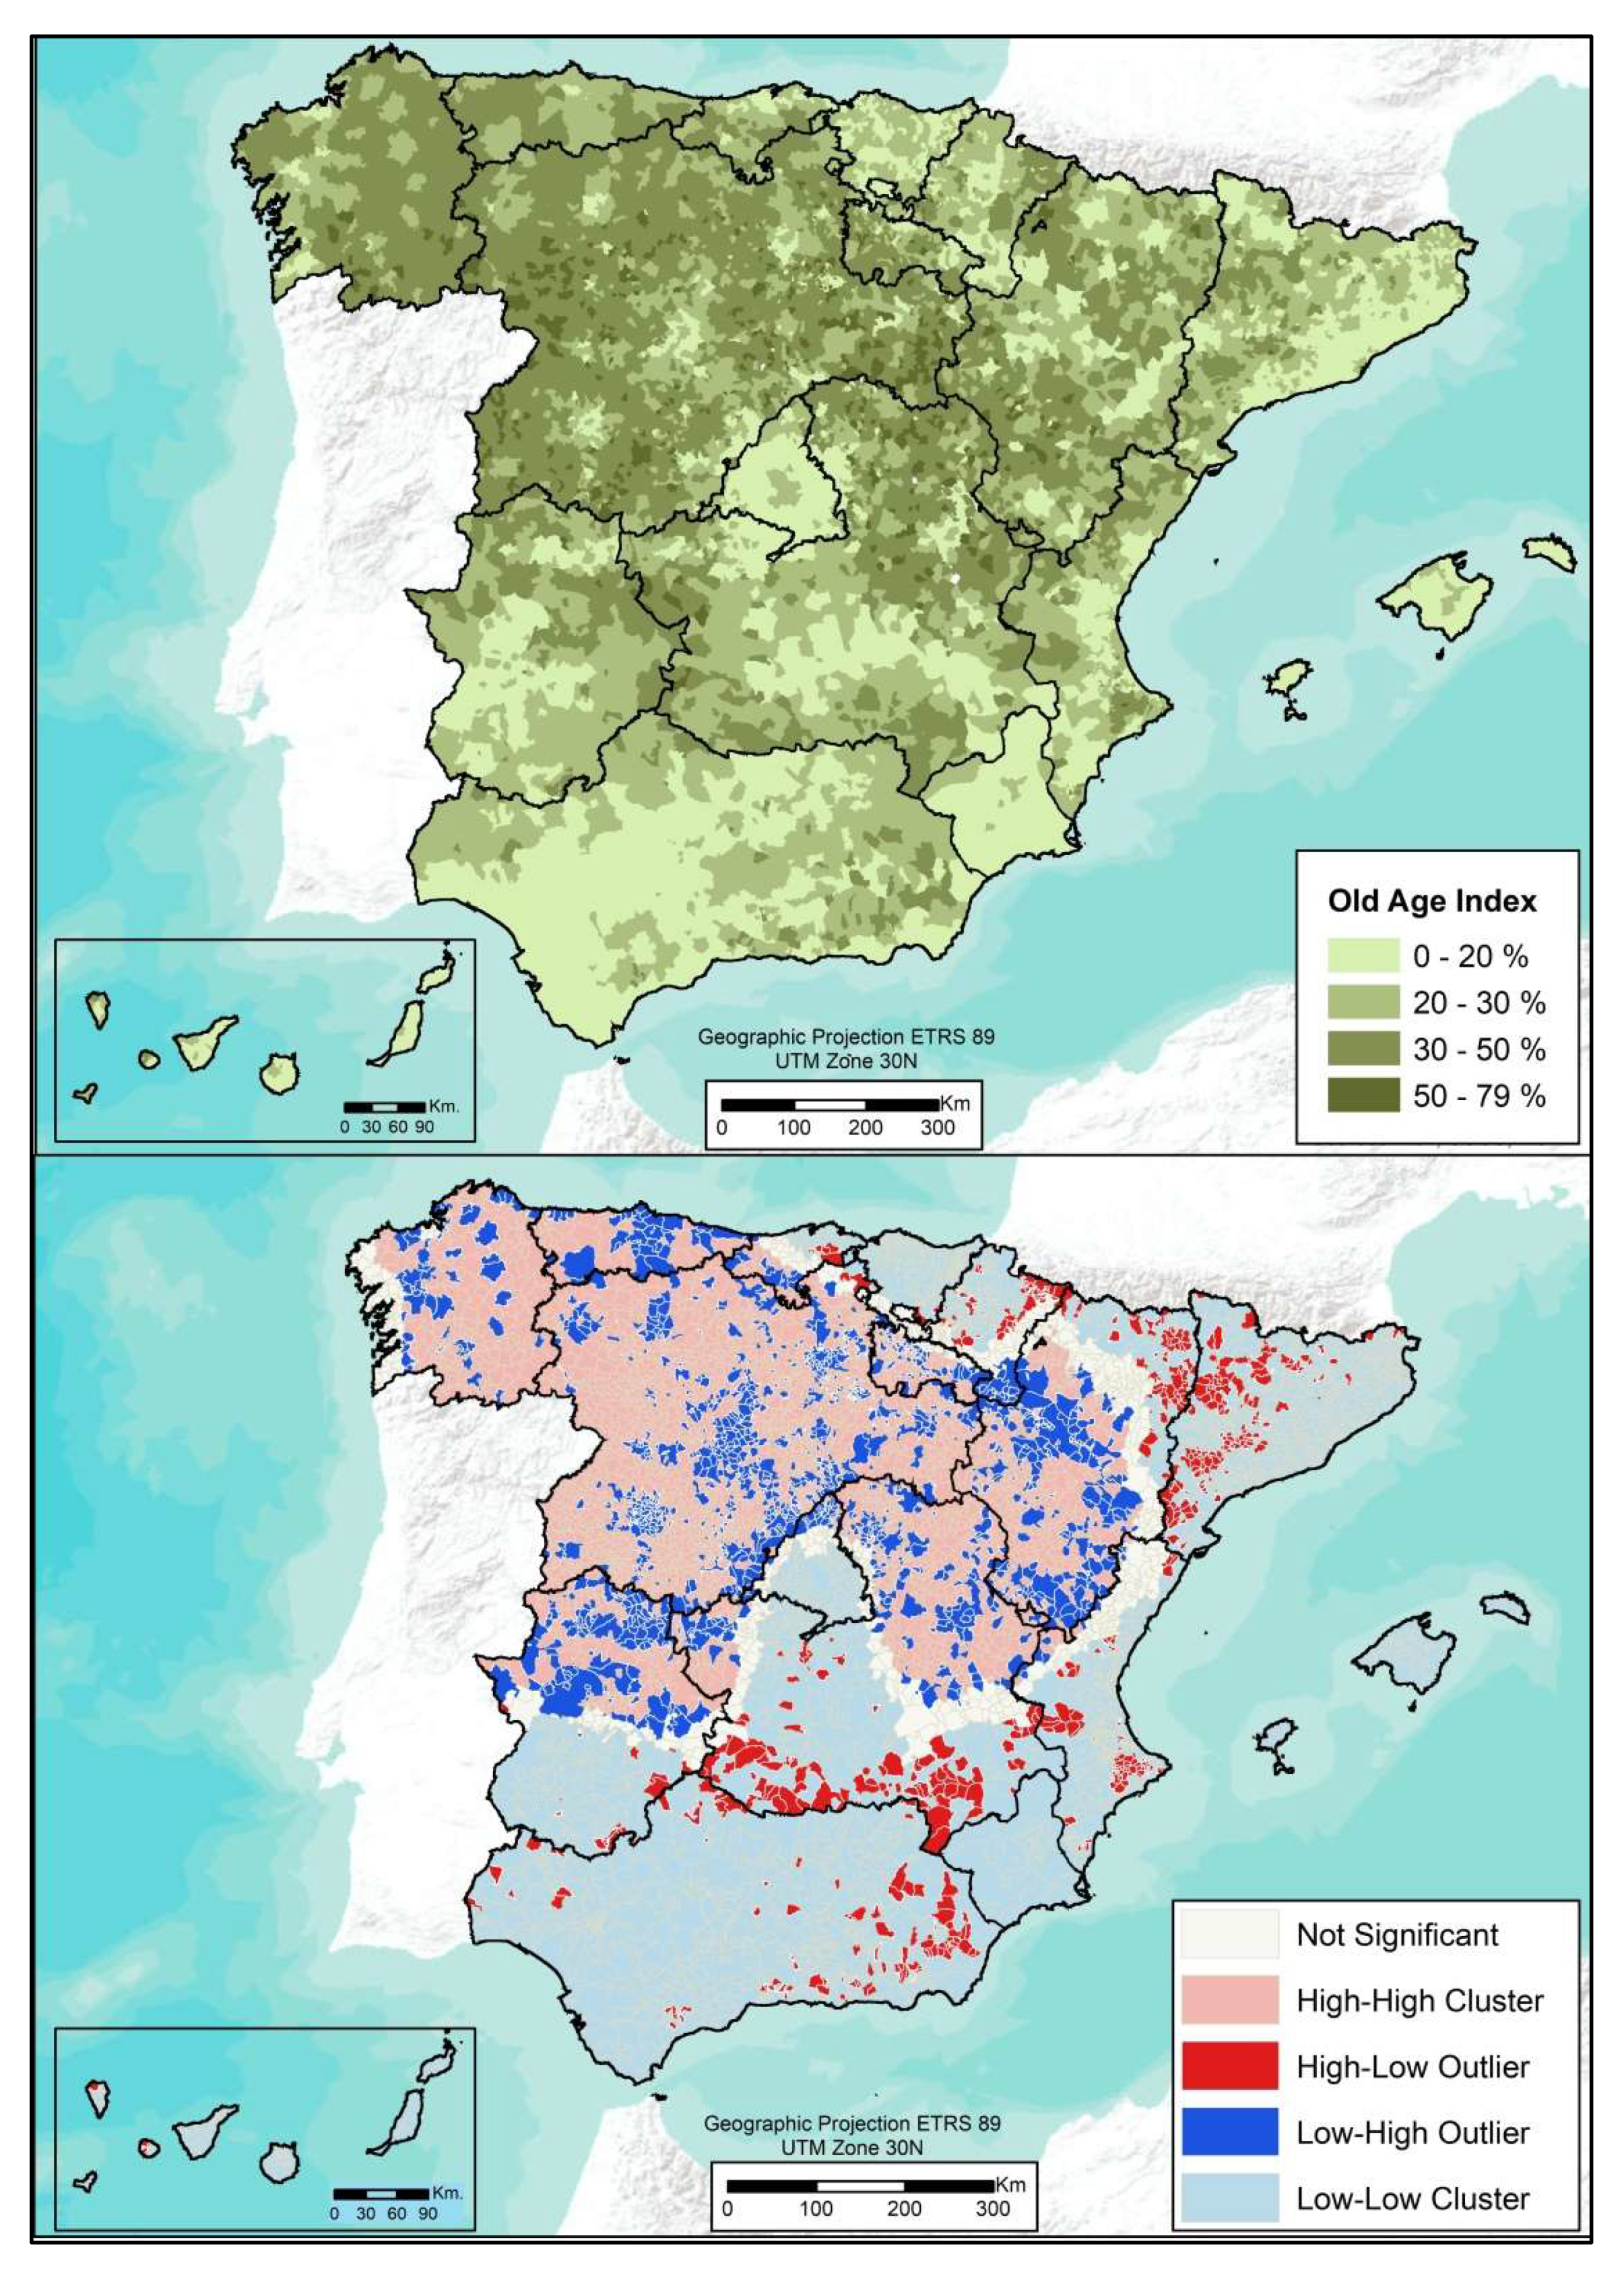
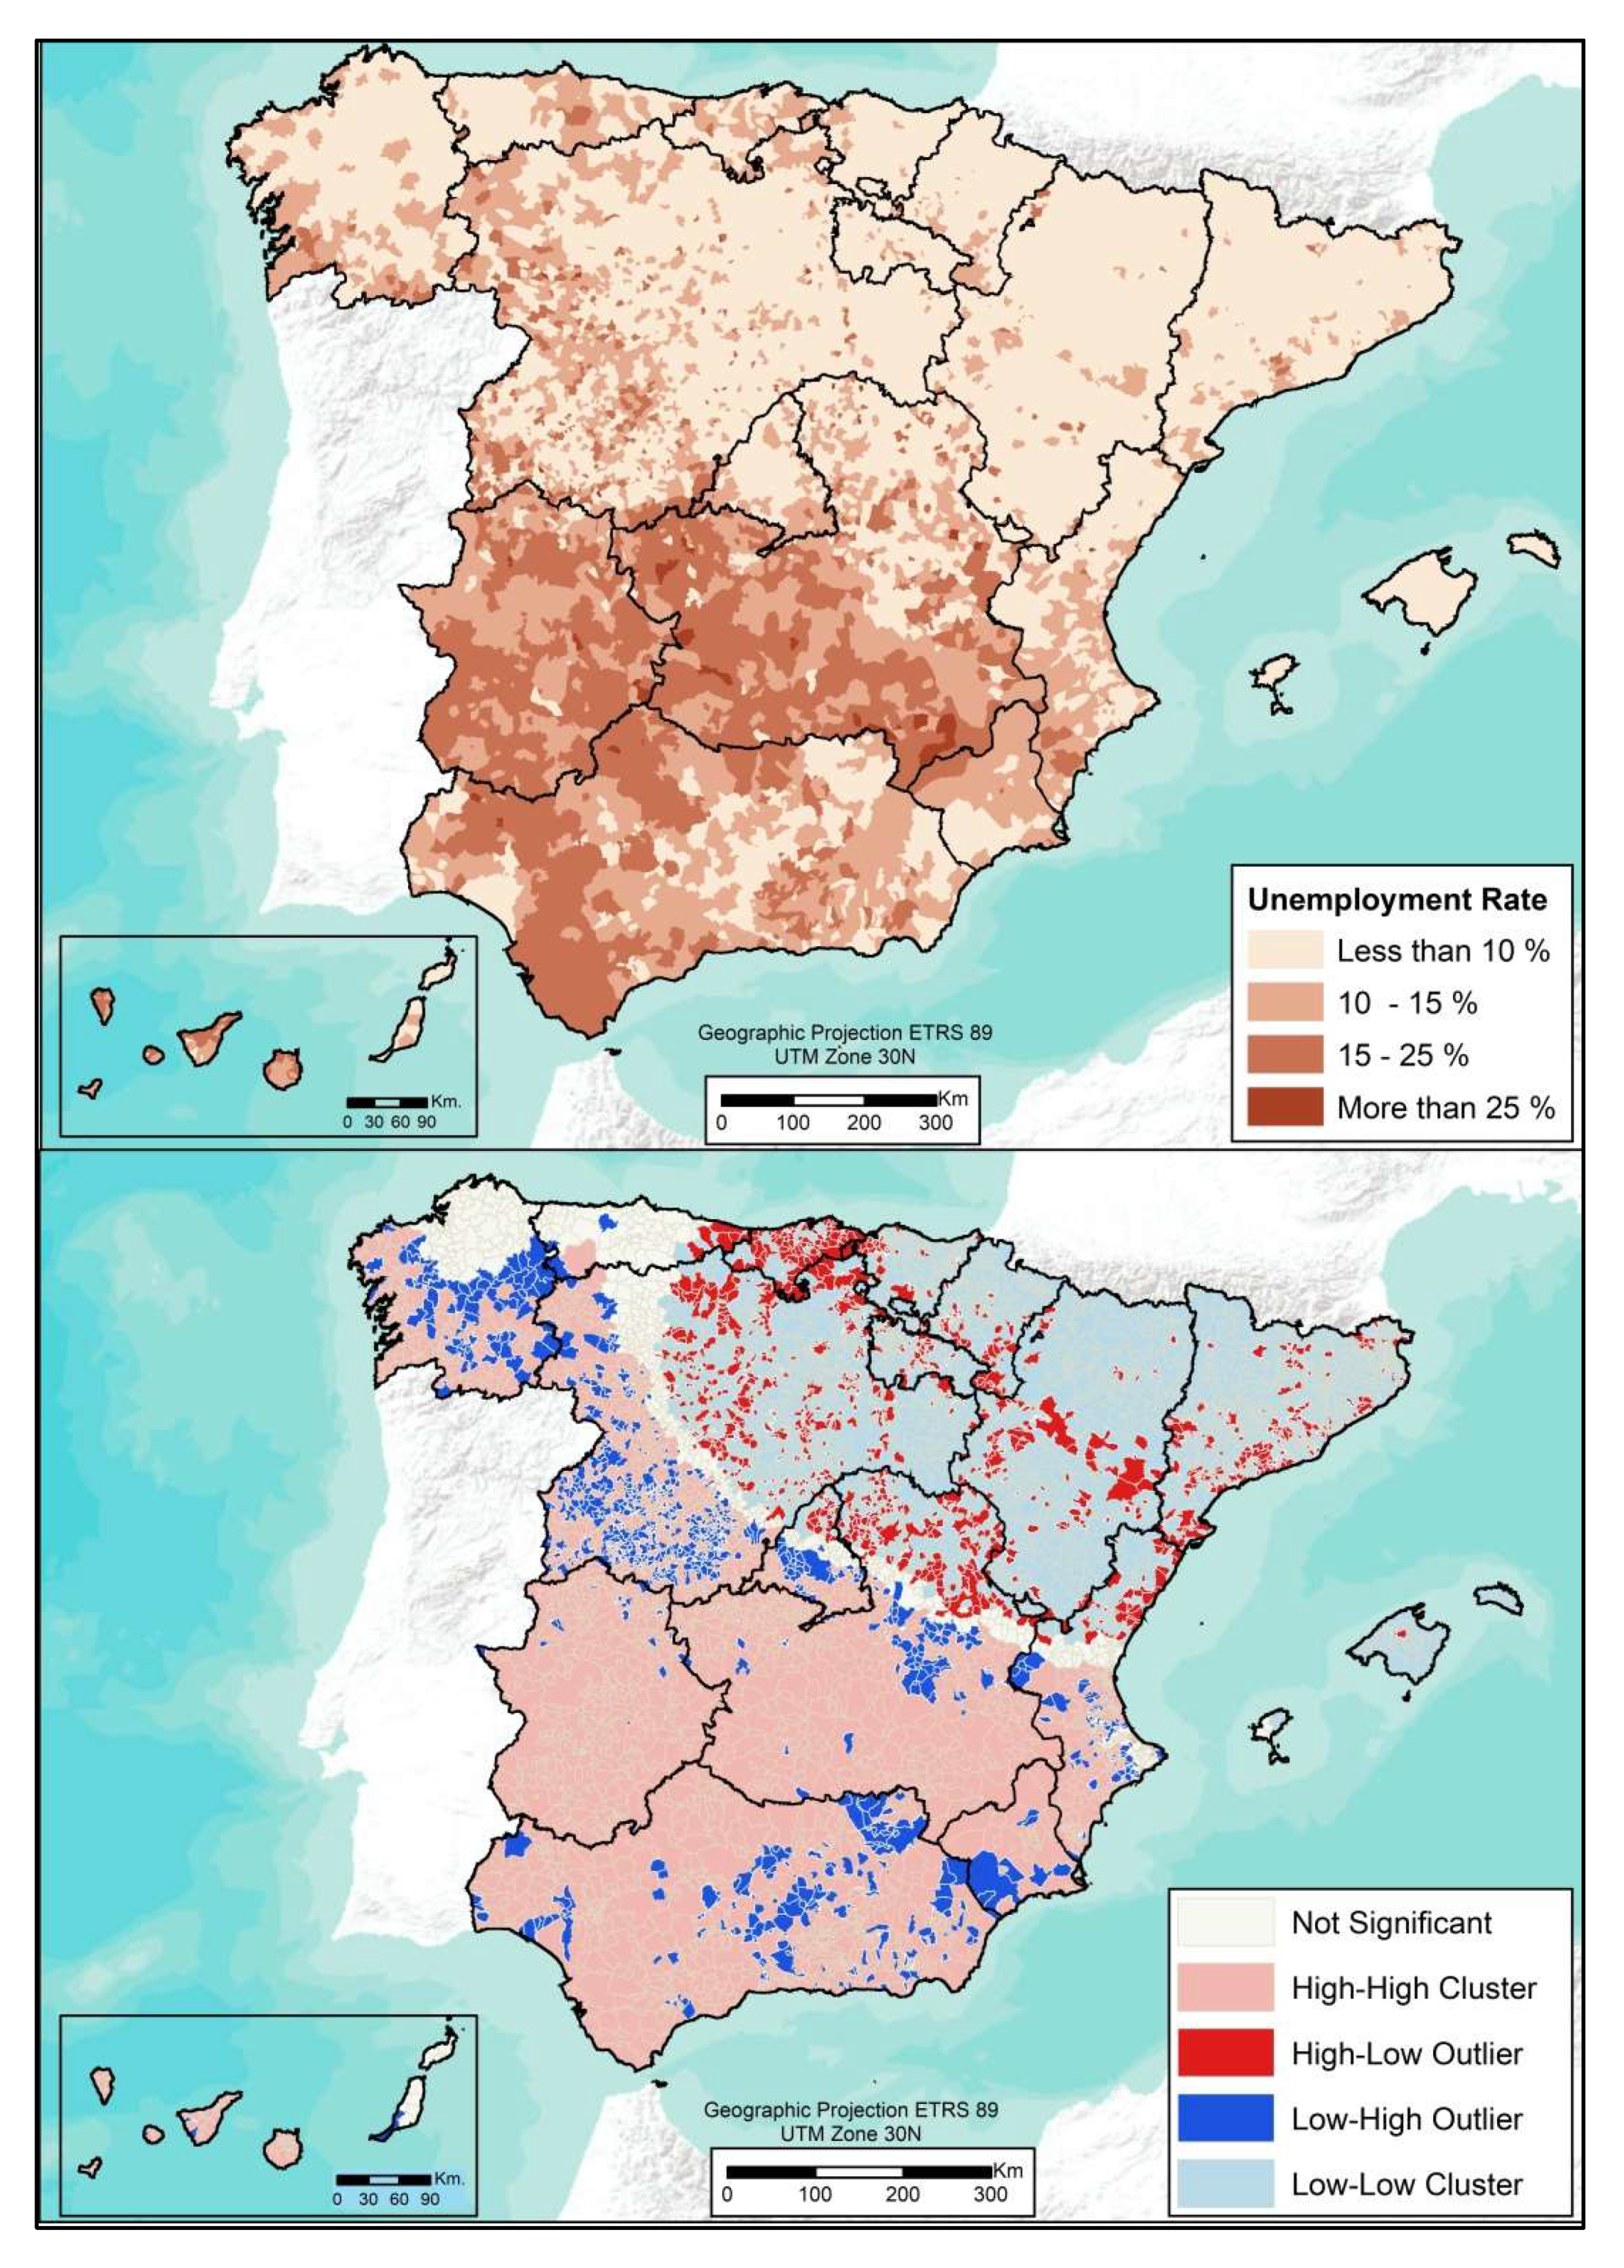
- High-High (areas with high presence surrounded by areas with high presence).
- High-Low (areas with high presence surrounded by units with low presence).
- Low-High (low presence areas surrounded by units with high presence).
- Low-Low (areas with low presence surrounded by units with low presence).
2.2.4. Pearson’s Bivariate Correlations
3. Results
4. Discussion
5. Conclusions
Author Contributions
Funding
Conflicts of Interest
References
- Recaño, J. La sostenibilidad demográfica de la España vacía. Perspect. Demogràfiques 2017, 7, 1–4. [Google Scholar]
- Rees, P.; van der Gaag, N.; de Beer, J.; Heins, F. European Regional Populations: Current Trends, Future Pathways, and Policy Options. Eur. J. Popul. 2012, 28, 385–416. [Google Scholar] [CrossRef] [PubMed]
- Raugze, I.; Daly, G.; van Herwijnen, M. Shrinking Rural Regions in Europe. 2017. Available online: https://www.espon.eu/sites/default/files/attachments/ESPON%20Policy%20Brief%20on%20Shrinking%20Rural%20Regions.pdf (accessed on 4 February 2020).
- Eurostat. Europe 2020 Indicators-Poverty and Social Exclusion. 2016. Available online: https://ec.europa.eu/eurostat/statistics-explained/index.php/Europe_2020_indicators_-_poverty_and_social_exclusion (accessed on 4 February 2020).
- van Herwijnen, M.; Daly, G.; Iotzov, V. Fighting Rural Depopulation in Southern Europe. 2018. Available online: https://www.espon.eu/sites/default/files/attachments/af-espon_spain_02052018-en.pdf (accessed on 4 February 2020).
- Syssner, J. Policy Implications of Rural Depopulation. In Pathways to Demographic; Springer: Berlin/Heidelberg, Germany, 2020; pp. 37–52. [Google Scholar]
- Johnson, K.M.; Lichter, D.T. Rural Depopulation: Growth and Decline Processes over the Past Century. Rural Sociol. 2019, 84, 3–27. [Google Scholar] [CrossRef]
- Ballas, D.; Kalogeresis, T.; Labrianidis, L. A comparative study of typologies for rural areas in Europa. In Proceedings of the 43rd European Congress of the Regional Science Associatio, Jyväskylä, Finland, 27–30 August 2003. [Google Scholar]
- Cloke, P. Conceptualizing Rurality. In The Handbook of Rural Studies; Cloke, P.M., Mooney, P.T., Eds.; Sage: London, UK, 2006. [Google Scholar]
- Gáková, Z.; Dijkstra, L. Does Population Decline Lead to Economic Decline in EU Rural Regions? Available online: https://ec.europa.eu/regional_policy/en/information/publications/regional-focus/2010/does-population-decline-lead-to-economic-decline-in-eu-rural-regions (accessed on 4 February 2020).
- Delgado Viñas, C. Depopulation Processes in European Rural Areas: A Case Study of Cantabria (Spain). Eur. Countrys. 2019, 11, 341–369. [Google Scholar] [CrossRef]
- del Romero, L.; Escribano, J. Diagnóstico y propuestas para la revitalización de las Sierras de Teruel (Gúdar-Javalambre y Maestrazgo). AGER Revista de Estudios sobre Despoblación y Desarrollo Rural 2013, 15, 115–152. [Google Scholar]
- MacDonald, D.; Crabtree, J.R.; Wiesinger, G.; Dax, T.; Stamou, N.; Fleury, P.; Gutierrez Lazpita, J.; Gibon, A. Agricultural abandonment in mountain areas of Europe: Environmental consequences and policy response. J. Environ. Manag. 2000, 59, 47–69. [Google Scholar] [CrossRef]
- Ministerio de Fomento. Atlas Estadístico de las Áreas Urbanas en España; Ministerio de Fomento: Madrid, Spain, 2009. [Google Scholar]
- Molinero, F. Las intensas transformaciones del mundo rural castellano-leonés: La marcha hacia el cuarto paradigma de desarrollo rural. In Población y Poblamiento en Castilla y León; Delgado, J.U., Ed.; Consejo Económico y Social de Castilla y León: Valladolid, Spain, 2012; pp. 557–636. Available online: http://www.cescyl.es/es/publicaciones/informes-iniciativa-propia/informe-iniciativa-propia-poblacion-poblamiento-castilla-le.ficheros/1889-IIP1-2012DT.pdf (accessed on 4 February 2020).
- Wiest, K. Women and Migration in Rural Europe: Labour Markets, Representations and Policies; Palgrave Macmillan: Basingstoke, UK, 2016. [Google Scholar]
- Zhelezov, G. Sustainable Development in Mountain Regions: Southeastern Europe; Springer Science & Business Medi: Berlin/Heidelberg, Germany, 2011. [Google Scholar]
- Hart, K.; Allen, B.; Lindner, M.; Keenleyside, C.; Burgess, P.; Eggers, J.; Buckwell, A. Land as an Environmental Resource. 2013. Available online: https://ieep.eu/uploads/articles/attachments/356527cc-fad2-4d6d-b437-41e0d1b4e4dc/LER_-_Final_Report_-_April_2013.pdf?v=63664509811 (accessed on 4 February 2020).
- Basile, G.; Cavallo, A. Rural Identity, Authenticity, and Sustainability in Italian Inner Areas. Sustainability 2020, 12, 1272. [Google Scholar] [CrossRef]
- Hoggart, K.; Paniagua, A. The restructuring of rural Spain? J. Rural Stud. 2001, 17, 63–80. [Google Scholar] [CrossRef]
- Santos, R.; Castanho, R.A.; Lousada, S. Return Migration and Tourism Sustainability in Portugal: Extracting Opportunities for Sustainable Common Planning in Southern Europe. Sustainability 2019, 11, 6468. [Google Scholar] [CrossRef]
- Camarero, L.A. Del éxodo rural y del éxodo urbano. In Ocaso y Renacimiento de los Asentamientos Rurales en España, Madrid; Ministerio de Agricultura, Pesca y Alimentación: Madrid, Spain, 1993. [Google Scholar]
- Collantes, F.; Pinilla, V.; Sáez, L.A.; Silvestre, J. Reducing depopulation in rural Spain: The impact of immigration. Popul. Space Place 2014, 20, 606–621. [Google Scholar] [CrossRef]
- Cabré Pla, A.M.; de Cos Guerra, O. Los cambios en los patrones territoriales de la población española (1900-2001). Papeles de Economía Española 2005, 104, 167–193. [Google Scholar]
- Del Molino, S. La España Vacía; Turner: Nashville, TN, USA, 2016. [Google Scholar]
- Gozálvez Pérez, V.; Valero Escandell, J.R. Poverty and Social Exclusion in Spain: Regions and Risk Groups; 2009. Available online: https://www.sciencedirect.com/science/article/pii/S0213911119302626 (accessed on 4 February 2020).
- Roquer, S.; Blay, J. Del éxodo rural a la inmigración extranjera: El papel de la población extranjera en la recuperación demográfica de las zonas rurales españolas (1996–2006). Scripta Nova 2008, XII. Available online: http://www.ub.edu/geocrit/sn/sn-270/sn-270-129.htm (accessed on 4 February 2020).
- Nieto Masot, A.; Gurría Gascón, J.L. El modelo rural y el impacto de los programas LEADER y PRODER en Extremadura. (Propuesta metodológica). Scripta Nova 2010, XIV. Available online: http://www.ub.edu/geocrit/sn/sn-340.htm (accessed on 4 February 2020).
- Ministerio de Agricultura Pesca y Alimentación. Programa de Desarrollo Rural Sostenible (2010–2014); Ministerio de Agricultura, Pesca y Alimentación: Madrid, Spain, 2009. [Google Scholar]
- Alsina-Oliva, R. Estrategia de desarrollo en España 1964–1975: Planes y realidad. Cuadernos de Economía 1987, 15, 337–370. [Google Scholar]
- de la Torre Campos, J.; García-Zúñiga, M. Entre el Mercado y el Estado. Los Planes de Desarrollo Durante el Franquismo. Las Calves del Desarrollo Económico y Social; Universidad Pública de Navarra: Pamplona, Spain, 2009. [Google Scholar]
- Naredo, J.M. La Evolución de la Agricultura en España (1940–1990); Universidad de Granada: Granada, Spain, 1996. [Google Scholar]
- Collante, F. The decline of agrarian societies in the European countryside: A case study of Spain in the twentieth century. Agric. Hist. 2007, 81, 76–97. [Google Scholar] [CrossRef]
- García Marín, R.; Espejo Marín, C. El círculo vicioso de la despoblación en el medio rural español: Teruel como caso de estudio. Estudios Geográficos 2019, 80. Available online: http://estudiosgeograficos.revistas.csic.es/index.php/estudiosgeograficos/article/view/747 (accessed on 4 February 2020).
- Alario Trigueros, M.; Molinero Hernando, F.; Morales Prieto, E. La persistencia de la dualidad rural y el valor de la nueva ruralidad en Castilla y León (España). Investigaciones Geográficas 2018, 70, 9–30. [Google Scholar] [CrossRef]
- Nieto Masot, A.; Gurría Gascón, J.L. Análisis de la población de los programas de desarrollo rural en Extremadura mediante Sistemas de Información Geográfica. Cuadernos Geográficos 2005, 36, 479–495. [Google Scholar]
- Segrelles Serrano, J.A. Las ayudas agrarias y sus repercusiones sobre la agricultura familiar en la última reforma de la Política Agraria Común (2014–2020) de la Unión Europea: ¿Cambiar para que todo siga igual? Boletín de la Asociación de Geógrafos Españoles 2017, 74, 161–183. [Google Scholar] [CrossRef]
- Cárdenas Alonso, G.; Nieto Masot, A. Towards Rural Sustainable Development? Contributions of the EAFRD 2007–2013 in Low Demographic Density Territories: The Case of Extremadura (SW Spain). Sustainability 2017, 9, 1173. [Google Scholar] [CrossRef]
- Esparcia, J. Evolución reciente, situación actual y perspectivas futuras en el desarrollo rural en España y en la UE. Revue Marocaine d’Administration Locale et de Développement (REMALD) 2012, 79, 53–84. [Google Scholar]
- Nieto Masot, A.; Cárdenas Alonso, G. The Rural Development Policy in Extremadura (SW Spain): Spatial Location Analysis of Leader Projects. ISPRS Int. J. Geo-Inf. 2018, 7, 76. [Google Scholar] [CrossRef]
- Moyano Estrada, E. La reforma de las políticas europeas de cohesión y desarrollo rural. In El Desarrollo Territorial Valenciano. Reflexiones en Torno a Sus Claves; Universidad de València: Valencia, Spain, 2014. [Google Scholar]
- Escribano Pizarro, J. Servicios educativos y sanitarios elementales en el medio rural: Percepción social e influencia sobre la calidad de vida. Estudios Geográficos 2012, 73, 35–61. [Google Scholar] [CrossRef]
- Comisión Europea. Estrategia Territorial Europea: Hacia un desarrollo equilibrado y sostenible del territorio de la Unión Europea; Oficina de Publicaciones Oficiales de las Comunidades Europeas: Luxembourg, 2009. [Google Scholar]
- Bielza de Ory, V. Experiencias y replanteamiento de la ordenación del territorio en Europa: Retos en relación con la ciudad. Geographicalia 2002, 41, 37–57. [Google Scholar] [CrossRef][Green Version]
- Molho, I. Spatial autocorrelation in british unemployment. J. Reg. Sci. 1995, 35, 641–658. [Google Scholar] [CrossRef]
- Cima, E.G.; Uribe-Opazo, M.A.; Johann, J.A.; da Rocha, W.F., Jr.; Dalposso, G.H. Analysis of Spatial Autocorrelation of Grain Production and Agricultural Storage in ParanÁ. Engenharia Agrícola 2018, 38, 395–402. [Google Scholar] [CrossRef]
- Darand, M.; Dostkamyan, M.; Rehmani, M.I.A. Spatial autocorrelation analysis of extreme precipitation in Iran. Russ. Meteorol. Hydrol. 2017, 42, 415–424. [Google Scholar] [CrossRef]
- Islam, A.R.M.T.; Ahmed, N.; Bodrud-Doza, M.; Chu, R. Characterizing groundwater quality ranks for drinking purposes in Sylhet district, Bangladesh, using entropy method, spatial autocorrelation index, and geostatistics. Environ. Sci. Pollut. Res. 2017, 24, 26350–26374. [Google Scholar] [CrossRef]
- Paliaga, G.; Donadio, C.; Bernardi, M.; Faccini, F. High-Resolution Lightning Detection and Possible Relationship with Rainfall Events over the Central Mediterranean Area. Remote Sens. 2019, 11, 1601. [Google Scholar] [CrossRef]
- Wang, D.; Zhou, Q.-B.; Yang, P.; Chen, Z.-X. Design of a spatial sampling scheme considering the spatial autocorrelation of crop acreage included in the sampling units. J. Integr. Agric. 2018, 17, 2096–2106. [Google Scholar] [CrossRef]
- Nieto Masot, A.; Engelmo-Moriche, Á.; Cárdenas-Alonso, G. La distribución territorial de recursos sanitarios y socio-sanitarios públicos para población mayor en Extremadura. Revista de Estudios Andaluces 2019, 37, 141–160. [Google Scholar] [CrossRef]
- Pavón, E.L.S.; Tabales, A.F. El litoral turístico español en la encrucijada: Entre la renovación y el continuismo. Cuadernos de Turísmo 2010, 25, 185–206. [Google Scholar]
- da Orueta, E.B.; Puebla, J.A. Infraestructuras y medios de transporte. In Geografía de España; Olcina, A.G., Mendoza, J.G., Eds.; Arial Geografía: Barcelona, Spain, 2001; pp. 501–520. [Google Scholar]
- García, G.C. Un análisis de la geografía regional. Estudios Geográficos 1990, 51, 339. [Google Scholar]
- Richart, P.M.G. El Plan Nacional de Estabilización Económica y el Modelo de Desarrollo Español. 2017. Available online: https://www.tesisenred.net/bitstream/handle/10803/403408/Tesis%20Pedro%20Miguel%20Galiana%20Richart.pdf?sequence=1&isAllowed=y (accessed on 4 February 2020).
- Rodríguez, A.S. El modelo territorial europeo: Tendencias para el siglo xxi y sus implicaciones para el modelo territorial español. Urban 2003, 8, 35–54. [Google Scholar]
- Delgado Viñas, C. Capítulo 22. Las actividades comerciales y de servicios. In Geografía de España; Ariel: Barcelona, Spain, 2001; pp. 521–544. [Google Scholar]
- Pinilla, V.; Sáez, L.A. La Despoblación Rural en España: Génesis de un Problema y Políticas Innovadoras; SSPA CEDDAR: Zaragoza, Spain, 2017. [Google Scholar]
- Gabbrielli, E.; Riccioli, F.; Casini, L. The impact of agro-environmental policies in Tuscany. Scienze Regionali 2017, 16, 433–462. [Google Scholar]
- Hernández, R.; Fernández, C.; Baptista, P. Metodología de la Investigación; TheMcGraw-Hill Companies: New York, NY, USA, 2006; Volume 4. [Google Scholar]
- Riccioli, F.; Franiti, R.; Boncinelli, F.; Asmar, T.E.; Asmar, J.P.E.; Casini, L. Spatial analysis of selected biodiversity features in protected areas: A case study in tuscany region. Land Use Policy 2016, 57, 540–554. [Google Scholar] [CrossRef]
- Buzai, G.D. Geografía y sistemas de información geográfica. Evolución teórico-metodológica hacia campos emergentes. Revista Geográfica de América Central 2012, 48, 15–67. [Google Scholar]
- Buzai, G.D.; Baxendale, C.A. Análisis socioespacial con sistemas de información geográfica marco conceptual basado en la teoría de la geografía. Ciencias Espaciales 2015, 8, 391–408. [Google Scholar] [CrossRef]
- Nieto Masot, A.; Cárdenas Alonso, G. 25 Years of the Leader Initiative as European Rural Development Policy: The Case of Extremadura (SW Spain). Eur. Countrys. 2017, 9, 302–316. [Google Scholar] [CrossRef]
- Cardozo, O.D.; Gómez, E.L.; Parras, M.A. Teoría de grafos y sistemas de información geográfica aplicados al transporte público de pasajeros en resistencia (argentina). Revista Transporte y Territorio 2009, 1, 89–111. [Google Scholar]
- Menédez, A. Una breve introducción a la teoría de grafos. SUMA 1998, 28, 11–26. [Google Scholar]
- Gómez Delgado, M.; Bosque Sendra, J.B. Cálculo de rutas óptimas para el transporte de residuos tóxicos y peligrosos. GeoFocus. Revista Internacional de Ciencia y Tecnología de la Información Geográfica 2001, 1, 49–75. [Google Scholar]
- Nieto Masot, A.; Cárdenas Alonso, G. Research on the accessibility to health and educational services in the rural areas in Extremadura. Eur. Countrys. 2015, 7, 57–67. [Google Scholar] [CrossRef][Green Version]
- Nieto Masot, A.; Engelmo Moriche, A.; Cárdenas Alonso, G. Análisis espacial de la ordenación territorial en áreas rurales de baja densidad demográfica: El caso de Extremadura. Papeles de Geografía 2017, 63, 113–132. [Google Scholar] [CrossRef]
- Anselin, L. Local indicators of spatial association—LISA. Geogr. Anal. 1995, 27, 93–115. [Google Scholar] [CrossRef]
- Anselin, L. Interactive techniques and exploratory spatial data analysis. In Geographical Information Systems. Principles and Technical Issues; Longley, P., Goodchild, M., Maguire, D.J., Rhind, D.W., Eds.; John and Wiley Sons: Hoboken, NJ, USA, 1999; pp. 253–266. [Google Scholar]
- Celemín, J.P. Autocorrelación espacial e indicadores locales de asociación espacial: Importancia, estructura y aplicación. Revista Universitaria de Geografía 2009, 18, 11–31. [Google Scholar]
- Iris, P. Los métodos de autocorrelación espacial para la regionalización intraurbana. In Teoría y Métodos de la Geografía Cuantitativa; MCA Libros: Buenos Aires, Argentina, 2015; pp. 139–154. [Google Scholar]
- Pearson, R.G.; Raxworthy, C.J.; Nakamura, M.; Peterson, A.T. Predicting Species Distributions from Small Numbers of Occurrence Records: A Test Case Using Cryptic Geckos in Madagascar. J. Biogeogr. 2006, 34, 102–117. [Google Scholar] [CrossRef]
- Han, H.; Nguyen, T.V.T.; Sahito, N. Role of Urban Public Space and the Surrounding Environment in Promoting Sustainable Development from the Lens of Social Media. Sustainability 2019, 11, 5967. [Google Scholar] [CrossRef]
- Standar, K. The Role of Local Finance in Overcoming Socioeconomic Inequalities in Polish Rural Areas. Sustainability 2019, 11, 5848. [Google Scholar] [CrossRef]
- Collantes, F.; Pinilla, V. Extreme Depopulation in the Spanish Rural Mountain Areas: A Case Study of Aragon in the Nineteenth and Twentieth Centuries. Rural Hist. 2004, 15, 149–166. [Google Scholar] [CrossRef]
- De Cos Guerra, O.; Reques Velasco, P. Vulnerabilidad territorial y demográfica en España. Posibilidades del análisis multicriterio y la lógica difusa para la definición de patrones espaciale. J. Reg. Res. 2019, 45, 201–255. [Google Scholar]
- Cejudo, E.; Navarro, F. La despoblación rural como reto social. Algunos apuntes. In Despoblación y Transformaciones Sociodemográficas de Los Territorios Rurales: Los Casos de España, Italia y Francia; Eugenio, C., Francisco, N., Eds.; Università del Salento: Lecce, Italy, 2019. [Google Scholar]
- Molinero Hernando, F. El espacio rural de España: Evolución, delimitación y clasificación. Cuadernos Geográficos 2019, 58, 19–56. [Google Scholar] [CrossRef]
- Rizzo, A. Declining, transition and slow rural territories in southern Italy Characterizing the intra-rural divides. Eur. Plan. Stud. 2016, 24, 231–253. [Google Scholar] [CrossRef]
- Prezioso, M. Aree interne e loro potenzialità nel panorama italiano e europeo. Introduzione al tema. GEOTEMA L’Umbria tra Marginalità e Centralità 2017, 3, 68–75. [Google Scholar]
- Reynaud, C.; Miccoli, S. Depopulation and the Aging Population: The Relationship in Italian Municipalities. Sustainability 2018, 10, 1004. [Google Scholar] [CrossRef]
- Fonseca, M.L. New waves of immigration to small towns and rural areas in Portugal. Popul. Space Place 2008, 14, 525–535. [Google Scholar] [CrossRef]
- Poeta Fernandes, G. Rural depopulation, social resilience and context costs in the border municipalities of central Portugal. Dichotomies of social reorganization vs absence of public policies. Economía Agraria y Recursos Naturales - Agric. Resour. Econ. 2019, 19, 121–149. [Google Scholar] [CrossRef]
- Courcelle, T.; Fijalkow, Y.; Taulelle, F. Services Publics et Territoires: Adaptation, Innovations et Réactions; Presses Universitaires de Rennes: Rennes, France, 2017. [Google Scholar]
- Yves, J.; Périgord, M. Géographie Rurale—La Ruralité en France; Colin Armand: Paris, France, 2009. [Google Scholar]
- Bouron, J.-B.; Georges, P.-M. Les Territoires Ruraux en France: Une géographie des Ruralités Contemporaines; Ellipses Marketing: Paris, France, 2015. [Google Scholar]
- European Union. Demographic Trends in EU Regions; European Parlament: Brussels, Belgium, 2019. [Google Scholar]
- Seys, F.-O. Les nouvelles régions françaises dans le contexte de l’Union européenne: Définition et analyse cartographique et statistique. Pôle Sud 2017, 46, 97–113. [Google Scholar] [CrossRef]


| 2001 | 2011 | 2001–2011 | 2018 | 2011–2018 | ||||
|---|---|---|---|---|---|---|---|---|
| No. Municip. | Population | No. Municip. | Population | Pop. Growth | No. Municip. | Population | Pop. Growth | |
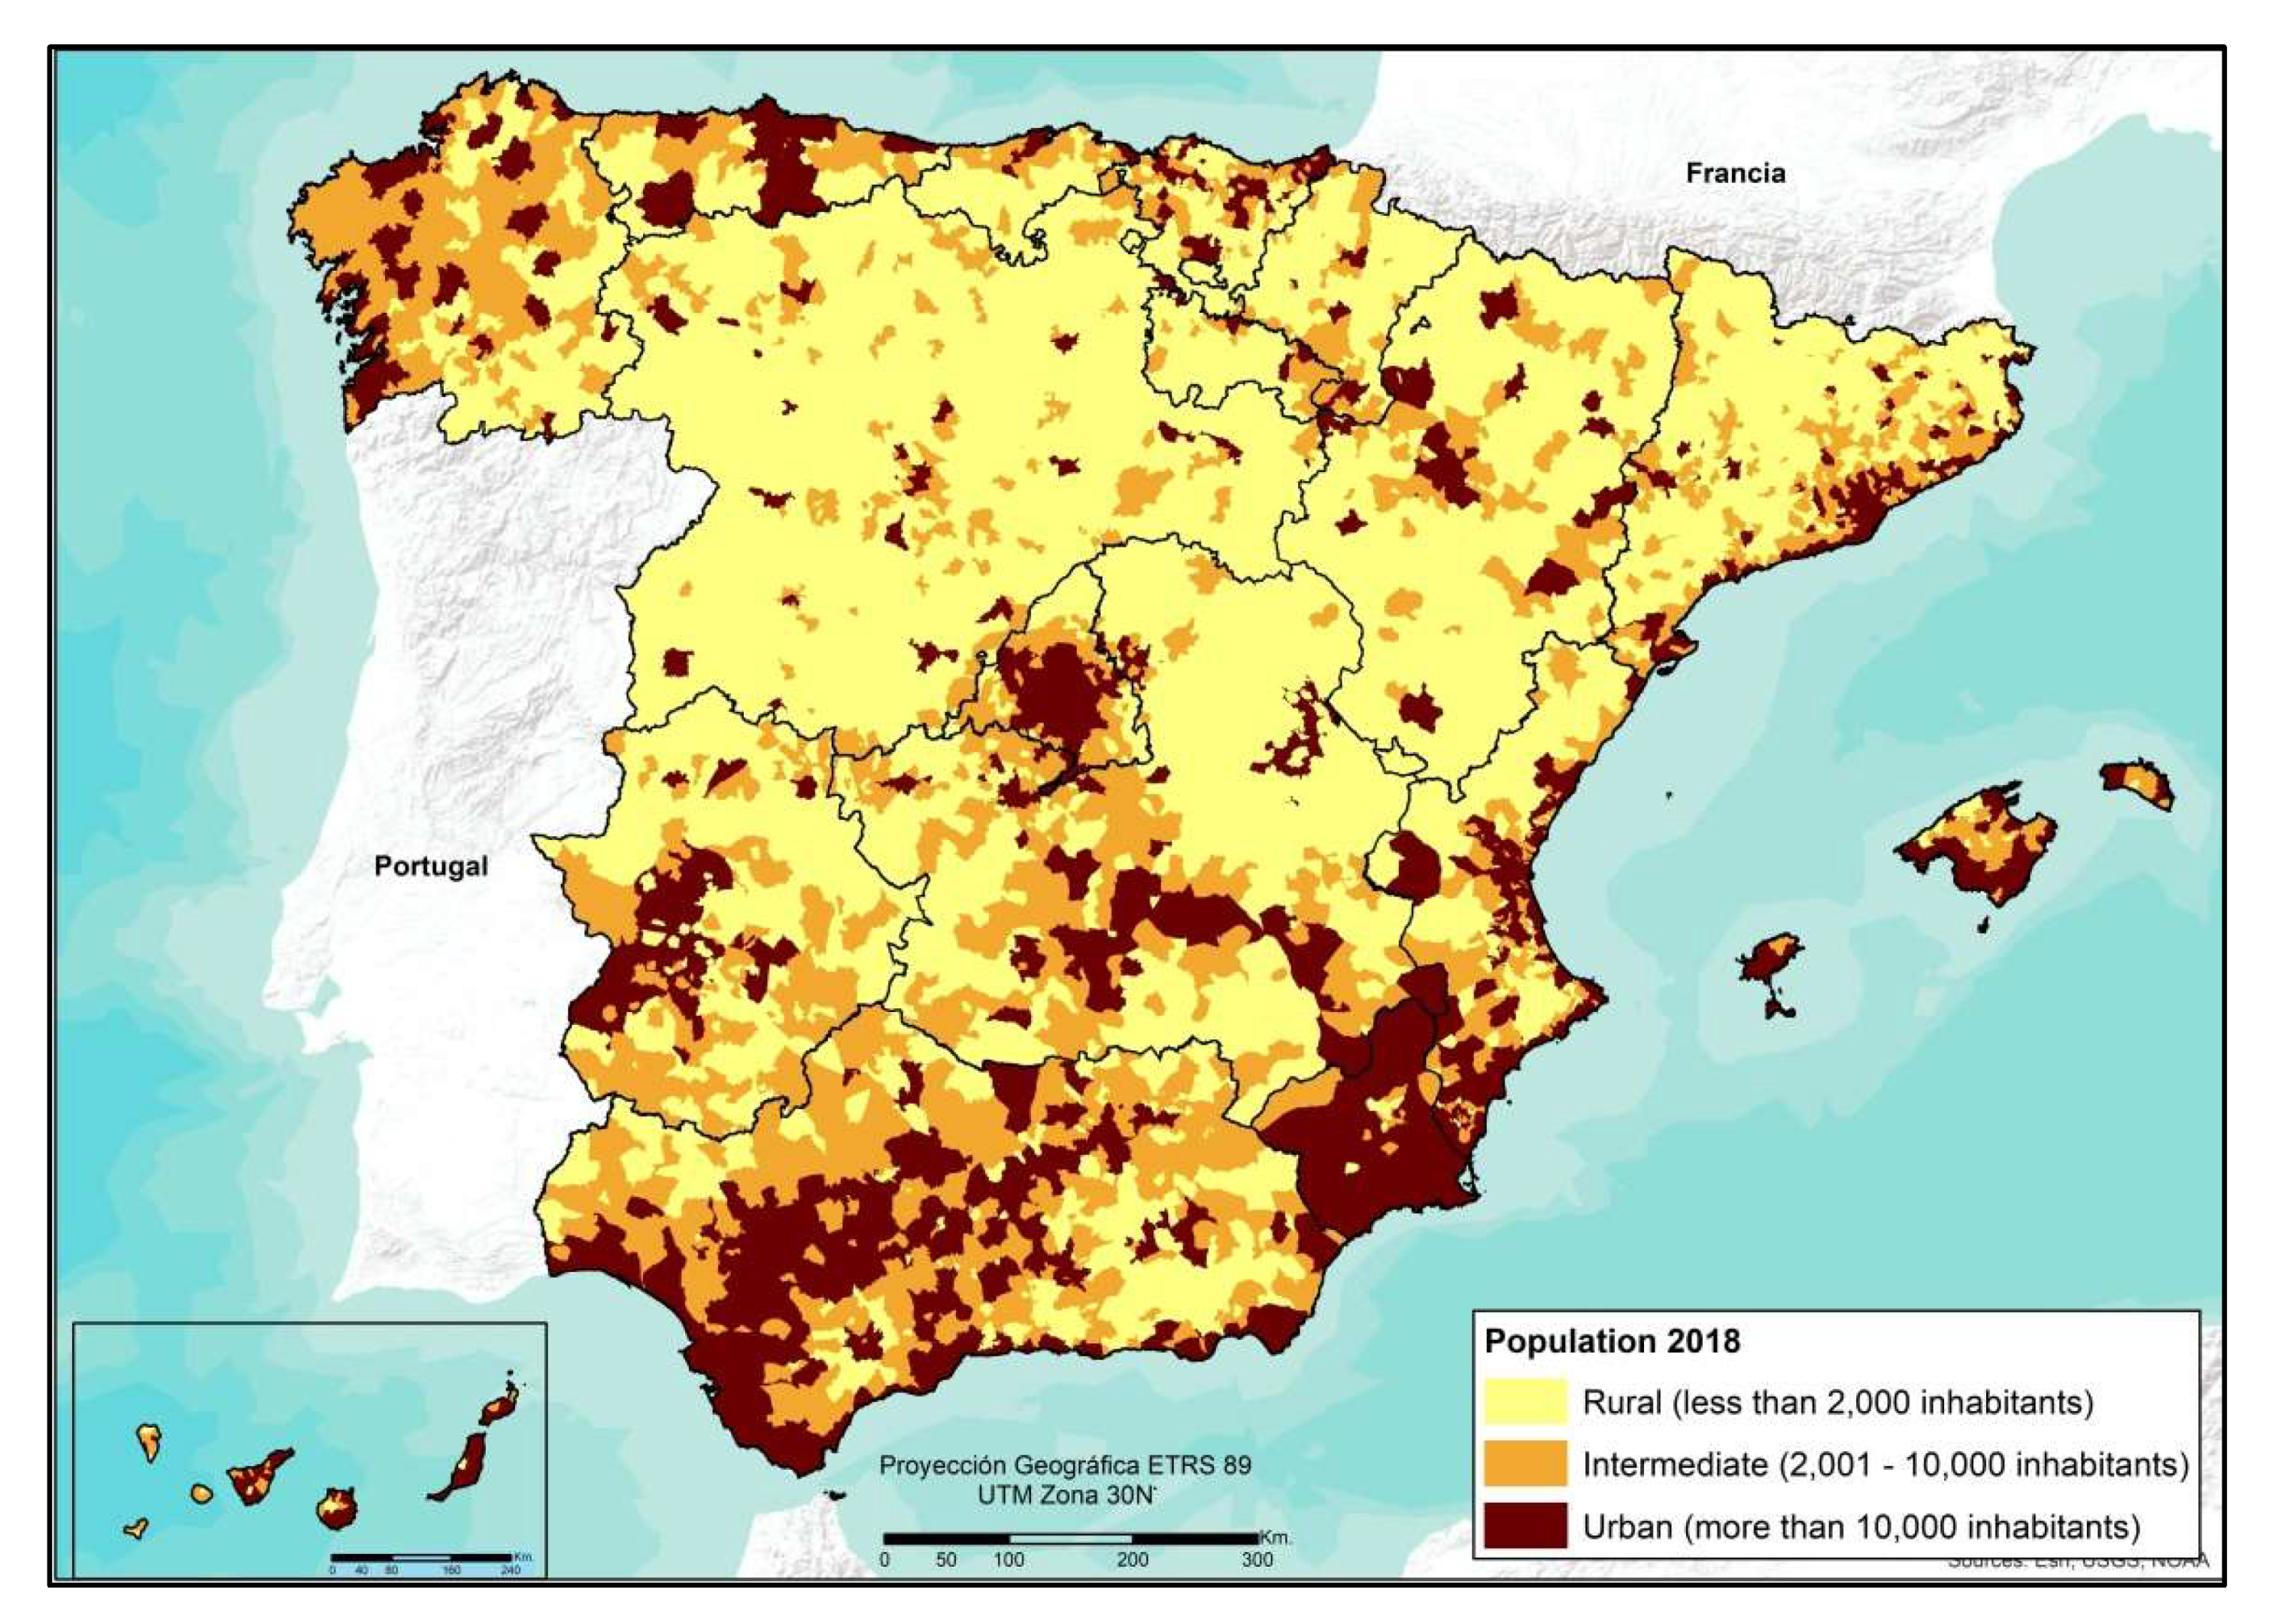
| Less than 2000 inhab | 5967 | 3,024,544 | 5803 | 2,821,848 | −6.42 | 5872 | 2,705,641 | −15.52 |
| 2000–10,000 inhab | 1507 | 6,628,884 | 1562 | 7,069,039 | 13.57 | 1496 | 6,809,958 | −2.90 |
| More than 10,000 inhab | 651 | 31,452,397 | 759 | 37,287,423 | 17.45 | 756 | 37,207,381 | 0.14 |
| Total | 8125 | 41,105,825 | 8124 | 47,178,310 | 14.77 | 8124 | 46,722,980 | −0.97 |
| Variables | Moran’s I | Pattern | z-Score | p-Value |
|---|---|---|---|---|
| Population 2018 | 0.012954 | Cluster | 23.22844 | 0 |
| Population growth (2001–2018) | 0.255490 | Cluster | 366.374147 | 0 |
| Old age Index 2018 | 0.272485 | Cluster | 394.780788 | 0 |
| Population density 2018 | 0.126928 | Cluster | 184.949813 | 0 |
| Unemployment rate 2018 | 0.284055 | Cluster | 411.563633 | 0 |
| Unemployment rate in agricultural sector 2018 | 0.064781 | Cluster | 94.064191 | 0 |
| Average income per capita 2016 | 0.215884 | Cluster | 313.008059 | 0 |
| Highway accessibility | 0.202948 | Cluster | 294.334040 | 0 |
| Accessibility to national roads | 0.031405 | Cluster | 45.756990 | 0 |
| Correlations | Population 2018 | Population Growth (2001–2018) | Per Capita Income 2016 | Population Density 2018 | Old Age Index 2018 | Agricultural Unemployment Rate | Unemployment Rate 2018 | Access Times to Urban Centers |
|---|---|---|---|---|---|---|---|---|
| Population 2018 | 1 | 0.083 ** | 0.073 ** | 0.316 ** | −0.104 ** | 0.051 ** | −0.037 ** | −0.133 ** |
| Population Growth (2001–2018) | 0.083 ** | 1 | 0.405 ** | 0.153 ** | −0.751 ** | 0.068 ** | −0.058 ** | −0.509 ** |
| Per Capita income 2016 | 0.073 ** | 0.405 ** | 1 | 0.112 ** | −0.340 ** | 0.035 ** | −0.034 ** | −0.301 ** |
| Population density 2018 | 0.316 ** | 0.153 ** | 0.112 ** | 1 | −0.178 ** | 0.063 ** | −0.080 ** | −0.221 ** |
| Old Age Index 2018 | −0.104 ** | −0.751 ** | −0.340 ** | −0.178 ** | 1 | −0.104 ** | 0.013 | 0.515 ** |
| Agricultural Unemployment rate 2018 | −0.037 ** | −0.058 ** | −0.034 ** | −0.080 ** | 0.013 | 0.116 ** | 1 | 0.054 ** |
| Unemployment rate 2018 | 0.051 ** | 0.068 ** | 0.035 ** | 0.063 ** | −0.104 ** | 1 | 0.116 ** | −0.074 ** |
| Access times to urban centers | −0.133 ** | −0.509 ** | −0.301 ** | −0.221 ** | 0.515 ** | −0.074 ** | 0.054 ** | 1 |
© 2020 by the authors. Licensee MDPI, Basel, Switzerland. This article is an open access article distributed under the terms and conditions of the Creative Commons Attribution (CC BY) license (http://creativecommons.org/licenses/by/4.0/).
Share and Cite
Nieto Masot, A.; Cárdenas Alonso, G.; Engelmo Moriche, Á. Spatial Analysis of the Rural-Urban Structure of the Spanish Municipalities. ISPRS Int. J. Geo-Inf. 2020, 9, 213. https://doi.org/10.3390/ijgi9040213
Nieto Masot A, Cárdenas Alonso G, Engelmo Moriche Á. Spatial Analysis of the Rural-Urban Structure of the Spanish Municipalities. ISPRS International Journal of Geo-Information. 2020; 9(4):213. https://doi.org/10.3390/ijgi9040213
Chicago/Turabian StyleNieto Masot, Ana, Gema Cárdenas Alonso, and Ángela Engelmo Moriche. 2020. "Spatial Analysis of the Rural-Urban Structure of the Spanish Municipalities" ISPRS International Journal of Geo-Information 9, no. 4: 213. https://doi.org/10.3390/ijgi9040213
APA StyleNieto Masot, A., Cárdenas Alonso, G., & Engelmo Moriche, Á. (2020). Spatial Analysis of the Rural-Urban Structure of the Spanish Municipalities. ISPRS International Journal of Geo-Information, 9(4), 213. https://doi.org/10.3390/ijgi9040213