Article

A Survey on Big Data for Trajectory Analytics

by
Damião Ribeiro de Almeida
1,*,
Cláudio de Souza Baptista
1,
Fabio Gomes de Andrade
2 and
Amilcar Soares
3
1
Campina Grande, Department of Computer Science, Federal University of Campina Grande, Paraíba 58429-900, Brazil
2
Federal Institute of Paraíba, Cajazeiras, Paraíba 58900-000, Brazil
3
Institute for Big Data Analytics, Dalhousie University, Halifax, NS B3H 1W5, Canada
*
Author to whom correspondence should be addressed.
ISPRS Int. J. Geo-Inf. 2020, 9(2), 88; https://doi.org/10.3390/ijgi9020088
Submission received: 13 January 2020 / Revised: 25 January 2020 / Accepted: 27 January 2020 / Published: 1 February 2020

Abstract

:
Trajectory data allow the study of the behavior of moving objects, from humans to animals. Wireless communication, mobile devices, and technologies such as Global Positioning System (GPS) have contributed to the growth of the trajectory research field. With the considerable growth in the volume of trajectory data, storing such data into Spatial Database Management Systems (SDBMS) has become challenging. Hence, Spatial Big Data emerges as a data management technology for indexing, storing, and retrieving large volumes of spatio-temporal data. A Data Warehouse (DW) is one of the premier Big Data analysis and complex query processing infrastructures. Trajectory Data Warehouses (TDW) emerge as a DW dedicated to trajectory data analysis. A list and discussions on problems that use TDW and forward directions for the works in this field are the primary goals of this survey. This article collected state-of-the-art on Big Data trajectory analytics. Understanding how the research in trajectory data are being conducted, what main techniques have been used, and how they can be embedded in an Online Analytical Processing (OLAP) architecture can enhance the efficiency and development of decision-making systems that deal with trajectory data.

1. Introduction

The quick development of wireless communication and data acquisition technologies, combined with the evolution of technologies that enable storing and processing large data volumes, have contributed to the significant growth of applications that deal with trajectory data. Trajectory data record the object’s location in space at a certain instant of time. According to Zheng, there are four categories of trajectory data: mobility of people, mobility of transportation vehicles, mobility of animals, and mobility of natural phenomena [1].
The objects described by trajectories are usually called moving objects since their spatial location varies through time and often these changes are continuous in time. However, to be stored in a database system, they are represented as discrete locations [2].
In general, existing research works represent trajectories as a sequence of geographical points ordered concerning time [3]. Trajectory data can be stored in both spatial or non-spatial database systems. The advantage of managing trajectory data in a spatial database (e.g., Oracle Spatial and PostgreSQL + Postgis) is the integrity created between spatial and alphanumeric components. Moreover, Spatial DataBase Management Systems (SDBMS) have a set of data types and functions that aid in the storage and indexing of geographic objects, so that querying these data is faster than in a dual architecture using a non-spatial database system [4]. Other Database Management Systems (DBMS) go further and also have structures and data types that manipulate temporal data. This is the case of the SECONDO [5], and PostgreSQL temporal extension (https://wiki.postgresql.org/wiki/Temporal_Extensions), which handles trajectory data through spatio-temporal data types.
In some applications, the volume of trajectory data is so large that off-the-shelf spatial or non-spatial DBMS storage does not cope with such demands. Applications that manage huge volumes of trajectory data need to deal with important issues such as size increasing, variety, and refresh rate of datasets. Beyond all information produced by industry scientific, research and governments, the rapid increase of trajectory data became a topic of interest in Big Data [6].
Jin et al. introduce Big Data as a comprehensive term for any data collection so large and complex that it is difficult to process it using traditional data processing applications [6]. Besides the large data volume, Big Data can be characterized by high speed (velocity), high variety, low veracity, and high value [7]. These Big Data features are known as 5V. Generally, traditional DBMSs deal with structured data, and Big Data technologies deal with structured, unstructured, and semi-structured data, e.g., email, news, bank transactions, audiovisual streaming (sound, image, and video), among others. Although raw trajectories may be represented as structured data, semantic trajectories require more complex data structures. Therefore, a new generation of database technologies is required to address new challenges.
Trajectory analysis has been raised as an essential branch of this topic, as the volume of trajectory data is continuously increasing due to the great availability of mobile devices and applications using GPS. Dealing with large-scale spatial data is a research topic called Spatial Big Data [8] in which the issues related to Big Data applications are handled to enable the development of geographical information systems. Since the volume of trajectory data is usually very large, it is necessary to deploy an infrastructure that can analyze these massive data properly, solving complex queries, extracting relevant insights, and supporting the decision-making process. Commonly, this problem is solved using a Data Warehouse, which is an infrastructure that summarizes the data available in the operational level of the DBMS to generate analysis and reports that aid the decision support process making in organizations. Data Warehouses built for handling trajectory data are called Trajectory Data Warehouses. The transformation process from the operational data level to the Data Warehouse is called ETL (Extraction, Transformation, and Loading). OLAP tools and servers allow constructing a multi-dimensional cube from the DW information to assist the data analysis in a DW [9].
In recent years, some surveys have been developed to discuss the use of trajectory data. These surveys focus on different aspects of trajectory data. For example, the survey of Parent et al. [10] presents an analysis of mobility data management, listing and discussing the main techniques for building, enriching, mining, and extracting knowledge from trajectory data. Kong et al.’s survey [11] presents trajectory applications and data from travel behavior, travel patterns, trajectory data service description in terms of transport management, and other aspects. On the other hand, Bian et al.’s survey [12] presents a set of trajectory clustering techniques, classifying them into three categories: unsupervised, supervised, and semi-supervised. Feng and Zhu’s survey [13] presents some trajectory mining applications, such as pathfinding, location prediction, mobile object behavior analysis, and so on. To the best of our knowledge, only one survey [14] was found that summarizes the research focused on the traditional architecture of OLAP systems applied to trajectory analytics, but it still does not comment on various aspects related to TDW types, semantic trajectories, and Big Data.
Furthermore, other contributions offered by this trajectory data research are to clarify how trajectory data research is being conducted, what the main techniques used are, and how they can be embedded in an OLAP architecture. This study can also help in the improvement of efficiency and development of decision-making involving trajectories, such as urban planning systems, traffic control, vessel monitoring, movement prediction, monitoring, and studying the movement of some species of animals.
The rest of this survey is organized as follows. Section 2 describes basic trajectory concepts. Section 3 focuses on the integrating trajectory data process. Section 4 discusses the trajectory data warehouse design. Section 5 addresses how data analysis operations are performed. Section 6 highlights open issues on trajectory analytics. Finally, Section 7 concludes the survey.

2. Basic Concepts

A trajectory can be described as a sequence of positions ordered temporally. According to Bogorny et al. [3], a trajectory T can be formally defined as T = < p 1 , p 2 , p 3 , , p n >, where each position p i represents a point of T. Moreover, each p i can be defined as a triple p=< x i , y i , t i >, where:
  • x i and y i represent the geographical coordinates;
  • t i represents the instant of time of the object location; and
  • t 1 < t 2 < t 3 t n .
The basic trajectory data, composed only of spatio-temporal information of a moving object, are known as raw trajectories [10,15,16]. Sometimes, this definition is extended, and each position p also contains an identifier. In these cases, each point is defined as a quadruple < i d , x i , y i , t i >. This extended definition is useful to implement applications that need to monitor multiple mobile objects since the i d attribute enables applications to identify each one of these objects uniquely.
Generally, in trajectory data, the unit to be processed is the episode (also known as segment or sub-trajectories) rather than the entire movement itself. The criteria used to divide the trajectory into episodes are time interval, spatial shape, or semantic meanings [1]. For example, in a study about the trajectory of animals, a segment can correspond to a daily path; for the company’s employees, the segment can be the working hours, from 8:00 am to 6:00 pm. The segment can be the stop period or the movement of a person in an area of the city, categorized according to the regional activity, such as residence, tourism, commercial, recreation, or means of transport [13,17]. The segmentation process may be associated with interpolation-based strategies [18], or only on the homogeneity in the trajectory data, as of GRASP-UTS [19] and GRASP-SemTS [20].
Definition 1.
Formally, the episode is represented by the quadruple (traj_id, ep_id, type, subseq: LISTOF position < p i , , p j >), where:
1.
traj_id is the trajectory identifier;
2.
ep_id is the episode identifier;
3.
type is the episode type, that is, the criterion of the segmentation process (e.g., means of transport type, activity type, stopped, moving);
4.
subseq is a maximal subsequence of spatio-temporal points < p i , , p j > from the raw trajectory that satisfies the episode criterion type (e.g., means of transport) and 1 ≤ i ≤ j ≤ n, where n is the number of trajectory points.
Trajectory data can be gathered from different sources [11]:
  • In an explicit way, that is, using sensors such as GPS that transmit the geographic coordinates with almost standardized temporal and spatial distance rate to the receiver;
  • Implicitly, when the trajectory is inferred through information obtained from devices that do not guarantee the temporal and spatial standardization, i.e., the time granularity is relatively large and the distribution of recorded time points is relatively random [11], as of vigilance camera sensors, magnetic cards, RFID (Radio-frequency identification), and GSM (Global System for Mobile Communications). Another way to get trajectory data implicitly is through VGI (Volunteered Geographic Information) [21,22], which comprises geographic information provided by citizens using geosocial media tools.
Raw trajectories only contain spatio-temporal positions and sometimes are insufficient to construct meaningful trajectory applications [23]. After several years of research in trajectory data, it was verified that contextual information was precious for several applications. Although knowing the location of an object at a given moment is a piece of relevant information, many applications needed to go further. For example, in some cases, it is essential to know what is the moving object and its aim.

2.1. Semantic Trajectory

Some applications are more interested in the behavioral aspect than in merely positional data, for example, interpreting users’ trajectories within a city considering previous knowledge regarding the city. A system that deals with trajectory data can be enriched with semantic data enabling the analysis not only of the trajectory itself but also aspects that go beyond location, such as points of interest, moving object’s goal, and transport type. For example, many applications [24,25], instead of analyzing the GPS raw data, prefer to evaluate the trajectory as a sequence of semantic annotations, such as: (home, -9:00 h, -) → (road, 9–10 h, bus) → (office, 10–17 h, working) → (road, 17–15:30 h, subway) → (supermarket, 17:30–18h, mall) → (road, 18–18:20 h, walking) → (at home, 18:20-, -). In this example, each triple represents the location, time interval, and semantic annotation that describes the activity type or mode of transport on that path [26].
Spaccapietra introduced the idea of identifying semantics in trajectory data in 2008 [27]. Since then, many authors have developed works that attempt to produce semantically enriched trajectories. Semantic enrichment can occur in the trajectory point, in the episode, or in the entire trajectory, and comprises joining the raw trajectory data and the context information to produce semantically enriched trajectories [10]. Spaccapietra and Parent [28] define semantic trajectory as a raw trajectory semantically enriched with annotations and/or one or more interpretations. Episodes can be grouped within the same interpretation, for example, episodes of activity, episodes of stop or movement, etc.
Definition 2.
Formally, the semantic trajectory is defined as a tuple [28]: (trajectoryID, objectID, trajectoryAnnotations, track: LISTOF position (ti, p, posAnnotations), interpretations: SETOF interpretation (interpretationID, semanticGaps: LISTOF gap ( t m , t n ), episodes: LISTOF episode)) where:
1.
trajectoryID is the identifier of the trajectory;
2.
objectID is the identifier of the mobile object;
3.
trajectoryAnnotations is the set of annotations associated with the trajectory as a whole, for example: duration, size, objective;
4.
track is the list of spatio-temporal positions of the moving object. The list is sorted temporarily;
5.
ti are, usually, instants of time. All ti are disjoint;
6.
p specifies a spatial element. Generally represented by a point (x, y) for 2D coordinates and (x, y, z) for 3D coordinates;
7.
posAnnotations is an annotations set associated with the p position;
8.
semanticGaps is the list of semantic gaps in the trajectory delimited by a period of time, t m and t n , where t m t n ;
9.
interpretations is the interpretations set referring to a set of episodes of the trajectory, e.g., activity episodes, stop/move episodes, etc.;
10.
interpretationID is the interpretation identifier;
11.
episodes is the episodes list related to a particular interpretation.
Some applications use information such as transportation means and moving object’s activities to label raw trajectory data. In addition to segmenting trajectories using geometric properties (e.g., velocity, acceleration), SeMiTri [26] uses the map-matching algorithm on the geographical road map to infer the user’s transport type. Other information, such as the purpose of the displacement, is harder to deduce. In these cases, it is usually necessary to apply machine-learning techniques on a historical basis to get such information [3]. However, this information is not so accurate.
Through high-level conceptual schemes, the humans interpret, understand and use the data. Between the low-level observed data and the conceptual level, there is a semantic gap [29]. This semantic gap can be softened by dipping the interpretation of the data in the trajectory movement context. Often, context data are obtained from social media such as Twitter and Facebook. In this media type, users usually leave complementary information (such as hashtags and comments) about their displacement. Such information can support in the process of semantically enriching the raw trajectory data [30]. Complementary to social media, LinkedGeoData is a large spatial database of Web data that is also used in the semantic trajectories process [15].
Another model that is used to represent semantic trajectories is the 5W1H [31]. This model is an abbreviation of the six narrative questions that aim to understand the context of a circumstance and, currently, there are several research uses 5W1H to model the moving object’s context [16,32]. 5W1H has been used by journalists as a guide to describing a fact and is composed of the following questions:
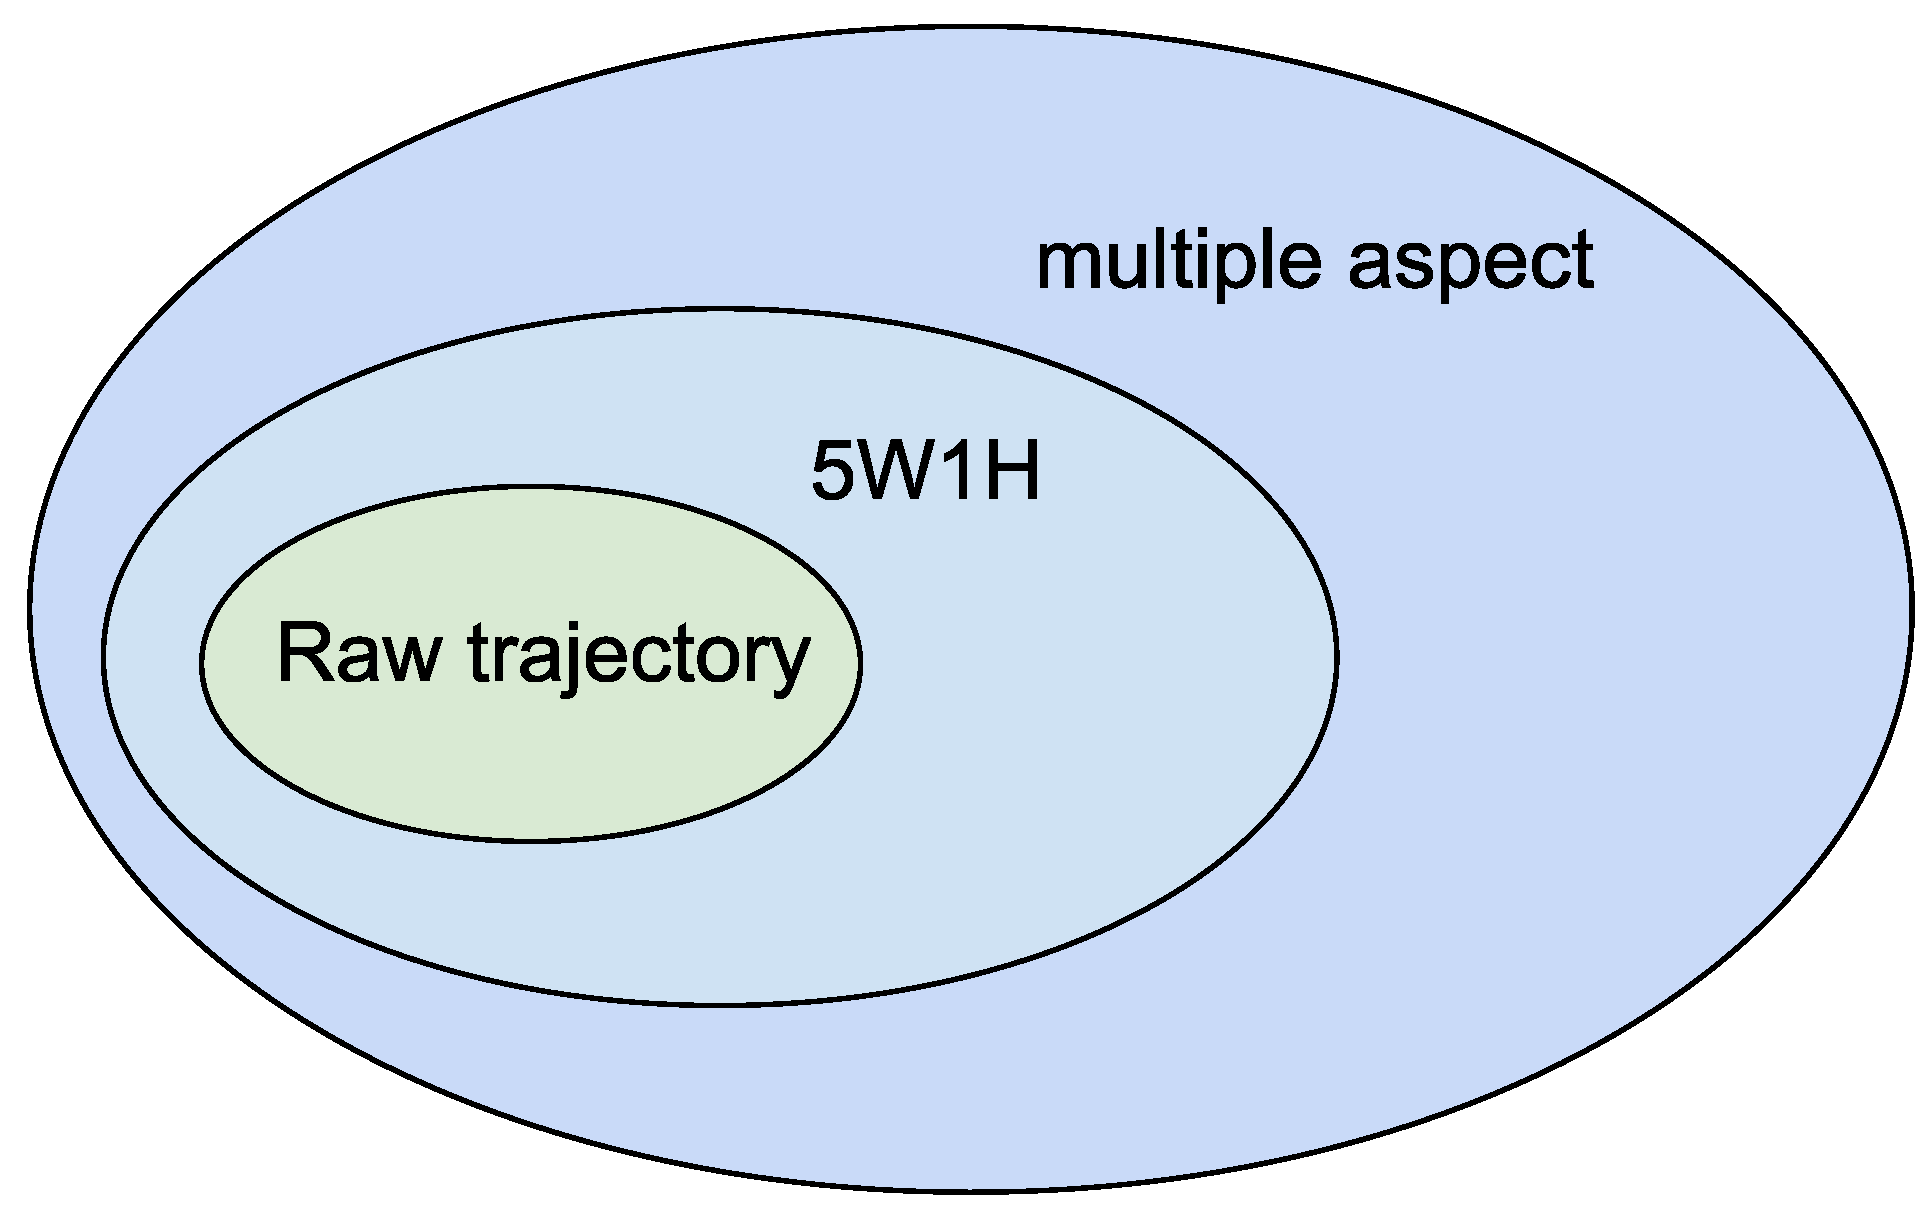
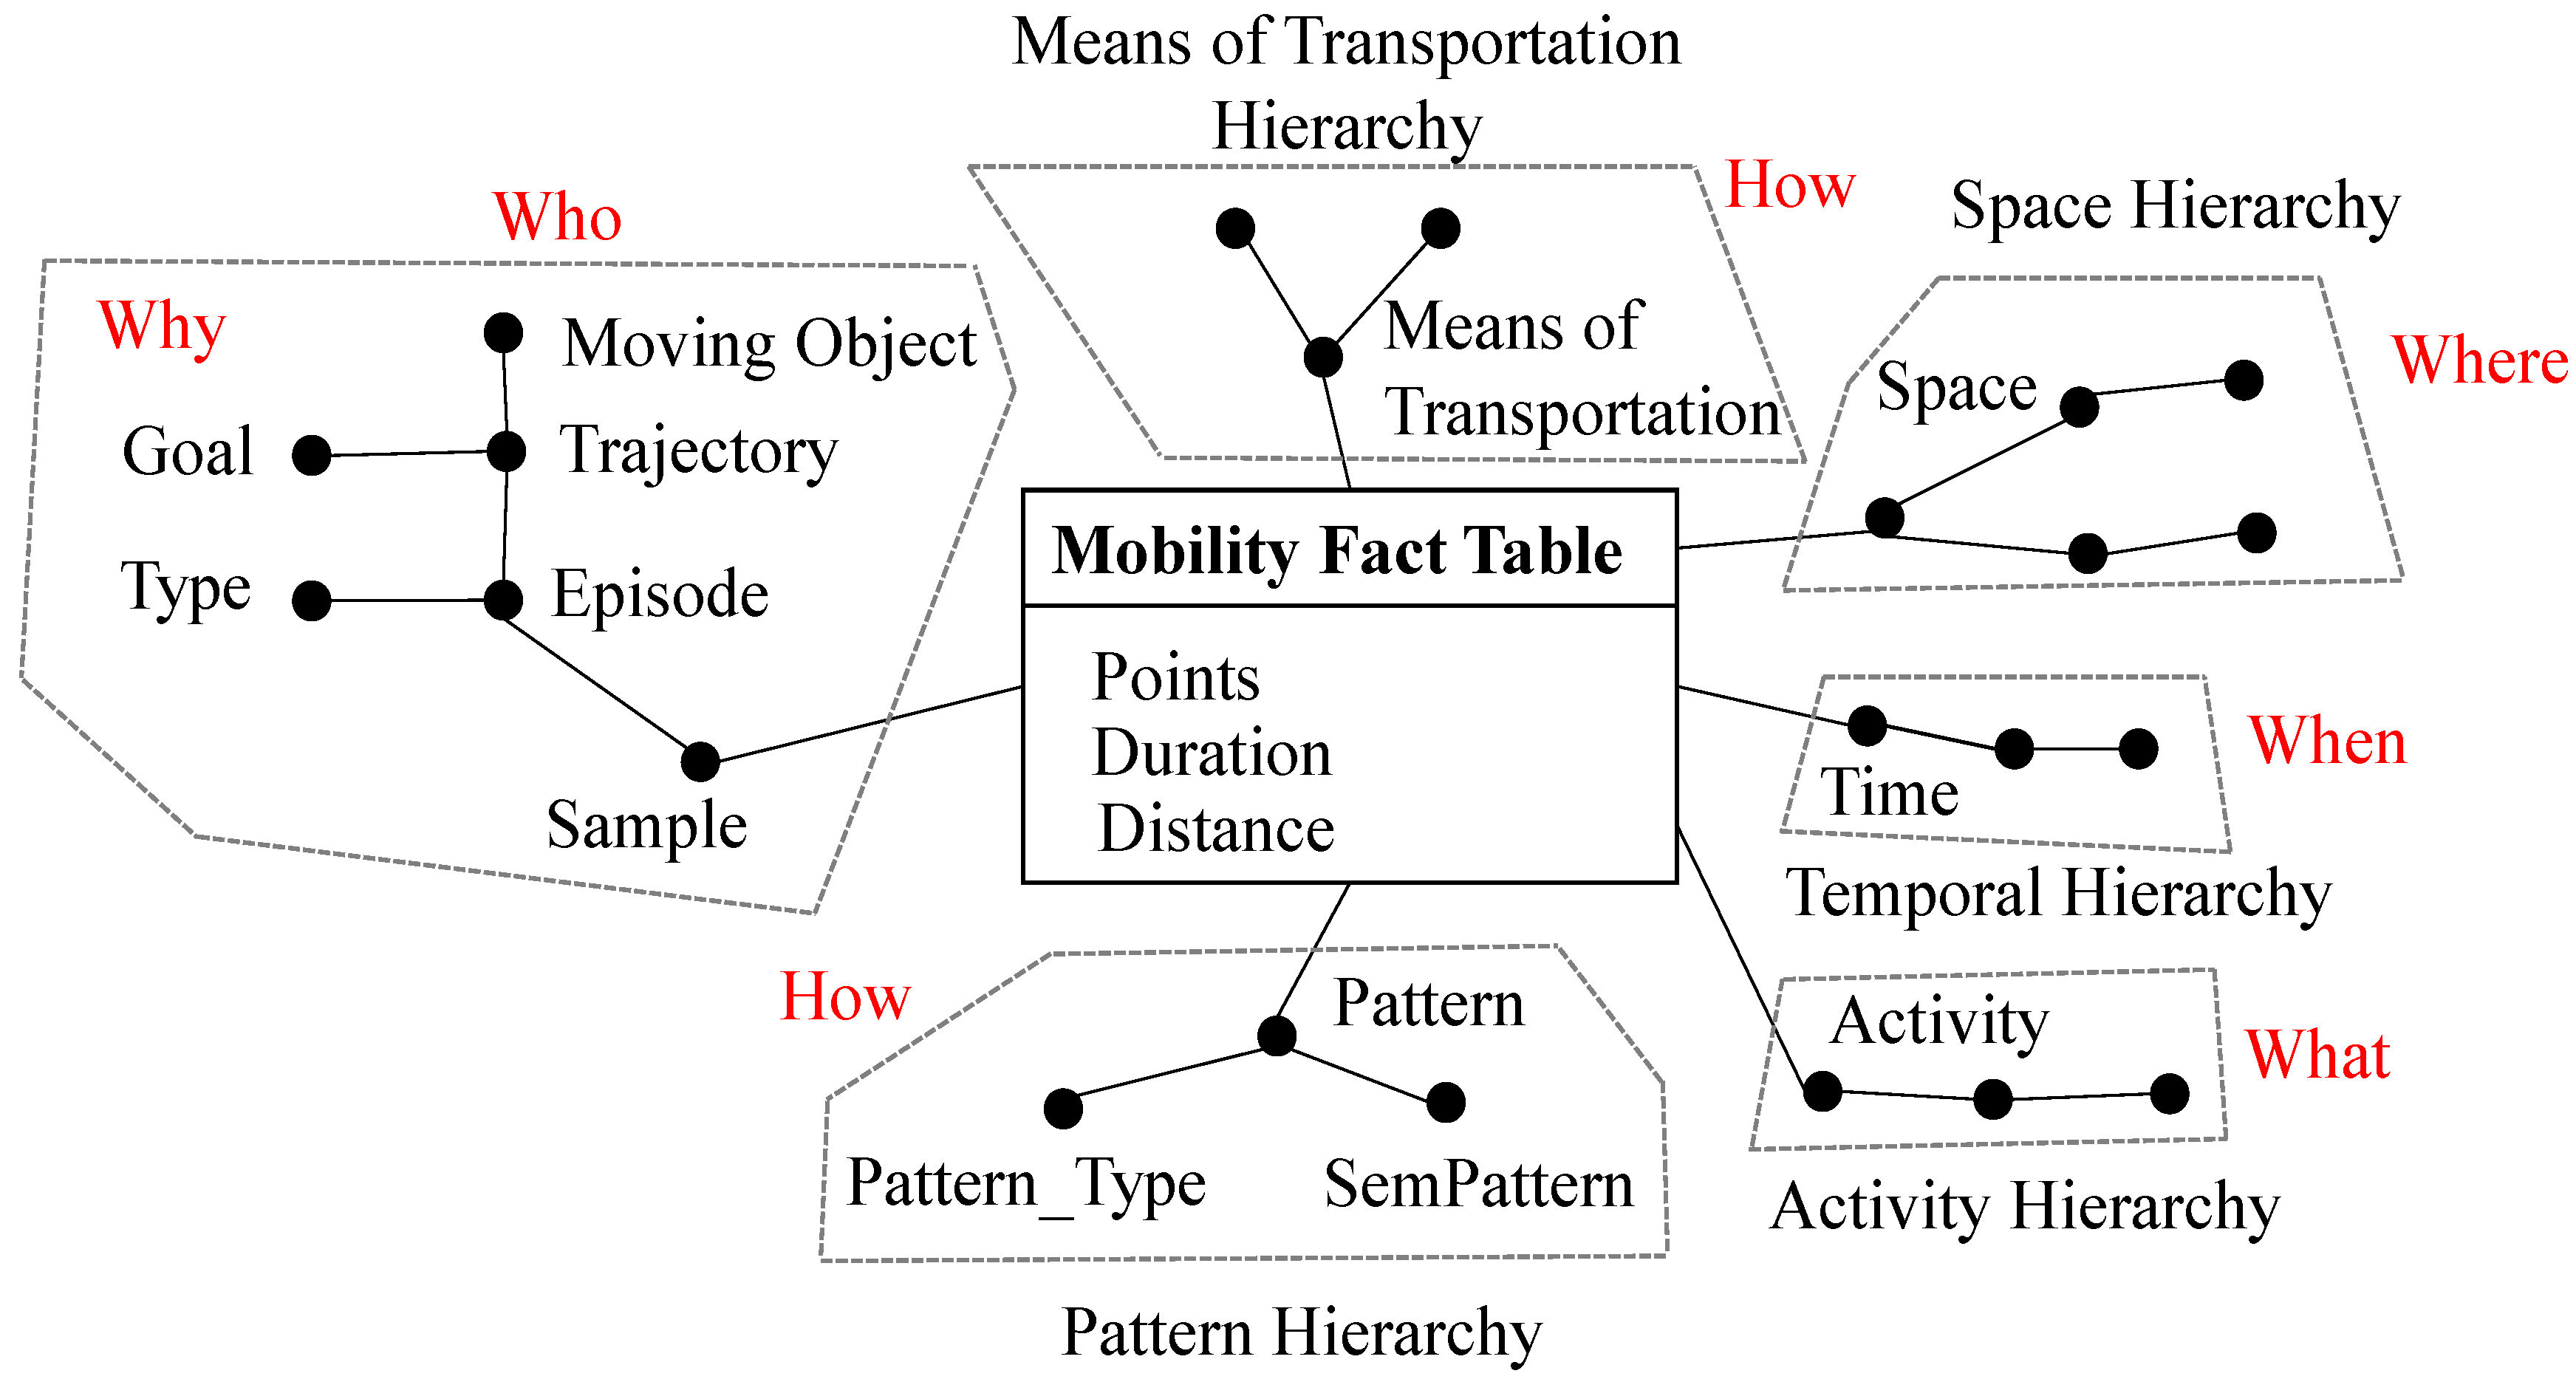
  • Who: moving object identification;
  • Where: the place where the trajectory point is located;
  • When: the time related to the trajectory points;
  • What: what the mobile object is, or was, doing;
  • Why: represents the trip motivation;
  • How: represents how the object moves, such as the transport means.
The MASTER project [33] presents a new approach for trajectories semantic enrichment with different aspects that go beyond the 5W1H model. Aspect is a fact of the real world relevant for trajectory data analysis. From technologies such as a smartwatch, voice intonation analysis, light sensors, among others, it can collect new information types and enrich the trajectory with different semantic aspects. Thereby, it is possible to associate the trajectory segments with information such as the user’s blood pressure, emotional state, heart rate, environment luminosity level, temperature, and noise level. The more aspects we have, the more complete the real movement of an object, and the more information we can infer about objects and places.
Figure 1 shows the levels of semantic enrichment that may be present in the trajectory data. The lowest level is the raw trajectory with basic information (location and time). The level 5W1H is the trajectories that answer the questions according to the model 5W1H. The multiple aspect level is when the trajectory is enriched with any context information beyond those specified in the 5W1H model.
Based on the data analysis process vision, which goes from data collection to the construction and exploration of DW and the multi-dimensional cube, this article presents a survey of the applications that involve analysis of trajectories from the storage, processing, summarization, and analysis viewpoints. Based on typical data warehouse architecture [34], this survey analyzes trajectory systems following three distinct steps, as specified in Figure 2:
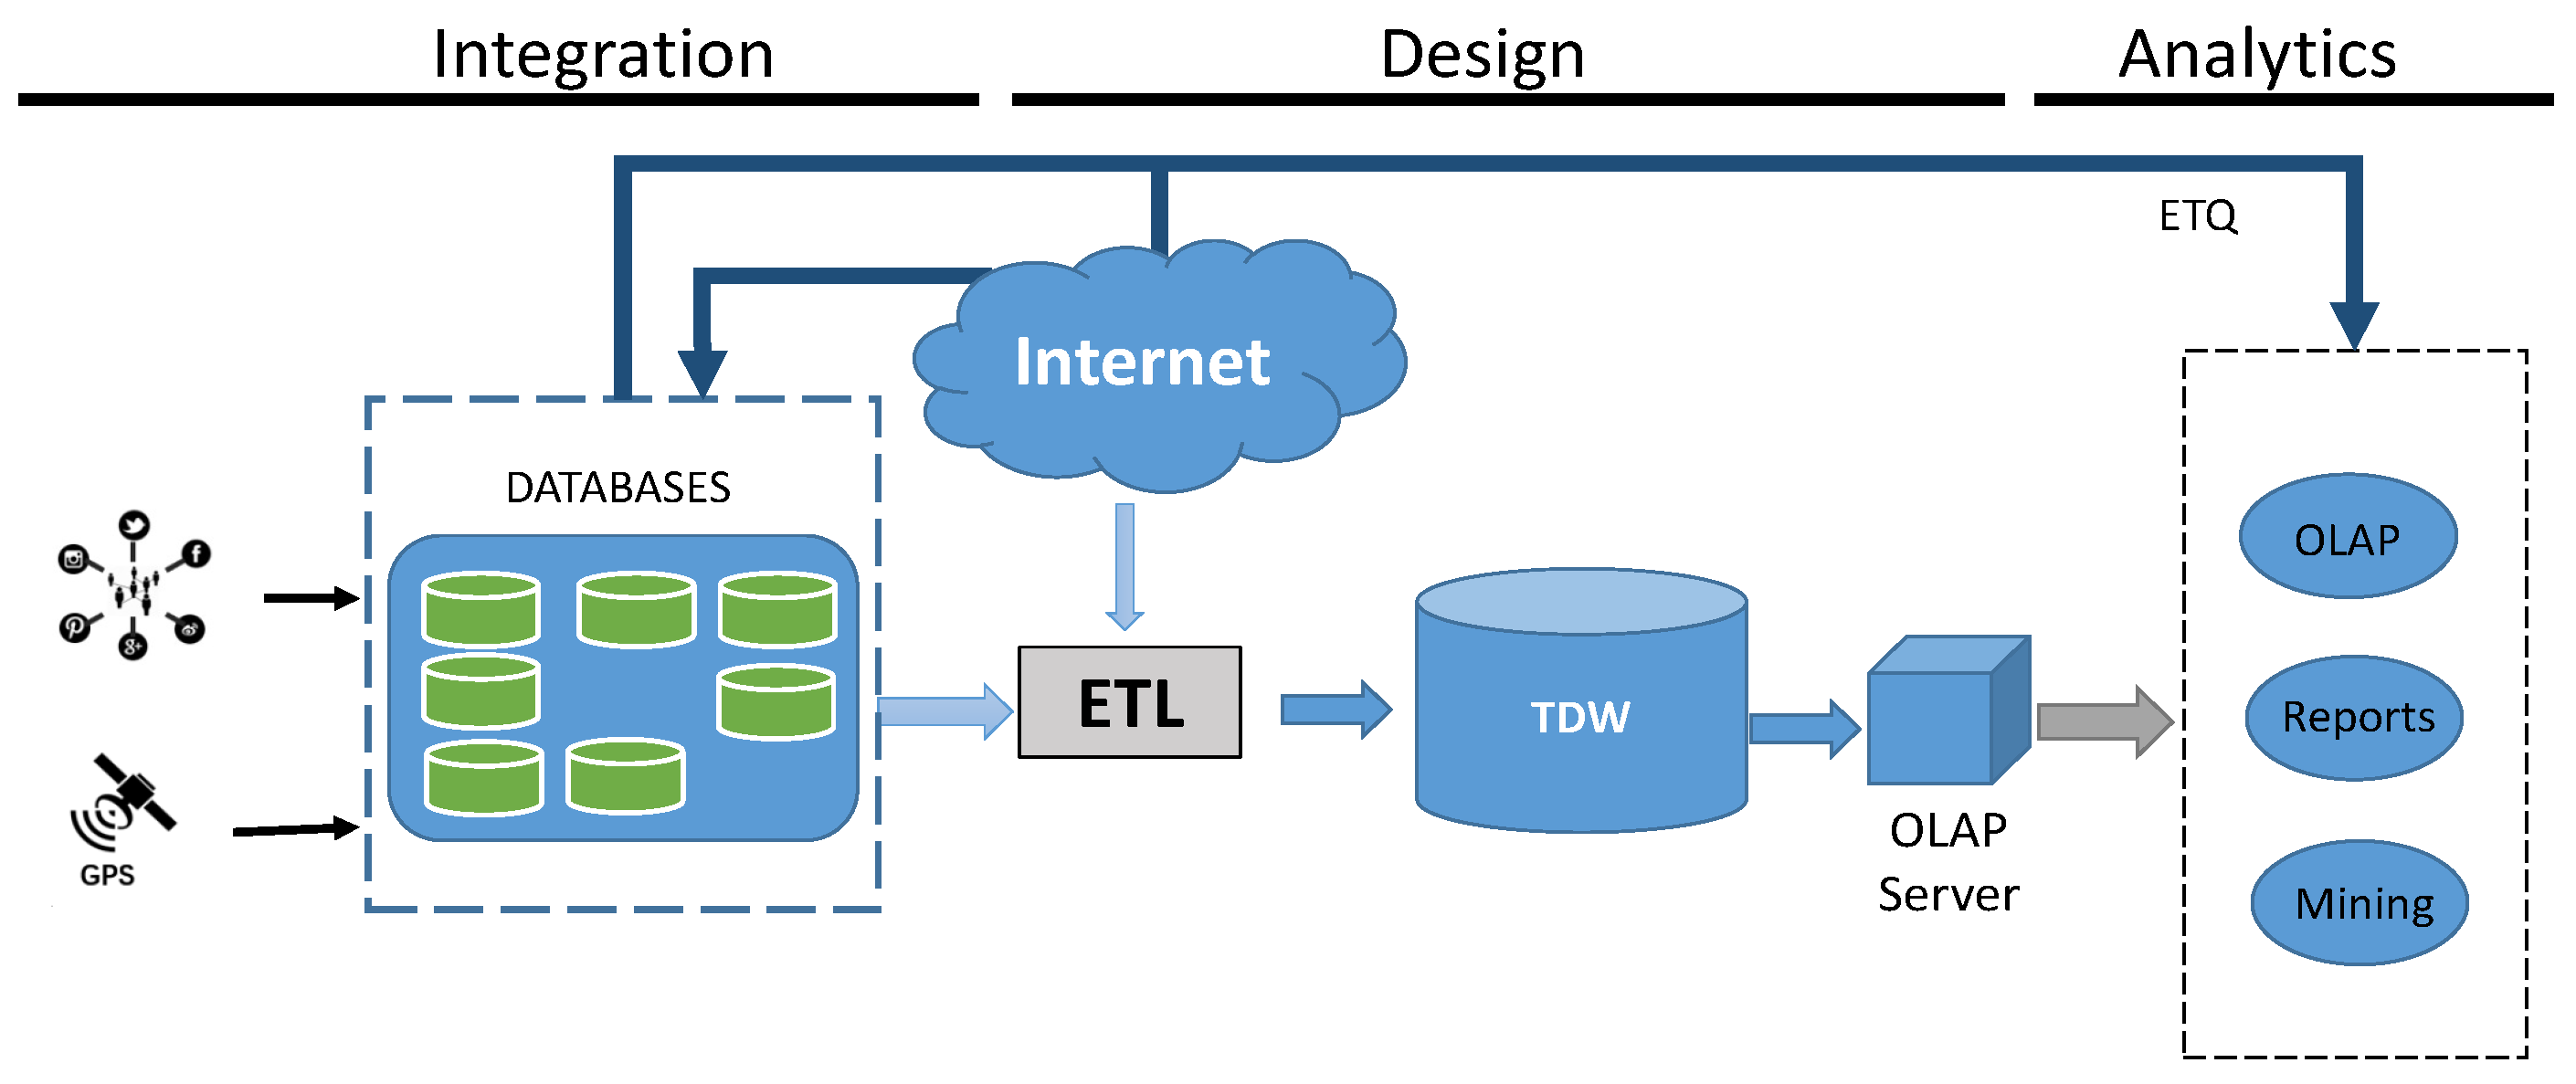
  • Integration: comprises gathering and integrating raw trajectory data, such as geographic coordinates and time, and its consequent storage in a database. This step comprises data source and back-end layers of a data warehouse architecture, as described by Vaisman and Zimányi [2]. Along this process, the collected data can be enriched with other data gained from external sources of interest to the application, such as Geonames (https://www.geonames.org/), OpenStreetMaps, and Twitter. To enrich semantically the raw data collected, further information can be obtained. The semantic enrichment process can occur both in the integration and design steps;
  • Design: this step corresponds to the stage where trajectory data can be summarized in a Data Warehouse through the ETL process;
  • Analytics: this is the architecture exploratory step that queries the Data Warehouse, and other data sources if necessary, to generate reports and other decision-making information. If necessary, the analytics tool can directly query the data source through a process called ETQ (Extract, Transform, Query) [35]. The ETQ process delays data transformations to the last minute and serves to the user on demand [35]; more detail about ETQ is described in the section on Analytics.
We analyzed several research works based on this classification. Table 1 presents a summary of these works, which are detailed throughout this survey. In the following sections, we detail and further discuss the aforementioned steps with a focus on trajectory data.

3. Trajectory Data Integration

Large volumes of mobility data are being generated through devices with a Global Positioning System (GPS) and stored in data repositories. Various types of mobile entities can be traced, such as pedestrians, cars, ships, airplanes, and animals. These datasets provide a rich source of information for the analysis and mobility patterns inference. In the last few years, this kind of information has attracted the attention of both industry and academy researchers, who can use mobility data to extract information and knowledge that are essential for their applications. For example, what, how, and how long an entity is conducting a particular activity. Nowadays, the most challenging task is to make this information accessible in a way that enables users to explore mobile historical patterns to assess how moving entities can evolve in the short or long term [51]. The following subsections describe how trajectory data can be gathered, sorted, and stored.

3.1. Trajectory Data Gathering and Storage

The data-gathering step can involve multiple processing tasks to improve the quality of the trajectory data before initiating mining and analysis activities. For example, the system can perform a cleaning process to remove the outliers. Zhen’s survey [1] divides the outliers problem solutions into three categories: Mean (or Median) filter; Kalman and Particle filter; and Heuristics-Based Outlier Detection. The mean (or median) filter calculates the mean (median) within a sliding window to estimate the real value of a determined point in the trajectory. This filter is best indicated when the trajectory sampling rate is high. Kalman and Particle filters are algorithms used to estimate actual measurements from noise-contaminated data. Kalman and Particle propose models that depend on the initial measurements, i.e., if the first points of the trajectory are noises, the effectiveness of the model drops significantly. The Heuristics-Based Outlier Detection method removes the noise points from the trajectory holding only the points within the calculated limits, that is, the method computes velocity and distance between each point and its successor; if these parameters exceed the limits informed, the point is not included in the trajectory.
Vast volumes of data have an impact on data storage, transmission, processing, and display. The purpose of trajectory data compression is to reduce the size of the data set without distorting the trajectory trend [23]. There are two categories of trajectory data compression algorithms [52]:
  • offline compression: this category reduces the size of the trajectory after the trajectory has been fully generated. The classical algorithm is Douglas–Peucker (DP), which is based on heuristics that recursively divide the sequence of positions and stores only the representative position of each sub-sequence. Nowadays, there are already modifications and improvements in the DP like the Top-Down Time-Ratio (TD-TR) [53];
  • online compression: the compression of the trajectory occurs following the movement of the object along the trajectory. Ideal for real-time environments, such as traffic monitoring. The main algorithms are Sliding Window, Open Window [53], and STTrace [54]. Sliding Window and Open Window are similar algorithms differing in the choice of point location of the sliding window. The algorithm causes a sliding window to grow along with the trajectory points. In contrast, the error of adjustment line segments (line going from the first and last point of the window) and the original trajectory are not greater than the specified error limit. The STTrace algorithm uses the coordinates, speed, and orientation of the current trajectory point to calculate a safe area where the next position can be located; if the next point falls in this region, it can be ignored.
Once collected, organized, cleaned and compressed, the trajectory data can be transformed into a geographic representation before being stored into a database. There are two common formats of geospatial data types: raster and vector. The graph format is a subset of the vector model [55]. It was observed among the analyzed research that the raster format is more commonly used in Data Warehouses that work with summary information at the cell level. In raster format, the map is divided into several cells of a shape (square, triangle, or polygon), and each cell can contain information about a particular variable, e.g., precipitation, temperature, humidity, soil type, etc. [56]. On the other hand, in the vector format, the map is built using points, lines, and polygons and is often used to represent the movement of trajectories geographically. In the trajectory context, the basic logical unit in a vector model is the line, used to encode the object location, and represented as a string of coordinates of points along the line [57]. Finally, the geographical graph represents the geolocated characteristics of data in a map. This representation is generally used to describe the urban grid where roads are represented as edges and reference points (or intersections of streets) as vertices. This is the representation type that can be used for implementing the map-matching process, in which the geographical representation of trajectory points are transformed so that the coordinates match with the representation of the urban mesh. Through the graph, it is possible to get another trajectory representation: the paths. Here, the trajectory is represented by a sequence of segments, and each segment is composed of two vertices of the graph so that two consecutive segments have a common vertex [13].
Trajectory data are stored in different formats according to the device type, monitored objects, and purpose of the application. Besides raw trajectory data, other relevant properties can be obtained and stored, such as speed, direction, and acceleration [12]. Typically, trajectory data are captured in real time, composing a data stream that feeds a type of spatio-temporal database called MOD (Moving Object Database) [39]. A large structure for storage is needed to save the massive and ever-increasing data stream [58]. Current systems can use dataspace technologies and Big Data platforms, such as Apache Spark and Hadoop. The goal of dataspace support is to provide basic functionality over several data sources, regardless of how integrated they are [59]. Dataspace systems offer services on data without requiring upfront semantic integration and services like pay-as-you-go, that is, pay for the service before using it and do not go beyond what you paid for [60]. However, if more sophisticated operations are required, such as relational DB-style operations or data mining, additional efforts can be employed to integrate existing heterogeneous data sources into a Dataspace Support Platform (DSSP) [61].
We have noticed two types of trajectory data manipulation: the trajectory data can be handled in real time, such as navigation systems, e.g., Waze (https://www.waze.com), or analyzed through a historical basis. Real-time trajectory application maintains the current location of the objects, that is, their queries are posed on current location and the expected future positions of the object. The CRISIS system [48] is an example of an application that deals with trajectory data streams and uses Apache Jena to hold in memory an RDF (Resource Description Framework) graph containing a semantic representation of data received from various sensors. In that system, data of several heterogeneous sensors are integrated into a structure that uses Semantic Web to embed the data in a context (in this case, maritime navigation), facilitating the interoperability and the discovery of new knowledge about the environment to be monitored [48]. Data streaming is produced by AIS (Automatic Identification System) sensors and climate and glacier monitoring stations. The streaming data are processed and represented as an RDF graph that can be stored either locally or in the LOD (Linked Open Data) cloud. The MobyDick system [43] presents a prototype framework for managing and monitoring mobile objects. This research does not store any information in the database; it only works with the information in the main memory. MobyDick implements a data model based on temporal and spatial ISO specification: ISO 19108:2002 [62] and ISO 19107: 2003 [63]. MobyDick functions as a layer above the Apache Flink [64] platform, which implements parallel distributed processing of data.
Unlike applications that use data streams, a Trajectory Database maintains the history of the movement. The new tendency to maintain a historical trajectory database fed continuously by a moving object data stream requires a robust structure with large storage capacity. Computational clusters with parallel processing and horizontal scalability are infrastructures that support Big Data storage and analysis [65]. The Bao et al. research [42] presents a system that focuses on urban trajectories. Their system uses Microsoft Azure to store the large volume of data. The system is composed of three modules: trajectory storage, space-time indexing, and map-matching. The most recent data are stored in a Redis database and the Azure for historical data. ST-Hadoop [47] was the first open-source MapReduce framework with native spatial-temporal data support. It sacrifices storage for better performance by storing data at the level of the day, month, and year. The data are stored in files in HDFS (Hadoop Distributed File System) with spatio-temporal indexing that speeds up the query process.
Traditional trajectory management systems, such as PostgreSQL, Oracle, HDFS, and Azure, are disk-oriented, which can cause problems of scalability and slow query processing. Hence, the use of Big Data platforms like Apache Spark has become increasingly common in the management of trajectory data. The Spark platform is a distributed system that provides an abstraction called RDD (Resilient Distributed Dataset) (https://spark.apache.org/docs/latest/rdd-programming-guide.html,ApacheSpark-RDDProgrammingGuide). These RDDs maintain a collection of objects in memory that can be handled conveniently by Spark. The TrajSpark system [46] extends the Apache Spark by building a global and local indexing structure to speed up the searching process. In addition, TrajSpark relies on a load-balancing monitor that improves the use of data partitions. In some applications, the balancing is done by adding new data on an hourly or daily database, and the data distribution changes over time. If the entire dataset is re-partitioned when new data are loaded, this can cause an overhead cost. To re-partition, old data are not worth it because new data are more valuable. Therefore, TrajSpark only tries to partition the new data groups without touching the existing data.
Another system that uses the Spark architecture is the DiStRDF (Distributed Spatio-temporal RDF system) [49]. DiStRDF is a distributed system that uses RDF to process spatio-temporal queries in a network of heterogeneous databases. In Nikitopoulos et al.’s experiments, data were stored in an HDFS system managed by an Apache Spark environment. The RDF data acts as a large dictionary containing an approximate location summary of the object and the event time. This dictionary is stored in a Redis database to speed up query processing.
Based on storage system and geometric representation, some systems were analyzed and arranged according to Table 2. This table presents the platforms used to manage the trajectory data used in some works and the geometric representation type used. The column Geometric Representation shows the geometric representation type used in the research analyzed. In the integration step, it is observed that none of the proposed architectures deal with data in raster format. All analyzed research stores the trajectory data in vector format and one of them also represents the information in graph form. Each data manager was chosen to accord with the trajectory data model used in each research work.
Table 2 shows some systems that use spatial databases such as PostgreSQL, together with the spatial expansion Postgis, and Oracle. More recent works have adopted Big Data technologies, as this is the new trend because of the large volume of trajectory data that is produced by sensors and social media. It is estimated that the amount of digital data doubles its size every two years and geospatial data are a major contributor to the Big Data scenario [66]. Traditional storage technologies, such as those used in [26,40], cannot organize and query this large volume of data. Computational clusters with parallel processing and horizontal scalability are infrastructures that support Big Data storage and analysis [65]. Big Data technologies such as Hadoop, MongoDB, Flink, and Spark are becoming increasingly common in large Database Management Systems [65,67]. We can conclude that newer trajectory systems tend to use Big Data technologies (Azure, Spark, ST-Hadoop, MongoDB) to deal with trajectory data. In addition, cloud computing platforms, such as those using Azure, HDFS, and Spark, are not optimized to deal with spatio-temporal data.
The trajectory systems shown in Table 2 can also be grouped according to the adopted data structure: structured data or semi-structured data. The T-Warehouse system [39] presents the complete architecture of a trajectory system, with MOD and TDW modules. The MOD module uses the Hermes framework [68] to provide an Object-Relational DBMS (ORDBMS) to trajectory data. The Oracle DBMS is used to build the TDW. It is observed that older works, such as SeMiTri [26], use a simple relational database with spatial extension, as in the case of PostgreSQL + postgis. Other works use a semi-structured data model, especially when it should represent the semantic information of the trajectory. Modeling trajectory data using RDF graphs or ontologies has gained strength as new works on semantic trajectories enrichment have emerged [33,49]. Representing semantic trajectory data using RDF enables not only inferring new knowledge, but also the publication of data as Linked Open Data (LOD), making it accessible on the Semantic Web. For example, the MASTER [33] project uses a database called Rendezvous [69] that stores graphs in the RDF format and intends to make its data available on the Semantic Web. Rendezvous is a triplestore [70] based on an NoSQL distributed database that stores data in an RDF format. According to [29], trajectory data storage technologies are well served, and the new challenge now is the semantic enrichment of trajectory data, which is the subject addressed in the next subsection.

3.2. Semantic Trajectories

This section describes the semantically enriched MODs (Table 2) with the respective semantic information type.
The SeMiTri system [26] is an application example that processes geometric data and context data to produce semantically enriched trajectories. The system performs three types of semantic annotation: by region, line, and point. The annotation by region is computed through online maps like OpenStreetMap and can identify areas such as residential, industrial, and commercial. For line annotation, the system performs a map-matching operation, and then, based on context, the system infers the user’s transport type (bus, subway, hike, etc.). Point type annotations are associated with those trajectory segments where the moving object is stationary. In this segment type, the system identifies the PoI, using a Markov Chain algorithm [71], which is more suitable for this segment type (home, work, market, etc.).
The system named VISTA [50] presents a tool with visual analytics functionalities that support the users: (i) in exploring and processing trajectory data; and (ii) in creating features and semantic information, to guide the user to comprehend how to label trajectories properly. Another system that also assigns trajectory annotations is ANALYTiC [45], which uses machine-learning algorithms to infer semantic annotations about trajectory data. In that article, a semantic annotation, or label, is any contextual information related to the trajectory, for example: activity information such as walking, studying, driving, or fishing. ANALYTiC uses the active learning strategy to maintain good performance of classifiers while using a smaller number of training examples.
The CONSTAnT model [3] is only a conceptual data model that defines the important aspects to implement a semantic trajectory system. The model is divided basically into two parts. The first part refers to the simplest entities, which contain information about the object, trajectory, sub-tracings, semantic points, environment, place, and events. The second part refers to the more complex objects in which data mining techniques are required to instantiate its objects, such as purpose, means of transport, and behavior.
The MASTER system presents not only the conceptual model but also the logical model and an example of data storage and information query. The focus of the MASTER project is not how to get semantic information, but how to represent semantic information by conceptual and logical models. The logical model is represented by an RDF graph because it is generic enough to model trajectories and aspects extracted from heterogeneous data sources [33]. The MASTER system uses the database Rendezvous [69] in order to manage the large volume of data.
Table 3 highlights the projects that used some semantic notation for trajectories. The table also indicates the semantic information type, according to the 5W1H model, adopted in each system that has some semantic information linked to the trajectory. Among the applications discussed in this section, the MASTER project [33] would be able to fit the 5W1H model, besides allowing the input of other contextual information.
Some systems only adopt a label for trajectory [45], and others allow annotation for each part of the trajectory: point, segment and entire trajectory. The column Semantic Annotation from Table 3 highlights the semantic annotation allowed for each part of the trajectory. The SeMiTri [26] and MASTER [33] allow associate semantic information for point, segment, and/or entire trajectory. The ANALYTiC [45] system associates semantic information to entire trajectory and the VISTA [50] systems associate semantic information to trajectory segment.

4. Trajectory Data Warehouse Design

The new technologies developed for mobile devices and low-cost sensors have resulted in the trajectory data volume growth. This data volume can be stored in a multi-dimensional model, defined by a Trajectory Data Warehouse (TDW), enabling a more precise analysis. These data warehouses aim at storing, managing, and analyzing the data of the trajectories in a multi-dimensional way [36].
The motivation behind Trajectory Data Warehouses (TDWs) is to transform raw trajectories into valuable information that can aid decision-making in ubiquitous applications such as Location-Based Services, traffic control, and species migration [72,73]. Questions such as “which street has the most traffic within a 1 km radius of each hospital?” or “how many users are moving within a district in a time frame?” can be answered using legacy systems. However, the computational cost and the response time for real-time services seem inadequate [72].
The following subsections describe the current existing trajectory data warehouse, which are the cell-based TDWs and the segment-based TDWs. Finally, works on Semantic TDW are described.

4.1. Trajectory Data Warehouse

Data Warehouse is one of the main components in Business Intelligence (BI). In the BI environment, the life cycle of a data record begins with the occurrence of an event. Then, the ETL process delivers the event record to a common repository called Data Warehouse. Finally, analytical processing transforms data into information for the decision-making process, and a business decision leads to a corresponding action. Business Intelligence comprises a collection of methodologies, processes, architectures, and technologies that transform raw data into useful and meaningful information for decision-making [2]. These systems collect large amounts of data and summarize them so they can be used in the organizational behavior analysis. This data transformation comprises a set of tasks that collect data from data sources and, after the extraction, transformation, integration, and cleaning processes, store the processed data in a Data Warehouse [74].
It has been observed there are two approaches for dealing with trajectory data in Data Warehouses. In the first one, the region of interest is split into several cells, and each cell contains a summary of information about the trajectories crossing location. In the other way, the trajectories are grouped into several segments, also called episodes.
In the cell-based Data Warehouse design approach, space and time are partitioned into spatio-temporal cells (or grids), and each cell contains aggregation measures pre-computed from the trajectories that cross the cell [39,75]. The advantage of a cell-based DW is that it can be implemented in a traditional Data Warehouse using a relational DBMS such as SQL Server [75]. The geographical space is partitioned into regions, and the trajectory data are pre-computed for each map partition. The trajectory’s geometry is not stored in the TDW, only aggregated information such as average speed and total distance traveled within the cell, and the number of times the edge of the cell has been traversed. The aggregate information stored in each cell of the DW model can be used to reveal knowledge about a particular geographic region [36].
Figure 3 presents a snowflake schema [34] of a cell-based TDW. This example contains basic information of a TDW, a fact table with some measurements and dimensions referring to the moving object’s profile, and the spatial and temporal dimensions of the trajectory. In the Figure 3 example, moving objects are represented by the entity OBJECT_PROFILE_DIM that contains the property for the object type, and may include other properties, e.g., car brand and model, ship type, user’s profession, among others. The cell dimension contains a spatial column to represent the cell geographically, as well as city, state, and country entities. The fact table contains the measurements that are calculated during the ETL process. Using spatial operators such as INSIDE, CONTAINS, COVERS, and OVERLAPS [76], we can find out which cells are traversed by a trajectory. Examples of measures that can be calculated and stored in the fact table are: distinct number of trajectories (amount), average velocity of objects (velocity), average distance traveled (distance), and auxiliary measurements (e.g., cross_x, cross_y, cross_t). Auxiliary measurements report the number of objects that crossed the cell’s spatial (e.g., cross_x and cross_y) and temporal (cross_t) edges.
In the Data Warehouse and OLAP cube, it is possible to aggregate measures along a dimension hierarchy (using an aggregate function) to get measures at a coarser granularity. This operation is called roll-up [77]. The cell TDW approach has two known issues involving roll-up operation. One is the double_counting problem because the cell may be present in more than one city. This is because the cell dimension forms a Nonstrict Hierarchies [34] with the entity city_dim. One solution to this problem is to use a distribution attribute in the relationship indicating the percentage of the aggregated value that will be allocated to the parent member (in the Figure 3 example, it is the city_dim entity) [2]. Another problem is called distinct count problem [78] that also occurs in the sum of some measure in the fact table during roll-up operation. If we were dealing with a traditional Data Warehouse, to get the number of moving objects inside a city in a given time frame, it would be enough to add the number of objects within each cell, but this operation makes no sense in cell-based TDW, since the same object may have crossed multiple cells during the time interval. Marketos et al. [38] proposed a solution to this problem by using auxiliary measures (cross_x, cross_y and cross_t) to calculate how many objects have crossed the cell edge and thus to correct the calculation error in the measure aggregation of the amount property.
Vaisman and Zimányi [2] and Renso et al. [23] present a conceptual scheme of a segment-based TDW, where the fact table contains the trajectory segments and their attributes including: the geometry of the segment route, the distance traveled, speed, and duration. Figure 4 shows an example of segment-based TDW. The dimensions are: segment start time, segment end time, moving object, and trajectory. In this TDW type, the Data Warehouse must support geospatial data. In addition, the fact table contains a spatial attribute referring to a segment (route), and the entity Trajectory has the geographical point of departure and arrival of the trajectory.
A trajectory can be structured in episodes of different formats [23]. For example, for a tourist, the trajectory can be segmented into episodes based on:
  • Stopping and moving;
  • Period of time corresponding to the instant of the spatio-temporal position. Example: morning, noon, afternoon, evening; and
  • Category of the city region corresponding to the location of the spatio-temporal position. Example: residence, tourism, commercial, recreation.
Table 4 presents the analyzed TDW and how they can be grouped according to the design type they use. Leonardi et al. [40] is the only that uses the two design type. Beyond regular spatial grid, they can summarize trajectory using political division as city districts. In [40], the trajectory can also be summarized by street segment. A work of map-maching [79] is necessary before summarizing trajectory by segment. Thus, it is possible to know information such the average speed, travel time, and visits about street segment.

4.2. Semantic Trajectory Data Warehouse

According to Wagner et al. [31], the main limitation of a standard trajectory system is the fact that they do not deal with semantic trajectories, but simply with sequences of spatio-temporal points. Some research involving a STrDW (Semantic Trajectory Data Warehouse) model has already been proposed. For example, Manaa and Akaichi [44] describe a model approaching the significant steps in the DW design process: integration, design and analysis, but with more emphasis on design. The framework proposed in [44] groups data from heterogeneous sources into a global ontology that was previously created by a expert. The global ontology is used for the creation of a multi-dimensional ontology with dimensions, facts, and measures. This sub-ontology model is called the Semantic Trajectory Data Warehouse Ontology.
Dealing with data in ontologies, or RDF graphs, still has some performance problems, taking a significant amount of time to execute or causing a timeout. An optimization process is required to support such queries to ensure the usability of LODs in BI systems. Ibragimov et al. present a conceptual model of a virtual data cube using the QB4OLAP vocabulary [80]. QB4OLAP is an RDF vocabulary that enables the publication of multi-dimensional data in the semantic web [81]. The data cube is considered virtual because the data are not stored in the local system. When expressing the multi-dimensional query in MDX, the system transforms and sends SPARQL queries to remote data sources, as in a federated system [75]. The queries are optimized so that fewer requests are sent to endpoints, improving system performance. Finally, the system gathers the information in a QB4OLAP structure in the main memory, and the values are computed and returned to the user.
Some STrDW follows the 5W1H model to represent semantic trajectories (see Figure 5), where the dimensions try to answer the main research questions of a fact. The fact table contains the spatio-temporal measurements for the sample (sample). For example, Duration is the time spent between the current sample and the previous point. Distance is the distance measured between the current sample and the previous sample. The sample represents the space-time point of an object (id, x, y, t). A sample belongs to an episode that can be either of the stop or move types. The stop-like episodes represent the elements of the trajectory in which the object was stopped, whereas episodes of the move type represent elements in which the object was in motion. It is in this hierarchy that the Who and Why dimensions of the 5W1H model are found.
In the example in Figure 5, the Pattern dimension uses data mining to associate some semantics related to the trajectory. In addition, the Pattern dimension is divided into type and semantics. The semantics, represented by the “SemPattern” dimension, expresses the interpretation of the trajectory pattern. For example, a set of trajectories can be interpreted as a travelers group moving from the North to the East. The Pattern_type dimension represents the mobility pattern of a group of trajectories, that is, what is the movement pattern of objects, e.g.: flock, flow and cluster [21]. Pattern and Means of Transport express information on how the trajectory is traversed. The Activity, Time, and Space dimensions inform, respectively, what, when, and where the measure in the fact table refers to.
To date, no applications have been found capable of making a deep analysis of the semantic characteristics of trajectories. On the other hand, there are many ideas on how to model such applications. A model that attempts to encompass 5W1H is the Baquara framework [32]. It is a conceptual framework for the analysis and enrichment of motion data that includes a customizable process to enrich semantically movement data, and an ontology that provides a conceptual model to accommodate semantic data.
Another model based on the 5W1H concept is the SWOT (Semantic Data Warehouse of Trajectories) [41]. The SWOT comprises two layers: consensual and interpretive. The consensual layer represents the fact table and the three basic dimensions: space, time, and trajectory. The interpretive layer is composed of descriptive information that integrates the semantic part of the model, located in the outermost part of the conceptual model. This approach allows the reuse of consensual data between several applications in different domains. Changes made to interpretive data do not affect the facts.
The Mob-Warehouse [31] is a TDW model based on the 5W1H framework, where each dimension of the DW corresponds to an attempt to answer a semantic question as described in Figure 5. Wagner’s work [31] describes an STrDW model using ontologies and presents a framework that integrates heterogeneous data from several data sources into an ontology called Generic Semantic Trajectory Ontology. This ontology attempts to describe the mobile object, the geographic environment involved, the activities performed, the movement of the object, and the semantics of the subtrajectories.
In Table 5, it is observed that many works are only conceptual models (type column), especially STrDW research. Table 5 also presents the systems of both levels of operation and the STrDW, and the semantic information type that each addresses according to the 5W1H model. It may seem strange that systems that deal with semantic trajectories do not satisfy the When parameter of the 5W1H model. However, this parameter represents much more than a simple date in the calendar. The parameter refers to the semantic information associated with the date in the calendar, such as weekends, anniversary dates, holidays, and commemorative dates.

5. Trajectory Data Analytics

Increasingly, applications that handle large volumes of data perform some analysis. Analytics is the science or method used to examine something complex. When applied to data, analytics is the process of deriving knowledge and insights from them [82]. The analysis step comprises the exploitation of the DW summarized data. As the object of study is data of trajectory, that is, spatial information, it is natural to use geographic information systems for data analysis and observation.
Analytics tools can also directly query other data sources in a process called ETQ. In this process, the data are transformed on-demand and virtually at the moment of the query. Some proposed research use the ETQ to query the Linked Open Data semantic [80] and to expand the OLAP cube dimensions [83]. The conventional data analysis and the semantic web integration into a BI system result in a new analysis tool category called exploratory OLAP [35]. In addition, it is often necessary to use an OLAP tool with spatial capabilities, known as SOLAP (Spatial OLAP) [84] because path data have embedded geographic information. If the analytical tool integrates semantic data, spatial data, semi-structured, and structured data, it is called ExpSOLAP [85].
According to [82], the analytics systems can be classified into five types:
  • Descriptive: able to answer questions like, “what happened?”. These systems can only describe, summarize, or present the raw data that have been collected. Data are decoded, interpreted in a context, and then presented in the form of graphs, reports, statistics, among others;
  • Diagnostic: try to understand why something is happening;
  • Discovery: try to answer the question about what happened that was not yet known. For this, inference of non-trivial information, reasoning or detection techniques are applied to the raw data;
  • Predictive: try to answer the question “What is likely to happen?”. To do this, they use past data and knowledge to predict future results and provide methods to assess the quality of these predictions;
  • Prescriptive: try to analyze the question of what needs to be done about what happened or is likely to happen.
Using VATookit, we can see the time evolution of the dividing cells of the map. For each cell, a measurement triangle is assigned that informs the number of objects and the average speed of objects within a cell. Thus, it is possible to find out on the map potential congestion areas based on the height and width of the triangles. Figure 6 depicts an illustrative example that shows how the mapping of trajectories can be divided into cells occurs. Other types of analysis can be used, such as a pie chart or bar chart.
On the other hand, Renso et al. [23] show a kind of visualization called Time Graph, which displays the evolution of traffic during the week beginning on Sunday and ending on Saturday. Each curve in the graph corresponds to the number of objects in a cell in the grid. Renso et al. [23] show with the Time Graph that the traffic of the city of Milan (Italy) grows during the day and decreases at night. On the weekend, traffic is lower than on other days.
For segment-based TDWs, each trajectory can be analyzed individually, depending on how the DW was designed. In Andrienko and Andrienko, an analytical form of the movement called “Bird’s-eye view on movement in context” is described [17]. In that type of analysis, generalization and aggregation are used to discover spatio-temporal patterns. There are two types of analysis in this category: an investigation of the moving objects presence variation in different locations in space and time, and the investigation of objects flow between spatial locations. To analyze the mobile object presence, a density map is used where the most visited areas are painted with darker colors and less visited areas with lighter colors. The moving object’s presence in a location during some time interval can be characterized in terms of the count of different objects that visited the location and the total time spent in the location [17]. Motion analysis can be done employing a flow map in which similar trajectories can be aggregated. Sometimes, to consider a similar trajectory for a flow map does not mean that the trajectories are the same but that they have the same origin and destination.
All the systems presented in this article perform only a descriptive analysis of the trajectories; that is, they only represent the history of the data through reports, graphs, tables, etc. Performing other types of analysis is still a big challenge. STrDW is a new area in computer science and requires further work, mainly involving the five types of analytics systems.

6. Open Challenges in Big Data for Trajectory Analytics

Research regarding raw trajectory data is very advanced. There are several papers describing compressing processes, indexing, similarity measurement, and trajectory storage [86]. We perceived in recent years a great storage and query requirement of big trajectory data.
Various trajectory storage works use spatial databases and adapt these databases to spatio-temporal data [42,46,47]. Among the analyzed articles, only geographic data receive temporal treatment, but other properties of the moving object may change along the time besides the geographical position. DMBS as SECONDO and Temporal PostgreSQL + PostGIS [81] allow for associate temporal types with both geographic and primitive types. Extending this capability to Spatial Big Data technologies can help to increase trajectory expression power and simplify temporal queries such as time instant, period, and velocity.
Most moving objects are represented using point symbols because the size of most monitored objects is insignificant compared to the scale of a regional, continental, or even world map. Perhaps an approach that monitors shape changes of some moving objects a long time, not only the trajectory, can aid to understand behavior and predict future occurrences, such as typhoons, sea oil slicks, herds, river questions, and erosion.
The new trend in trajectory systems is to embed semantic data into the information collected [29]. However, the Data Warehouse semantic trajectories building process still lacks more in-depth research. It remains in the conceptual modeling field because capturing information from the user’s context in a transparent way, without the user being harassed to inform the system about its current context, is a non-trivial task. Through the analysis of the movement geographic context and the use of data mining techniques [72], it is possible to discover or infer the behavior of objects to answer the fundamental questions of the 5W1H model. All such summarized information may compose the Semantic Trajectory Data Warehouse.
Building a STrDW for Big Data is still a challenge due not only to the volume of information, but also to the wide data variety. Similarly, a SOLAP server supporting Big Data is still under study. The Apache Kylin (http://kylin.apache.org/) tool is an OLAP server for Big Data, but it still lacks a spatial expansion. Keskin and Yazici [87] propose an architecture for a spatio-temporal OLAP server for Big Data. However, current studies focus mostly on meteorological data, needing to adapt the architecture to trajectory data.
The analytics step described in this survey consists of DW summarized data exploration. Regarding the analytical tool type, most TDWs only present the descriptive kind of analysis. Some applications can predict a user’s destination or the purpose of their trip based on history or information left on social media, but an Analytics system inferring the reason for a behavior of a set of paths, what impact that behavior has, and what needs to be done are still open issues in the TDW research field.
Another very important issue that should be considered in the research of trajectories concerns user’s privacy [11,13]. Some trajectory works can help in the safety of society, such as detecting anomalies, kidnappings, unexpected stops [11,88], but to what extent are people willing to sacrifice their privacy for security reasons? An organization, public or private, may use an individual monitoring system for or against the citizen himself. For example, the works of [89] and [90] use privacy preserving techniques for dealing with trajectory data.

7. Final Considerations

The objective of this survey is to gather several research in Big Data Trajectory Data Warehouse from the OLAP systems perspective. As a result, the research works discussed were categorized and evaluated in the following steps: integration, design, and analysis. The integration step corresponds to the step of collecting and storing the raw trajectory data. The design stage comprises the ETL process and TDW construction. The analysis step corresponds to examining the complexity of the data using various resources such as tables, maps, graphs, and reports.
The new stage in the trajectory systems evolution is to couple contextual information with data, and, as a result, semantically enriching the trajectory. Early works attempted to enrich the trajectory by attaching only one information label to it. As the research in this field progressed, more works based on the 5W1H model have emerged. This model is the same that guides journalistic reporting in fact description, and, now, it can help with the enrichment of mobile object trajectory. Currently, the new challenge is not only to use the 5W1H model, but any moving object information and context information to enrich the trajectory semantically. Such information can be obtained by sensors like heart rate, temperature, noise, brightness, and more.

Author Contributions

Conceptualization, D.R.d.A., and C.d.S.B.; investigation, D.R.A.; resources, C.d.S.B., and A.S.; writing–original draft preparation, D.R.A.; writing-review & editing, C.d.S.B., F.G.d.A., and A.S.; visualization, D.R.A.; supervision, C.d.S.B., F.G.d.A., and A.S.; project administration, C.d.S.B. All authors have read and agreed to the published version of the manuscript.

Funding

This research received no external funding.

Acknowledgments

We would like to thank the Brazilian Research Council—CNPQ and Natural Sciences and Engineering Research Council of Canada—NSERC for financial support.

Conflicts of Interest

The authors declare no conflict of interest.

Abbreviations

The following abbreviations are used in this manuscript:
AISAutomatic Identification System
BIBusiness Intelligence
DBMSDatabase Management Systems
DPDouglas–Peucker
DSSPDataspace Support Platform
DWData Warehouse
ETLExtraction, Transformation, and Loading
ETQExtract, Transform, Query
ExpSOLAPExploratory SOLAP
GPSGlobal Positioning System
GRASP-SemTSGRASP for Semi-supervised Trajectory Segmentation
GRASP-UTSGreedy Randomized Adaptive Search Procedure for Unsupervised Trajectory
Segmentation
GSMGlobal System for Mobile Communications
HDFSHadoop Distributed File System
ISOInternational Organization for Standardization
LODLinked Open Data
MDXMulti-dimensional Data Expressions
MODMoving ObjectDatabase
NoSQLNot Only SQL
OLAPOnline Analytical Processing
ORDBMSObject-Relational DBMS
RDDResilientDistributed Dataset
RDFResource Description Framework
RFIDRadio-Frequency Identification
SDBMSSpatial Database Management Systems
SOLAPSpatial OLAP
SPARQLSPARQL Protocol and RDF Query Language
SQLStands for Structured Query Language
STrDWSemantic Trajectory Data Warehouse
TD-TRTop-Down Time-Ratio
TDWTrajectory DataWarehouses
VGIVolunteered Geographic Information

References

  1. Zheng, Y. Trajectory Data Mining: An Overview. ACM Trans. Intell. Syst. Technol. 2015, 6, 29. [Google Scholar] [CrossRef]
  2. Vaisman, A.; Zimányi, E. Conceptual Data Warehouse Design. In Data Warehouse Systems; Springer: Berlin, Germany, 2014; pp. 89–119. [Google Scholar]
  3. Bogorny, V.; Renso, C.; de Aquino, A.R.; de Lucca Siqueira, F.; Alvares, L.O. Constant—A Conceptual Data Model for Semantic Trajectories of Moving Objects. Trans. GIS 2014, 18, 66–88. [Google Scholar] [CrossRef]
  4. Kolovson, C.P.; Neimat, M.A.; Potamianos, S. Interoperability of Spatial and Attribute Data Managers: A Case Study; Springer: Berlin, Germany, 1993; Volume 692, pp. 239–263. [Google Scholar]
  5. Xu, J.; Güting, R.H. A Generic Data Model for Moving Objects. GeoInformatica 2013, 17, 125–172. [Google Scholar] [CrossRef]
  6. Jin, X.; Wah, B.W.; Cheng, X.; Wang, Y. Significance and Challenges of Big Data Research. Big Data Res. 2015, 2, 59–64. [Google Scholar] [CrossRef]
  7. Ge, M.; Bangui, H.; Buhnova, B. Big Data for Internet of Things: A Survey. Future Gener. Comput. Syst. 2018, 87, 601–614. [Google Scholar] [CrossRef]
  8. Shekhar, S.; Gunturi, V.; Evans, M.R.; Yang, K. Spatial Big-Data Challenges Intersecting Mobility and Cloud Computing. In Proceedings of the Eleventh ACM International Workshop on Data Engineering for Wireless and Mobile Access, Scottsdale, AZ, USA, 20 May 2012; pp. 1–6. [Google Scholar]
  9. Bédard, Y.; Rivest, S.; Proulx, M.J. Spatial Online Analytical Processing (SOLAP): Concepts, Architectures, and Solutions from a Geomatics Engineering Perspective. In Data Warehouses and OLAP: Concepts, Architectures and Solutions; IGI Global: Pittsburgh, PA, USA, 2007; pp. 298–319. [Google Scholar]
  10. Parent, C.; Spaccapietra, S.; Renso, C.; Andrienko, G.; Andrienko, N.; Bogorny, V.; Damiani, M.L.; Gkoulalas-Divanis, A.; Macedo, J.; Pelekis, N.; et al. Semantic Trajectories Modeling and Analysis. ACM Comput. Surv. 2013, 45, 42. [Google Scholar] [CrossRef]
  11. Kong, X.; Li, M.; Ma, K.; Tian, K.; Wang, M.; Ning, Z.; Xia, F. Big Trajectory Data: A Survey of Applications and Services. IEEE Access 2018, 6, 58295–58306. [Google Scholar] [CrossRef]
  12. Bian, J.; Tian, D.; Tang, Y.; Tao, D. A Survey on Trajectory Clustering Analysis. arXiv 2018, arXiv:1802.06971. [Google Scholar]
  13. Feng, Z.; Zhu, Y. A Survey on Trajectory Data Mining: Techniques and Applications. IEEE Access 2016, 4, 2056–2067. [Google Scholar] [CrossRef]
  14. Alsahfi, T.; Almotairi, M.; Elmasri, R. A Survey on Trajectory Data Warehouse. Spat. Inf. Res. 2019, 28, 1–14. [Google Scholar] [CrossRef] [Green Version]
  15. Fileto, R.; Raffaetà, A.; Roncato, A.; Sacenti, J.A.; May, C.; Klein, D. A Semantic Model for Movement Data Warehouses. In Proceedings of the 17th International Workshop on Data Warehousing and OLAP, Shanghai, China, November 2014; pp. 47–56. [Google Scholar]
  16. Nardini, F.M.; Orlando, S.; Perego, R.; Raffaetà, A.; Renso, C.; Silvestri, C. Analysing Trajectories of Mobile Users: From Data Warehouses to Recommender Systems. In A Comprehensive Guide Through the Italian Database Research Over the Last 25 Years; Springer: Berlin, Germany, 2018; pp. 407–421. [Google Scholar]
  17. Andrienko, N.V.; Andrienko, G.L. Visual Analytics of Movement: A Rich Palette of Techniques to Enable Understanding 2013. Available online: https://www.cambridge.org/core/books/mobility-data/visual-analytics-of-movement-a-rich-palette-of-techniques-to-enable-understanding/D8CF79BD836291437ED501B4965498B8 (accessed on 31 January 2020).
  18. Etemad, M.; Júnior, A.S.; Hoseyni, A.; Rose, J.; Matwin, S. A Trajectory Segmentation Algorithm Based on Interpolation-based Change Detection Strategies. EDBT/ICDT Workshops. 2019. Available online: http://ceur-ws.org/Vol-2322/BMDA_4.pdf (accessed on 31 January 2020).
  19. Soares Júnior, A.; Moreno, B.N.; Times, V.C.; Matwin, S.; Cabral, L.d.A.F. GRASP-UTS: An Algorithm for Unsupervised Trajectory Segmentation. Int. J. Geogr. Inf. Sci. 2015, 29, 46–68. [Google Scholar] [CrossRef]
  20. Junior, A.S.; Times, V.C.; Renso, C.; Matwin, S.; Cabral, L.A. A Semi-Supervised Approach for the Semantic Segmentation of Trajectories. In Proceedings of the 2018 19th IEEE International Conference on Mobile Data Management (MDM), Aalborg, Denmark, 28 June 2018; pp. 145–154. [Google Scholar]
  21. Goodchild, M.F. Citizens as Sensors: The World of Volunteered Geography. GeoJournal 2007, 69, 211–221. [Google Scholar] [CrossRef] [Green Version]
  22. Granell, C.; Schade, S.; Hobona, G. Linked Data: Connecting Spatial Data Infrastructures and Volunteered Geographic Information. In Geospatial Web Services: Advances in Information Interoperability; IGI Global: Pittsburgh, PA, USA, 2011; pp. 189–226. [Google Scholar]
  23. Renso, C.; Spaccapietra, S.; Zimányi, E. Mobility Data; Cambridge University Press: Cambridge, MA, USA, 2013. [Google Scholar]
  24. Zheng, Y.; Xie, X. Learning Location Correlation from GPS Trajectories. In Proceedings of the 2010 Eleventh International Conference on Mobile Data Management, Kansas City, MO, USA, 21 June 2010. [Google Scholar]
  25. Krumm, J.; Horvitz, E. Predestination: Inferring Destinations from Partial Trajectories; Springer: Berlin, Germany, 2006; pp. 243–260. [Google Scholar]
  26. Yan, Z.; Chakraborty, D.; Parent, C.; Spaccapietra, S.; Aberer, K. SeMiTri: A Framework for Semantic Annotation of Heterogeneous Trajectories. In Proceedings of the 14th International Conference on Extending Database Technology, Uppsala, Sweden, 21 March 2011; pp. 259–270. [Google Scholar]
  27. Spaccapietra, S.; Parent, C.; Damiani, M.L.; de Macedo, J.A.; Porto, F.; Vangenot, C. A conceptual View on Trajectories. Data Knowl. Eng. 2008, 65, 126–146. [Google Scholar] [CrossRef] [Green Version]
  28. Spaccapietra, S.; Parent, C. Adding Meaning to Your Steps; Springer: Berlin, Germany, 2011; pp. 13–31. [Google Scholar]
  29. Laube, P. The Low Hanging Fruit is Gone: Achievements and Challenges of Computational Movement Analysis. SIGSPATIAL Spec. 2015, 7, 3–10. [Google Scholar] [CrossRef]
  30. Nabo, R.G.; Fileto, R.; Nanni, M.; Renso, C. Annotating Trajectories by Fusing them with Social Media Users Posts. In Proceedings of the XV Brazilian Symposium on Geoinformatics (GeoInfo), Campos do Jordão, Brazil, 29 November 2014; pp. 25–36. [Google Scholar]
  31. Wagner, R.; de Macedo, J.A.F.; Raffaetà, A.; Renso, C.; Roncato, A.; Trasarti, R. Mob-Warehouse: A Semantic Approach for Mobility Analysis with a Trajectory Data Warehouse; Springer: Berlin, Germany, 2013; pp. 127–136. [Google Scholar]
  32. Fileto, R.; May, C.; Renso, C.; Pelekis, N.; Klein, D.; Theodoridis, Y. The Baquara2 Knowledge-Based Framework for Semantic Enrichment and Analysis of Movement Data. Data Knowl. Eng. 2015, 98, 104–122. [Google Scholar] [CrossRef]
  33. Mello, R.d.S.; Bogorny, V.; Alvares, L.O.; Santana, L.H.Z.; Ferrero, C.A.; Frozza, A.A.; Schreiner, G.A.; Renso, C. MASTER: A Multiple Aspect View on Trajectories. Trans. GIS 2019, 23, 805–822. [Google Scholar] [CrossRef] [Green Version]
  34. Malinowski, E.; Zimanyi, E. Advanced Data Warehouse Design—From Conventional to Spatial and Temporal Applications; Data-Centric Systems and Applications; Springer: Berlin, Germany, 2008. [Google Scholar] [CrossRef]
  35. Abelló, A.; Romero, O.; Pedersen, T.B.; Berlanga, R.; Nebot, V.; Aramburu, M.J.; Simitsis, A. Using semantic web technologies for exploratory OLAP: A survey. IEEE Trans. Knowl. Data Eng. 2014, 27, 571–588. [Google Scholar] [CrossRef] [Green Version]
  36. Braz, F.J.; Orlando, S. Trajectory Data Warehouses: Proposal of Design and Application to Exploit Data. GeoInfo 2007, 9, 61–72. [Google Scholar]
  37. Orlando, S.; Orsini, R.; Raffaetà, A.; Roncato, A.; Silvestri, C. Trajectory Data Warehouses: Design and Implementation Issues. J. Comput. Sci. Eng. 2007, 1, 211–232. [Google Scholar] [CrossRef] [Green Version]
  38. Marketos, G.; Frentzos, E.; Ntoutsi, I.; Pelekis, N.; Raffaetà, A.; Theodoridis, Y. Building Real-World Trajectory Warehouses. In Proceedings of the Seventh ACM International Workshop on Data Engineering for Wireless and Mobile Access, Vancouver, BC, Canada, 13 June 2008; pp. 8–15. [Google Scholar]
  39. Leonardi, L.; Marketos, G.; Frentzos, E.; Giatrakos, N.; Orlando, S.; Pelekis, N.; Raffaetà, A.; Roncato, A.; Silvestri, C.; Theodoridis, Y. T-warehouse: Visual Olap Analysis on Trajectory Data. In Proceedings of the 2010 IEEE 26th International Conference on Data Engineering (ICDE 2010), Long Beach, CA, USA; 2010; pp. 1141–1144. [Google Scholar]
  40. Leonardi, L.; Orlando, S.; Raffaetà, A.; Roncato, A.; Silvestri, C.; Andrienko, G.; Andrienko, N. A General Framework for Trajectory Data Warehousing and Visual OLAP. GeoInformatica 2014, 18, 273–312. [Google Scholar] [CrossRef]
  41. Silva, M.C.T.; Times, V.C.; de Macêdo, J.A.; Renso, C. SWOT: A Conceptual Data Warehouse Model for Semantic Trajectories. In Proceedings of the ACM Eighteenth International Workshop on Data Warehousing and OLAP, Melbourne, VIC, Australia, 19 October 2015; pp. 11–14. [Google Scholar]
  42. Bao, J.; Li, R.; Yi, X.; Zheng, Y. Managing Massive Trajectories on the Cloud. In Proceedings of the 24th ACM SIGSPATIAL International Conference on Advances in Geographic Information Systems, Burlingame, CA, USA, October 2016; p. 41. [Google Scholar]
  43. Galić, Z. Spatio-Temporal Data Streams and Big Data Paradigm. In Spatio-Temporal Data Streams; Springer: Barlin, Germany, 2016; pp. 47–69. [Google Scholar]
  44. Manaa, M.; Akaichi, J. Ontology-Based Trajectory Data Warehouse Conceptual Model; Springer: Berlin, Germany, 2016; pp. 329–342. [Google Scholar]
  45. Soares Júnior, A.; Renso, C.; Matwin, S. ANALYTiC: An Active Learning System for Trajectory Classification. IEEE Comput. Graph. Appl. 2017, 37, 28–39. [Google Scholar] [CrossRef]
  46. Zhang, Z.; Jin, C.; Mao, J.; Yang, X.; Zhou, A. Trajspark: A Scalable and Efficient in-memory Management System for Big Trajectory Data; Springer: Berlin, Germany, 2017; pp. 11–26. [Google Scholar]
  47. Alarabi, L.; Mokbel, M.F.; Musleh, M. St-hadoop: A Mapreduce Framework for Spatio-Temporal Data. GeoInformatica 2018, 22, 785–813. [Google Scholar] [CrossRef]
  48. Dividino, R.; Soares, A.; Matwin, S.; Isenor, A.W.; Webb, S.; Brousseau, M. Semantic Integration of Real-Time Heterogeneous Data Streams for Ocean-Related Decision Making. Big Data Artif. Intell. Mil. Decis. Mak. STO 2018. [Google Scholar] [CrossRef]
  49. Nikitopoulos, P.; Vlachou, A.; Doulkeridis, C.; Vouros, G.A. DiStRDF: Distributed Spatio-temporal RDF Queries on Spark. In Proceedings of the EDBT/ICDT Workshops, Vienna, Austria, 26 March 2018; pp. 125–132. [Google Scholar]
  50. Soares, A.; Rose, J.; Etemad, M.; Renso, C.; Matwin, S. VISTA: A Visual Analytics Platform for Semantic Annotation of Trajectories. In Proceedings of the 22nd International Conference on Extending Database Technology (EDBT), Lisbon, Portugal, 26 March 2019; pp. 570–573. [Google Scholar]
  51. Georgiou, H.; Karagiorgou, S.; Kontoulis, Y.; Pelekis, N.; Petrou, P.; Scarlatti, D.; Theodoridis, Y. Moving Objects Analytics: Survey on Future Location & Trajectory Prediction Methods. arXiv 2018, arXiv:1807.04639. [Google Scholar]
  52. Zheng, Y.; Zhou, X. Computing with Spatial Trajectories; Springer Science & Business Media: Berlin, Germany, 2011. [Google Scholar]
  53. Meratnia, N.; Rolf, A. Spatiotemporal Compression Techniques for Moving Point Objects; Springer: Berlin, Germany, 2004; pp. 765–782. [Google Scholar]
  54. Potamias, M.; Patroumpas, K.; Sellis, T. Sampling trajectory streams with spatiotemporal criteria. In Proceedings of the 18th International Conference on Scientific and Statistical Database Management (SSDBM’06), Vienna, Austria, 3–5 July 2006; pp. 275–284. [Google Scholar]
  55. Lee, J.G.; Kang, M. Geospatial Big Data: Challenges and Opportunities. Big Data Res. 2015, 2, 74–81. [Google Scholar] [CrossRef]
  56. Burrough, P.A.; McDonnell, R.; McDonnell, R.A.; Lloyd, C.D. Principles of Geographical Information Systems; Oxford University Press: Oxford, UK, 2015. [Google Scholar]
  57. Smith, T.R.; Menon, S.; Star, J.L.; Estes, J.E. Requirements and Principles for the Implementation and Construction of Large-Scale Geographic Information Systems. Int. J. Geogr. Inf. Syst. 1987, 1, 13–31. [Google Scholar] [CrossRef]
  58. Galić, Z.; Mešković, E.; Osmanović, D. Distributed Processing of Big Mobility Data as Spatio-Temporal Data Streams. Geoinformatica 2017, 21, 263–291. [Google Scholar] [CrossRef]
  59. Franklin, M.; Halevy, A.; Maier, D. From Databases to Dataspaces: A New Abstraction for Information Management. ACM Sigmod Rec. 2005, 34, 27–33. [Google Scholar] [CrossRef]
  60. Franklin, M.; Halevy, A.; Maier, D. A First, Tutorial on Dataspaces. Proc. VLDB Endow. 2008, 1, 1516–1517. [Google Scholar] [CrossRef]
  61. Halevy, A.; Franklin, M.; Maier, D. Principles of Dataspace Systems. In Proceedings of the Twenty-fifth ACM SIGMOD-SIGACT-SIGART Symposium on Principles of Database Systems, Chicago, IL, USA, 27 June 2006; pp. 1–9. [Google Scholar]
  62. International Organization for Standardization. ISO 19108 Geographic Information—Temporal Schema; ISO/TC 211, I; International Organization for Standardization: Geneva, Switzerland, 2002. [Google Scholar]
  63. International Organization for Standardization. ISO 19107 Geographic Information—Spatial Schema; ISO/TC 211, I; International Organization for Standardization: Geneva, Switzerland, 2003. [Google Scholar]
  64. Carbone, P.; Katsifodimos, A.; Ewen, S.; Markl, V.; Haridi, S.; Tzoumas, K. Apache flink: Stream and Batch Processing in a Single Engine. Bull. IEEE Comput. Soc. Tech. Comm. Data Eng. 2015, 36, 28–38. [Google Scholar]
  65. Marz, N.; Warren, J. Big Data: Principles and Best Practices of Scalable Real-Time Data Systems; Manning Publications Co.: New York, NY, USA, 2015; p. 328. [Google Scholar]
  66. Lenka, R.K.; Barik, R.K.; Gupta, N.; Ali, S.M.; Rath, A.; Dubey, H. Comparative Analysis of SpatialHadoop and GeoSpark for Geospatial Big Data Analytics. In Proceedings of the 2016 2nd International Conference on Contemporary Computing and Informatics (IC3I), Greater Noida, India, 14–17 December 2016; pp. 484–488. [Google Scholar]
  67. Marcu, O.C.; Costan, A.; Antoniu, G.; Pérez-Hernández, M.S. Spark Versus Flink: Understanding Performance in Big Data Analytics Frameworks. In Proceedings of the 2016 IEEE International Conference on Cluster Computing (CLUSTER), Beijing, China, 24–28 September 2012; pp. 433–442. [Google Scholar]
  68. Pelekis, N.; Theodoridis, Y.; Vosinakis, S.; Panayiotopoulos, T. Hermes—A Framework for Location-Based Data Management; Springer: Berlin, Germany, 2006; pp. 1130–1134. [Google Scholar]
  69. Santana, L.H.Z.; dos Santos Mello, R. Workload-Aware RDF Partitioning and SPARQL Query Caching for Massive RDF Graphs Stored in NoSQL Databases. SBBD 2017, 32, 184–195. [Google Scholar]
  70. Sorce, S.; Malizia, A.; Jiang, P.; Atherton, M.; Harrison, D. A Novel Visual Interface to Foster Innovation in Mechanical Engineering and Protect from Patent Infringement. J. Phys. 2018, 1004, 012024. [Google Scholar] [CrossRef]
  71. Newson, P.; Krumm, J. Hidden Markov Map Matching through Noise and Sparseness. In Proceedings of the 17th ACM SIGSPATIAL International Conference on Advances in Geographic Information Systems, Seattle, WA, USA, November 2009; pp. 336–343. [Google Scholar]
  72. Giannotti, F.; Pedreschi, D. Mobility, Data Mining and Privacy: Geographic Knowledge Discovery; Springer Science & Business Media: Berlin, Germany, 2008. [Google Scholar]
  73. Giannotti, F.; Nanni, M.; Pedreschi, D.; Renso, C. GeoPKDD Geographic Privacy-aware Knowledge Discovery 2009. Available online: https://pdfs.semanticscholar.org/f6c8/d0b66289c78b62e7877cbf60f1f09f1ba72e.pdf (accessed on 31 January 2020).
  74. Luján-Mora, S.; Trujillo, J. A Comprehensive Method for Data Warehouse Design. In Proceedings of the 5th International Workshop on Design and Management of Data Warehouses, DMDW’03, Berlin, Germany, 8 September 2003. [Google Scholar]
  75. Sheth, A.P.; Larson, J.A. Federated Database Systems for Managing Distributed, Heterogeneous, and Autonomous Databases. ACM Comput. Surv. (CSUR) 1990, 22, 183–236. [Google Scholar] [CrossRef]
  76. Rigaux, P.; Scholl, M.; Voisard, A. Spatial Databases: With Application to GIS; Elsevier: Amsterdam, The Netherlands, 2001. [Google Scholar]
  77. Ponniah, P. Data Warehousing Fundamentals for IT Professionals; John Wiley & Sons: Hoboken, NJ, USA, 2010. [Google Scholar]
  78. Gómez, L.; Kuijpers, B.; Moelans, B.; Vaisman, A. A State-of-the-art in Spatio-Temporal Data Warehousing, OLAP and Mining. In Data Mining: Concepts, Methodologies, Tools, and Applications; IGI Global: Pittsburgh, PA, USA, 2013; pp. 2021–2056. [Google Scholar]
  79. Brakatsoulas, S.; Pfoser, D.; Salas, R.; Wenk, C. On Map-Matching Vehicle Tracking Data. In Proceedings of the 31st International Conference on Very Large Data Bases, VLDB Endowment, Trondheim Norway, August 2005; pp. 853–864. [Google Scholar]
  80. Ibragimov, D.; Hose, K.; Pedersen, T.B.; Zimányi, E. Towards Exploratory OLAP over Linked Open Data—A Case Study. In Enabling Real-Time Business Intelligence; Springer: Berlin, Germany, 2014; pp. 114–132. [Google Scholar]
  81. Etcheverry, L.; Vaisman, A.A. QB4OLAP: A New Vocabulary for OLAP Cubes on the Semantic Web. In Proceedings of the Third International Conference on Consuming Linked Data, Boston, MA, USA, 12 November 2012; Volume 905, pp. 27–38. [Google Scholar]
  82. Siow, E.; Tiropanis, T.; Hall, W. Analytics for the Internet of Things: A survey. ACM Comput. Surv. 2018, 51, 74. [Google Scholar] [CrossRef] [Green Version]
  83. Leite, D.F.B.; de Souza Baptista, C.; de Oliveira, M.G.; Acioli Filho, J.A.M.; da Silva, T.E. ExpOLAP: Towards Exploratory OLAP. In Proceedings of the 2016 IEEE/ACS 13th International Conference of Computer Systems and Applications (AICCSA), Agadir, Morocco, 2 December 2016; pp. 1–8. [Google Scholar]
  84. Rivest, S.; Bédard, Y.; Proulx, M.J.; Nadeau, M. SOLAP: A New Type of User Interface to Support Spatio-Temporal Multi-dimensional Data Exploration and Analysis. In Proceedings of the ISPRS Joint Workshop on Spatial, Temporal and Multi-Dimensional Data Modelling and Analysis, Quebec, QC, Canada, October 2003; pp. 2–3. [Google Scholar]
  85. Leite, D.F.B.; Baptista, C.D.S.; Amorim, B.D.S.P. An exploratory SOLAP tool for linked open data. Int. J. Bus. Inf. Syst. 2019, 31, 391–413. [Google Scholar] [CrossRef]
  86. Furtado, A.S.; Pilla, L.L.; Bogorny, V. A Branch and Bound Strategy for Fast Trajectory Similarity Measuring. Data Knowl. Eng. 2018, 115, 16–31. [Google Scholar] [CrossRef]
  87. Keskin, S.; Yazici, A. Modelling and Designing Spatial and Temporal Big Data for Analytics; Springer: Berlin, Germany, 2018; pp. 104–112. [Google Scholar]
  88. Kong, X.; Song, X.; Xia, F.; Guo, H.; Wang, J.; Tolba, A. LoTAD: Long-Term Traffic Anomaly Detection Based on Crowdsourced Bus Trajectory Data. World Wide Web 2018, 21, 825–847. [Google Scholar] [CrossRef]
  89. Andrienko, N.; Andrienko, G.; Fuchs, G.; Jankowski, P. Visual Analytics Methodology for Scalable and Privacy-Respectful Discovery of Place Semantics from Episodic Mobility Data; Springer: Berlin, Germany, 2015; pp. 254–258. [Google Scholar]
  90. Kong, L.; He, L.; Liu, X.Y.; Gu, Y.; Wu, M.Y.; Liu, X. Privacy-Preserving Compressive Sensing for Crowdsensing Based Trajectory Recovery. In Proceedings of the 2015 IEEE 35th International Conference on Distributed Computing Systems, Columbus, OH, USA, 29 June 2015; pp. 31–40. [Google Scholar]
Figure 1. Level of semantic enrichment.
Ijgi 09 00088 g001
Figure 2. Elements and data flow in a trajectory DW.
Ijgi 09 00088 g002
Figure 3. Example of a cell-based TDW snowflake scheme.
Ijgi 09 00088 g003
Figure 4. Example of a segment-based TDW scheme.
Ijgi 09 00088 g004
Figure 5. A multi-dimensional semantic scheme model (adapted from [31]).
Ijgi 09 00088 g005
Figure 6. Ship traffic cell map.
Ijgi 09 00088 g006
Table 1. A summary of the works evaluated in this survey.
AuthorsYearTitle of WorkCategory of EvaluationKey Findings
Braz [36]2007Trajectory Data Warehouses: Proposal of Design and Application to Exploit DataD | AAn application to store and compute the pre-aggregation values and to present final results about the trajectories
Orlando et al. [37]2007Trajectory Data Warehouses: Design and Implementation IssuesDChallenges issues in design of a Trajectory Data Warehouse
Marketos et al. [38]2008Building Real-World Trajectory WarehousesI | D | AThe steps for building a TDW
Leonardi et al. [39]2010T-warehouse: Visual OLAP Analysis on Trajectory DataI | D | AVisual OLAP analytics
Yan et al. [26]2011SeMiTri: A Framework for Semantic Annotation of Heterogeneous TrajectoriesI | D | ASemantic trajectory annotation
Wagner et al. [31]2013Mob-Warehouse: A Semantic Approach for Mobility Analysis with a Trajectory Data WarehouseDA Trajectory Data Warehouse model to answer the classical Why, Who, When, Where, What, How questions
Bogorny et al. [3]2014CONSTAnT—A Conceptual Data Model for Semantic Trajectories of Moving ObjectsIA semantic trajectory conceptual data model
Fileto et al. [15]2014A Semantic Model for Movement Data WarehousesDMulti-dimensional model for movement segments, movement patterns, their categories and hierarchies
Leonardi et al. [40]2014A General Framework for Trajectory Data Warehousing and Visual OLAPD | AA formal framework for modelling a trajectory data warehouse
Fileto et al. [32]2015The Baquara2 Knowledge-Based Framework for Semantic Enrichment and Analysis of Movement DataDA framework to semantically enrich and analyze movement data
Silva et al. [41]2015SWOT: A Conceptual Data Warehouse Model for Semantic TrajectoriesDA conceptual TDW model for answering semantic enriched mobility queries
Bao et al. [42]2016Managing Massive Trajectories on the CloudITrajectory data management
Galić [43]2016Spatio-Temporal Data Streams and Big Data ParadigmIReal-Time parallel processing
Manaa & Akaichi [44]2016Ontology-Based Trajectory Data Warehouse Conceptual ModelDA trajectory data warehouse conceptual model based on ontology
Soares et al. [45]2017ANALYTiC: An Active Learning System for Trajectory ClassificationISemantic enrichment of movement data
Zhang et al. [46]2017Trajspark: A Scalable and Efficient in-memory Management System for Big Trajectory DataIBig trajectory data support
Alarabi et al. [47]2018St-hadoop: A Mapreduce Framework for spatio-temporal dataIMapReduce-Based systems
Dividino et al. [48]2018Semantic Integration of Real-Time Heterogeneous Data Streams for Ocean-Related Decision MakingIData streaming integration for real-time maritime situation
Nikitopoulos et al. [49]2018DiStRDF: Distributed Spatio-temporal RDF Queries on SparkIProcessing SPARQL spatio-temporal queries in parallel Spark framework
Alsah et al. [14]2019A Survey on Trajectory Data WarehouseI | D | AA framework that aims to provide the requirements for building a TDW
Soares et al. [50]2019VISTA: A Visual Analytics Platform for Semantic Annotation of TrajectoriesITrajectory annotation
Mello et al. [33]2019MASTER: A Multiple Aspect View on TrajectoriesIConceptual and logical data model for multiple aspect trajectory
Note: I—Integration, D—Design, A—Analytics.
Table 2. Trajectory systems classification.
ReferenceYear of PublicationGeometric RepresentationManagement Platforms or Storage
VectorGraphs
Leonardi et al. [39]2010 Hermes
Yan et al. [26]2011 PostgreSQL+postgis 
Bao et al. [42]2016Azure and Redi
Galić [43]2016 Flink
Soares et al. [45]2017 Solr
Zhang et al. [46]2017 Spark
Alarabi et al. [47]2018 Hadoop+HDFS
Dividino et al. [48]2018 Apache Jena 
Nikitopoulos et al. [49]2018 Spark+Redis 
Soares et al. [50]2019 MongoDB
Mello et al. [33]2019 Rendezvous
Table 3. Projects that deal with semantic data and the 5W1H model.
ReferenceSemantic Data5W1HSemantic Annotation
WhoWhatWhenWhereWhyHowPointSegTraj
Yan et al. [26]
Bao et al. [42]
Galić [43]
Soares et al. [45]
Zhang et al. [46]
Alarabi et al. [47]
Dividino et al. [48]
Nikitopoulos et al. [49]
Soares et al. [50]
Bogorny et al. [3]
Mello et al. [33]
Table 4. TDW design type.
ReferenceYearDesign Type
CellSegment
Orlando et al. [37]2007
Marketos et al. [38]2008
Leonardi et al. [39]2010
Wagner et al. [31]2013
Leonardi et al. [40]2014
Fileto et al. [15]2014
Fileto et al. [32]2015
Silva et al. [41]2015
Manaa and Akaichi [44]2016
Braz [36]2007
Alsah et al. [14]2019
Table 5. Type of trajectory projects and the 5W1H model.
ReferenceType5W1H
WhoWhatWhenWhereWhyHow
Fileto et al. [32]Conceptual model
Silva et al. [41]Conceptual model
Wagner et al. [31]Conceptual model
Manaa & Akaichi [44]Conceptual model
Leonardi et al. [40]Conceptual model and implementation
Fileto et al. [15]Conceptual model
Alsah et al. [14]Conceptual model

