Abstract
Data on the extension of urban areas are important for analyzing growth dynamics and to support the planning of transport and service provision. Satellite-based remote sensing has proven extremely useful, especially in cities that experience fast spatial growth. Different approaches to satellite-based mapping may, however, produce different results concerning urban categorization and delineation, often making direct comparison misleading. This study analyses four different satellite-based studies of urban land cover in Accra, Ghana and presents a new land cover map based on visual interpretation of segmented Sentinel-2 imagery. The methods and results, as well as the underlying definition of “urban”, are compared and discussed. One method identifies exclusively areas with man-made, impervious surfaces, such as roads and buildings, as proxies for urban extent. Other methods aim to identify a broader set of land cover types, including green spaces, which are treated as part of the mixed urban fabric. Further differences are found in the way urban fringe areas under development are classified depending on their degree of urbanization, and in the distance threshold values used for defining the urban agglomeration. For the most recent maps we identify a difference in the measured size of the Accra agglomeration of almost 100%.
1. Introduction
Accra, like many other cities in Sub-Saharan Africa (SSA), has experienced very rapid urban growth in terms of both area and population during the last twenty to thirty years. For this study, urban growth is defined as the conversion of rural areas characterized by agricultural land use or natural land cover into areas characterized by residential, commercial or other types of urban land use. For the Accra area, urban growth is mainly characterized by sprawling, low-density development, and the speed of development seems to exceed the capacity for efficient urban planning and for the timely provision of service and transport infrastructure [1,2,3,4,5,6]. Thus, individual housing development typically takes place before infrastructure and service provision are implemented [7]. Although urbanization processes can be identified, in the sense that land cover is gradually converted from the purely rural to a new fabric of residential and commercial use, many urbanizing areas at the urban fringe remain in a state of transition for a long time. Individual builders typically erect houses gradually over several years when funds are available, as mortgage schemes are less prevalent. Many of these large, newly urbanized areas of Accra develop into urban ‘deserts’ characterized for long periods by very little service provision, low accessibility, proneness to seasonal floods etc., thereby restricting their residents’ livelihood options [8]. The visual landscape of these new urban areas is often dominated for several years by a high percentage of plots with natural vegetation or exposed surfaces between half-finished brick walls [5,9,10].
Improved knowledge and understanding of the dynamics of urban expansion is particularly important in SSA cities like Accra due to the recent unprecedented levels of spatial growth. Nonetheless delineation of Accra’s urban boundaries remains challenging due to the sprawling and gradual nature of its development, as well as the size of the area that is currently urban or urbanizing. Maps of the extent of urban areas are important for the analysis of growth dynamics, but they also support the spatial planning of transport infrastructure and service provision [11,12,13]. With currently no official map production in place, satellite-based mapping methods have proved unrivaled in providing indications of urban spatial expansion at relatively short time intervals for more than three decades. During this period, increasingly detailed images have been made available, though often at a considerably higher cost per square kilometer. Simultaneously, new methods of classification have been developed and applied. Direct comparison between maps will, however, often be problematic, and satellite-based approaches may therefore be unable to provide clear answers to seemingly simple questions like “How big is the urban area?” and “Is the rate of rural-urban conversion increasing or decreasing?”
Currently, a number of studies have presented city-wide land-cover maps of Accra based on medium- and high-resolution images (see [14,15,16,17,18] for recent examples). So far only a few studies have analyzed the challenges of comparing the maps resulting from different remote sensing-based studies. Among these are [19] and [20], who focus on global datasets of urban areas based on medium-resolution data. In particular, the latter study identifies a low degree of inter-map agreement for six global urban maps and two urban-related maps, concluding that their estimates of the total extent of urban land may differ by as much as an order of magnitude.
The aim of the current study is to analyze nine satellite-derived maps of Accra’s urban extension from 1985 to 2017 including one produced for the study, in order to compare their results, methodology and underlying definitions of the “urban”. The five studies that created the maps differ in their geographical focus, ranging from a global urban-mapping strategy to a strategy rooted in the local conditions of the Accra area. Most of the maps are based entirely on satellite image data, whereas one study also incorporates population data. In general, it can be expected that different studies provide different results for a number of reasons, including for example scale variations. The aim of the current study is, however, to focus primarily on the differences that relate to how the concept of the “urban” is operationalized by the applied methods and the implications this have for comparability with other datasets.
2. Background
2.1. Defining Urban Areas
Although the aim behind all the maps examined here is the provision of up-to-date and accurate information about the extent of urban growth, no globally agreed definition of “the urban” exists. According to the UN, because of national differences in the characteristics that distinguish urban from rural areas, the distinction between urban and rural populations is not yet amenable to a single definition that would be applicable to all countries [21]. The UN further states that, where there are no regional recommendations regarding this matter, countries must establish their own definitions in accordance with their own needs.
Most countries in Western Europe have strict spatio-statistical definitions that guide the mapping of urban areas, including the demarcation of town/city polygons [22]. The core of these definitions is a population and a density threshold. An example is the definition used in Denmark, where an urban area is defined as a “naturally continuous” built-up area with at least two hundred residents. The term “naturally continuous” is explicitly used of areas where the distance between “houses” is less than 200 m in a straight line [23]. It is clear that this approach to delineating urban areas ultimately requires input data in the form of accurate maps of building locations as well as population data disaggregated to the address/building level. Such data are not normally available in SSA countries.
In Ghana, the definition of urban areas is somewhat different. According to the Ghana Statistical Bureau, Ghana has “over the years defined an urban area to include all localities with 5000 or more population”, and national censuses use this definition of urban localities [24]. The official definition of “urban” in Ghana is thus concerned only with population and not with any specific distance or density threshold of either buildings or population. In the case of the city of Accra itself, the population threshold of five thousand was surpassed many years ago, and the delineation of Accra’s “statistical” boundaries therefore mainly seems to be a question of assessing the density of housing or population in an area. Since density is not included in the applied definition of “urban”, the question is how the spatial delineation of urban areas has been handled so far in official statistics and maps. This is not made explicit in any reference text, but it is assumed to be based on visual assessments. It is reasonable to assume further that the recent sprawling urban development in many parts of Ghana, especially in the Accra area, and the resulting blurred boundaries have made the “statistical” boundary between rural and urban areas much more difficult to determine visually compared to what was the case previously.
2.2. Measuring the Extent Of Urban Agglomerations
An urban agglomeration, or city-region, can be defined as the near-continuous urban extension of a large city, such as Accra, that results from the expansion and ultimately merging of several nearby urban settlements. Globally, an urban agglomeration is most often defined on the basis of existing administrative units, for example municipalities. A set of these units is selected to define the extent of the agglomeration with only a broad consideration for the underlying urban structures, and potentially open to political influence. This approach, however, makes it easier to use aggregated statistics in reporting on population dynamics. In the case of Ghana, several spatio-statistical definitions closely related to the administrative structure have been established for the Accra area. These include the Accra Metropolitan District, the Greater Accra Metropolitan Area and the Greater Accra Region, of which the latter includes substantial rural areas. These definitions may serve a number of purposes, but they do not necessarily reflect the status of urban development. Agyemang et al. [16] who provides an extensive account of the recent development of Accra notes that it has evolved into a city-region that, territorially, defies traditional administrative boundaries and identifies a “gap between the rapidly emerging spatial structure of Accra and the operational governance framework”. Similarly, Gaisie et al. [7] notes that recognizing the Accra city-region based on its spatial structure rather than through political boundary delimitations has many advantages for urban planning and management.
Technically, to produce a map of the Accra agglomeration that more precisely delineates the actual extent of the near-continuous urban land cover, it will be necessary to identify a distance threshold value for deciding when to merge two neighboring urban areas into one. The threshold value could be zero to indicate that a full ‘collision’ is required, but a value in the range of 500–1000 m is frequently seen, as further described below. It is worth noting that the growth and subsequent merging of larger urban areas will often result in substantial and sudden jumps in the size and population figures for the agglomeration.
2.3. Satellite-Based Methods
A number of remote sensing-based studies aimed at delineating urban areas have been carried out based on different types of imagery and at different scales. Recently, the appearance of global datasets of urban areas and locations has increased the focus on how the results of different studies may contribute to improving our understanding of ongoing processes of spatial development.
All remote sensing-based studies are limited by the characteristics of the available satellite data. It is normally assumed that accurate delineation of urban areas requires at least medium-resolution images such as Landsat-TM, due to the heterogeneity of the urban scene. High-resolution images provide more detailed information, which is also more complex, expensive and time-consuming to analyze. A wide range of image analysis methods focusing on the urban scene can be deployed, including texture and context-based analysis of local neighborhoods, defined either by segmentation or as fixed-size kernels. Satellite-based classification methods most often rely on identifying proxy variables related to spectral, textural or contextual image information. It is, however, not expected that a clear link can be identified between such proxy variables extracted from a satellite image for classification purposes and a formal, transparent definition of urban areas in the above-described, “traditional” sense, that is, based on population and distances between houses. This is due to the fact that the relation between the proxy variables and the urban land cover class is normally established through the selection of training sites that cover different types of urban land cover. This means that the applied definition of “urban” for each individual study may be specific to, and somewhat “hidden” within, the applied method and strategy for the training site selection. The satellite-derived urban maps become results of feasible, methodological choices rather than the implementation of nationally adopted formal definitions. Based on this realization it can be expected that direct comparisons between the resulting maps of urban areas may be impossible or misleading, since the urban categories may be operationalized differently.
Some studies of urban areas are seen to focus on areas with man-made, impervious surfaces such as roads and buildings as proxies for urban extent. In Liu, Hu [25], the term “urban land” is stated explicitly to refer to “impervious surface”, implying impenetrable “artificial cover” and structures. Other studies aim to identify contiguous urban areas consisting of a variety of land cover types that are considered part of the mixed urban fabric, and may include areas with a rural appearance that have just started the urbanization process. The resulting boundary definition and area values for these two approaches will, of course, be very different. The former group of studies tends to result in many smaller polygons and exclusion of green areas, parks and lakes in urban areas, while the latter group tends to result in fewer and more generalized polygons without many gaps.
Other discrepancies between different studies concern the handling of areas that are undergoing urbanization and the level of completion required for an area to be assigned to the urban category. For the Accra agglomeration, one end of the extreme would be to denote a fringe area as urban only when almost all houses and roads are completed, while the other end of the extreme would be to include an area with only a few scattered houses and foundations, if an emerging ‘dirt’ road pattern indicates that the area is in the initial phase of becoming urban. In the Accra case, this choice is expected to influence the result quite heavily.
As described in the previous section, also differences in the applied distance threshold value for identifying “near-continuous” urban agglomerations may influence the resulting maps and potentially complicate comparisons between different studies further.
In the next section, five different studies of Accra’s urban extent are analyzed and compared. As described previously, there is no official definition of the “urban” in Ghana based on population or housing density that can be used as a formal benchmark. The aim is to focus on the methodological characteristics and, hence, comparability of the resulting maps
3. Materials and Methods
Please refer to Table 1 for a list of the nine maps that are analyzed and the names of the five datasets from where they origin. All datasets have been acquired from their producers, except the VIS dataset which has been prepared for this study. The following sections present the characteristics of each dataset.

Table 1.
List of the nine compared maps with computed agglomeration size for the Accra area and names of the datasets from which they origin. (1) The “threshold for merging” indicates the maximum distance applied for including neighboring urban areas within the agglomeration.
3.1. Landsat TM-Texture (TM)
This dataset is based on an analysis of Landsat-TM data from 1985, 1991 and 2002 [26]. Four maps are presented showing the extent of the urbanized areas of Accra for these three years, as well as the extent of the “area that [was] under conversion to urban use” in 2002.
The classification is based on texture computed from Haralick-style co-occurrence matrices [29]. Six different second-order texture measures were computed separately for the following four moving window sizes (in pixels): 5 × 5, 9 × 9, 15 × 15 and 29 × 29. Based on selected training sites, a standard supervised parallelepiped classification was performed for each urban class and each window size separately. The final classified map was produced by combining the individual maps using a GIS-based weighted overlay function.
The selection criteria for the training sites are stated in general terms: “The training sites were selected in areas with a high proportion of nearly completed houses (‘urban area’) as well as in areas characterized by scattered houses under construction (‘areas under conversion’). The aim was to delineate a fringe zone under transition that cannot be defined as urban yet—but will be within the next few years” [26]. The resulting maps mark out the continuously built-up area, as well as some adjacent urban development.
3.2. Global Urban Footprint (GUF)
This dataset is the result of an effort to generate so-called urban footprint data on a global scale based on Synthetic Aperture Radar (SAR) imagery from the German TanDEM-X mission of 2012 [30]. The methodology comprises pre-processing of the SAR data with a focus on the analysis of local speckle statistics in order to generate a texture layer and highlight highly textured image regions [31]. Along with the original intensity information, the texture layer is subsequently analyzed by means of an automated pixel-based image classification process involving a scene-specific, “speckle divergence” threshold value to produce a cell-based binary mask of built-up areas with twelve-meter spatial resolution and global coverage.
Based on the documentation, it is reasonable to conclude that there is no direct link between the applied automated methodology and a formal definition of the urban. The authors also acknowledge, moreover, that they use the terms “urban” and “built-up” interchangeably [27]. An examination of the method and the resulting data sets indicates that the urban coverage ("footprint") is primarily associated with a high prevalence of man-made structures and surfaces such as roads and buildings acting as proxies for a category of urban land cover. In general, this will identify a smaller urban extent than methods that include a more diverse set of such categories. The approach behind GUF mainly identifies fully built-up sub-areas of Accra and its surroundings and is not directly concerned with delineating the boundaries of the urban agglomeration. For the current study, the total urban area and the boundary lines of the Accra agglomerations have been established by selecting urban cells according to a 500 m distance threshold value as described in Section 3.6.
3.3. Atlas of Urban Expansion (AUE)
The AUE dataset is the result of a major effort to provide comparable data on the spatial growth of two hundred cities around the globe [12]. The vectorized end-products for the years 1991, 2000 and 2014 have been examined for this study. The core of the methodology behind AUE is an initial supervised per-pixel identification of “built-up” pixels, based on thirty meter-resolution Landsat-TM images. This is followed by a further qualification of each urban pixel into “urban”, “suburban” or “rural” depending on the share of built-up pixels within “walking distance", defined as a circle with an area of one square kilometer. Although the general aspects of the method and the underlying considerations are well described, it is not possible to identify a specific population or building density threshold value that defines precisely what is classified as urban. This is due to the nature of the initial classification and the spatial resolution of the data source, which does not permit the identification of individual buildings. With respect to the delimitation of Accra’s city boundaries, it is stated that cities are defined as agglomerations of contiguous built-up areas (and the open spaces in and around them) in AUE. Inspection of the maps indicates that “free-lying” urban polygons with a distance of up to 1000 m from the main polygon are designated as part of the contiguous area of Accra in the AUE dataset.
3.4. Africapolis (AP)
The Africapolis dataset is produced by the Sahel and West Africa Club in collaboration with E-geopolis. It provides data on the estimated populations and spatial extents of a large number of urban locations in West Africa [28]. It is argued in the metadata that the dataset has been produced with a strong emphasis on standardization, currently being the “only comprehensive and standardized geospatial database on cities and urbanization dynamics in Africa”. It is further argued that “the method is [...] comparable, independent of national definitions and verifiable”, but it is also noted that “[d]ata inconsistencies and geographic and historical gaps in census coverage are a reality and remain a constraint in analysing urbanization dynamics in the region” [13,28].
AP seeks to apply both statistical and spatial criteria to the delineation of urban agglomerations: “First, an agglomeration must be a continuously built-up and developed area, with less than 200 m between two buildings. Secondly, an agglomeration is considered urban if it has a minimum of 10,000 agglomerated inhabitants” [28]. A total of 7500 agglomerations are identified on the African continent. With reference to Section 2.1 on defining urban areas, it can be noted that the threshold value of 200 m for spatial continuity is similar to what is found in many West European definitions of urban areas, while the population threshold of 10,000 is relatively high and seems to reflect a wish to distinguish larger towns and cities from smaller “urban areas”. For the spatial threshold value, it is further noted that distances are computed between “buildings and constructions” and that “(b) uildings can be residential, industrial and administrative and can also include infrastructure such as bridges and ports—and even roads” [28]. It is not specified how the building structures are classified or how distances are computed to objects with spatial extensions such as roads. The specific method for detecting these basic structures is not described in detail either, except that a map of urban areas is created based on the study of satellite images or aerial photographs.
Within the AP dataset the population figure for a potential agglomeration is computed by overlaying the map of urban areas with a map of the smallest officially defined local administrative units, which have been informed by national statistics in terms of population number: “By combining demographic sources with satellite and aerial imagery and other cartographic sources, Africapolis can pinpoint population estimates at the level of individual agglomerations” [28]. Whether the obtainable spatial resolution of population data is sufficient to resolve the population criteria for small agglomerations in all countries could probably be debated. It is clear, however, that the Accra agglomeration passed the population threshold of 5000 decades ago, so that only the criterion of spatial continuity (a maximum 200 m between buildings) is relevant.
3.5. Visual Interpretation of Segmented Sentinel-2 Imagery (VIS)
To further facilitate evaluation of the urban maps provided by the above-described datasets, a new dataset has been established (see Figure 1). The main purpose of this dataset is to provide additional data on the recent degree of urbanization in the fringe areas of the Accra agglomeration to qualify the differences between the existing datasets. The new dataset is based on a combination of the automated segmentation of Sentinel-2 images, followed by a visual inspection of both Sentinel-2 and Google Earth (GE) satellite data. Two cloud-free Sentinel-2 images were used to cover the Accra area, one from 25-12-2017 (East), the other from 27-01-2017 (West). The analysis was based on the Sentinel 2B band 2, 3, 4 and 8 at a ten-meter resolution. The multi-resolution segmentation function of the eCognition software was applied with a scale parameter of 225, a shape parameter value of 0.8 and a compactness parameter value of 0.8. For Sentinel 10m these values produce segment boundaries that, based on visual inspection, reflect reasonably well the boundaries between urban areas of different densities and structures, with a low level of over-segmentation. A total of 1006 segments with an average area of 2.2 km2 were identified as relevant for determining the extent of the Accra agglomeration.
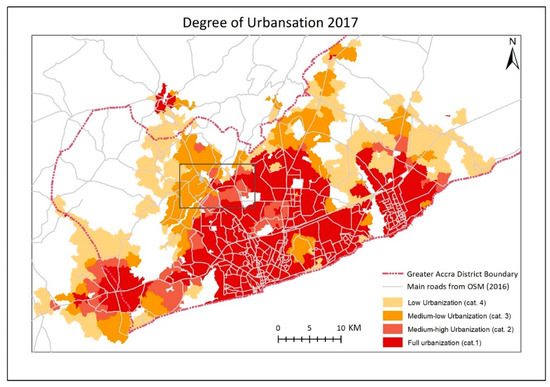
Figure 1.
Urban development within the Accra agglomeration in 2017 based on the automated segmentation of Sentinel-2 images, followed by a visual inspection of Sentinel-2 and Google Earth (GE) satellite data. Box indicates location of detail map in Figure 6.
Image segment boundaries were extracted and superimposed on detailed satellite data in GE for more precise evaluation of the degree of urbanization. Based on visual interpretations of GE data and Sentinel data, each segment was classified into one of five categories: (1) full urbanization (circa 75%–100% urban, (2) medium-high urbanization (circa 50%–75% urban), (3) medium-low urbanization (circa 25%–50% urban), (4) low urbanization (circa 5%–25% urban) and (5) non-urban. Note that the figures do not indicate population densities, nor percentages of impervious surfaces. Rather, they estimate how large a percentage of a given segment is currently covered by the prevailing type of urban development. Thus, for a developing residential area, “medium-low urbanization” means that parcels with completed or almost completed residential houses constitute approximately a quarter to a half of the total area of the segment, “low urbanization” indicates that there are visual clues that the area is in the initial phase of rural-urban conversion based on evidence of new houses and the layout of the roads/paths system. The percentage value indicates the average urbanization value for each segment even in cases where urban development is not homogeneously spread within the segment.
3.6. Data Processing
Three of the five datasets (TM, GUF and VIS) are regional in the sense that they also include free-lying urban areas outside the Accra agglomeration. Two of the five datasets (AUE and AP) aim at defining the agglomeration itself and contains no additional urban areas.
For the regional datasets a central issue is the application of the distance threshold value for deciding whether to formally include a neighboring urban area in the agglomeration or not, as discussed in Section 2.2. A distance threshold value of 500 m has been chosen for the three regional studies as a compromise between the 200 m (between buildings) and 1000 m applied by AP and AUE respectively. The three regional datasets have been analyzed using the ESRI-ArcMap software with the purpose of extracting the specific parts that represent the Accra agglomeration, based on the defined distance threshold value. The distance threshold has been applied by selecting a core urban area within the agglomeration and iteratively selecting and adding all neighboring urban areas within this distance to the core. The iteration stops when no further urban areas are found within the distance. The distance is measured as straight-line distances between the boundaries of each urban polygon. For the GUF dataset which is based on cells, not polygons, the method is similar; the distance is, however measured between the cell boundaries. Finally, for all datasets the ESRI-ArcMap software has been used for calculating the size of the urban agglomeration and for visualization. No modifications of the contents of the existing datasets have been done.
Using the above threshold value of 500 m the TM dataset reports a total agglomeration size (km2) for 1985, 1991 and 2002 (fully urban/under conversion) of 162, 217 and 579/857 respectively (see also Table 1). It can be noted that the calculated total size, including areas under conversion in 2002, increases by 5.3% when an inter-polygon distance threshold of 1000 m is used rather than 500 m. For the GUF dataset, the agglomeration size reported for 2012 is 617 km2. This value increases by only 1% if a distance threshold value of 1000 m is applied instead. The AUE dataset applies a threshold value of 1000 m as described above. The total size of the Accra agglomeration (km2) reported for 1991, 2000 and 2014 are 133, 413 and 873 respectively. This implies average annual growth rates of 13.3% between 1991 and 2000 and of 5.5% between 2000 and 2014. For the AP dataset the specified threshold value of 200 m (between buildings) is maintained for the current study. The available data do not permit any re-calculation. Based on this value, the area of Accra’s urban agglomeration reported by AP for 2015 is 1,197 km2. Finally, for the VIS dataset the total urban area and the boundary lines of Accra’s agglomerations have been established based on all the segments in Categories 1–4. Using the distance threshold value of 500 m, the total size of the agglomeration reported for 2017 is 1340 km2. Each Category (1–4) contributes with the following sub-area figures (km2): 553 (41.3%), 130 (9.7%), 260 (19.4%) and 396 (29.6%).
4. Results and Discussion
All area estimates for the Accra agglomeration that have been computed from the five datasets are shown in Table 1 and Figure 2. The agglomeration maps for the most recent period (2012–2017) are shown in Figure 3, for the middle period (2000–2002) in Figure 4, and for the earliest period (1985) in Figure 5. An example of the mapping of fringe areas by the most recent datasets is presented in Figure 6. When evaluating all agglomeration area estimates for the examined period 1985–2017 via-à-vis each other (Figure 2), it is clear that there are discrepancies between the datasets. For the most recent maps for example we identify a difference in the estimated size of the Accra agglomeration of almost 100% between GUF (2012) and AP (2015) although they are only three years apart.
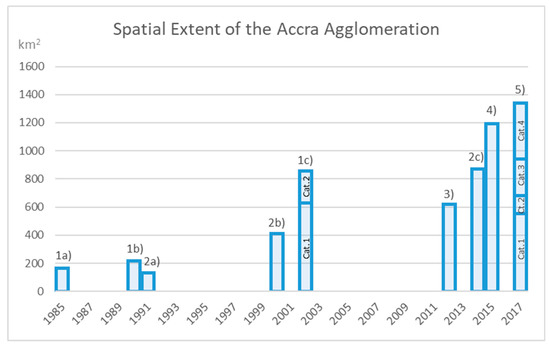
Figure 2.
Area figures for the Accra agglomeration reported by five different studies. (1a), (1b), (1c) Landsat-TM texture [26], 1985 and 1991. (1c) Landsat-TM texture 2002, Category 1: “urbanized areas” and Category 2: “areas under conversion”. (2a), (2b), (2c) Atlas of Urban Expansion [12], 1991, 2000 and 2014. (3) Global Urban Footprint [27], 2012. (4) AfricaPolis [28], 2015. (5) Visual inspection of segments (prepared for this study), 2017. Category 1: “full urbanization”, Category 2: “medium-high urbanization”, Category 3: “medium-low urbanization” and Category 4: “low urbanization”.
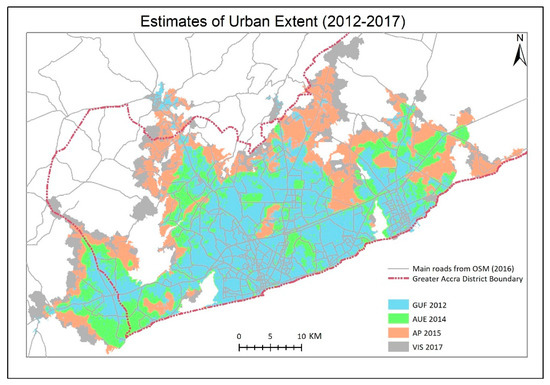
Figure 3.
Estimates of the spatial extent of the Accra agglomeration for the most recent period (2012–2017). Contributing datasets: Global Urban Footprint (GUF), Atlas of Urban Expansion (AUE), AfricaPolis (AP) and Visual inspection of segments (VIS). Road network from OpenStreetMap 2016 (https:/www.openstreetmap.org).
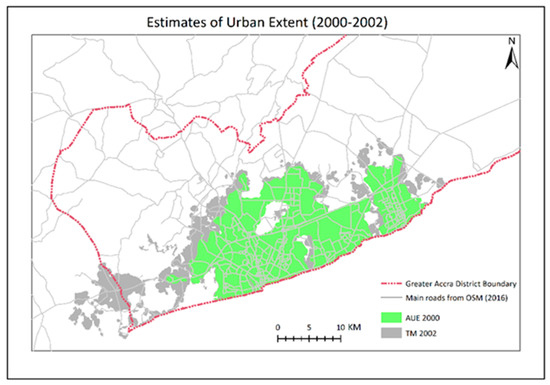
Figure 4.
Estimates of the spatial extent of the Accra agglomeration for the period (2000–2002). Contributing datasets: Atlas of Urban Expansion (AUE) and Landsat-TM texture (TM). Road network from OpenStreetMap 2016 (https:/www.openstreetmap.org).
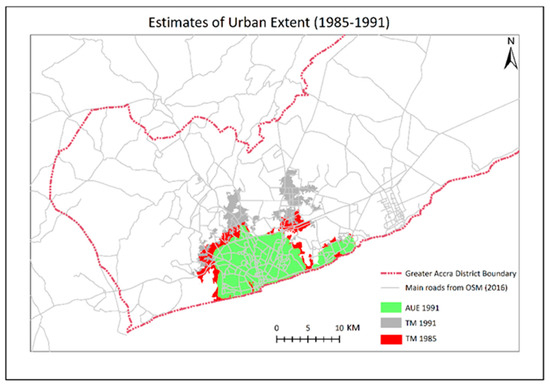
Figure 5.
Estimates of the spatial extent of the Accra agglomeration for the period (1985–1991). Contributing datasets: Atlas of Urban Expansion (AUE) and Landsat-TM texture (TM). Road network from OpenStreetMap 2016 (https:/www.openstreetmap.org).
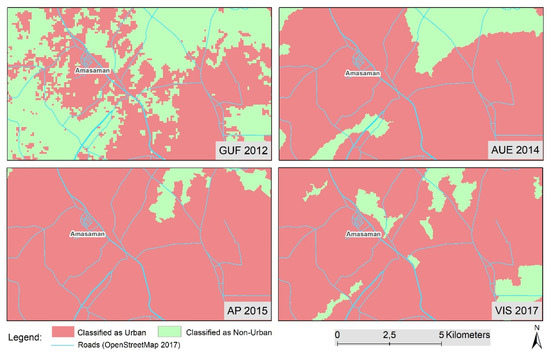
Figure 6.
Example of differences in mapping the same area at the urban fringe by the following datasets: Global Urban Footprint (GUF), Atlas of Urban Expansion (AUE), AfricaPolis (AP) and Visual inspection of segments (VIS—Categories 1–4). The geographical location of the area is indicated in Figure 1.
When examining the fringe area example in Figure 6, it becomes apparent that areas in early stages of conversion to urban use are mapped to a much lesser extent by the GUF dataset than by the datasets with a broader definition of urban, in particular AP. Additionally, the VIS dataset (Categories 1–4) recognizes these emerging urban areas as part of the agglomeration, while the AUE dataset seems to require slightly more urban development for inclusion in the agglomeration, as further discussed in the next section. Since gradual urban development is a predominant phenomenon in Accra, these differences will influence the reported demarcation and total size of the agglomeration quite markedly. The AP dataset seems to merge diverse areas, including areas with a low degree of urban development and green areas into a single urban polygon with very few gaps. The VIS and AUE datasets, on the other hand, identify some non-urban areas that appear as rural “islands” within the urban agglomeration.
A comparison of the datasets for the early, middle and recent years of the examined time period follows below. It is not our intention to identify specific strengths and weaknesses of the datasets; this will be highly dependent on the context in which they are applied. Further, as described previously, there are no official maps to compare with. The main goal is to provide evidence for the main assumption behind this study, that the urban land cover class is interpreted and operationalized, implicitly or explicitly, in different ways in the examined remote sensing-based datasets.
4.1. Results for 2012–2017
For the most recent years, the lowest area values are reported by GUF (2012), which is consistent with its specific focus on places with a high prevalence of man-made structures. Furthermore, the aim of providing global coverage may limit the ability to take the gradual nature and special characteristics of urban development in Accra fully into account. It can be seen that the urban mask of the GUF data is comparable in size to the areas designated as urban in 2002 by the TM dataset. The highest area values are reported by AP and VIS. The VIS value exceeds AP if all urban categories (1–4) are included in the VIS result, while it is somewhat lower if Category 4 (“low urbanization”) is excluded. At first sight it seems somewhat surprising that AP, the dataset that applies the lowest threshold distance values for spatial continuity evaluations (200 m), reports such a high area value. This may reflect the fact that AP is indulgent in the sense that a number of different object types are accepted when evaluating intra-urban distances, as previously described. When compared to the VIS dataset—keeping in mind the two years’ difference between them (2015 vs. 2017), and not knowing the precise growth rates—the AP agglomeration map is approximately equivalent to a >10%-level of urbanization following the VIS definition. This means that fringe areas with only minor traces of expected future urban land cover are included in the agglomeration reported by AP. AUE reports somewhat lower area figures for 2014, roughly equivalent of a >30%-level of urbanization following the VIS definition. Figure 6 illustrates the difference between the more fragmented urban areas of the GUF dataset and the more coherent, albeit still different, areas of the AUE and AP datasets for a local area at the fringe of the agglomeration.
4.2. Results for 1985 and 2000–2002
For the middle period, the two available datasets, AUE (2000) and TM (2002), report vastly different results even when the two years’ difference are taken into account. In terms of agglomeration area, AUE is at 71.3% of TM (fully urban), and only at 48.2% of TM (urban + urbanizing), despite a higher spatial continuity threshold value for AUE (1000 m) than for TM (500 m). The difference between the areas reported by the two datasets is similarly large for 1991. It is hard to pinpoint a specific reason for the difference, since the studies have similar objectives. Although based on the same type of satellite data, the processing methods for the two datasets are quite different: AUE is essentially per pixel-based, while TM is texture-based. Moreover, AUE’s methods are designed to be applied globally, while TM was developed specifically for the Accra area.
For 1985 only one dataset, TM, is available, reporting a 4.9% annual increase in urban area between 1985 and 1991. The area reported by AUE for 1991 is actually lower than the TM value for 1985.
4.3. Further Comparison
Overall, the calculated agglomeration area values indicate clearly that significant urban growth has taken place during the period. The documented variation between the studies implies, however, that care should be taken when selecting specific data for growth rate estimations to avoid comparing area estimates that are essentially incomparable. Following up on the previous notes, it is not a question about correct or incorrect data (although some direct misclassifications will occur for all satellite-based strategies) but primarily a question about differences in objectives and methods.
The results obtained by the analyzed studies can be further contextualized by references to a few other recent studies: Agyemang, Amedzro [16] reports the “contiguous built-up” areas of the city to be 245 km2 in 1990 and 1050 km2 in 2015 based on the analysis of Landsat-TM imagery. It is noted that the classification results for the two years were obtained separately, using different methods. The estimated value for 1990 is comparable to, if slightly higher than, the 217 km2 calculated from the TM dataset, and considerably higher (84%) than the 133 km2 calculated for the AUE dataset. The value for 2015 is somewhat higher (20%) than calculated for AUE (2014) while lower (-12%) than calculated for AP (2015). Together, this can be seen as a further indication that the AUE dataset is relatively less inclusive than the AP and TM datasets while still presenting a considerably less fragmented urban scene than the GUF dataset.
Akubia and Bruns [17] reports an urban extent for Accra of 411 km2 in 2008 and 689 km2 in 2017 based on the analysis of Quickbird/Worldview-2 imagery. Although none of the analyzed maps in the current study reports the urban extension in 2008, it seems clear that both values are considerably lower than what is found by the examined studies, which may indicate a narrow definition of “urban” and/or, especially for 2017, the fact that the study area is confined within administrative boundaries.
5. Conclusions
This study has analyzed and compared five different studies of Accra’s urban extent with a focus on their methodological characteristics and the comparability of the resulting maps.
Substantial differences in the demarcation of the Accra agglomeration were identified between the maps, also in cases of proximity in time. Therefore, a central finding is that comparisons between different satellite-derived maps of urban areas may be difficult and potentially misleading, since the urban categories are operationalized differently. It should not come as a surprise that different products provide different results. However, since all apply almost the same category label (“urban”) the issue of comparability may not necessarily be clear to non-technical users of the maps.
Two different types of remote sensing approaches were identified: The method behind the GUF dataset aims to identify exclusively areas with man-made, impervious surfaces such as roads and buildings as proxies for urban extent. The methods behind the four other datasets were all more ‘inclusive‘ (although at different levels), aiming to identify a broader set of land cover types. These include parks and open spaces that are considered a part of the mixed urban fabric. Overall, the results show that the AUE dataset is relatively less inclusive than the AP and TM datasets while still presenting a considerably less fragmented urban scene than the GUF dataset. Concerning urban fringe areas in the early stages of urbanization, the results show that AP includes these to a very high extent, while GUF excludes them almost entirely.
The AP study aims at applying a more formal definition of “urban” by incorporating population data density threshold values related to building locations. The fact remains, however, that the availability of such data is limited in SSA at the spatial and temporal scale at which it is needed. Further differences between the maps were found in the way urban fringe areas under development are classified depending on their degree of urbanization as well as the applied distance threshold values for including/excluding sites into the urban agglomeration.
This study shows that it is not meaningful to compute growth rates directly between different datasets, since this would most likely lead to invalid conclusions concerning the growth dynamics. Estimates of urban spatial growth from direct comparison of a historical datasets with an inclusive definition of “urban” with a more recent dataset such as GUF that uses a narrow definition of the urban could lead to the erroneous conclusion that Accra’s spatial expansion has almost come to a halt. Other recent datasets provide a clear indication that the Accra agglomeration is, in fact, still expanding quite fast.
Accurate spatial data on the expansion of the Accra agglomeration, as a supplement to the 10 years census data, are necessary to assess the growth dynamics. The major challenges for urban development in the fringe zone include poor transport infrastructure and service delivery, especially the provision of an adequate water supply and an efficient waste-management system. The unplanned spatial expansion of Accra has resulted in limited connectivity both within the city and between it and its hinterlands. Recognizing the Accra agglomeration based on its spatial structure rather than through political or statistical boundary delimitations has many advantages for urban planning and management, as also noted by Gaisie et al. [7]. In the case of Accra, satellite imagery is the main source for such data, providing valuable and timely information about the occurring urban land cover changes. The rapid increase in studies that provide growth estimates for urban areas makes it even more important that the often implicit definition of the “urban“ is analyzed and expressed more clearly by each study.
Author Contributions
Conceptualization, Lasse Møller-Jensen, Albert N. Allotey, Richard Y. Kofie and Paul W. K. Yankson; methodology, Lasse Møller-Jensen; formal analysis, Lasse Møller-Jensen; investigation, Lasse Møller-Jensen, Albert N. Allotey, Richard Y. Kofie and Paul W. K. Yankson; data curation, Albert N. Allotey and Richard Y. Kofie; writing—original draft, Lasse Møller-Jensen and Paul W. K. Yankson; writing—review and editing, Lasse Møller-Jensen; visualization, Lasse Møller-Jensen and Richard Y. Kofie; project administration and funding acquisition, Lasse Møller-Jensen. All authors have read and agreed to the published version of the manuscript.
Funding
Funding for this research was awarded by the Ministry of Foreign Affairs, Denmark.
Acknowledgments
The authors wish to thank the external providers of the maps used for this analysis for making the data available.
Conflicts of Interest
The authors declare no conflict of interest. The funders had no role in the design of the study; in the collection, analyses, or interpretation of data; in the writing of the manuscript, or in the decision to publish the results.
References
- Doan, P.; Oduro, C.Y. Patterns of Population Growth in Peri-Urban Accra, Ghana. Int. J. Urban Reg. Res. 2011, 36, 1306–1325. [Google Scholar] [CrossRef]
- Gough, K.V.; Yankson, P.W.K. Land Markets in African Cities: The Case of Peri-urban Accra, Ghana. Urban Stud. 2000, 37, 2485–2500. [Google Scholar] [CrossRef]
- Grant, R. Geographies of investment: How do the wealthy build new houses in Accra, Ghana? Urban Forum 2007, 18, 31–59. [Google Scholar] [CrossRef]
- Yankson, P.W.K.; Kofie, R.Y.; Moller-Jensen, L. Monitoring Urban Growth: Urbanization of the Fringe areas of Accra. Bull. Ghana Geogr. Assoc. 2007, 24, 1–12. [Google Scholar]
- Yeboah, I.E.A. Demographic and housing aspects of structural adjustment and emerging urban form in Accra, Ghana. Afr. Today 2003, 50, 106–119. [Google Scholar] [CrossRef]
- Owusu-Ansah, J.K.; O’Connor, K.B. Housing demand in the urban fringe around Kumasi, Ghana. J. Hous. Built Environ. 2009, 25, 1–17. [Google Scholar] [CrossRef]
- Gaisie, E.; Kim, H.M.; Han, S.S. Accra towards a city-region: Devolution, spatial development and urban challenges. Cities 2019, 95, 102398. [Google Scholar] [CrossRef]
- Oduro, C.Y.; Adamtey, R.; Ocloo, K. Urban Growth and Livelihood Transformations on the Fringes of African Cities: A Case Study of Changing Livelihoods in Peri-Urban Accra. Environ. Nat. Resour. Res. 2015, 5, 81–98. [Google Scholar] [CrossRef]
- Gough, K. The changing nature of urban governance in peri-urban Accra, Ghana. Third World Plan. Rev. 1999, 21, 393–403. [Google Scholar] [CrossRef]
- Møller-Jensen, L. Methods for Texture-Based Classification of Urban Fringe Areas from Medium and High Resolution Satellite Imagery. In Spatial Inequalities—Health, Poverty, and Place in Accra, Ghana; Weeks, J.R., Hill, A.G., Stoler, J., Eds.; Springer: Dordrecht, The Netherlands, 2013; Volume 110, pp. 73–86. [Google Scholar]
- Kleemann, J.; Inkoom, J.N.; Thiel, M.; Shankar, S.; Lautenbach, S.; Fürst, C. Peri-urban land use pattern and its relation to land use planning in Ghana, West Africa. Landsc. Urban Plan. 2017, 165, 280–294. [Google Scholar] [CrossRef]
- Angel, S.; Blei, A.M.; Parent, J.; Lamson-Hall, P.; Sánchez, N.G. Areas and Densities. In Atlas of Urban Expansion; Copublished by the NYU Urban Expansion Program at New York University, UN-Habitat, and the Lincoln Institute of Land Policy: Cambridge, MA, USA, 2016. [Google Scholar]
- Moriconi-Ebrard, F.; Harre, D.; Heinrigs, P. Urbanisation Dynamics in West Africa 1950–2010: Africapolis I, 2015 Update; West African Studies; OECD Publishing: Paris, France, 2016. [Google Scholar]
- Benza, M.; Weeks, J.R.; Stow, D.A.; López-Carr, D.; Clarke, K.C. A pattern-based definition of urban context using remote sensing and GIS. Remote. Sens. Environ. 2016, 183, 250–264. [Google Scholar] [CrossRef]
- Stow, U.A.; Weeks, J.R.; Shih, H.-C.; Coulter, L.L.; Johnson, H.; Tsai, Y.-H.; Kerr, A.; Benza, M.; Mensah, F. Inter-regional pattern of urbanization in southern Ghana in the first decade of the new millennium. Appl. Geogr. 2016, 71, 32–43. [Google Scholar] [CrossRef]
- Agyemang, F.S.; Amedzro, K.K.; Silva, E. The emergence of city-regions and their implications for contemporary spatial governance: Evidence from Ghana. Cities 2017, 71, 70–79. [Google Scholar] [CrossRef]
- Akubia, J.E.K.; Bruns, A. Unravelling the Frontiers of Urban Growth: Spatio-Temporal Dynamics of Land-Use Change and Urban Expansion in Greater Accra Metropolitan Area, Ghana. Land 2019, 8, 131. [Google Scholar] [CrossRef]
- Addae, B.; Oppelt, N. Land-Use/Land-Cover Change Analysis and Urban Growth Modelling in the Greater Accra Metropolitan Area (GAMA), Ghana. Urban Sci. 2019, 3, 26. [Google Scholar] [CrossRef]
- Potere, D.; Schneider, A. A critical look at representations of urban areas in global maps. GEOJ 2007, 69, 55–80. [Google Scholar] [CrossRef]
- Potere, D.; Schneider, A.; Angel, S.; Civco, D.L. Mapping urban areas on a global scale: Which of the eight maps now available is more accurate? Int. J. Remote. Sens. 2009, 30, 6531–6558. [Google Scholar] [CrossRef]
- United Nations Statistical Division, Population density and urbanization. Available online: https://unstats.un.org/unsd/demographic/sconcerns/densurb/densurbmethods.htm (accessed on 1 August 2019).
- Szabo, S. The Urban Context. In Urbanisation and Inequalities in a Post-Malthusian Context—Challenges for the Sustainable Development Agenda; Springer: Berlin/Heidelberg, Germany, 2016. [Google Scholar]
- Statistics Denmark, Statistikdokumentation for Byopgørelsen 2018. Available online: www.dst.dk (accessed on 15 December 2018).
- 2010 Population and Housing Census—National Analytical Report. Published by Ghana Statistical Service. 2013. Available online: http://www2.statsghana.gov.gh/docfiles/publications/2010_PHC_National_Analytical_Report.pdf (accessed on 10 December 2018).
- Liu, X.; Hu, G.; Chen, Y.; Li, X.; Xu, X.; Li, S.; Pei, F.; Wang, S. High-resolution multi-temporal mapping of global urban land using Landsat images based on the Google Earth Engine Platform. Remote. Sens. Environ. 2018, 209, 227–239. [Google Scholar] [CrossRef]
- Møller-Jensen, L.; Kofie, R.Y.; Yankson, P.W.K. Large-area urban growth observations—a hierarchical kernel approach based on image texture. Geogr. Tidsskr. J. Geogr. 2005, 105, 39–47. [Google Scholar] [CrossRef]
- Esch, T.; Marconcini, M.; Felbier, A.; Roth, A.; Heldens, W.; Huber, M.; Schwinger, M.; Taubenbock, H.; Muller, A.; Dech, S. Urban Footprint Processor—Fully Automated Processing Chain Generating Settlement Masks From Global Data of the TanDEM-X Mission. IEEE Geosci. Remote. Sens. Lett. 2013, 10, 1617–1621. [Google Scholar] [CrossRef]
- Africapolis. Available online: www.africapolis.org/home (accessed on 19 March 2019).
- Haralick, R.M.; Shanmugam, K.; Dinstein, I. Textural Features for Image Classification. IEEE Trans. Syst. Man Cybern. 1973, 3, 610–621. [Google Scholar] [CrossRef]
- DLR. Available online: https://www.dlr.de/eoc/en/desktopdefault.aspx/tabid-9628/16557_read-40454/ (accessed on 19 March 2019).
- Esch, T.; Taubenböck, H.; Roth, A.; Heldens, W.; Felbier, A.; Thiel, M.; Schmidt, M.; Müller, A.; Dech, S. TanDEM-X mission—new perspectives for the inventory and monitoring of global settlement patterns. J. Appl. Remote. Sens. 2012, 6, 61702. [Google Scholar] [CrossRef]
© 2020 by the authors. Licensee MDPI, Basel, Switzerland. This article is an open access article distributed under the terms and conditions of the Creative Commons Attribution (CC BY) license (http://creativecommons.org/licenses/by/4.0/).