Use of Mamdani Fuzzy Algorithm for Multi-Hazard Susceptibility Assessment in a Developing Urban Settlement (Mamak, Ankara, Turkey)


Abstract
1. Introduction
2. Background on Multi-Hazard Assessment
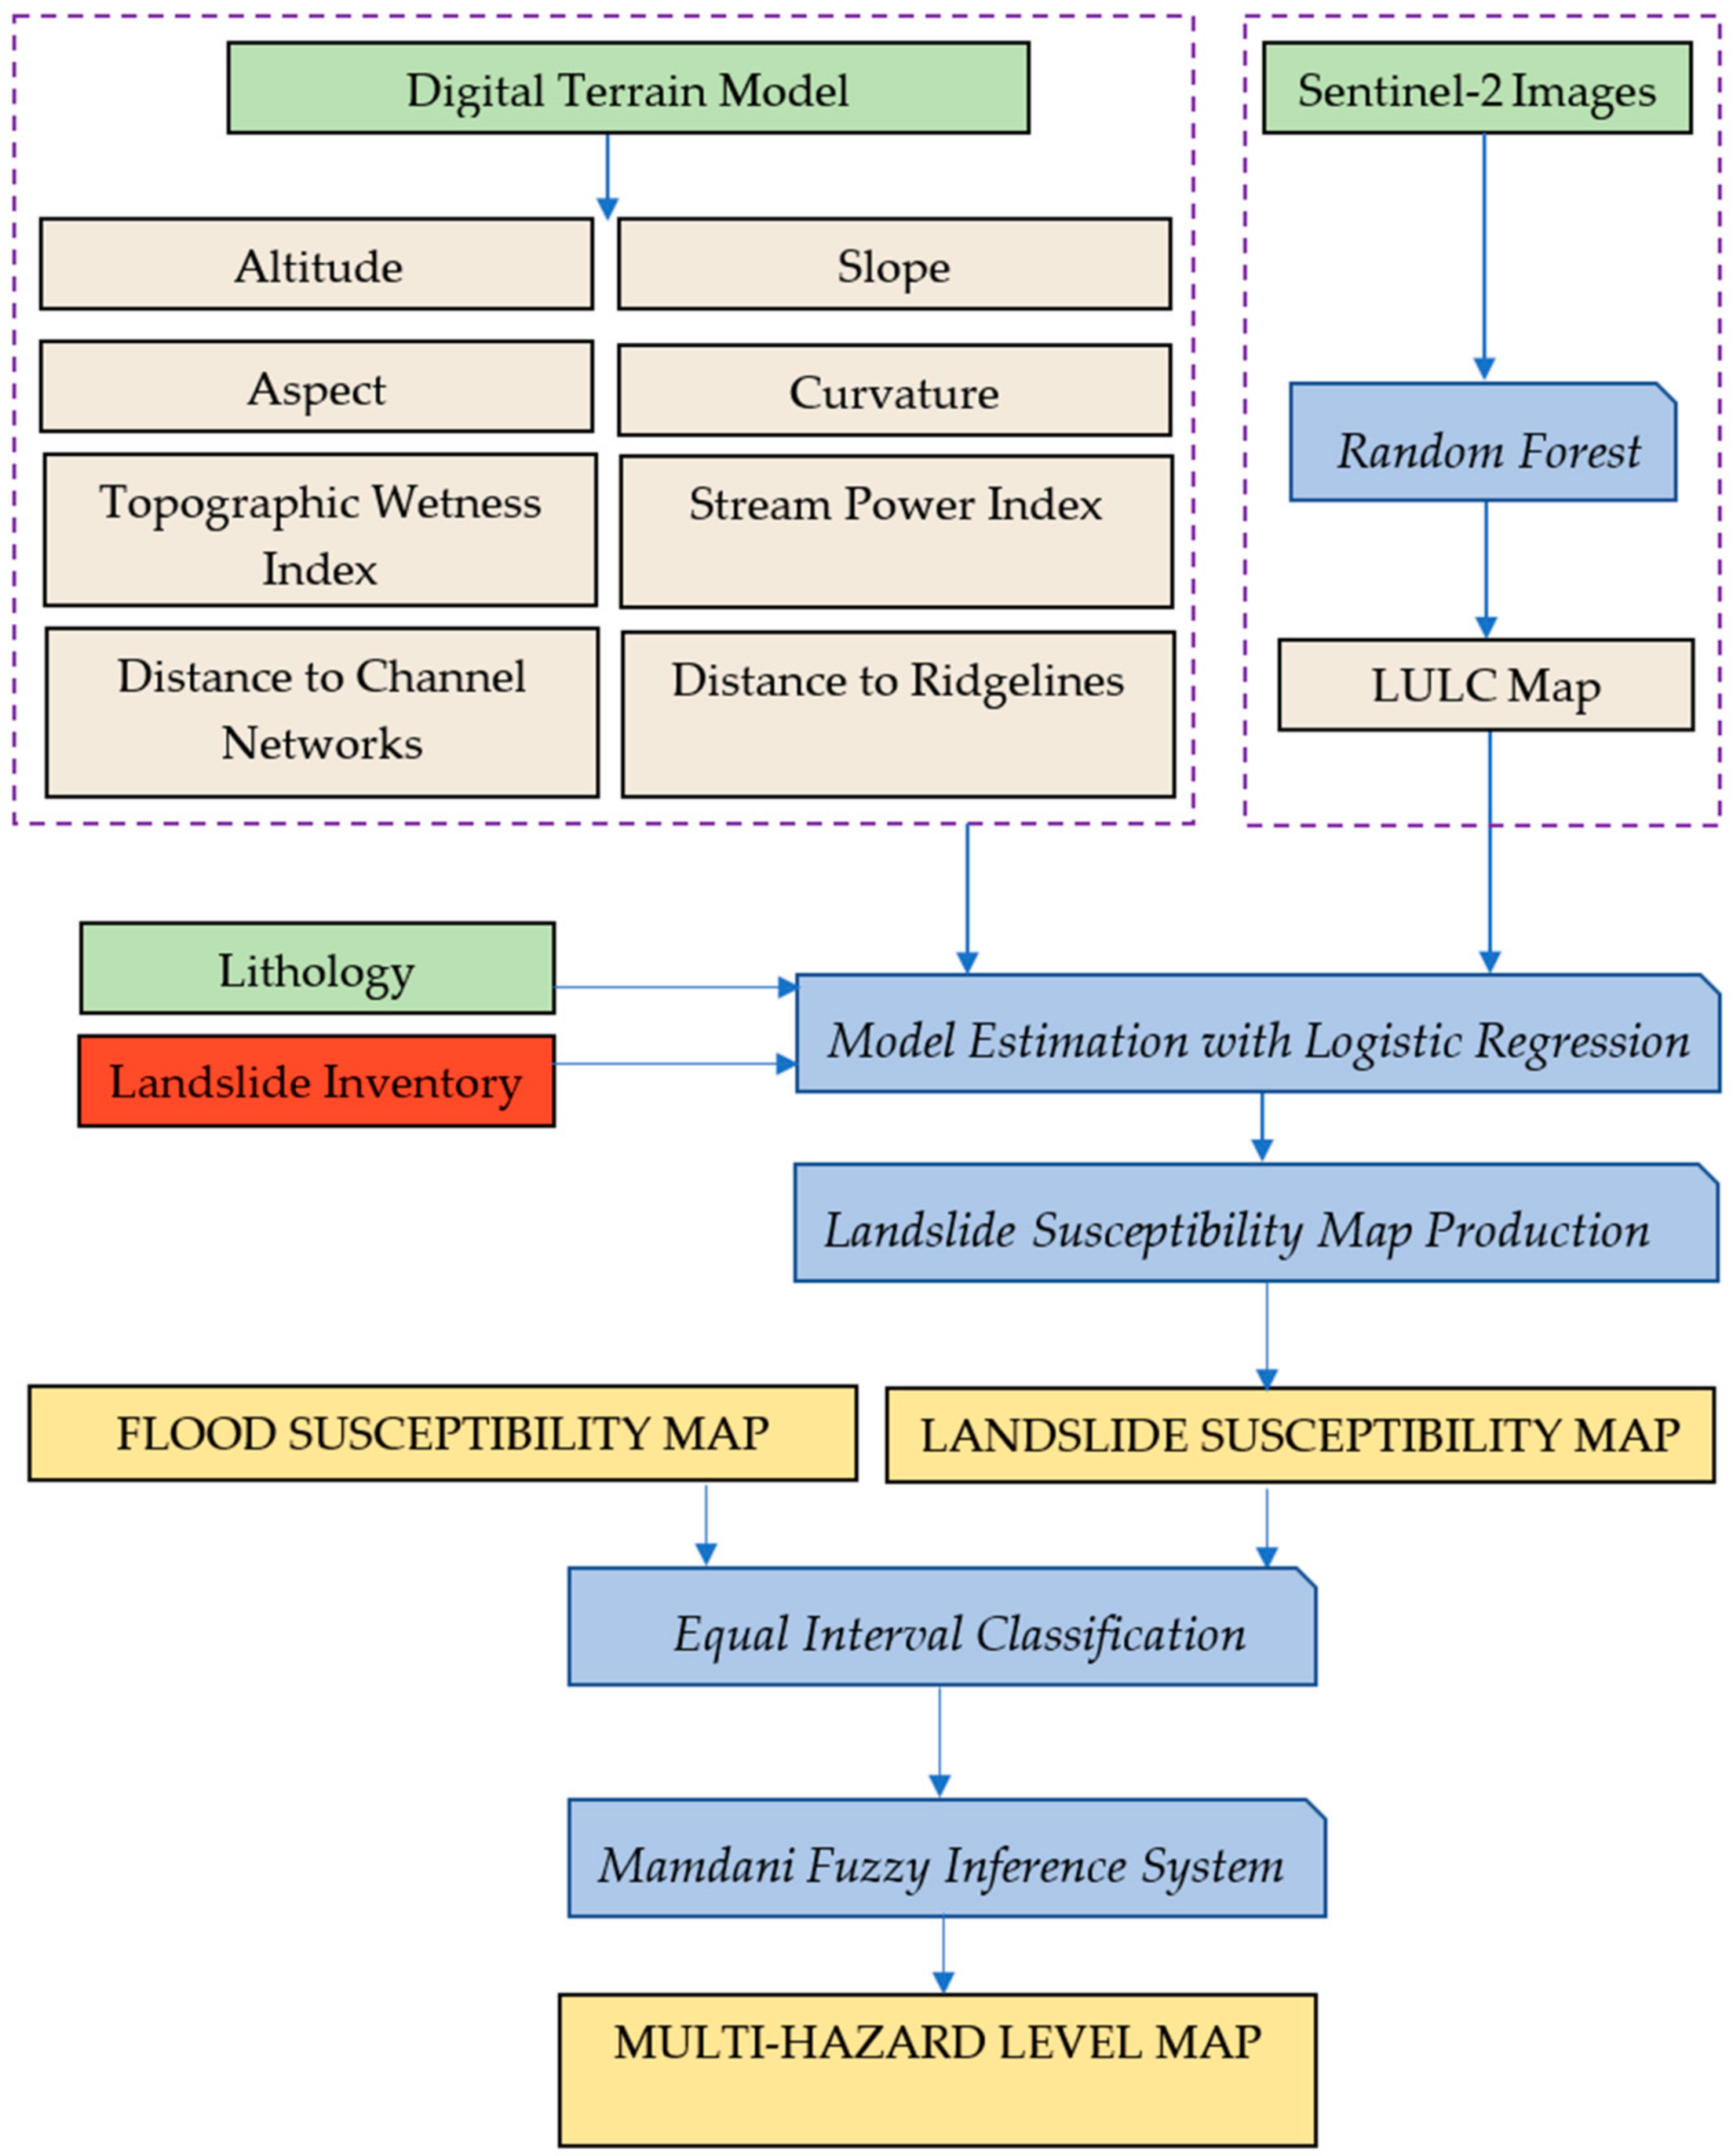
3. Materials and Methods
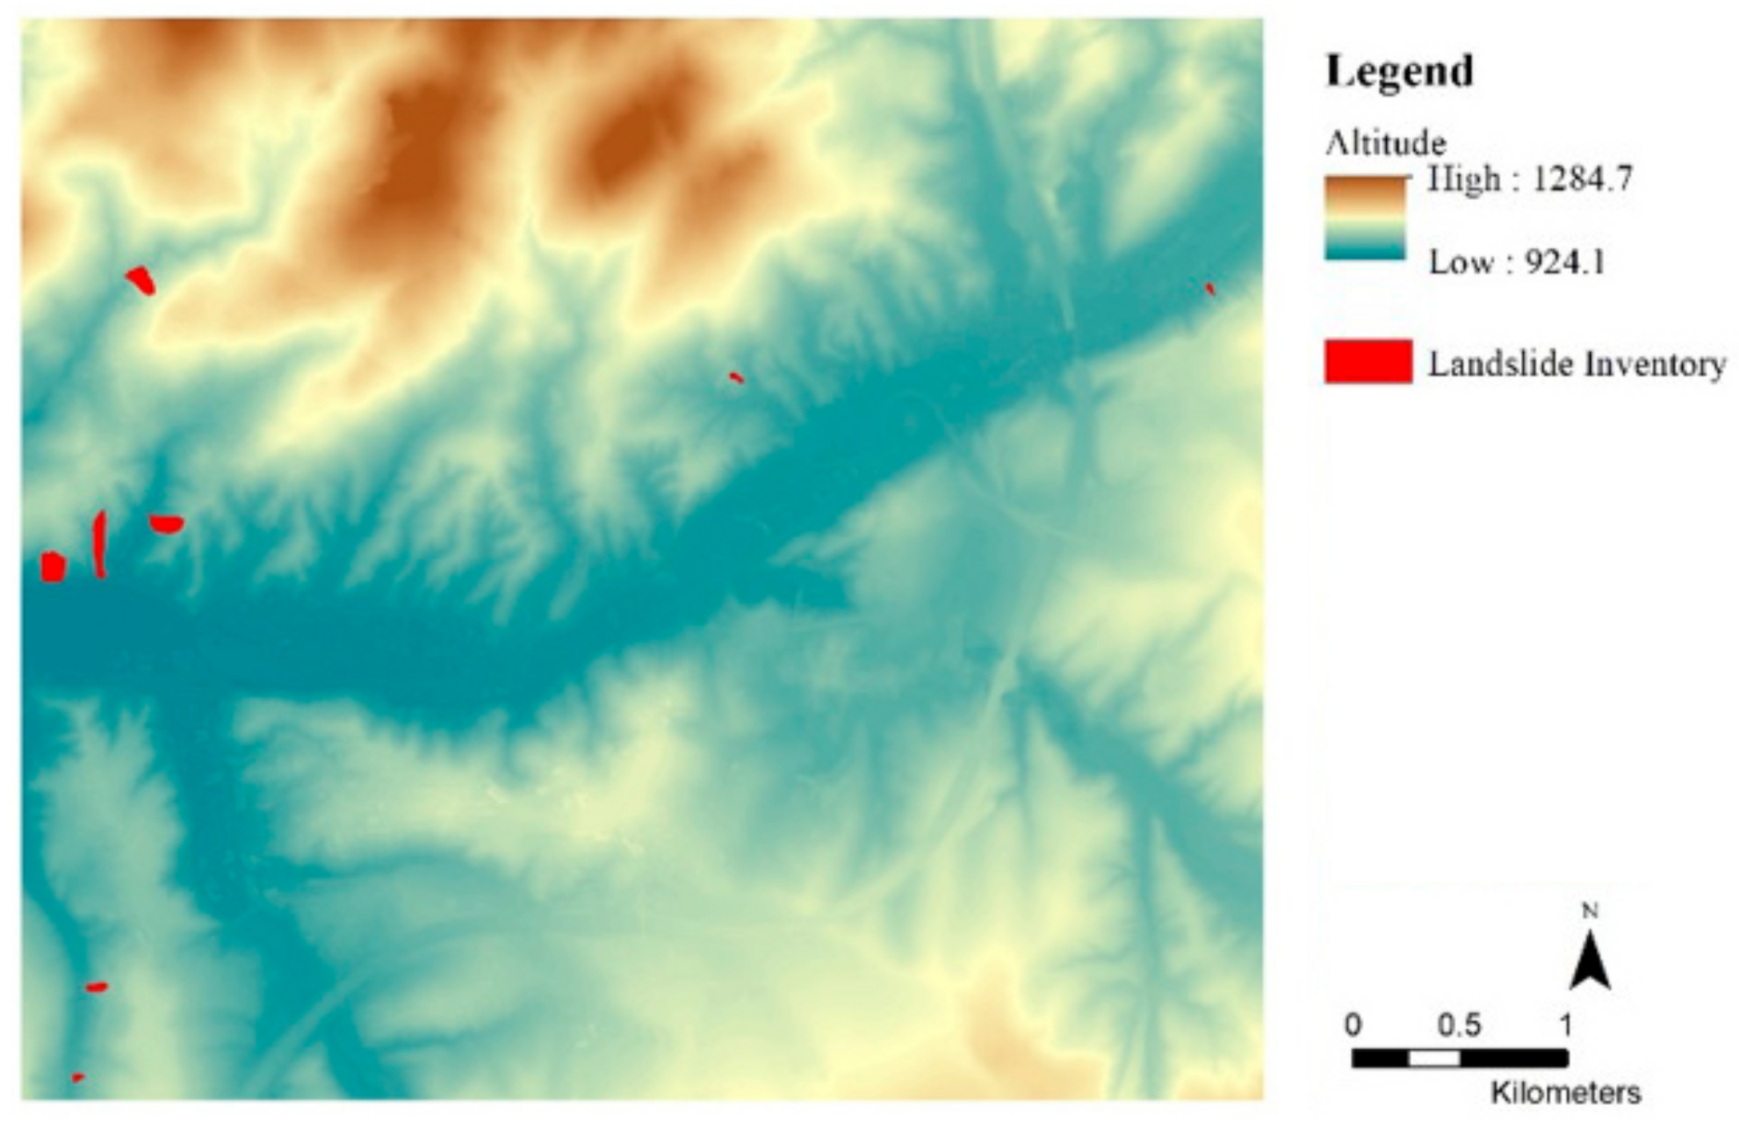
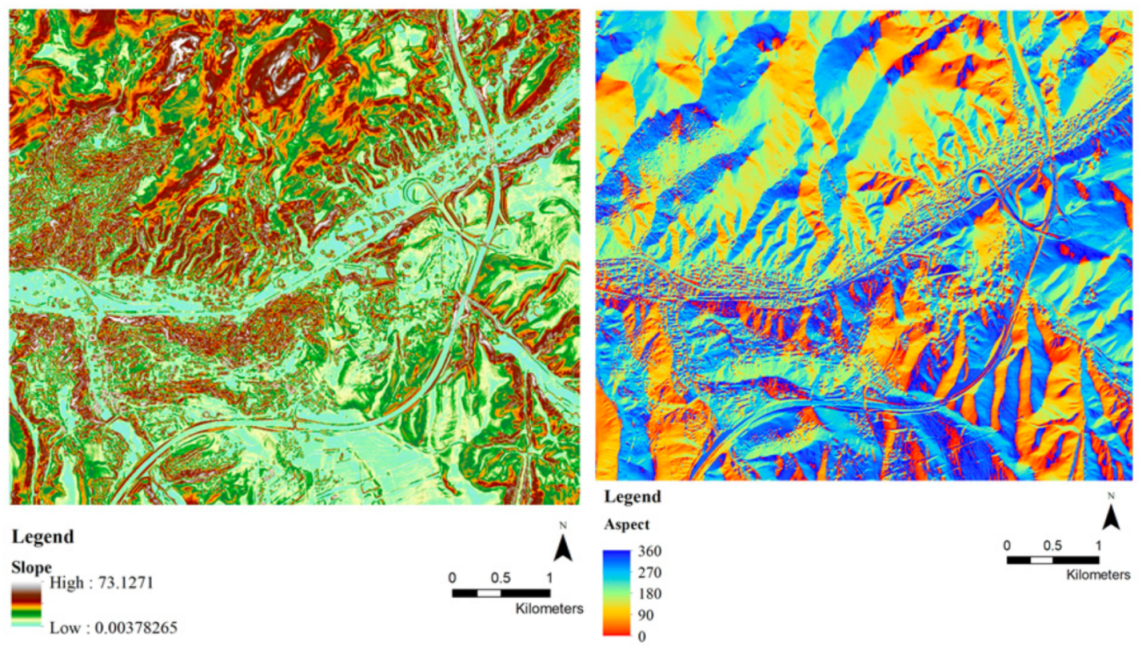
3.1. Input Datasets for Landslide Susceptibility Map Production
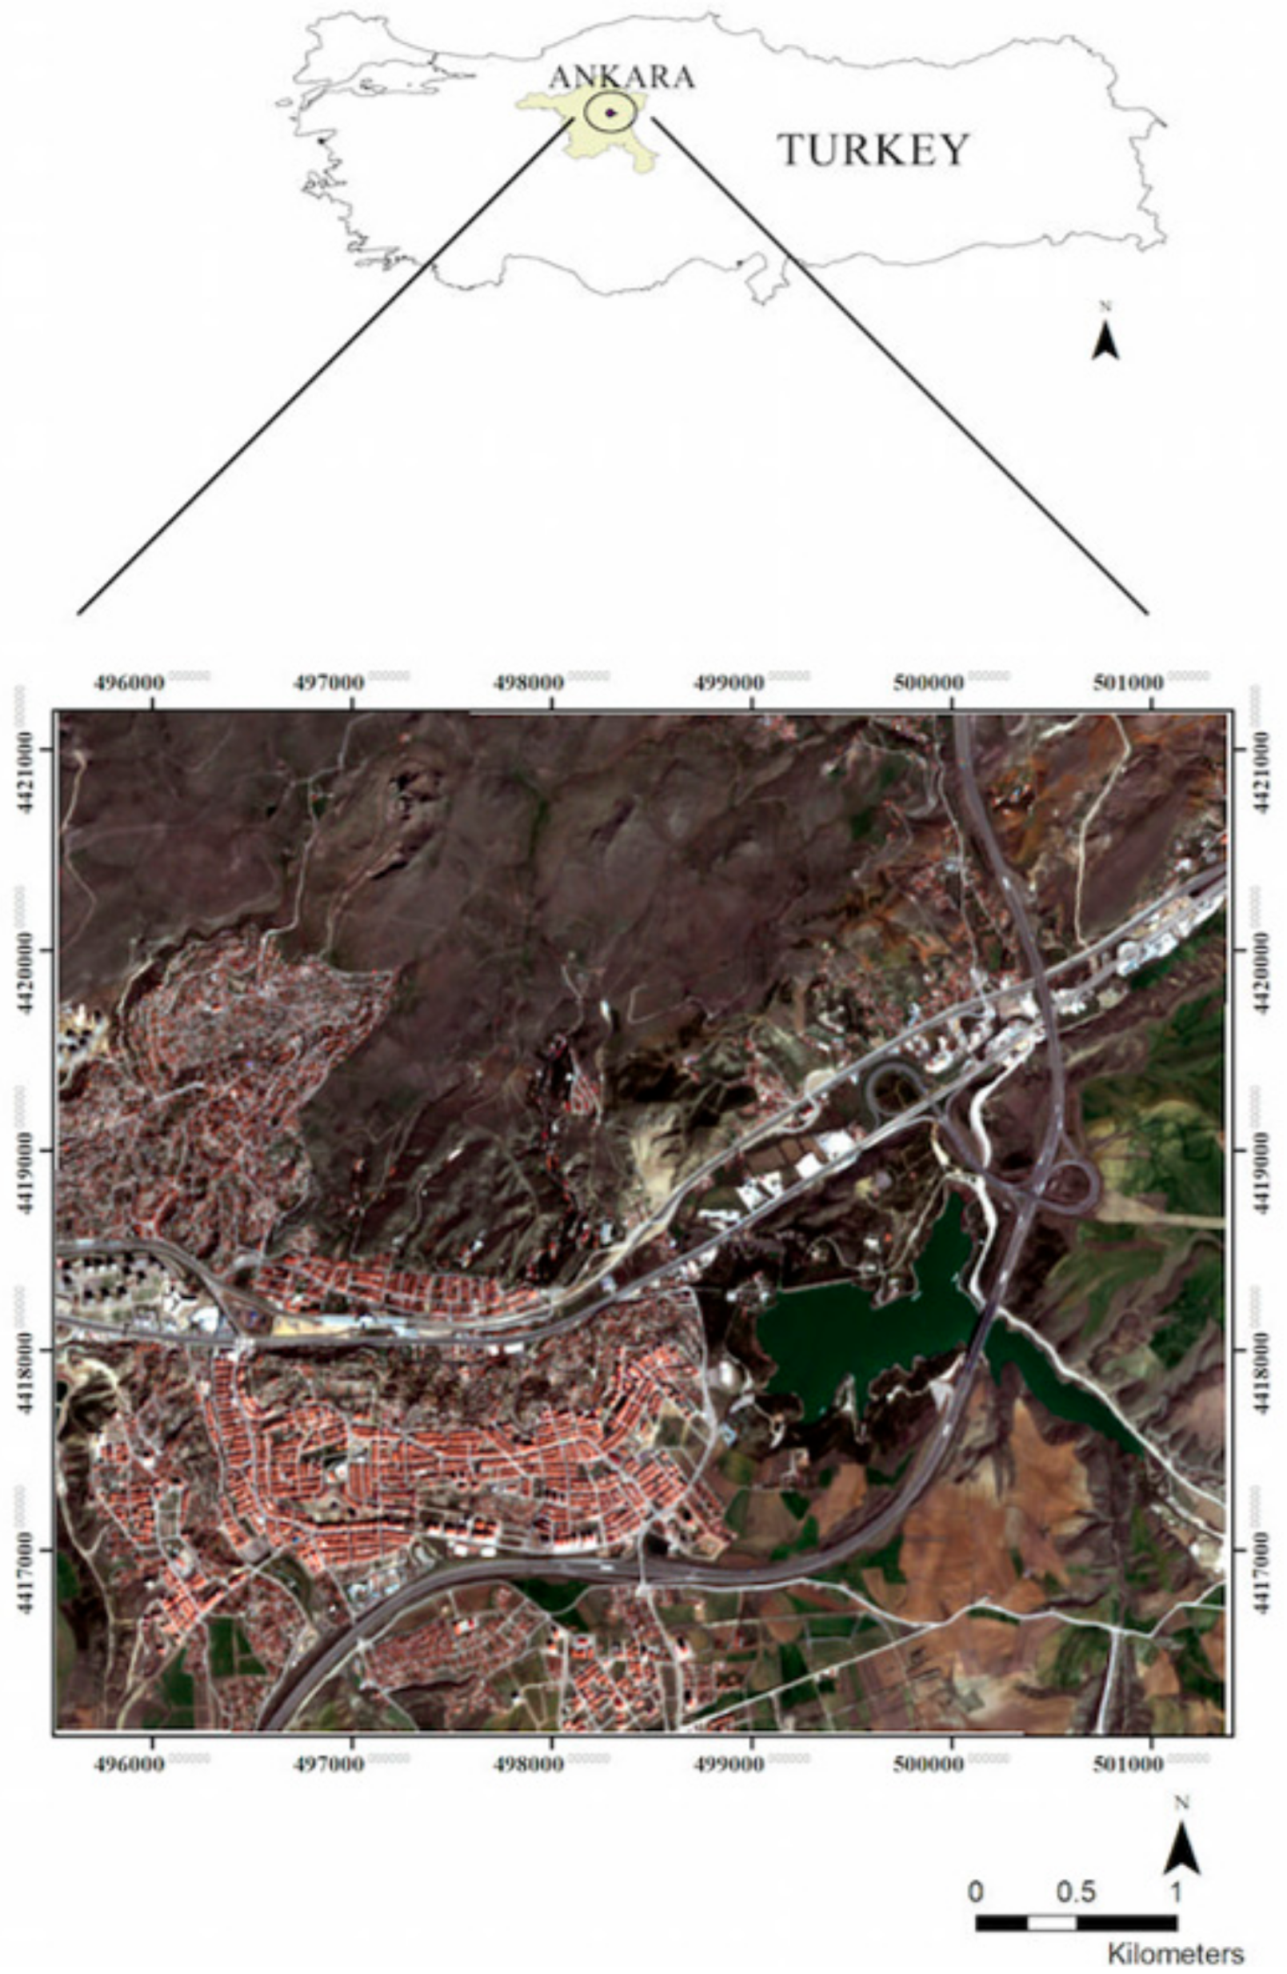
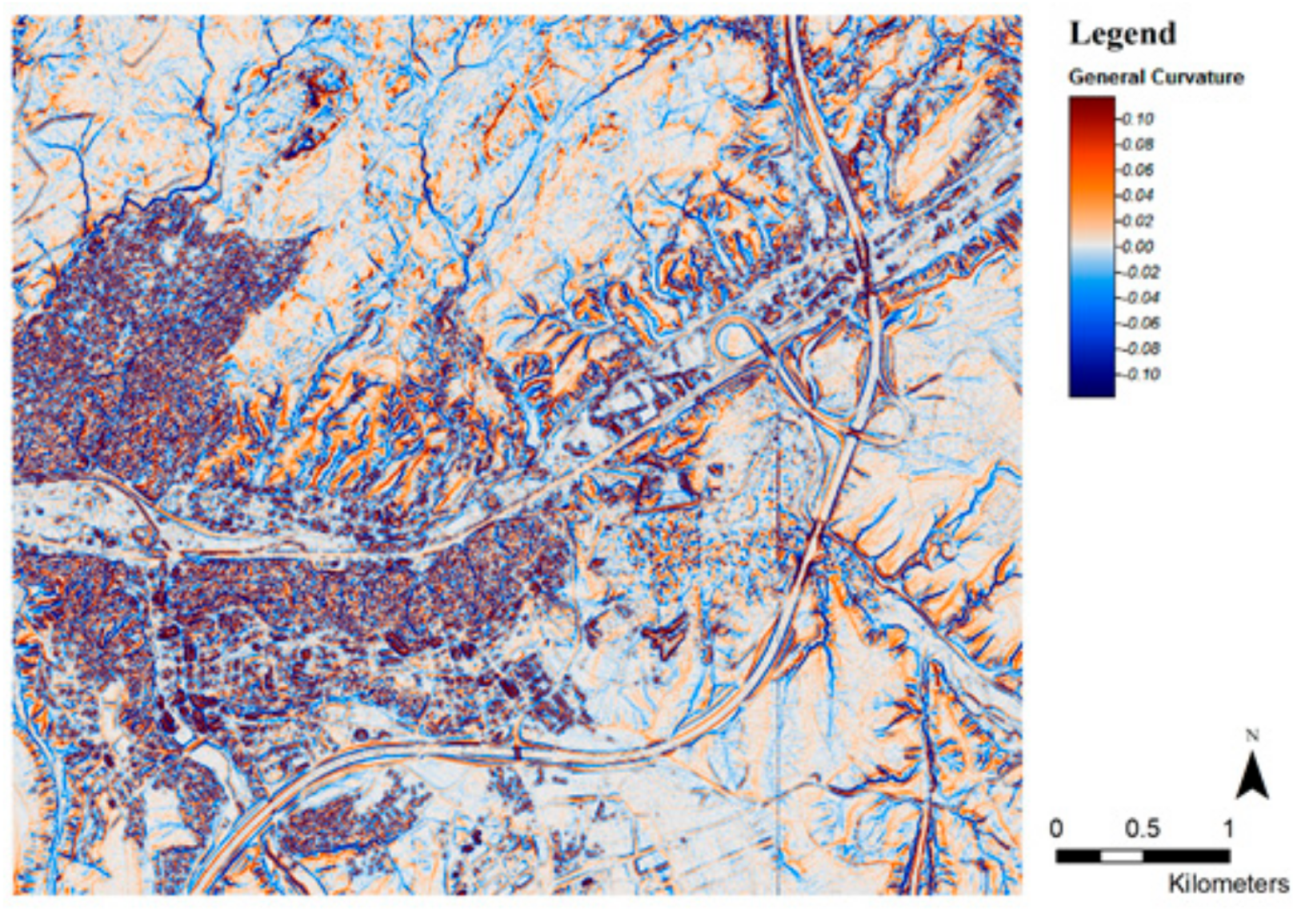
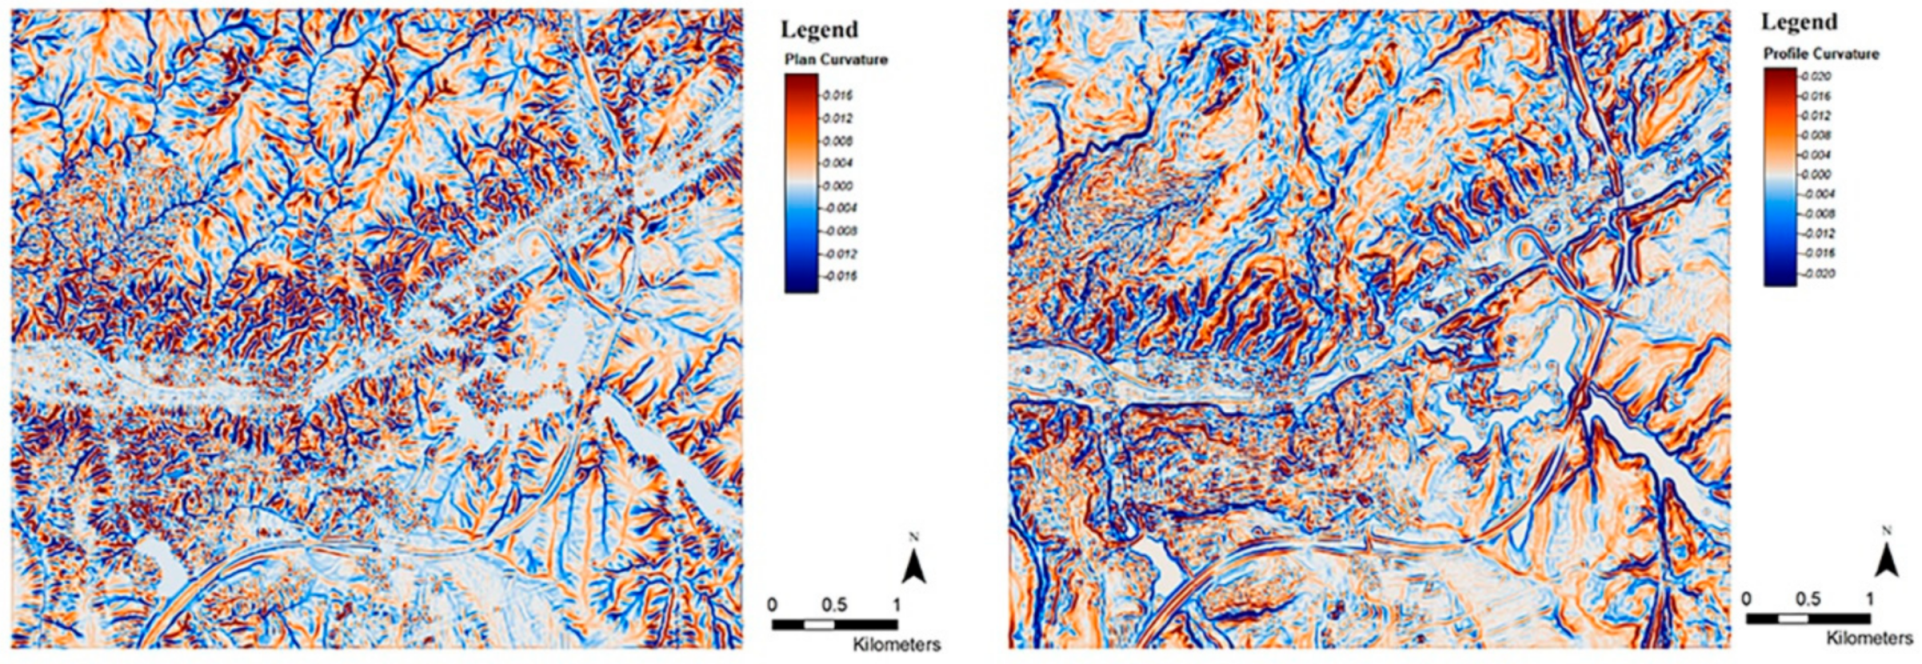
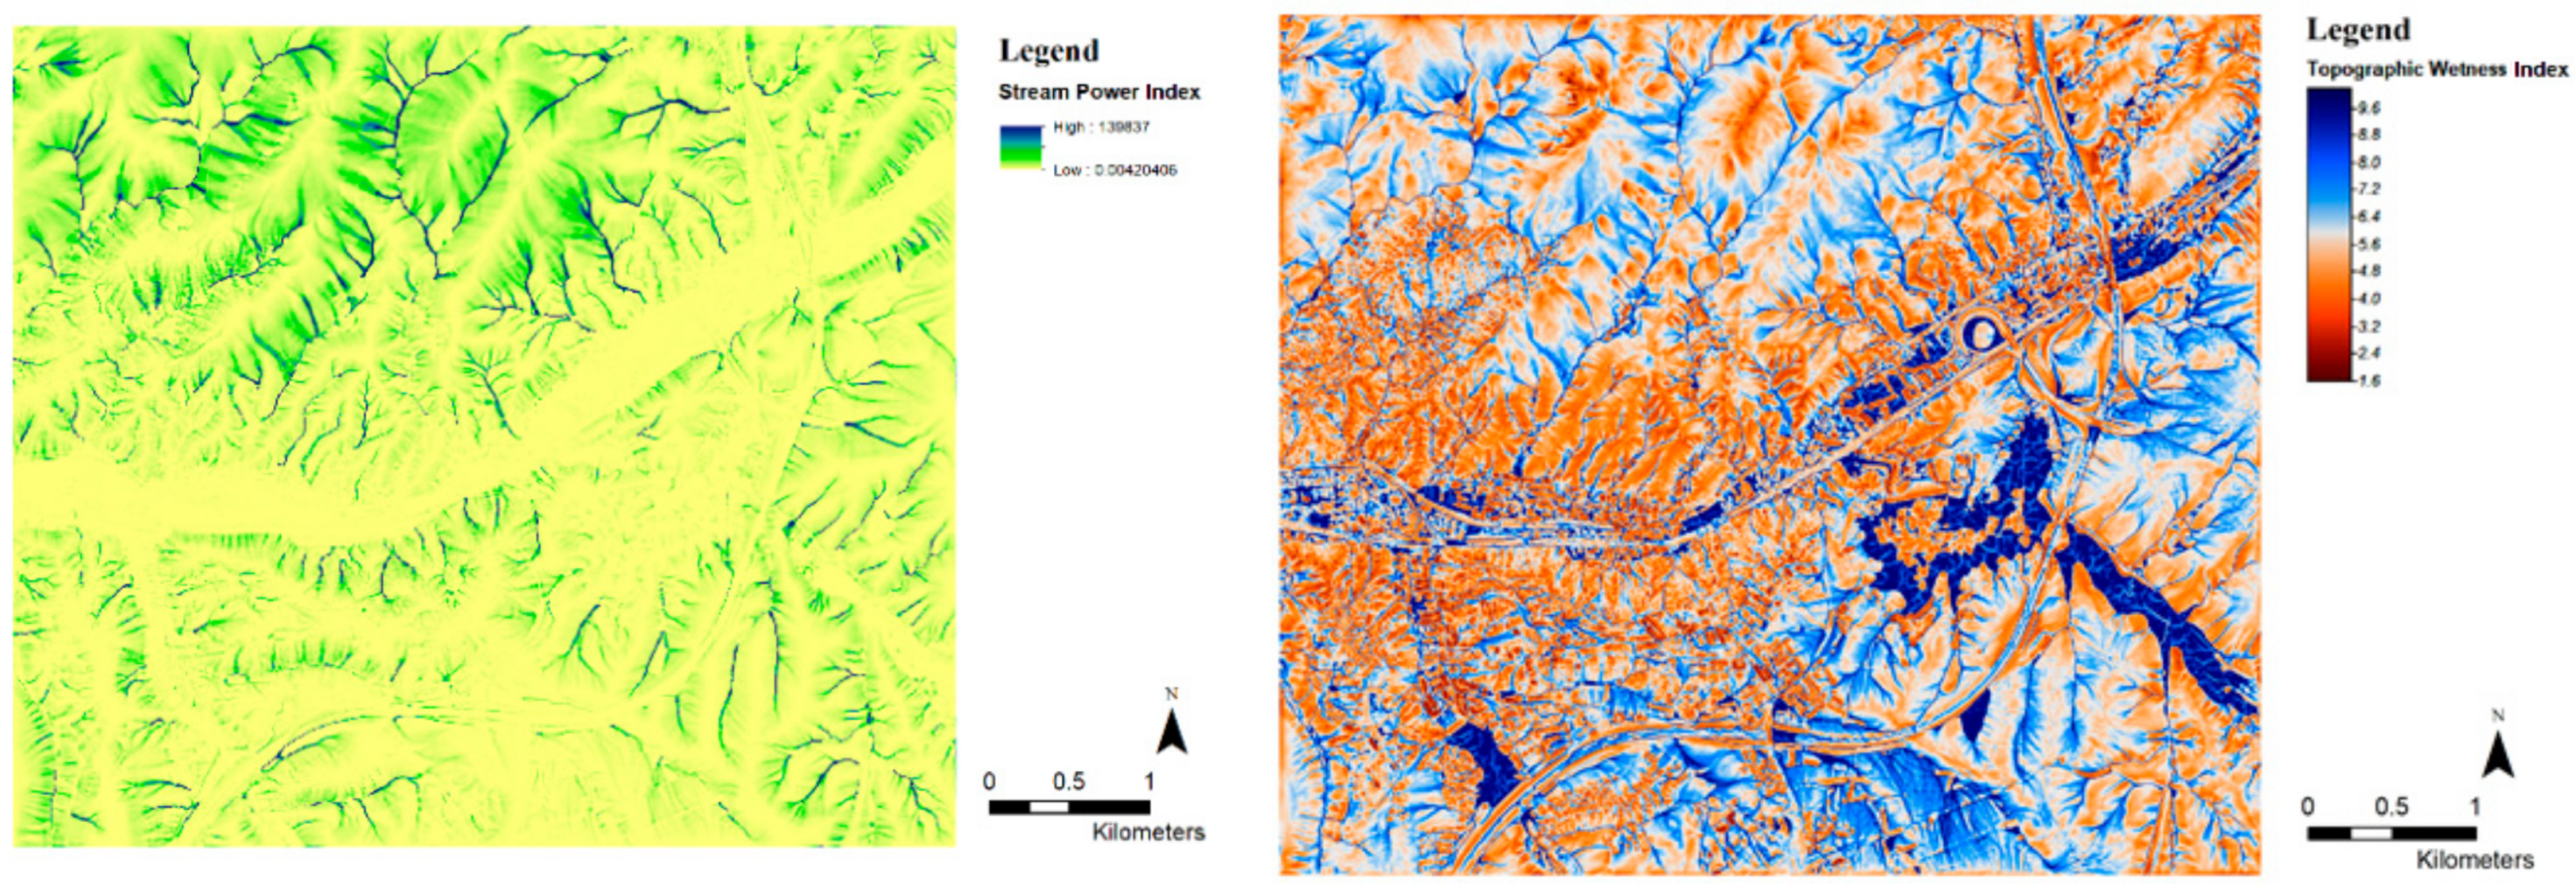
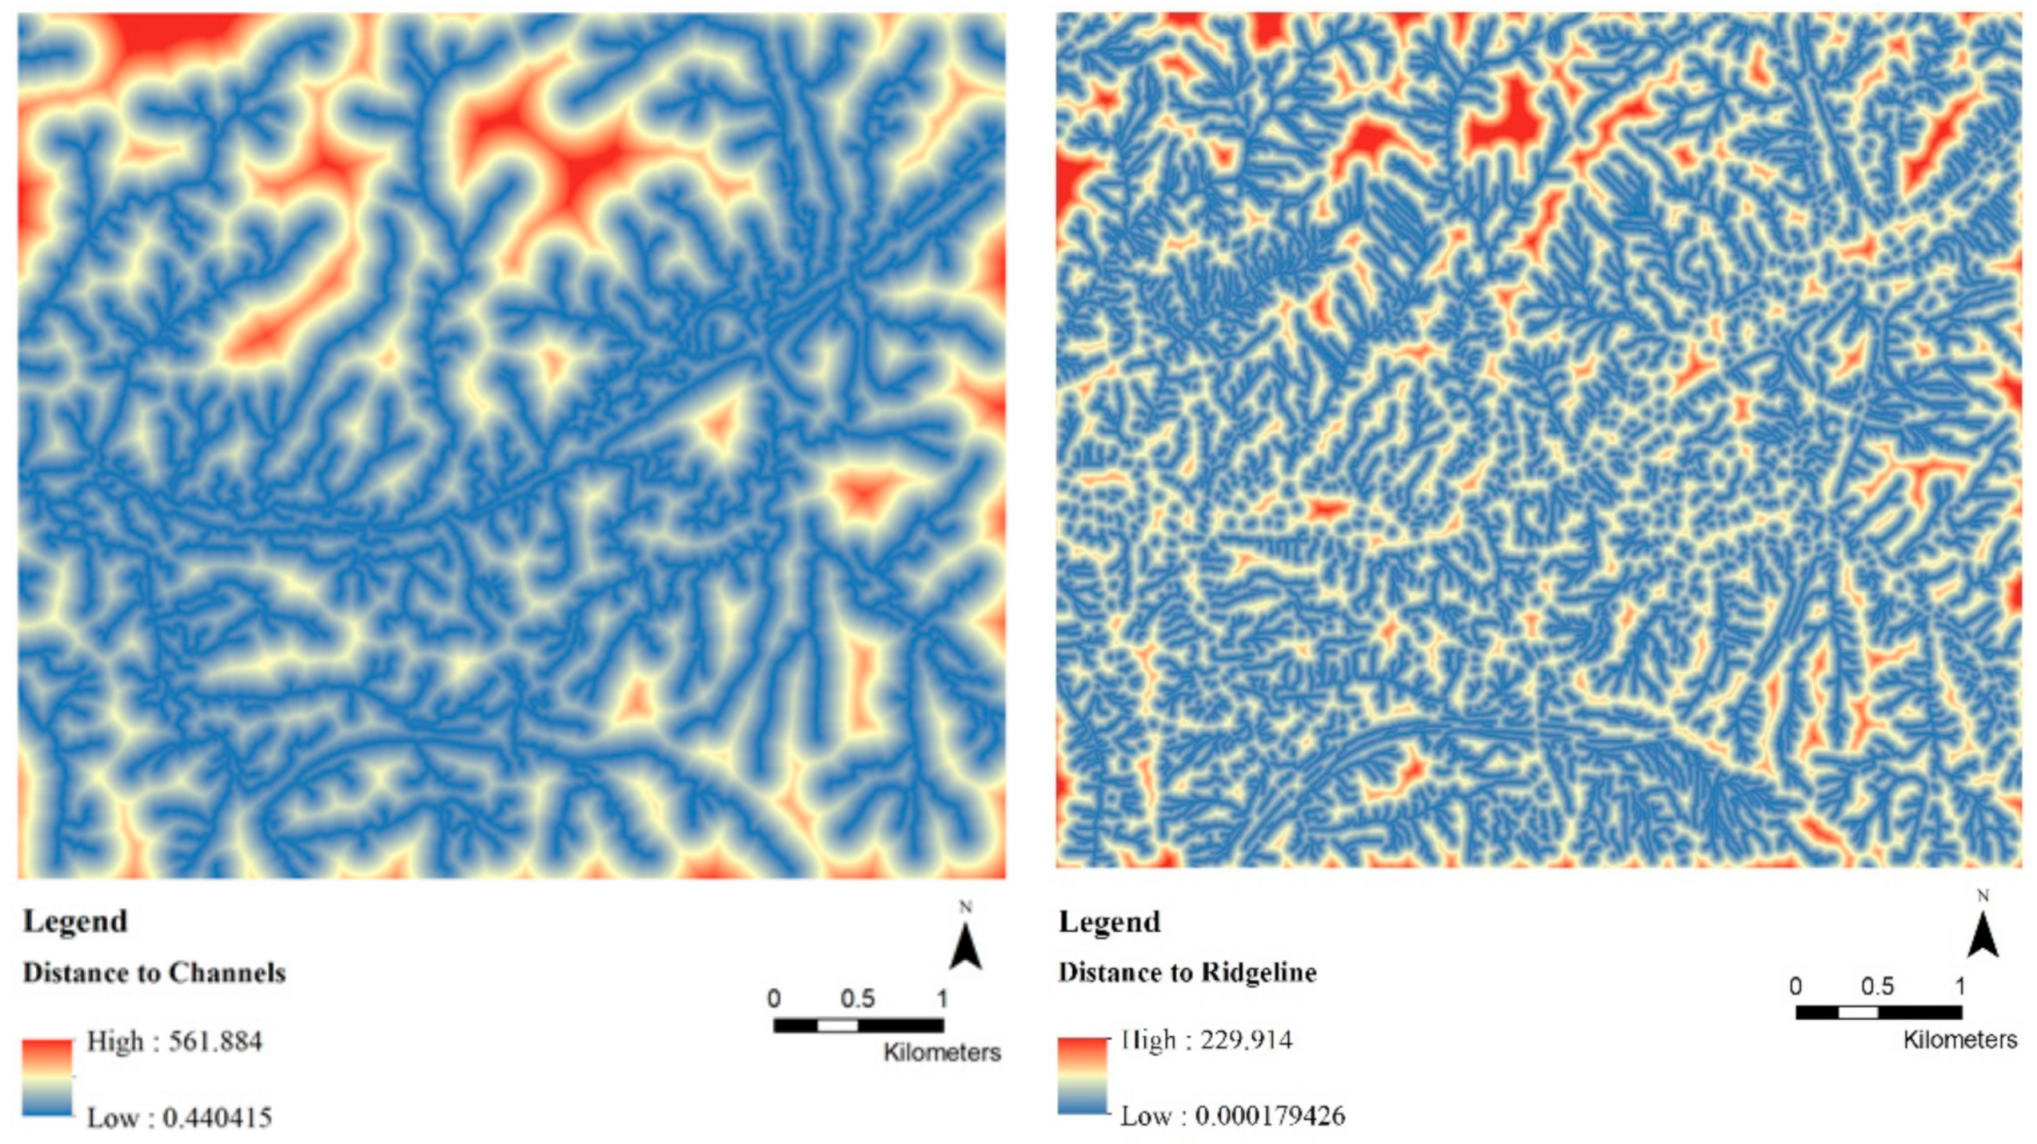
3.2. Geomorphological Characteristics of the Study Area
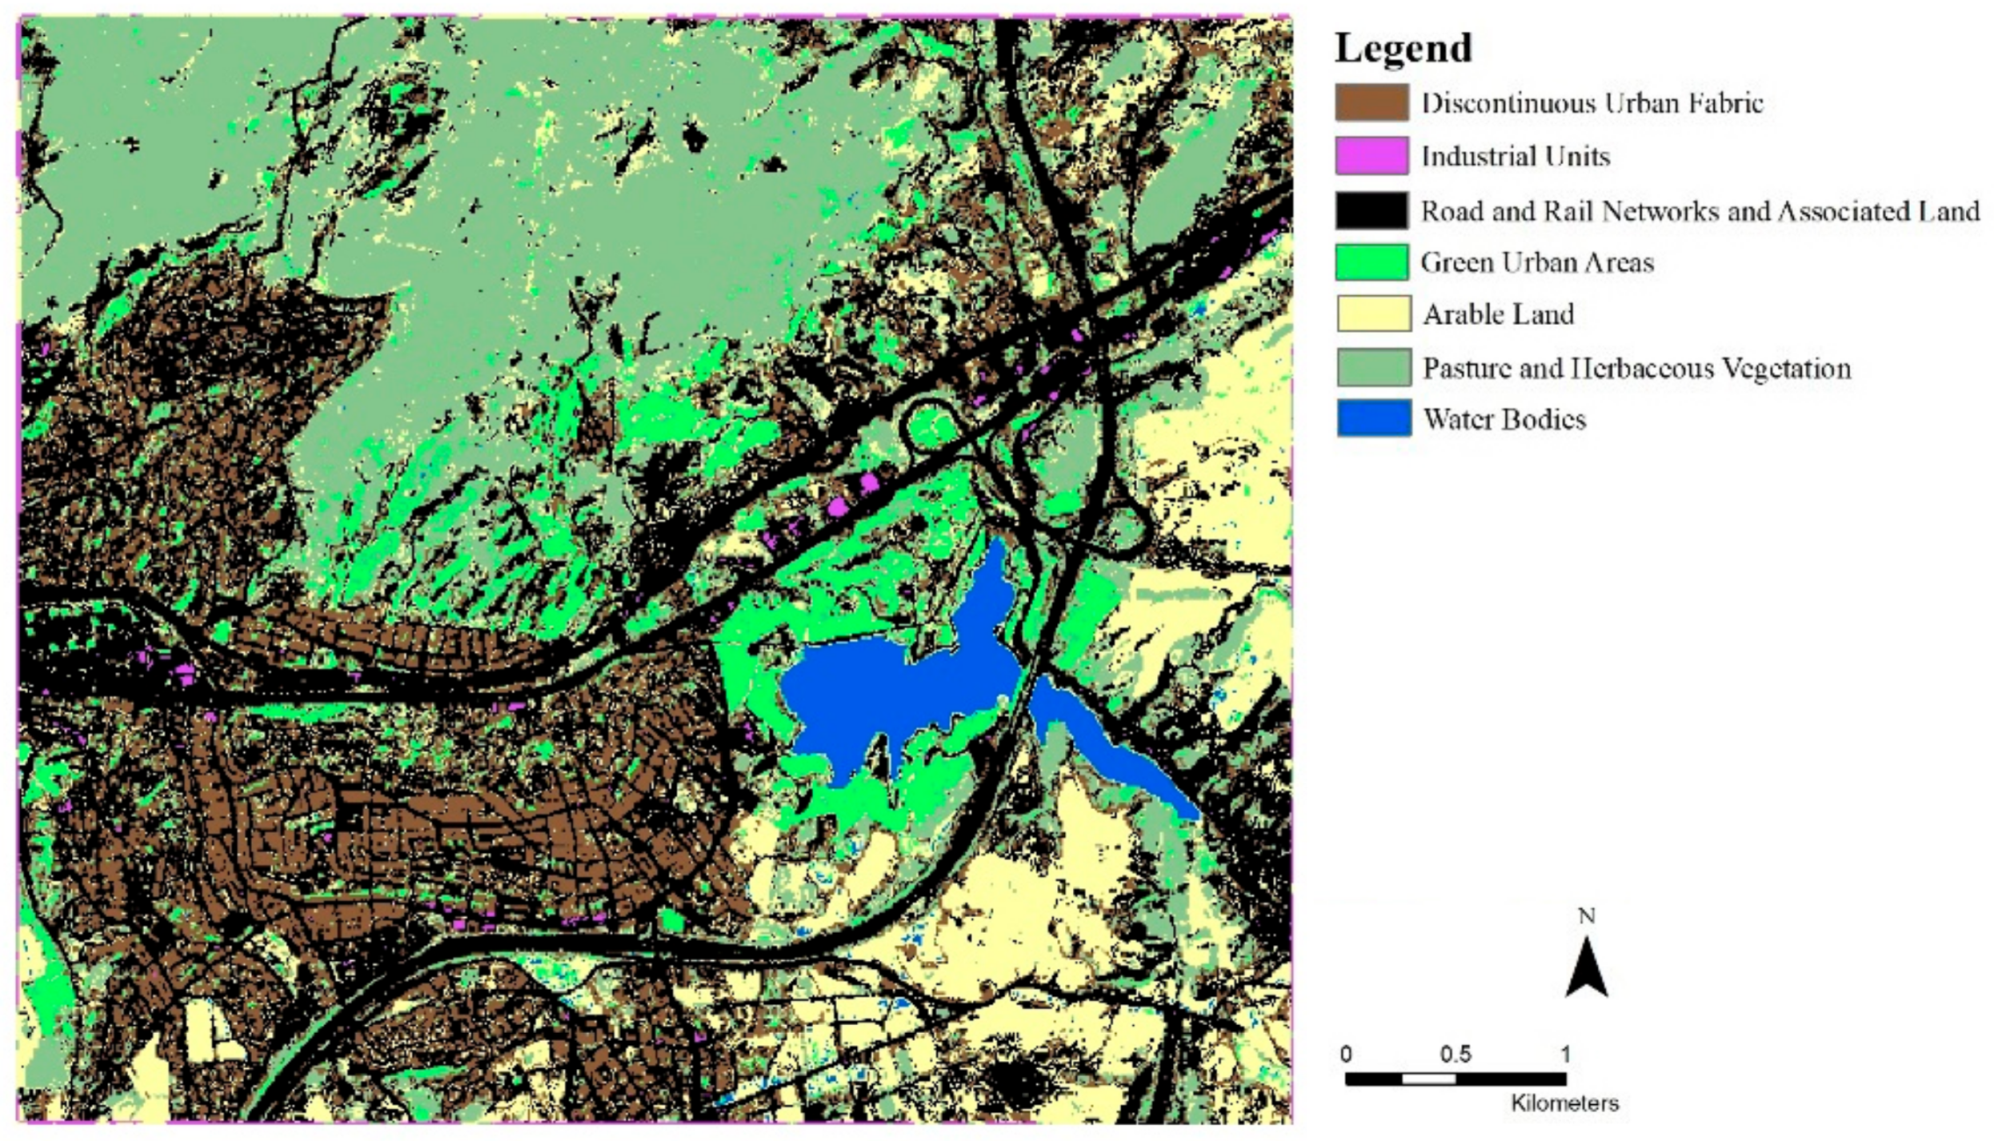
3.3. Land-Use and Land-Cover Extraction from Sentinel-2 Imagery
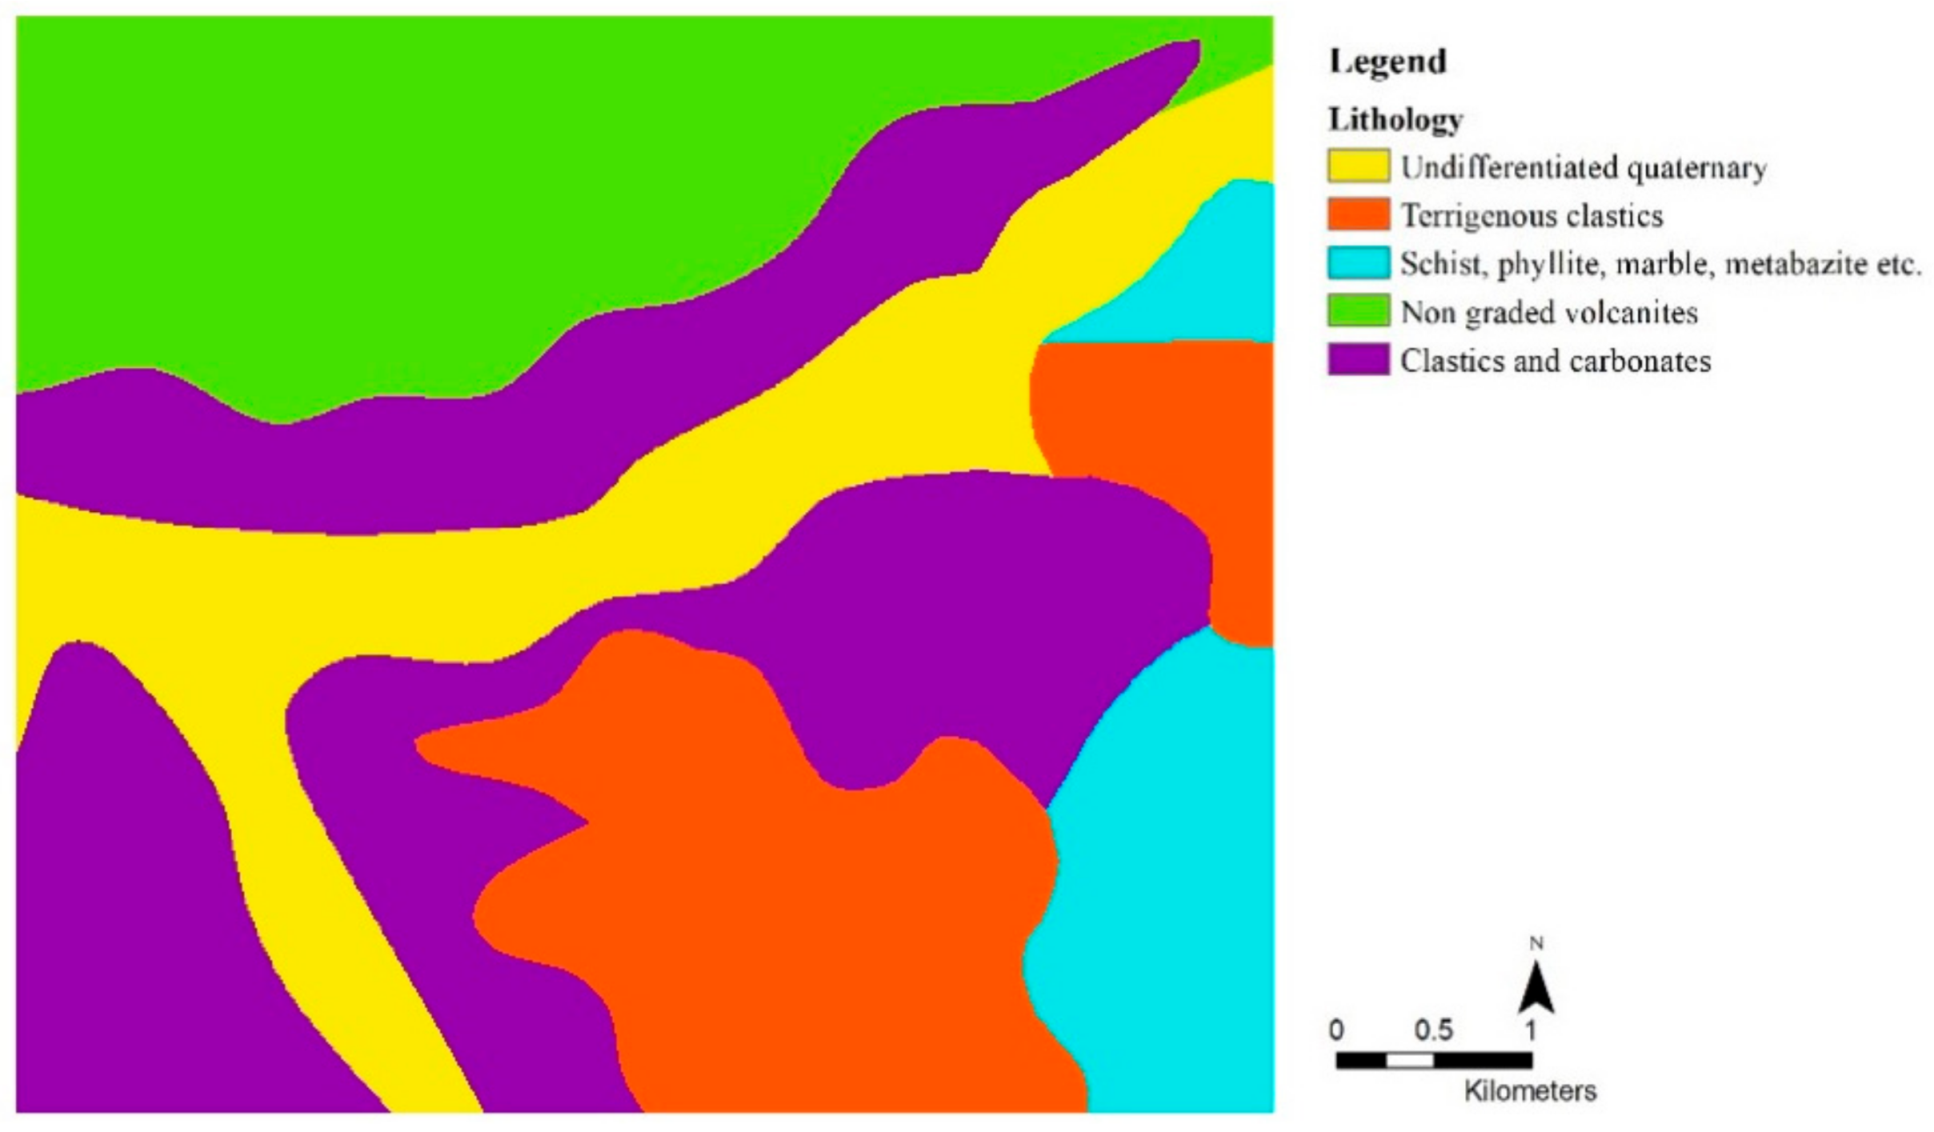
3.4. Lithological Characteristics of the Study Area
3.5. Landslide Susceptibility Map Production with Logistic Regression Method
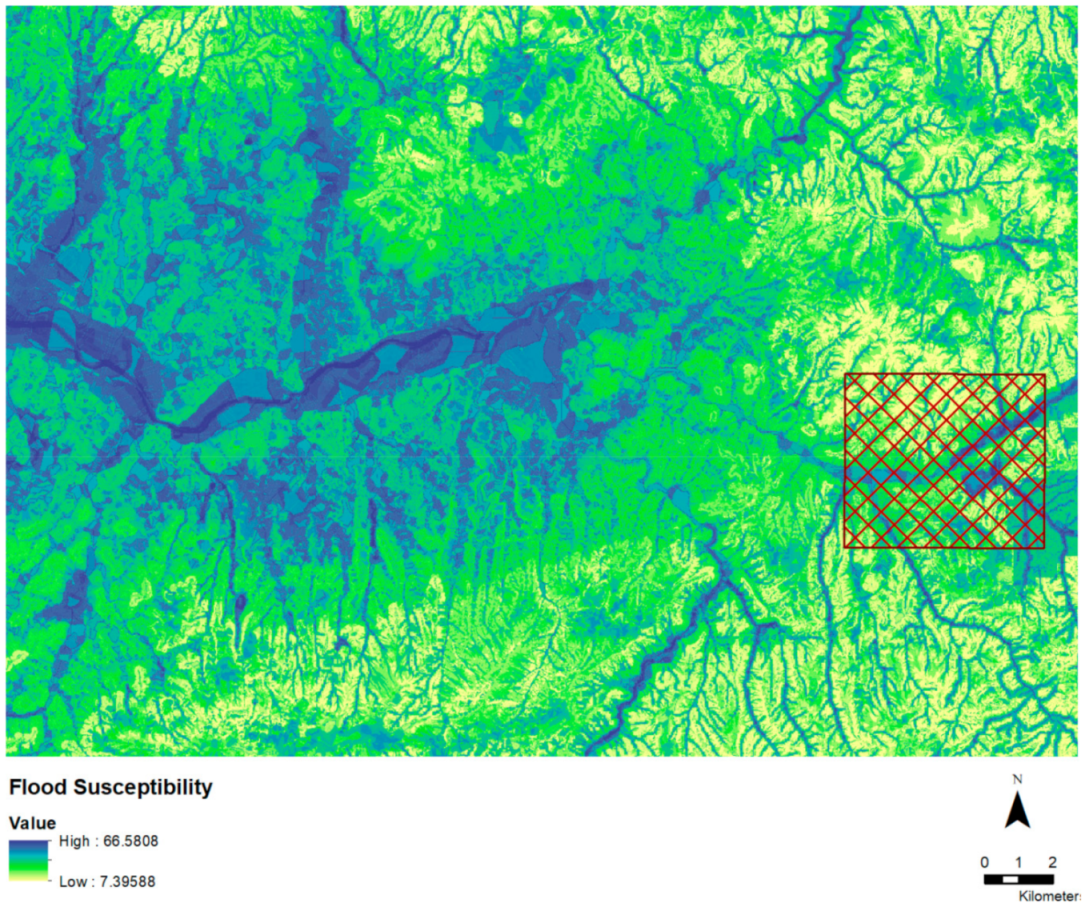
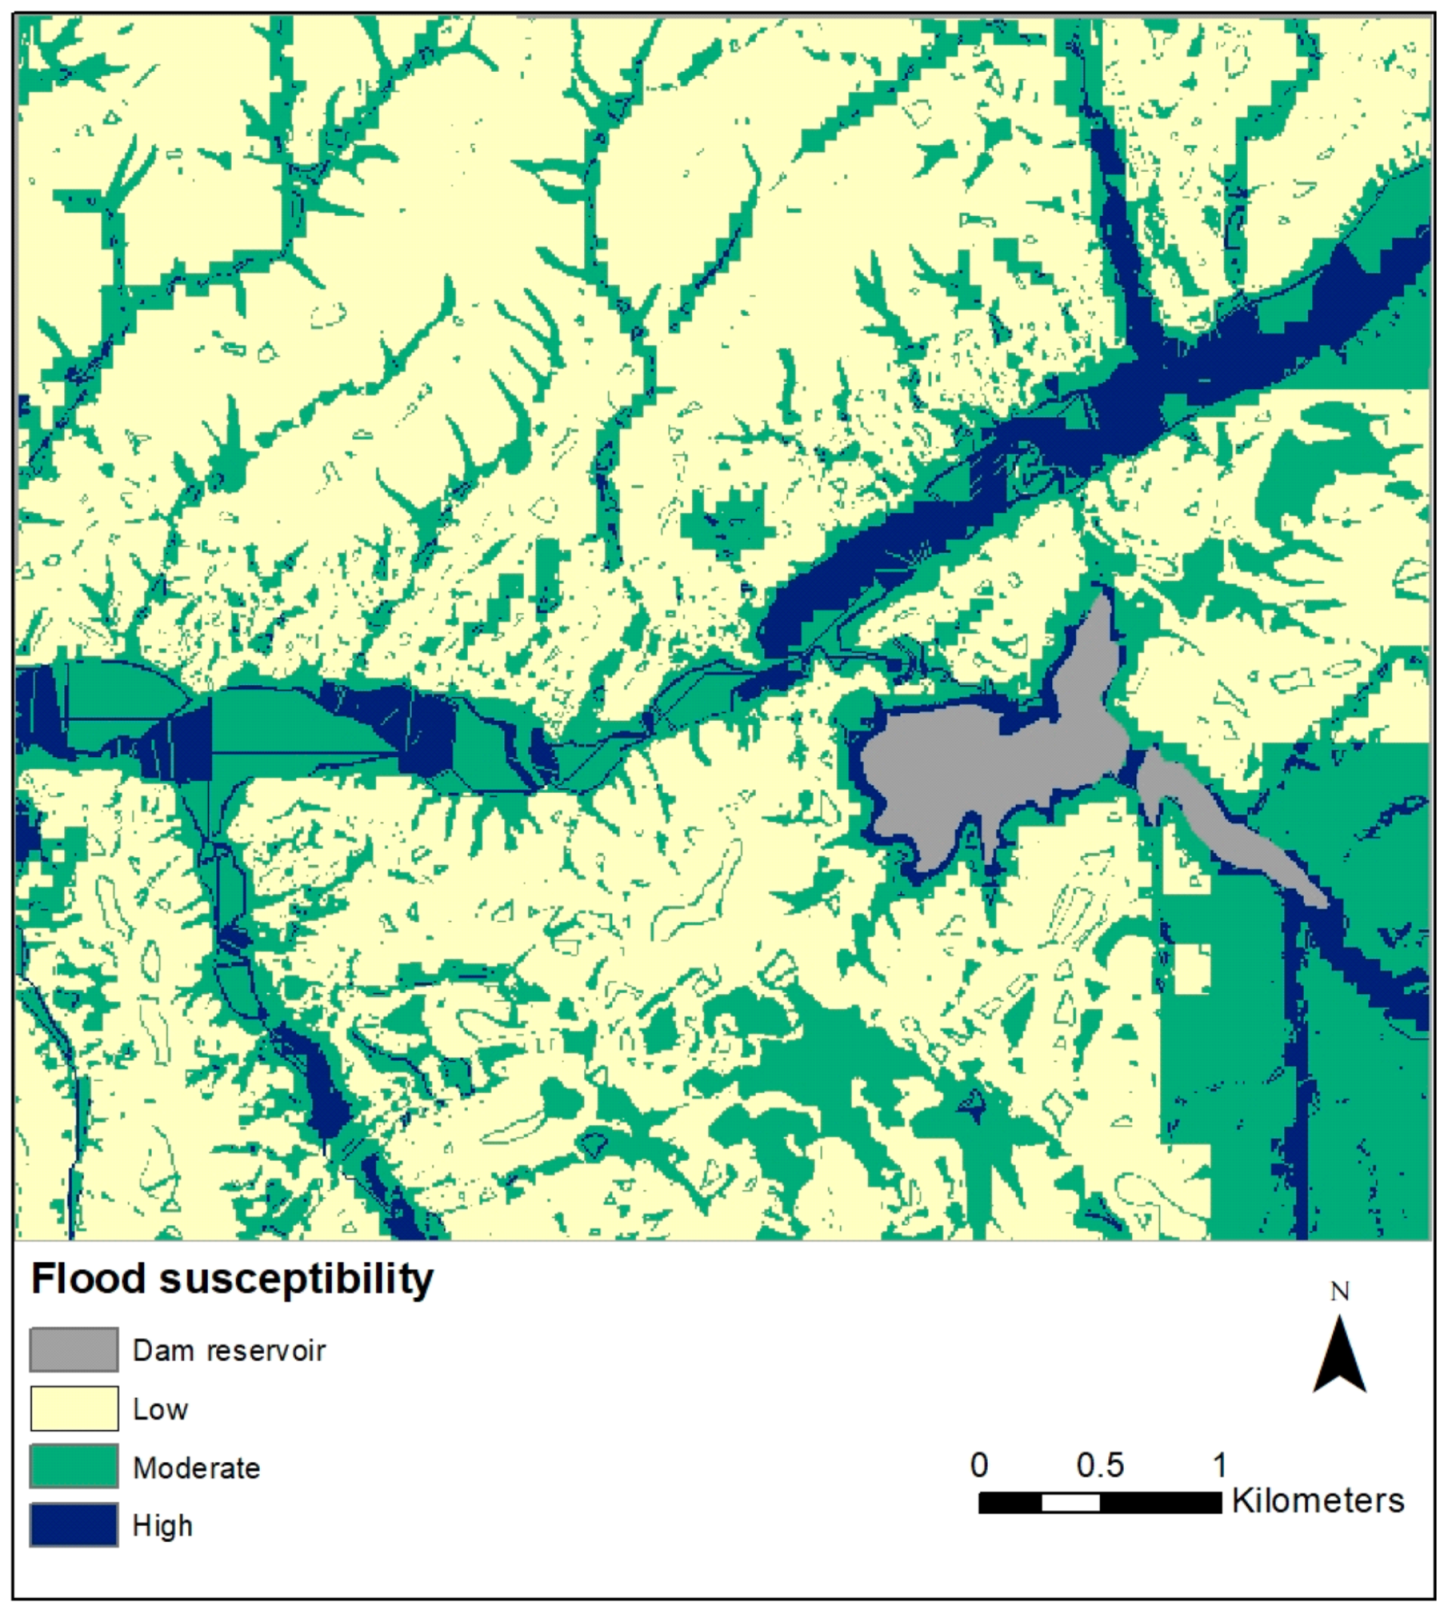
3.6. Flood Susceptibility Map of the Study Area
3.7. Multi-Hazard Susceptibility Assesment with Mamdani Fuzzy Method
4. Results and Discussion
4.1. The Landslide Susceptibility and MHSL Maps
4.2. Discussion
5. Conclusions
Author Contributions
Funding
Acknowledgments
Conflicts of Interest
References
- Kocaman, S.; Anbaroglu, B.; Gokceoglu, C.; Altan, O. A review on citizen science (CitSci) applications for disaster management. In International Archives of the Photogrammetry, Remote Sensing & Spatial Information Sciences, Proceedings of the Geoinformation for Disaster Management (Gi4DM) Conference, Istanbul, Turkey, 18–21 March 2018; ISPRS: Hannover, Germany, 2018; Volume XLII-3/W4, pp. 301–306. [Google Scholar] [CrossRef]
- Mulero, D.L.; Nja, O.; Fernandez, C.L. Landslide Risk Management in the Urban Development of Sandnes (Norway). In The International Archives of the Photogrammetry, Remote Sensing and Spatial Information Sciences, Proceedings of the Geoinformation for Disaster Management (Gi4DM) Conference, Istanbul, Turkey, 18–21 March 2018; ISPRS: Hannover, Germany, 2018; Volume XLII-3/W4, pp. 327–334. [Google Scholar] [CrossRef]
- Kocaman, S.; Gokceoglu, C. On the use of citsci and VGI in natural hazard assessment. In International Archives of the Photogrammetry, Remote Sensing & Spatial Information Sciences, Proceedings of the ISPRS TC V Mid-Term Symposium Geospatial Technology—Pixel to People, Dehradun, India, 20–24 November 2018; ISPRS: Hannover, Germany, 2018; Volume XLII-5, pp. 69–73. [Google Scholar] [CrossRef]
- Yanar, T.; Kocaman, S.; Gokceoglu, C. On The use of sentinel-2 images and high resolution DTM For landslide susceptibility mapping in a developing urban settlement (Mamak, Ankara, Turkey). In International Archives of the Photogrammetry, Remote Sensing & Spatial Information Sciences, Proceedings of the Geoinformation for Disaster Management (Gi4DM), Prague, Czech Republic, 3–6 September 2019; ISPRS: Hannover, Germany, 2019; Volume XLII-3/W8, pp. 469–476. [Google Scholar] [CrossRef]
- AFAD. Afet ve Acil Durum Yönetimi Başkanlığı. Available online: https://www.afad.gov.tr/ (accessed on 1 December 2019).
- Nefeslioglu, H.A.; San, B.T.; Gokceoglu, C.; Duman, T.Y. An assessment on the use of Terra ASTER L3A data in landslide susceptibility mapping. Int. J. Appl. Earth Obs. Geoinf. 2012, 14, 40–60. [Google Scholar] [CrossRef]
- Pham, B.T.; Shirzadi, A.; Tien Bui, D.; Prakash, I.; Dholakia, M. A hybrid machine learning ensemble approach based on a radial basis function neural network and rotation forest for landslide susceptibility modeling: A case study in the Himalayan area, India. Int. J. Sediment Res. 2018, 33, 157–170. [Google Scholar] [CrossRef]
- Gorum, T.; Gonencgil, B.; Gokceoglu, C.; Nefeslioglu, H.A. Implementation of reconstructed geomorphologic units in landslide susceptibility mapping: The Melen Gorge (NW Turkey). Nat. Hazards 2008, 46, 323–351. [Google Scholar] [CrossRef]
- Reichenbach, P.; Rossi, M.; Malamud, B.D.; Mihir, M.; Guzzetti, F. A review of statistically-based landslide susceptibility models. Earth Sci. Rev. 2018, 180, 60–91. [Google Scholar] [CrossRef]
- Sevgen, E.; Kocaman, S.; Nefeslioglu, H.A.; Gokceoglu, C. A novel performance assessment approach using photogrammetric techniques for landslide susceptibility mapping with logistic regression, ANN and random forest. Sensors 2019, 19, 3940. [Google Scholar] [CrossRef] [PubMed]
- Kocaman, S.; Gokceoglu, C. A CitSci app for landslide data collection. Landslides 2019, 16, 611–615. [Google Scholar] [CrossRef]
- Chen, L.; Guo, Z.; Yin, K.; Shrestha, D.P.; Jin, S. The influence of land use and land cover change on landslide susceptibility: A case study in Zhushan Town, Xuanen County (Hubei, China). Nat. Hazards Earth Syst. Sci. Discussions 2019. [Google Scholar] [CrossRef]
- Adhikari, P.; Hong, Y.; Douglas, K.R.; Kirschbaum, D.B.; Gourley, J.; Adler, R.; Brakenridge, G.R. A digitized global flood inventory (1998–2008): Compilation and preliminary results. Nat. Hazards 2010, 55, 405–422. [Google Scholar] [CrossRef]
- CRED. Natural Disasters 2017. Available online: https://cred.be/sites/default/files/adsr_2017.pdf (accessed on 1 December 2019).
- Gökçe, O.; Özden, Ş.; Demir, A. Türkiye’de Afetlerin Mekansal ve İstatistiksel Dağılımı Afet Bilgileri Envanteri; Bayındırlık ve İskân Bakanlığı: Ankara, Turkey, 2008. [Google Scholar]
- Perucca, L.P.; Angilieri, Y.E. Morphometric characterization of del Molle Basin applied to the evaluation of flash floods hazard, Iglesia Department, San Juan, Argentina. Quat. Int. 2011, 233, 81–86. [Google Scholar] [CrossRef]
- Scheuer, S.; Haase, D.; Meyer, V. Towards a flood risk assessment ontology—Knowledge integration into a multi-criteria risk assessment approach. Comput. Environ. Urban Syst. 2013, 37, 82–94. [Google Scholar] [CrossRef]
- Cunha, N.; Magalh, M.; Domingos, T.; Abreu, M.; Küpfer, C. The land morphology approach to flood risk mapping: An application to Portugal. J. Environ. Manag. 2017, 193, 172–187. [Google Scholar] [CrossRef] [PubMed]
- Sozer, B.; Kocaman, S.; Nefeslioglu, H.A.; Firat, O.; Gokceoglu, C. Preliminary investigations on flood susceptibility mapping in Ankara (Turkey) using modified analytical hierarchy process (M-AHP). Int. Arch. Photogramm. Remote Sens. Spat. Inf. Sci. 2018, 42, 5. [Google Scholar] [CrossRef]
- Sözer, B.; Kocaman, S.; Nefeslioğlu, H.A.; Fırat, O.; Gökçeoğlu, C. Değiştirilmiş AHP (M-AHP) yöntemi kullanilarak ankara için taşkin duyarlilik haritasi üretimi. Harit. Derg. 2019, 162, 12–24. [Google Scholar]
- Nefeslioglu, H.A.; Sezer, E.A.; Gokceoglu, C.; Ayas, Z. A Modified Analytical Hierarchy Process (M-AHP) approach for decision support systems in natural hazard assessments. Comput. Geosci. 2013, 59, 1–8. [Google Scholar] [CrossRef]
- Basheer Ahammed, K.K.; Pandey, A. Geoinformatics based assessment of coastal multi-hazard vulnerability along the East Coast of India. Spat. Inf. Res. 2019, 27, 295–307. [Google Scholar] [CrossRef]
- Bathrellos, G.; Skilodimou, H.; Chousianitis, K.; Youssef, A.; Pradhan, B. Suitability estimation for urban development using multi-hazard assessment map. Sci. Total Environ. 2017, 119–134. [Google Scholar] [CrossRef]
- Skilodimou, H.; Bathrellos, G.; Chousianitis, K.; Youssef, A.; Pradhan, B. Multi-hazard assessment modeling via multi-criteria analysis and GIS: A case study. Environ. Earth Sci. 2019, 78. [Google Scholar] [CrossRef]
- Bani-Mustafa, T.; Zeng, Z.; Zio, E.; Vasseur, D. A framework for multi-hazards risk aggregation considering risk model maturity levels. In Proceedings of the IEEE 2nd International Conference on System Reliability and Safety (ICSRS), Milan, Italy, 20–22 December 2017; pp. 429–433. [Google Scholar] [CrossRef]
- Furlan, E.; Torresan, S.; Critto, A.; Marcomini, A. Spatially explicit risk approach for multi-hazard assessment and management in marine environment: The case study of the Adriatic Sea. Sci. Total Environ. 2017, 618, 1008–1023. [Google Scholar] [CrossRef]
- Mukhopadhyay, A.; Hazra, S.; Mitra, D.; Hutton, C.; Chanda, A.; Mukherjee, S. Characterizing the multi-risk with respect to plausible natural hazards in the Balasore coast, Odisha, India: A multi-criteria analysis (MCA) appraisal. Nat. Hazards 2016, 80, 1495–1513. [Google Scholar] [CrossRef]
- Chen, L.; van Westen, C.J.; Hussin, H.; Ciurean, R.L.; Turkington, T.; Chavarro-Rincon, D.; Shrestha, D.P. Integrating expert opinion with modelling for quantitative multi-hazard risk assessment in the Eastern Italian Alps. Geomorphology 2016, 273, 150–167. [Google Scholar] [CrossRef]
- Ehlen, M.; Vargas, V. Multi-hazard, multi-infrastructure, economic scenario analysis. Environ. Syst. Decis. 2013, 33, 60–75. [Google Scholar] [CrossRef]
- Zhou, Y.; Liu, Y.; Wu, W.; Ning, L. Integrated risk assessment of multi-hazards in China. Nat. Hazards 2015, 78, 257–280. [Google Scholar] [CrossRef]
- Tian, C.; Yiping, F.; Yang, L.; Zhang, C. Spatial-temporal analysis of community resilience to multi-hazards in the Anning River basin, Southwest China. Int. J. Disaster Risk Reduct. 2019, 39, 101144. [Google Scholar] [CrossRef]
- Gill, J.; Malamud, B. Anthropogenic processes, natural hazards, and interactions in a multi-hazard framework. Earth Sci. Rev. 2017, 166, 246–269. [Google Scholar] [CrossRef]
- Gallina, V.; Torresan, S.; Critto, A.; Sperotto, A.; Glade, T.; Marcomini, A. A review of multi-risk methodologies for natural hazards: Consequences and challenges for a climate change impact assessment. J. Environ. Manag. 2015, 168, 123–132. [Google Scholar] [CrossRef] [PubMed]
- Barrantes, G. Multi-hazard model for developing countries. Nat. Hazards 2018, 92, 1081–1095. [Google Scholar] [CrossRef]
- Liu, B.; Siu, Y.L.; Mitchell, G. A quantitative model for estimating risk from multiple interacting natural hazards: An application to northeast Zhejiang, China. Stoch. Environ. Res. Risk Assess. 2016, 31, 1319–1340. [Google Scholar] [CrossRef]
- Bernal, G.; Salgado-Gálvez, M.; Zuloaga Romero, D.; Tristancho, J.; González, D.; Cardona, O. Integration of probabilistic and multi-hazard risk assessment within urban development planning and emergency preparedness and response: Application to Manizales, Colombia. Int. J. Disaster Risk Sci. 2017, 8, 270–283. [Google Scholar] [CrossRef]
- Micu, M.; Jurchescu, M.; Micu, D.; Zarea, R.; Zumpano, V.; Bălteanu, D. A morphogenetic insight into a multi-hazard analysis: Bâsca Mare landslide dam. Landslides 2014, 11, 1131–1139. [Google Scholar] [CrossRef]
- Tilloy, A.; Malamud, B.; Winter, H.; Joly-Laugel, A. A review of quantification methodologies for multi-hazard interrelationships. Earth Sci. Rev. 2019, 196, 102881. [Google Scholar] [CrossRef]
- Chang, S.; Yip, J.; Tse, W. Effects of urban development on future multi-hazard risk: The case of Vancouver, Canada. Nat. Hazards 2018, 98, 251–265. [Google Scholar] [CrossRef]
- Mafi Gholami, D.; Zenner, E.; Jaafari, A.; Riyahi Bakhtyari, H.R.; Tien Bui, D. Multi-hazards vulnerability assessment of southern coasts of Iran. J. Environ. Manag. 2019, 252, 109628. [Google Scholar] [CrossRef] [PubMed]
- Fell, R.; Jordi, C.; Christophe, B.; Leonardo, C.; Eric, L.; William, Z.S. Guidelines for landslide susceptibility, hazard and risk zoning for land use planning. Eng. Geol. 2008, 102, 85–98. [Google Scholar] [CrossRef]
- Jacobs, L.; Maes, J.; Mertens, K.; Sekajugo, J.; Thiery, W.; Lipzig, N.; Poesen, J.; Kervyn, M.; Dewitte, O. Reconstruction of a flash flood event through a multi-hazard approach: Focus on the Rwenzori Mountains, Uganda. Nat. Hazards 2016, 84, 851–876. [Google Scholar] [CrossRef]
- Kappes, M.; Papathoma-Köhle, M.; Keiler, M. Assessing physical vulnerability for multi-hazards using an indicator-based methodology. Appl. Geogr. 2012, 32, 577–590. [Google Scholar] [CrossRef]
- Omidvar, B.; Karimi, H. Multi-hazard failure probability analysis of gas pipelines for earthquake shaking, ground failure and fire following earthquake. Nat. Hazards 2016, 82, 703–720. [Google Scholar] [CrossRef]
- Liu, K.; Wang, M.; Cao, Y.; Zhu, W.; Yang, G. Susceptibility of existing and planned Chinese railway system subjected to rainfall-induced multi-hazards. Transp. Res. Part A Policy Pract. 2018, 117, 214–226. [Google Scholar] [CrossRef]
- Mirzaei, G.; Soltani, A.; Soltani, M.; Darabi, M. An integrated data-mining and multi-criteria decision-making approach for hazard-based object ranking with a focus on landslides and floods. Environ. Earth Sci. 2018, 77, 581. [Google Scholar] [CrossRef]
- Sheikh, V.; Kornejady, A.; Ownegh, M. Application of the coupled TOPSIS-mahalanobis distance for multi-hazard-based management of the target districts of the Golestan Province, Iran. Nat. Hazards 2019, 96, 1335–1365. [Google Scholar] [CrossRef]
- Pourghasemi, H.R.; Gayen, A.; Panahi, M.; Rezaie, F.; Blaschke, T. Multi-hazard probability assessment and mapping in Iran. Sci. Total Environ. 2019, 692, 556–571. [Google Scholar] [CrossRef]
- Araya-Munoz, D.; Metzger, M.; Stuart, N.; Wilson, A.; Carvajal, D. A spatial fuzzy logic approach to urban multi-hazard impact assessment in Concepción, Chile. Sci. Total Environ. 2017, 576, 508–519. [Google Scholar] [CrossRef] [PubMed]
- Kappes, M.S.; Keiler, M.; von Elverfeldt, K.; Glade, T. Challenges of analyzing multi-hazard risk: A review. Nat. Hazards 2012, 64, 1925–1958. [Google Scholar] [CrossRef]
- ESA. Sentinel-2. Available online: https://sentinel.esa.int/web/sentinel/missions/sentinel-2 (accessed on 27 January 2019).
- ESA. Sentinel-2 Coverage Map. Available online: https://sentinel.esa.int/web/sentinel/user-guides/sentinel-2-msi/revisit-coverage (accessed on 27 January 2019).
- Poursanidis, D.; Chrysoulakis, N. Remote Sensing, Natural Hazards and the Contribution of ESA Sentinels Missions. Remote Sens. Appl. Soc. Environ. 2017, 6, 25–38. [Google Scholar] [CrossRef]
- Akbaş, B.; Akdeniz, N.; Aksay, A.; Altun, İ.; Balcı, V.; Bilginer, E.; Bilgiç, T.; Duru, M.; Ercan, T.; Gedik, İ.; et al. Diğerleri Türkiye Jeoloji Haritasi; Maden Tetkik ve Arama Genel Müdürlüğü Yayını: Ankara, Turkey, 2002; Available online: http://yerbilimleri.mta.gov.tr/ (accessed on 20 July 2018).
- Moore, I.D.; Grayson, R.B.; Ladson, A.R. Digital terrain modelling: A review of hydrological, geomorphological, and biological applications. Hydrol. Process. 1991, 5, 3–30. [Google Scholar] [CrossRef]
- SAGA GIS. System for Automated Geoscientific Analyses. Available online: www.saga-gis.org (accessed on 20 July 2019).
- ESRI. Environmental Systems Research Institute, Inc. Available online: https://www.esri.com/ (accessed on 20 July 2018).
- Wilson, J.P.; Gallant, J.C. Terrain Analysis: Principles and Applications; John Wiley and Sons, Inc.: Ottawa, ON, Canada, 2000. [Google Scholar]
- Budimir, M.; Atkinson, P.; Lewis, H. Seismically induced landslide hazard and exposure modelling in Southern California based on the 1994 Northridge, California earthquake event. Landslides 2014, 12, 1–16. [Google Scholar] [CrossRef]
- Zakerinejad, R.; Maerker, M. An integrated assessment of soil erosion dynamics with special emphasis on gully erosion in the Mazayjan basin, southwestern Iran. Nat. Hazards 2015, 79, 25–50. [Google Scholar] [CrossRef]
- Kakembo, V.; Xanga, W.W.; Rowntree, K. Topographic thresholds in gully development on the hillslopes of communal areas in Ngqushwa local municipality, Eastern Cape, South Africa. Geomorphology 2009, 110, 188–194. [Google Scholar] [CrossRef]
- Samia, J.; Temme, A.; Bregt, A.; Wallinga, J.; Guzzetti, F.; Ardizzone, F.; Rossi, M. Characterization and quantification of path dependency in landslide susceptibility. Geomorphology 2017, 292, 16–24. [Google Scholar] [CrossRef]
- Breiman, L. Random forests. Mach. Learn. 2001, 45, 5–32. [Google Scholar] [CrossRef]
- Belgiu, M.; Drăguţ, L. Random forest in remote sensing: A review of applications and future directions. ISPRS J. Photogramm. Remote Sens. 2016, 114, 24–31. [Google Scholar] [CrossRef]
- Stefanski, J.; Mack, B.; Waske, O. Optimization of object-based image analysis with random forests for land cover mapping. IEEE J. Sel. Top. Appl. Earth Obs. Remote Sens. 2013, 6, 2492–2504. [Google Scholar] [CrossRef]
- Yoo, C.; Han, D.; Im, J.; Bechtel, B. Comparison between convolutional neural networks and random forest for local climate zone classification in mega urban areas using Landsat images. ISPRS J. Photogramm. Remote Sens. 2019, 157, 155–170. [Google Scholar] [CrossRef]
- Ma, L.; Li, M.; Ma, X.; Cheng, L.; Du, P.; Liu, Y. A review of supervised object-based land-cover image classification. ISPRS J. Photogramm. Remote Sens. 2017, 130, 277–293. [Google Scholar] [CrossRef]
- Lim, J.; Kim, K.; Jin, R. Tree species classification using hyperion and sentinel-2 data with machine learning in south Korea and China. Int. J. Geo Inf. 2019, 8, 150. [Google Scholar] [CrossRef]
- Guo, L.; Chehata, N.; Mallet, C.; Boukir, S. Relevance of airborne lidar and multispectral image data for urban scene classification using Random Forests. ISPRS J. Photogramm. Remote Sens. 2011, 66, 56–66. [Google Scholar] [CrossRef]
- Stumpf, A.; Kerle, N. Object-oriented mapping of landslides using random forests. Remote Sens. Environ. 2011, 115, 2564–2577. [Google Scholar] [CrossRef]
- Pourghasemi, H.R.; Kerle, N. Random forests and evidential belief function-based landslide susceptibility assessment in Western Mazandaran Province, Iran. Environ. Earth Sci. 2016, 75. [Google Scholar] [CrossRef]
- Ayalew, L.; Yamagishi, H. The application of GIS-based logistic regression for landslide susceptibility mapping in the Kakuda-Yahiko Mountains, Central Japan. Geomorphology 2005, 65, 15–31. [Google Scholar] [CrossRef]
- Lee, S. Application of logistic regression model and its validation for landslide susceptibility mapping using GIS and remote sensing data. Int. J. Remote Sens. 2005, 26, 1477–1491. [Google Scholar] [CrossRef]
- Duman, T.Y.; Can, T.; Gokceoglu, C.; Nefeslioglu, H.A.; Sonmez, H. Application of logistic regression for landslide susceptibility zoning of Cekmece Area, Istanbul, Turkey. Environ. Geol. 2006, 51, 241–256. [Google Scholar] [CrossRef]
- Wang, H.B.; Sassa, K. Comparative evaluation of landslide susceptibility in Minamata area, Japan. Environ. Geol. 2005, 47, 956–966. [Google Scholar] [CrossRef]
- Bai, S.-B.; Wang, J.; Lü, G.-N.; Zhou, P.-G.; Hou, S.-S.; Xu, S.-N. GIS-based logistic regression for landslide susceptibility mapping of the Zhongxian segment in the Three Gorges area, China. Geomorphology 2010, 115, 23–31. [Google Scholar] [CrossRef]
- Das, I.; Sahoo, S.; Van Westen, C.; Stein, A.; Hack, R. Landslide susceptibility assessment using logistic regression and its comparison with a rock mass classification system, along a road section in the northern Himalayas (India). Geomorphology 2010, 114, 627–637. [Google Scholar] [CrossRef]
- Nefeslioglu, H.A.; Gokceoglu, C. Probabilistic risk assessment in medium scale for rainfall-induced earthflows: Catakli catchment area (Cayeli, Rize, Turkey). Math. Probl. Eng. 2011. [Google Scholar] [CrossRef]
- Lee, S.; Pradhan, B. Landslide hazard mapping at Selangor, Malaysia using frequency ratio and logistic regression models. Landslides 2006, 4, 33–41. [Google Scholar] [CrossRef]
- Vorpahl, P.; Elsenbeer, H.; Märker, M.; Schröder, B. How can statistical models help to determine driving factors of landslides? Ecol. Model. 2012, 239, 27–39. [Google Scholar] [CrossRef]
- Park, S.; Choi, C.; Kim, B.; Kim, J. Landslide susceptibility mapping using frequency ratio, analytic hierarchy process, logistic regression, and artificial neural network methods at the Inje area, Korea. Environ. Earth Sci. 2012, 68, 1443–1464. [Google Scholar] [CrossRef]
- Mamdani, E.H.; Assilian, S. Experiment in linguistic synthesis with a fuzzy logic controller. Int. J. Man Mach. Stud. 1975, 7, 1–13. [Google Scholar] [CrossRef]
- Zadeh, L.A. Fuzzy sets. Inf. Control 1965, 8, 338–353. [Google Scholar] [CrossRef]
- Grima, M.A. Neuro-Fuzzy Modeling in Engineering Geology; A.A. Balkema: Rotterdam, The Netherlands, 2000; p. 244. Available online: https://books.google.com.tr/books/about/Neuro_fuzzy_Modeling_in_Engineering_Geol.html?id=PJ6VQgAACAAJ&source=kp_cover&redir_esc=y (accessed on 17 February 2020).
- Gokceoglu, C.; Zorlu, K. A fuzzy model to predict the uniaxial compressive strength and the modulus of elasticity of a problematic rock. Eng. Appl. Artif. Intell. 2004, 17, 61–72. [Google Scholar] [CrossRef]
- Akgun, A.; Sezer, E.A.; Nefeslioglu, H.A.; Gokceoglu, C.; Pradhan, B. An easy-to-use MATLAB program (MamLand) for the assessment of landslide susceptibility using a Mamdani fuzzy algorithm. Comput. Geosci. 2012, 38, 23–34. [Google Scholar] [CrossRef]
- Osna, T.; Sezer, E.A.; Akgun, A. GeoFIS: An integrated tool for the assessment of landslide susceptibility. Comput. Geosci. 2014, 66, 20–30. [Google Scholar] [CrossRef]
- Sezer, E.A.; Nefeslioglu, H.A.; Osna, T. An expert-based landslide susceptibility mapping (LSM) module developed for Netcad Architect Software. Comput. Geosci. 2017, 98, 26–37. [Google Scholar] [CrossRef]
- Ozer, B.C.; Mutlu, B.; Nefeslioglu, H.; Sezer, E.; Rouai, M.; Dekayir, A.; Gokceoglu, C. On the use of hierarchical fuzzy inference systems (HFIS) in expert-based landslide susceptibility mapping: The central part of the Rif Mountains (Morocco). Bull. Eng. Geol. Environ. 2020, 79, 551–568. [Google Scholar] [CrossRef]
- Zadeh, L.A. A Rationale for fuzzy control. J. Dyn. Syst. Meas. Control Trans. ASME 1972, 94, 3–4. [Google Scholar] [CrossRef]
- Hadipriono, F.; Sun, K. Angular fuzzy set models for linguistic values. Civ. Eng. Syst. 1990, 7, 148–156. [Google Scholar] [CrossRef]
- Karr, C.L.; Gentry, E.J. Fuzzy control of pH using genetic algorithms. IEEE Trans. Fuzzy Syst. 1993, 1, 46–53. [Google Scholar] [CrossRef]
- Perlich, C.; Provost, F.; Simonoff, J. Tree induction vs. logistic regression: A learning-curve analysis. J. Mach. Learn. Res. 2003, 4, 211–255. [Google Scholar] [CrossRef][Green Version]
- Belediyesi, M. Mamak Belediyesi 2018 Yılı İdare Faaliyet Raporu. Available online: https://www.mamak.bel.tr/wp-content/uploads/2017/03/2018-faaliyet.pdf (accessed on 20 July 2019).
- QT Modeler. Available online: http://appliedimagery.com/ (accessed on 29 December 2019).


| Parameters | Source | Resolution |
|---|---|---|
| Geomorphological parameters | DTM | 5 m |
| LULC | Sentinel-2 satellite imagery | 10 m (resampled to 5 m) |
| Lithology | GDMRE/MTA | 5 m |
| Landslide susceptibility map | Produced in the study | 5 m |
| Attribute Name | Minimum | Maximum | Mean | SD |
|---|---|---|---|---|
| Altitude (m) | 924.1 | 1284.7 | 1032.2 | 62.8 |
| Slope (°) | 0.004 | 73.127 | 13.075 | 8.719 |
| Aspect (°) | 0 | 360 | 192.23 | 101.46 |
| General curvature | −1.25957 | 1.09325 | −9.73 × 10⁻⁵ | 0.05887 |
| Plan curvature | −0.09291 | 0.14917 | 4.56 × 10⁻⁴ | 9.69 × 10⁻³ |
| Profile curvature | −0.16431 | 0.16666 | −5.05 × 10⁻⁴ | 0.01107 |
| SPI | 0 | 3,315,271.5 | 688.02 | 14,974.51 |
| TWI | 1.2776 | 22.1526 | 5.8651 | 2.1451 |
| Distance to channel (m) | 0.4 | 561.9 | 84.2 | 73.8 |
| Distance to ridgeline (m) | 0.0 | 229.9 | 33.0 | 26.5 |
| Attribute Name | Minimum | Maximum | Mean | SD |
|---|---|---|---|---|
| Altitude (m) | 934.4 | 1050.4 | 986.5 | 30.7 |
| Slope (°) | 0.560 | 39.793 | 20.171 | 7.949 |
| Aspect (°) | 0.64 | 359.59 | 233.03 | 80.38 |
| General curvature | −0.369 | 0.388 | −0.0094 | 0.0943 |
| Plan curvature | −0.0717 | 0.0493 | −0.00418 | 0.0187 |
| Profile curvature | −0.05139 | 0.04435 | −0.00454 | 0.0139 |
| SPI | 0.362 | 9091.607 | 319.292 | 814.8529 |
| TWI | 2.2736 | 15.33 | 5.197 | 1.719 |
| Distance to channel (m) | 0.4 | 142.3 | 44.1 | 40.7 |
| Distance to ridgeline (m) | 0.0 | 50.4 | 15.7 | 10.9 |
| Land Use | Number of Training Samples | Classification Accuracy (Cross-Validation) (with ASM Band) | Classification Accuracy (Cross-Validation) (without ASM Band) |
|---|---|---|---|
| Discontinuous urban fabric | 401 | 98.75% | 94.01% |
| Industrial units | 36 | 98.84% | 98.94% |
| Road and rail networks and associated land | 811 | 97.10% | 94.4% |
| Green urban areas | 146 | 99.71% | 97.88% |
| Arable land | 325 | 98.75% | 96.72% |
| Pasture and herbaceous vegetation | 125 | 98.65% | 96.14% |
| Water bodies | 233 | 99.81% | 99.71% |
| Overall | 2077 | 93.7259% | 83.1081% |
| Kappa coefficient | 97.13% | 93.68% |
| Age | Description |
|---|---|
| Pliocene | Terrigenous clastics |
| Quaternary | Undifferentiated quaternary |
| Permian–Triassic | Clastics and carbonates |
| Upper Paleozoic Triassic | Schist, phyllite, marble, metabazite etc. |
| Lower–Middle Miocene | Non-graded volcanites |
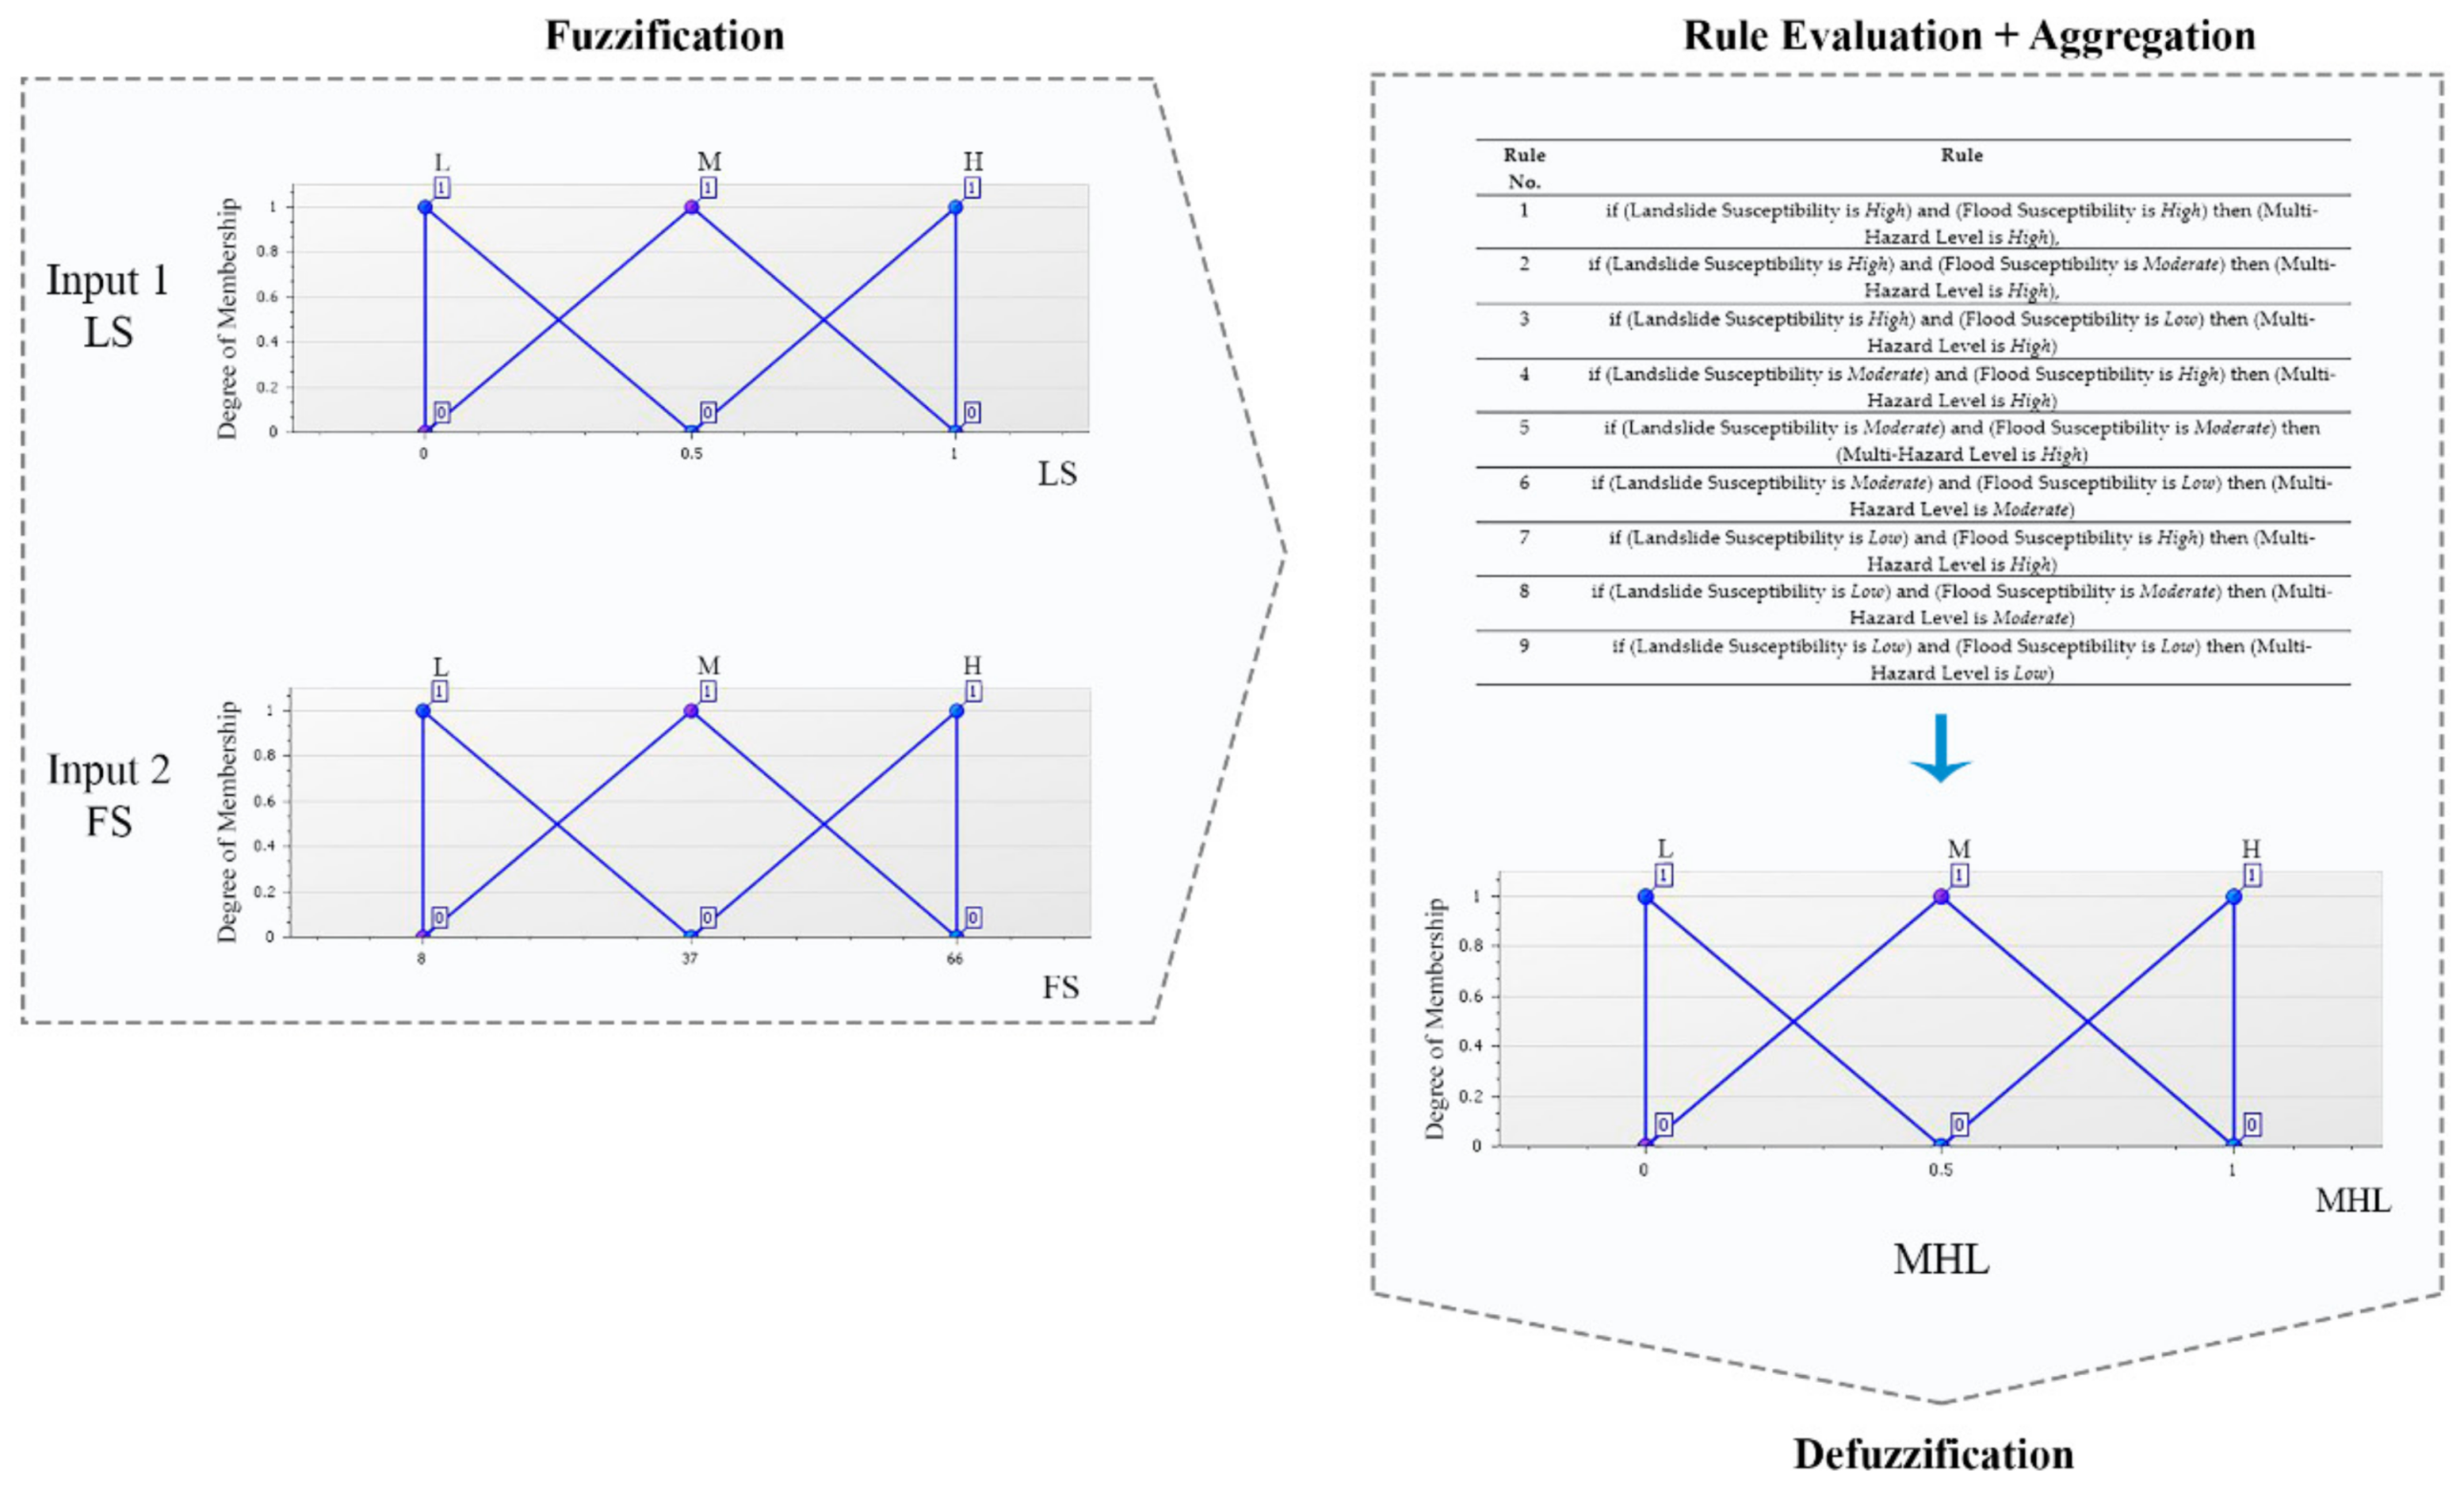
| Rule No. | Rule |
|---|---|
| 1 | If (landslide susceptibility is high) and (flood susceptibility is high), then (MHSL level is high), |
| 2 | If (landslide susceptibility is high) and (flood susceptibility is moderate), then (MHSL is high), |
| 3 | If (landslide susceptibility is high) and (flood susceptibility is low), then (MHSL is high) |
| 4 | If (landslide susceptibility is moderate) and (flood susceptibility is high), then (MHSL is high) |
| 5 | If (landslide susceptibility is moderate) and (flood susceptibility is moderate), then (MHSL is high) |
| 6 | If (landslide susceptibility is moderate) and (flood susceptibility is low), then (MHSL is moderate) |
| 7 | If (landslide susceptibility is low) and (flood susceptibility is high), then (MHSL is high) |
| 8 | If (landslide susceptibility is low) and (flood susceptibility is moderate), then (MHSL is moderate) |
| 9 | If (landslide susceptibility is low) and (flood susceptibility is low), then (MHSL is low) |
© 2020 by the authors. Licensee MDPI, Basel, Switzerland. This article is an open access article distributed under the terms and conditions of the Creative Commons Attribution (CC BY) license (http://creativecommons.org/licenses/by/4.0/).
Share and Cite
Yanar, T.; Kocaman, S.; Gokceoglu, C. Use of Mamdani Fuzzy Algorithm for Multi-Hazard Susceptibility Assessment in a Developing Urban Settlement (Mamak, Ankara, Turkey). ISPRS Int. J. Geo-Inf. 2020, 9, 114. https://doi.org/10.3390/ijgi9020114
Yanar T, Kocaman S, Gokceoglu C. Use of Mamdani Fuzzy Algorithm for Multi-Hazard Susceptibility Assessment in a Developing Urban Settlement (Mamak, Ankara, Turkey). ISPRS International Journal of Geo-Information. 2020; 9(2):114. https://doi.org/10.3390/ijgi9020114
Chicago/Turabian StyleYanar, Tugce, Sultan Kocaman, and Candan Gokceoglu. 2020. "Use of Mamdani Fuzzy Algorithm for Multi-Hazard Susceptibility Assessment in a Developing Urban Settlement (Mamak, Ankara, Turkey)" ISPRS International Journal of Geo-Information 9, no. 2: 114. https://doi.org/10.3390/ijgi9020114
APA StyleYanar, T., Kocaman, S., & Gokceoglu, C. (2020). Use of Mamdani Fuzzy Algorithm for Multi-Hazard Susceptibility Assessment in a Developing Urban Settlement (Mamak, Ankara, Turkey). ISPRS International Journal of Geo-Information, 9(2), 114. https://doi.org/10.3390/ijgi9020114