Understanding Spatiotemporal Variations of Ridership by Multiple Taxi Services


Abstract
1. Introduction
2. Literature Review
2.1. Taxi Ridership Estimation
2.2. Treatment Effects and Spatial Heterogeneity
3. Methodology
3.1. Causal Inference
3.2. Geographically Weighted Panel Regression
3.3. Estimation
- 1)
- Select a local bandwidth and generate weighting matrix at spatial unit i;
- 2)
- Subsample observed data for local estimation at spatial unit i;
- 3)
- Weight all observations of j’s variables with weighting matrix ;
- 4)
- Apply fixed effect model to the weighted subsample data;
- 5)
- Iterate over step 1 to 4 for an optimal local bandwidth through checking Akaike Information Criterion (AIC);
- 6)
- Iterate over step 1 to 5 for all spatial units.
4. Data and Case Design
4.1. Case 1: Long-Term Effects of Presence of App-Based Taxi Services on Daily Ridership
4.2. Case 2: Short-Term Effects of Dynamic Pricing on Hourly Ridership
5. Empirical Findings
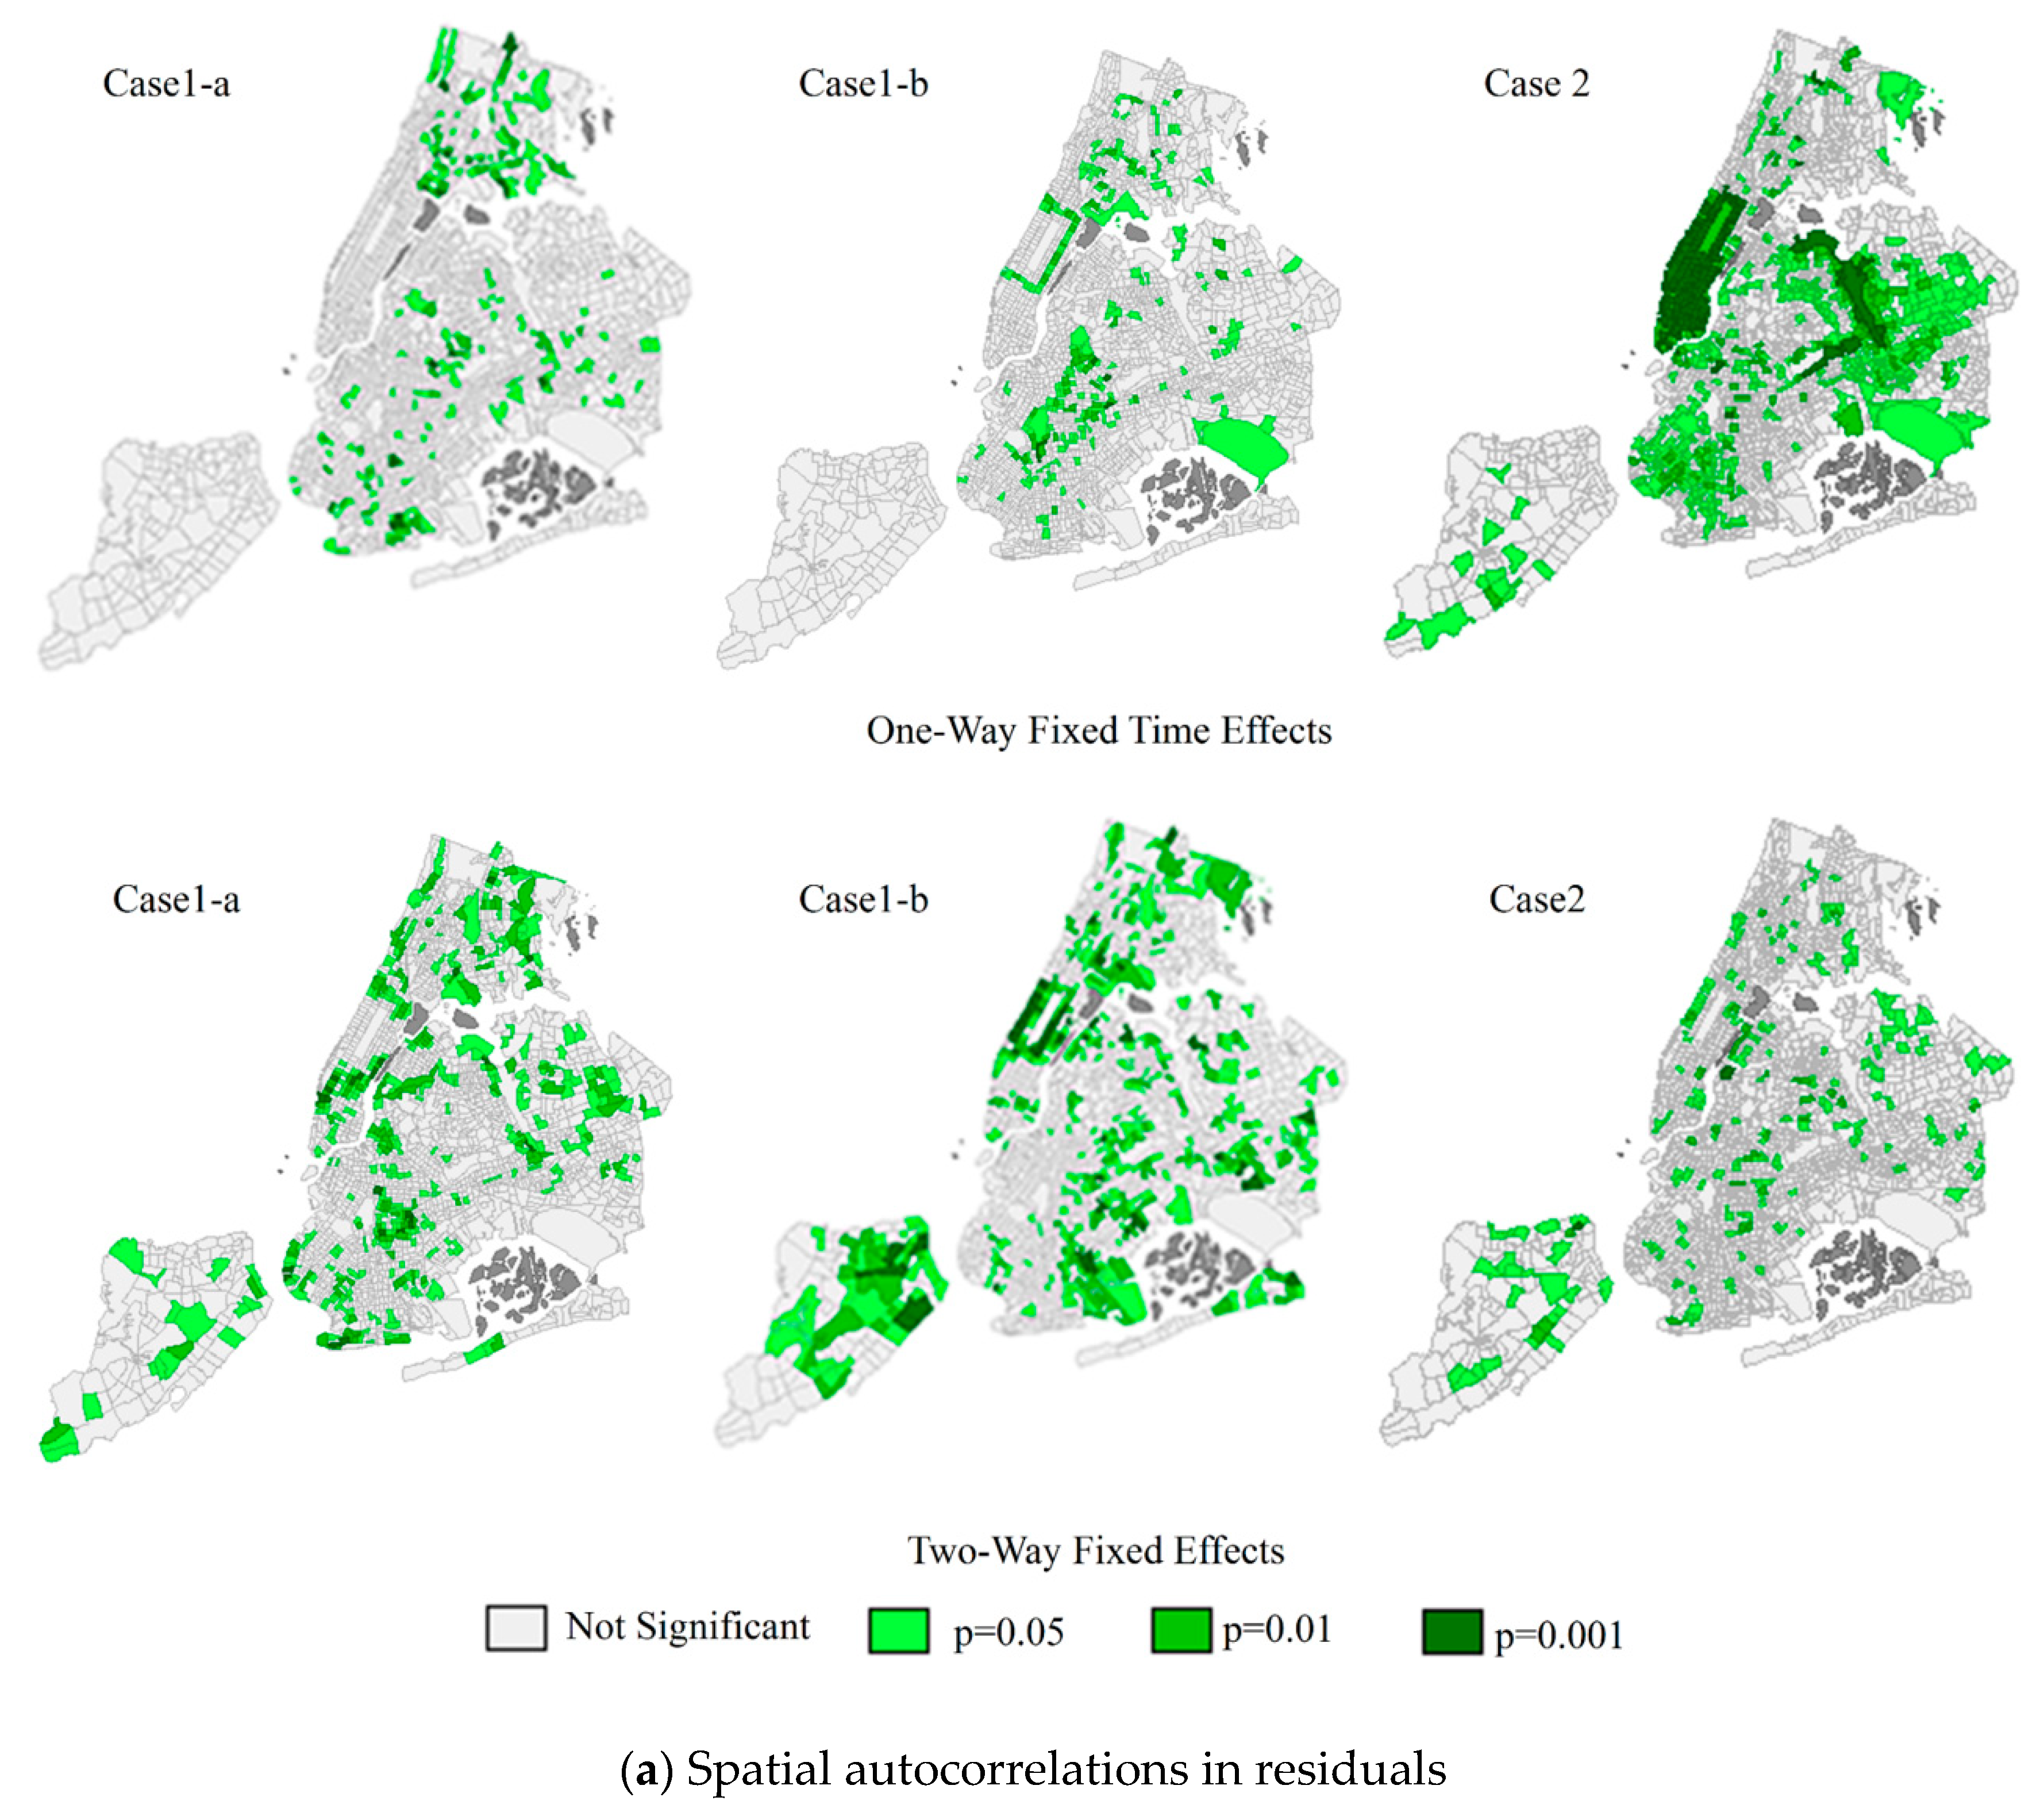
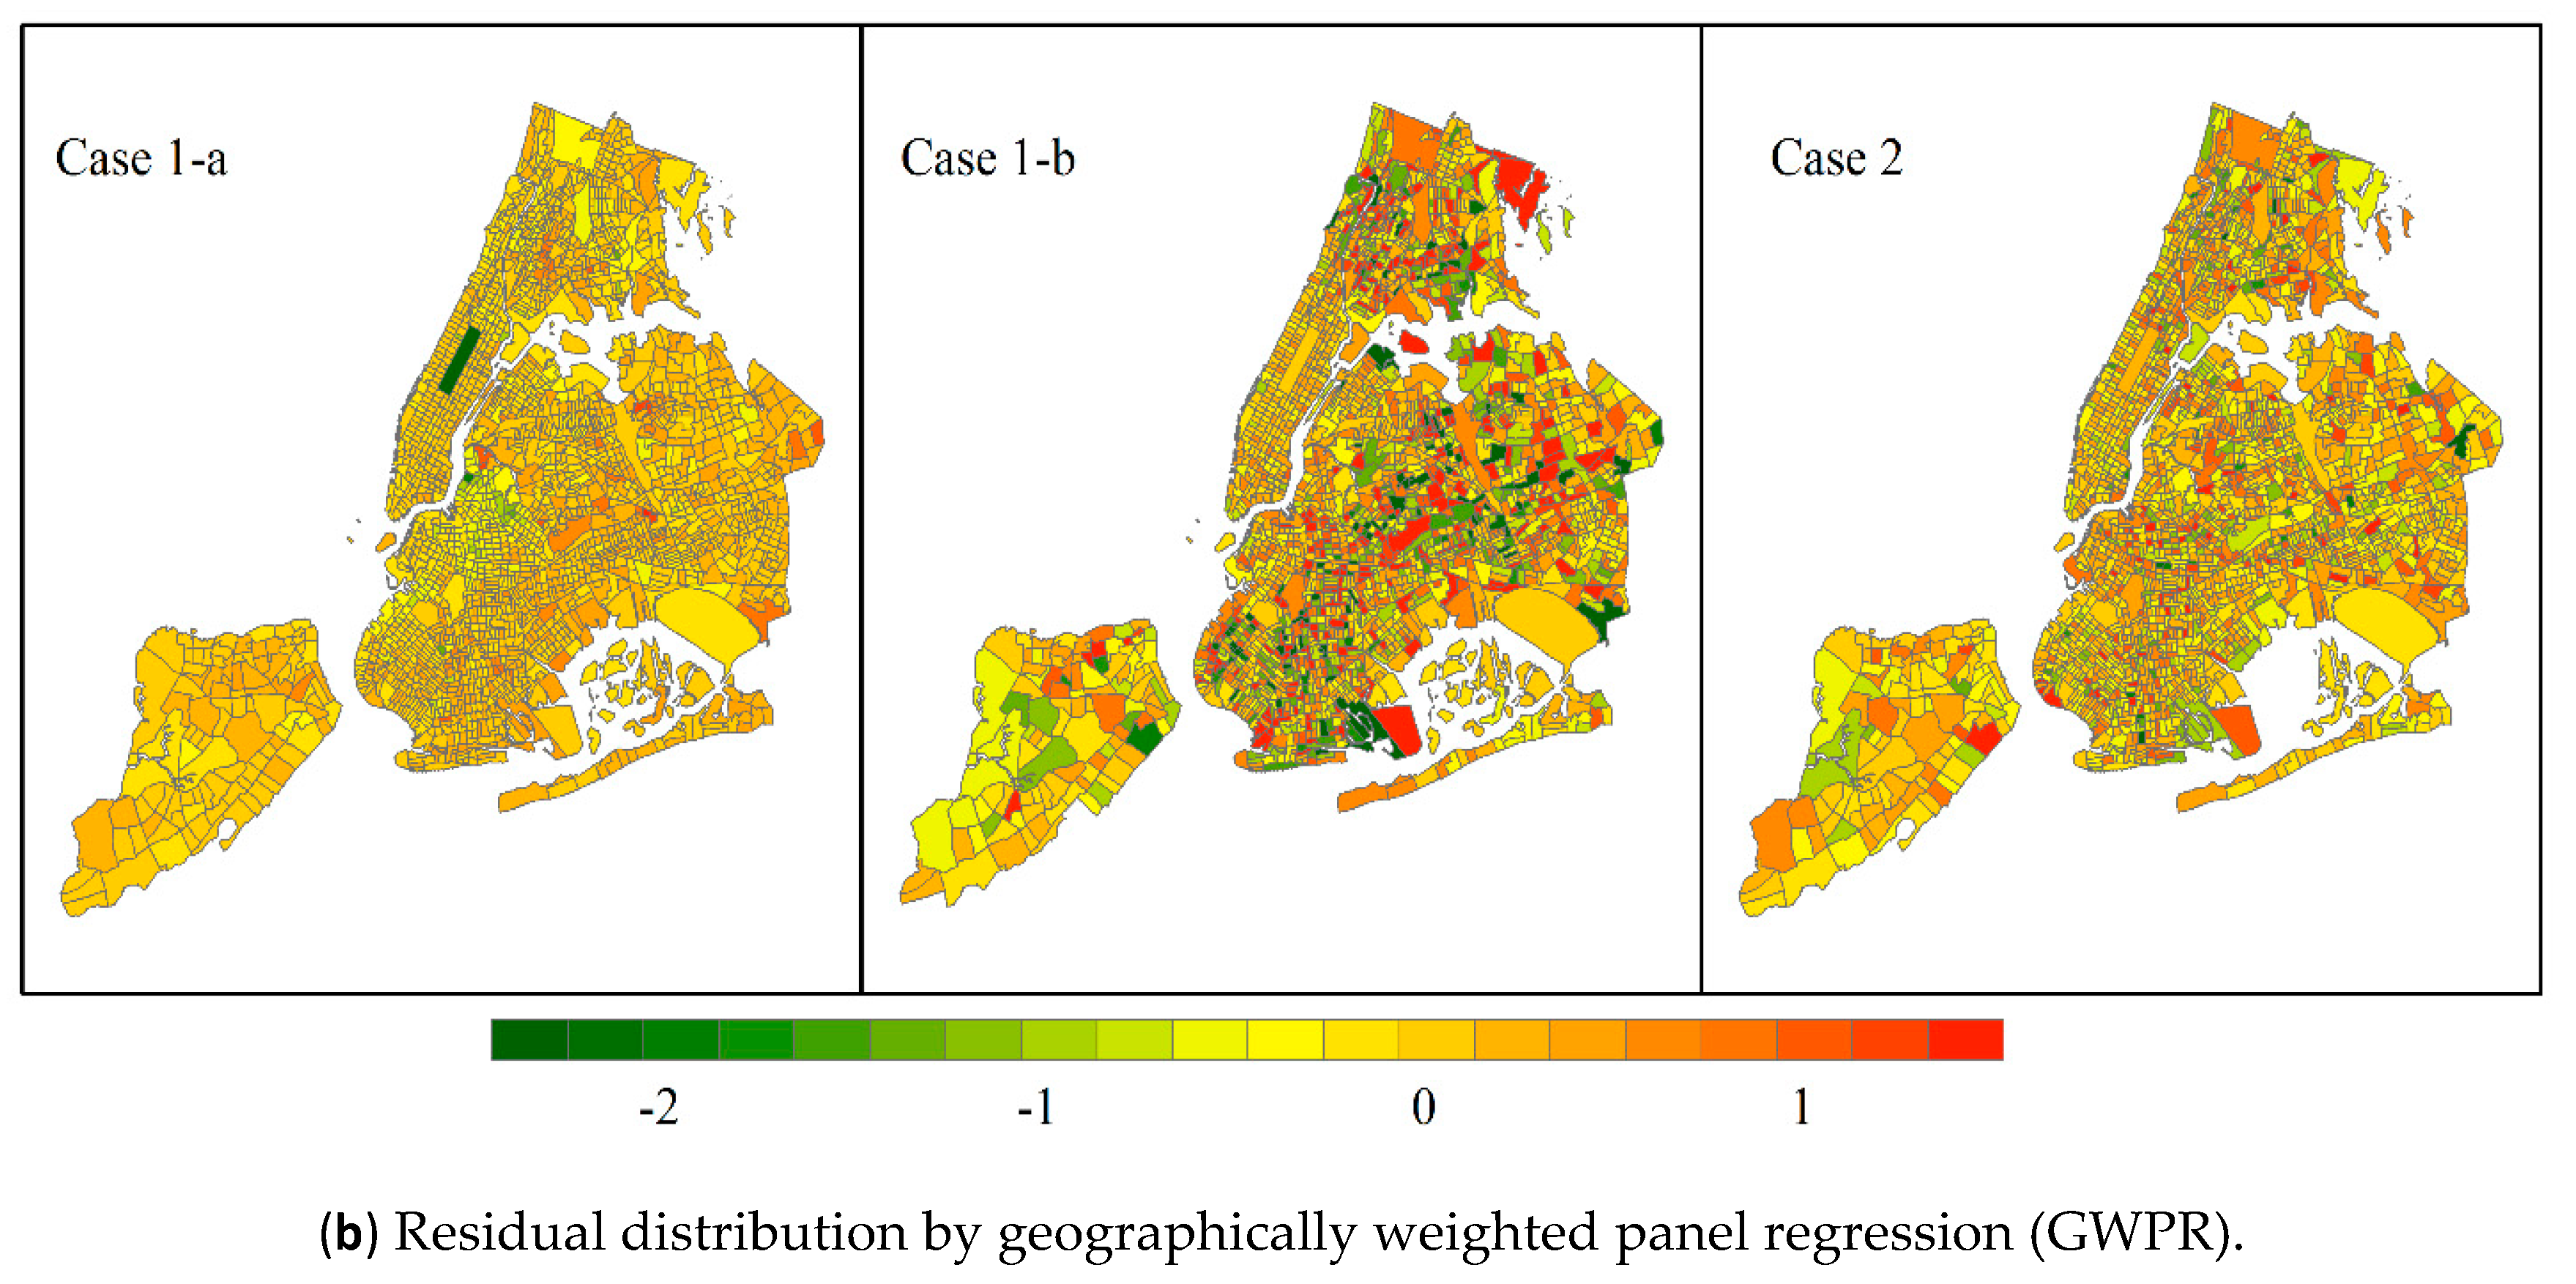
5.1. Model Performance
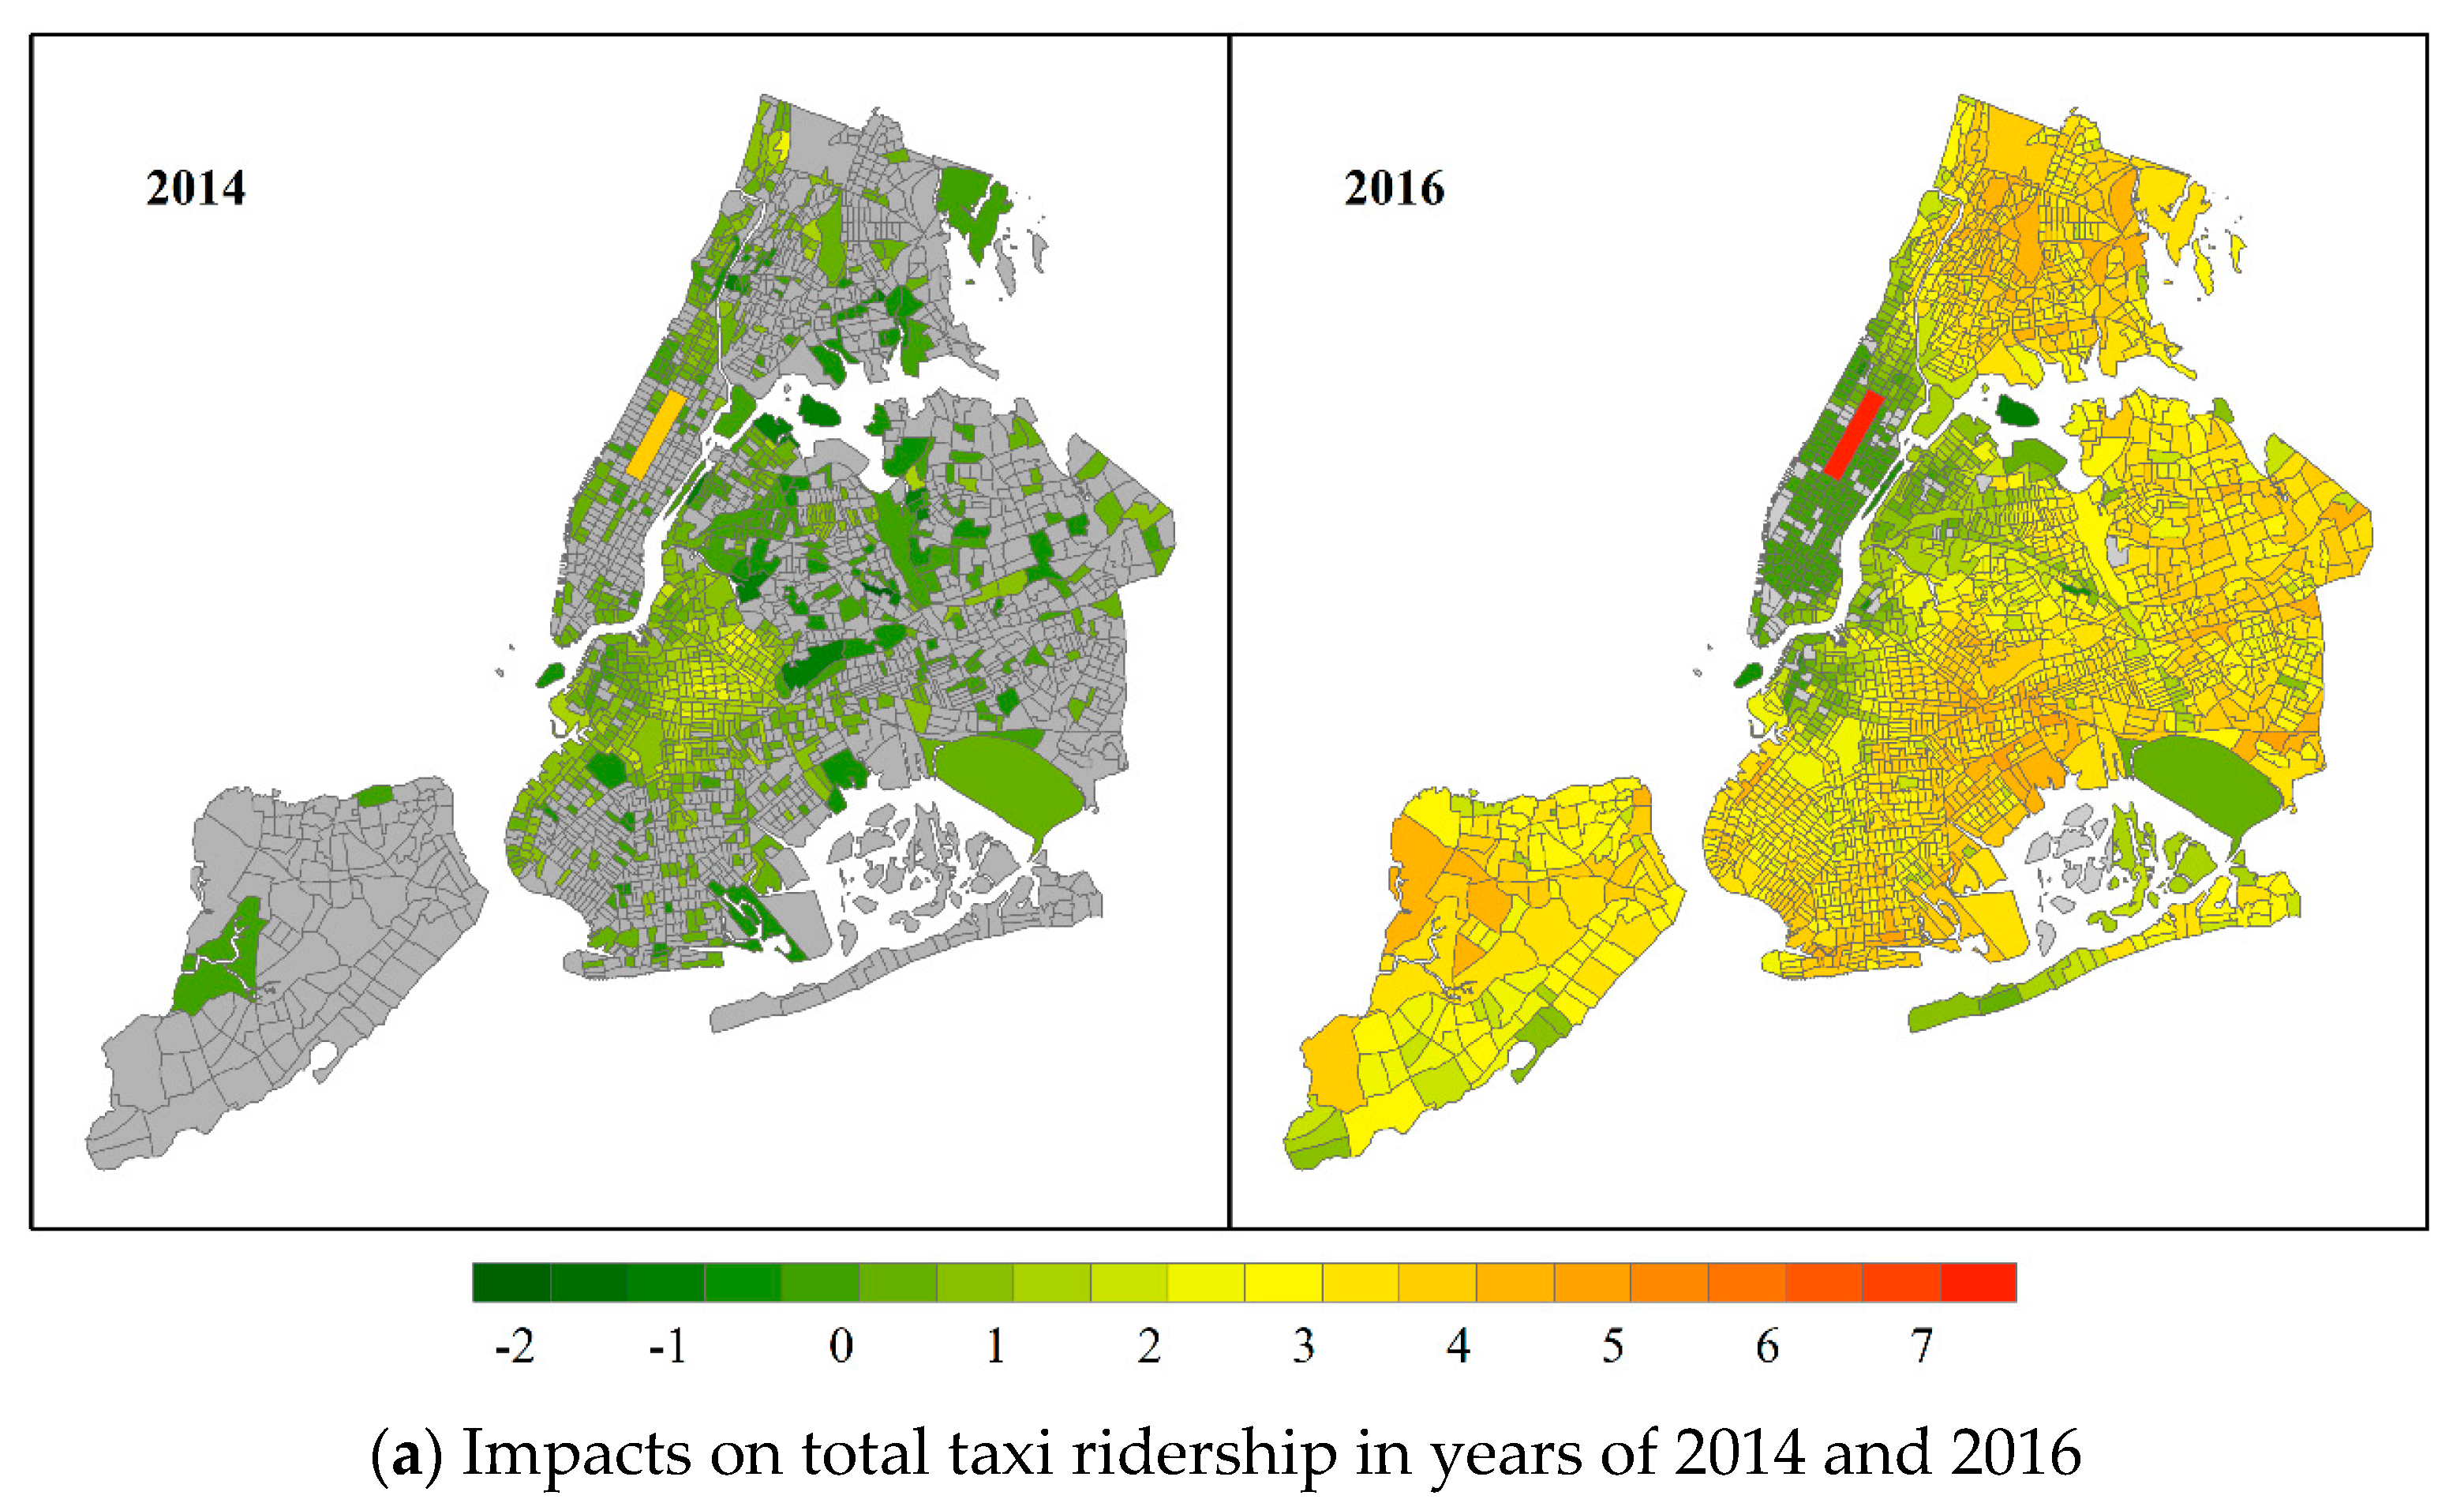
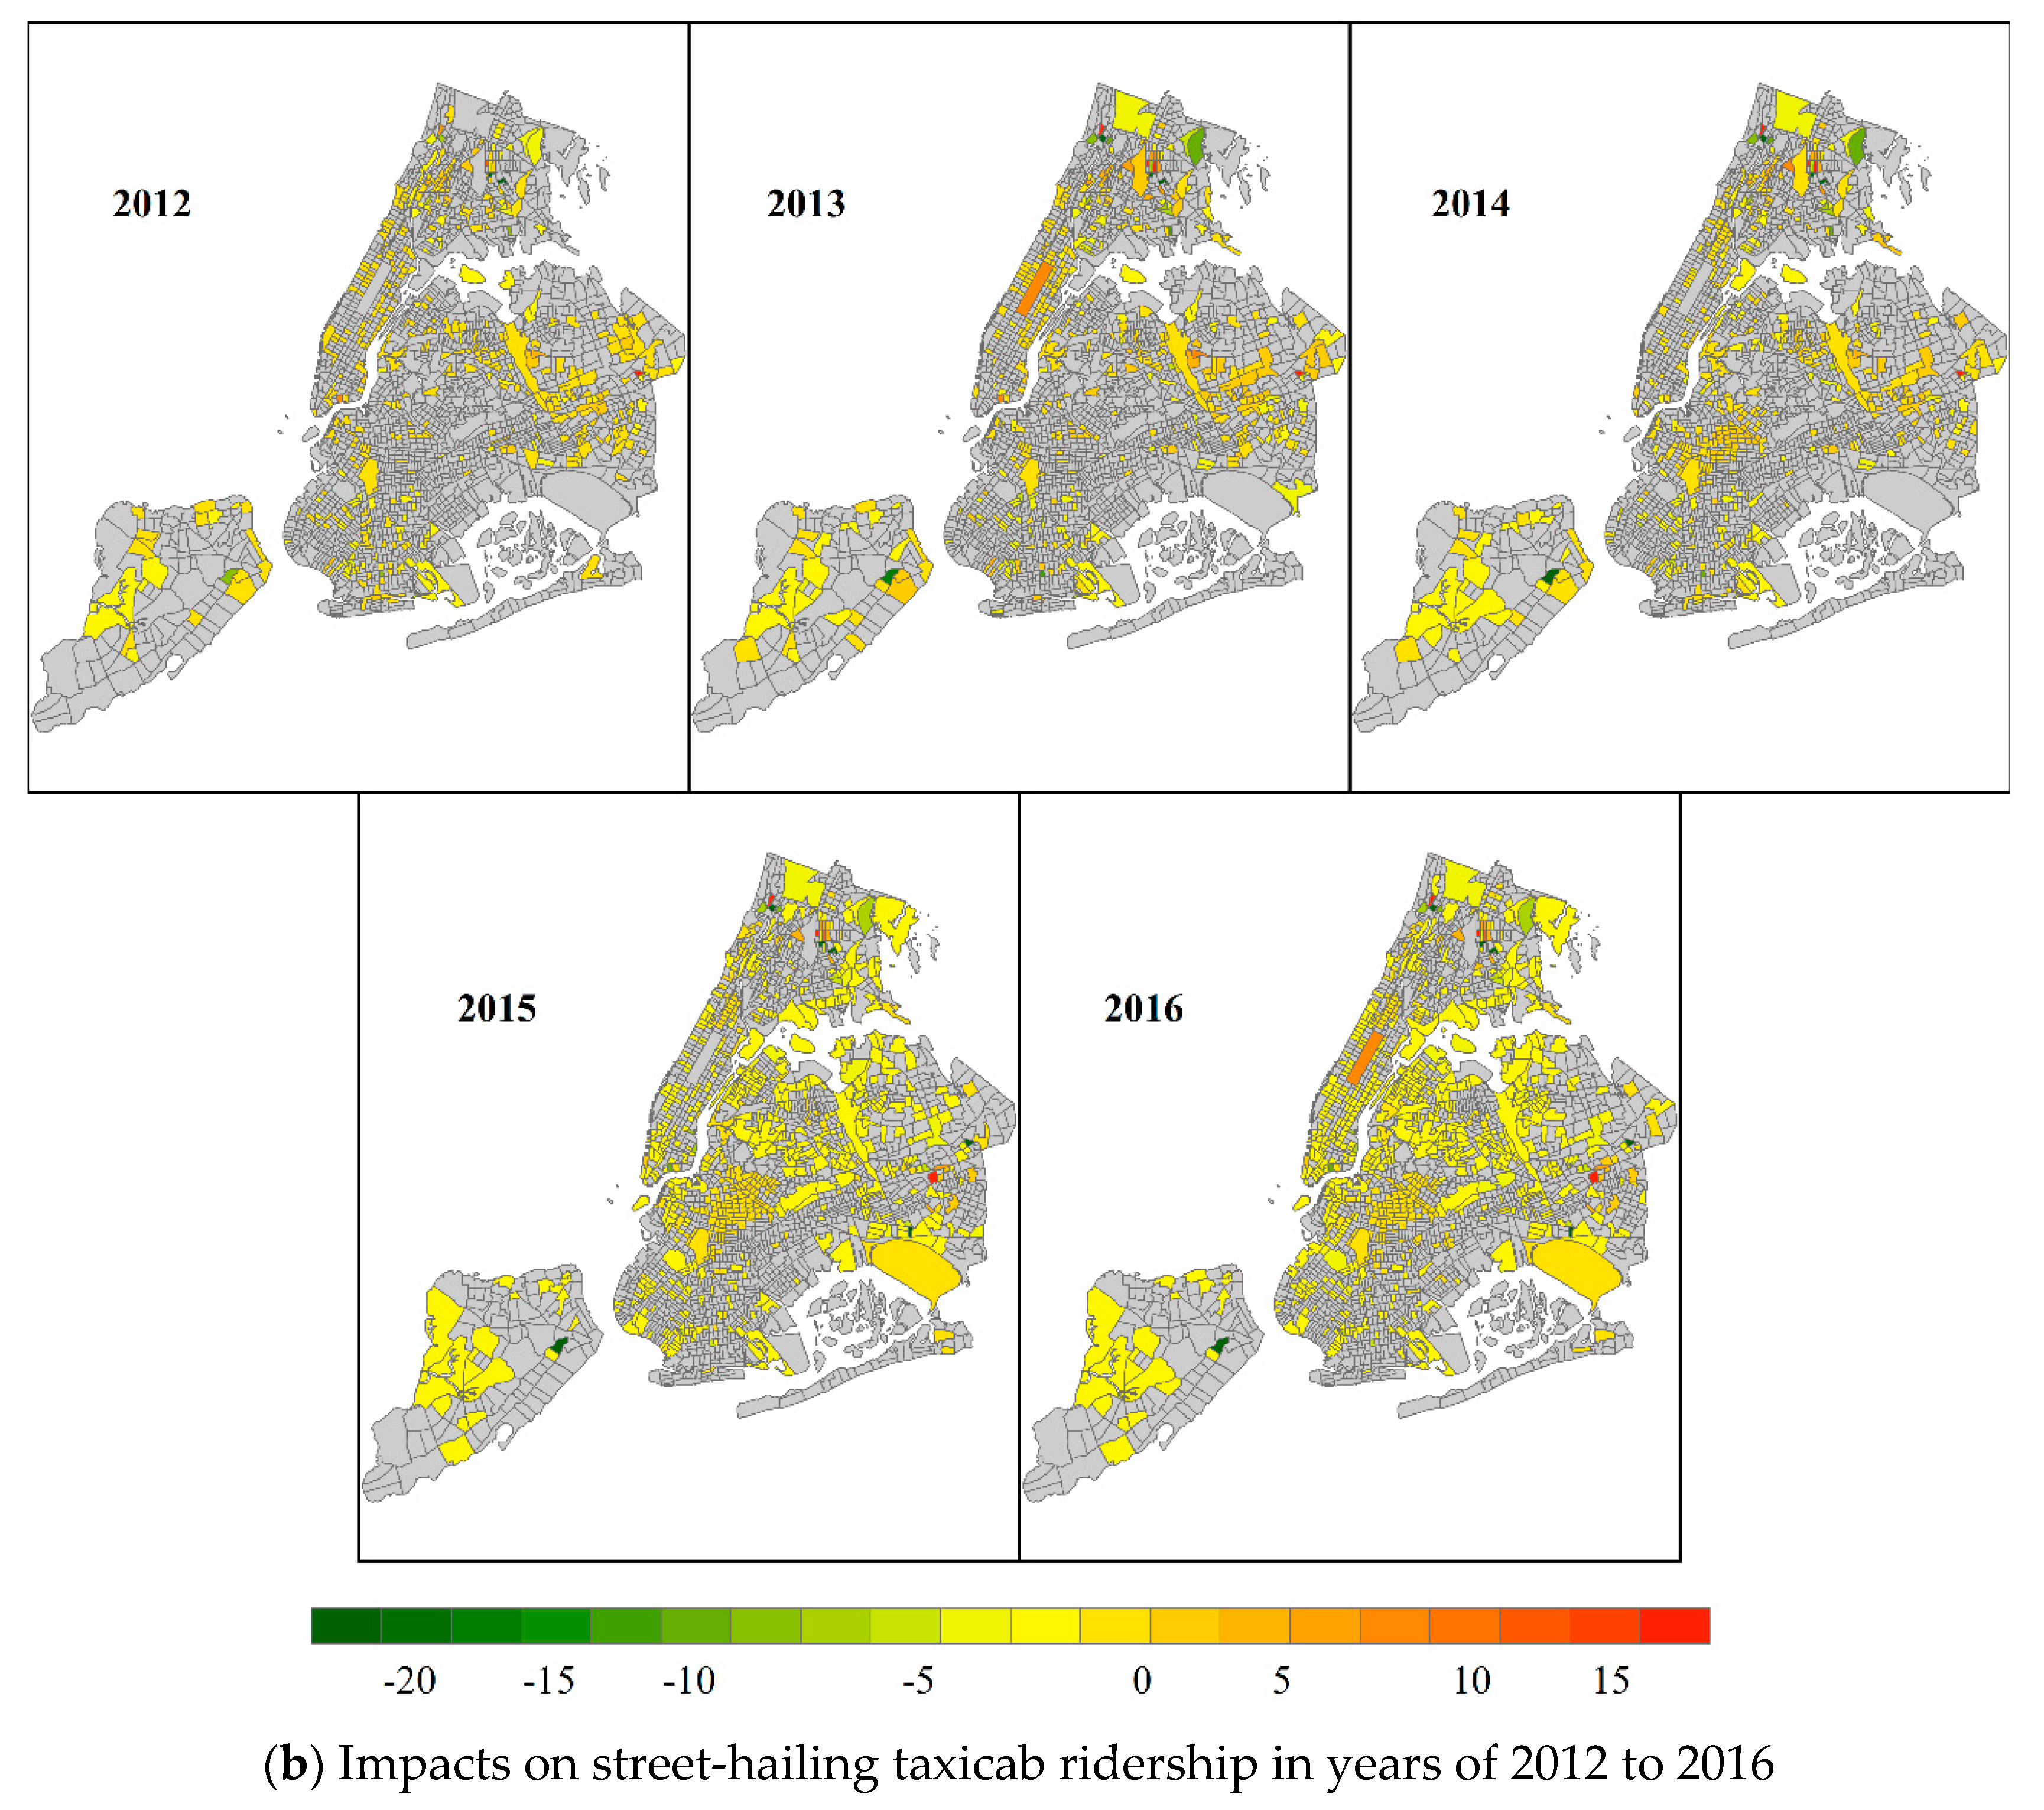
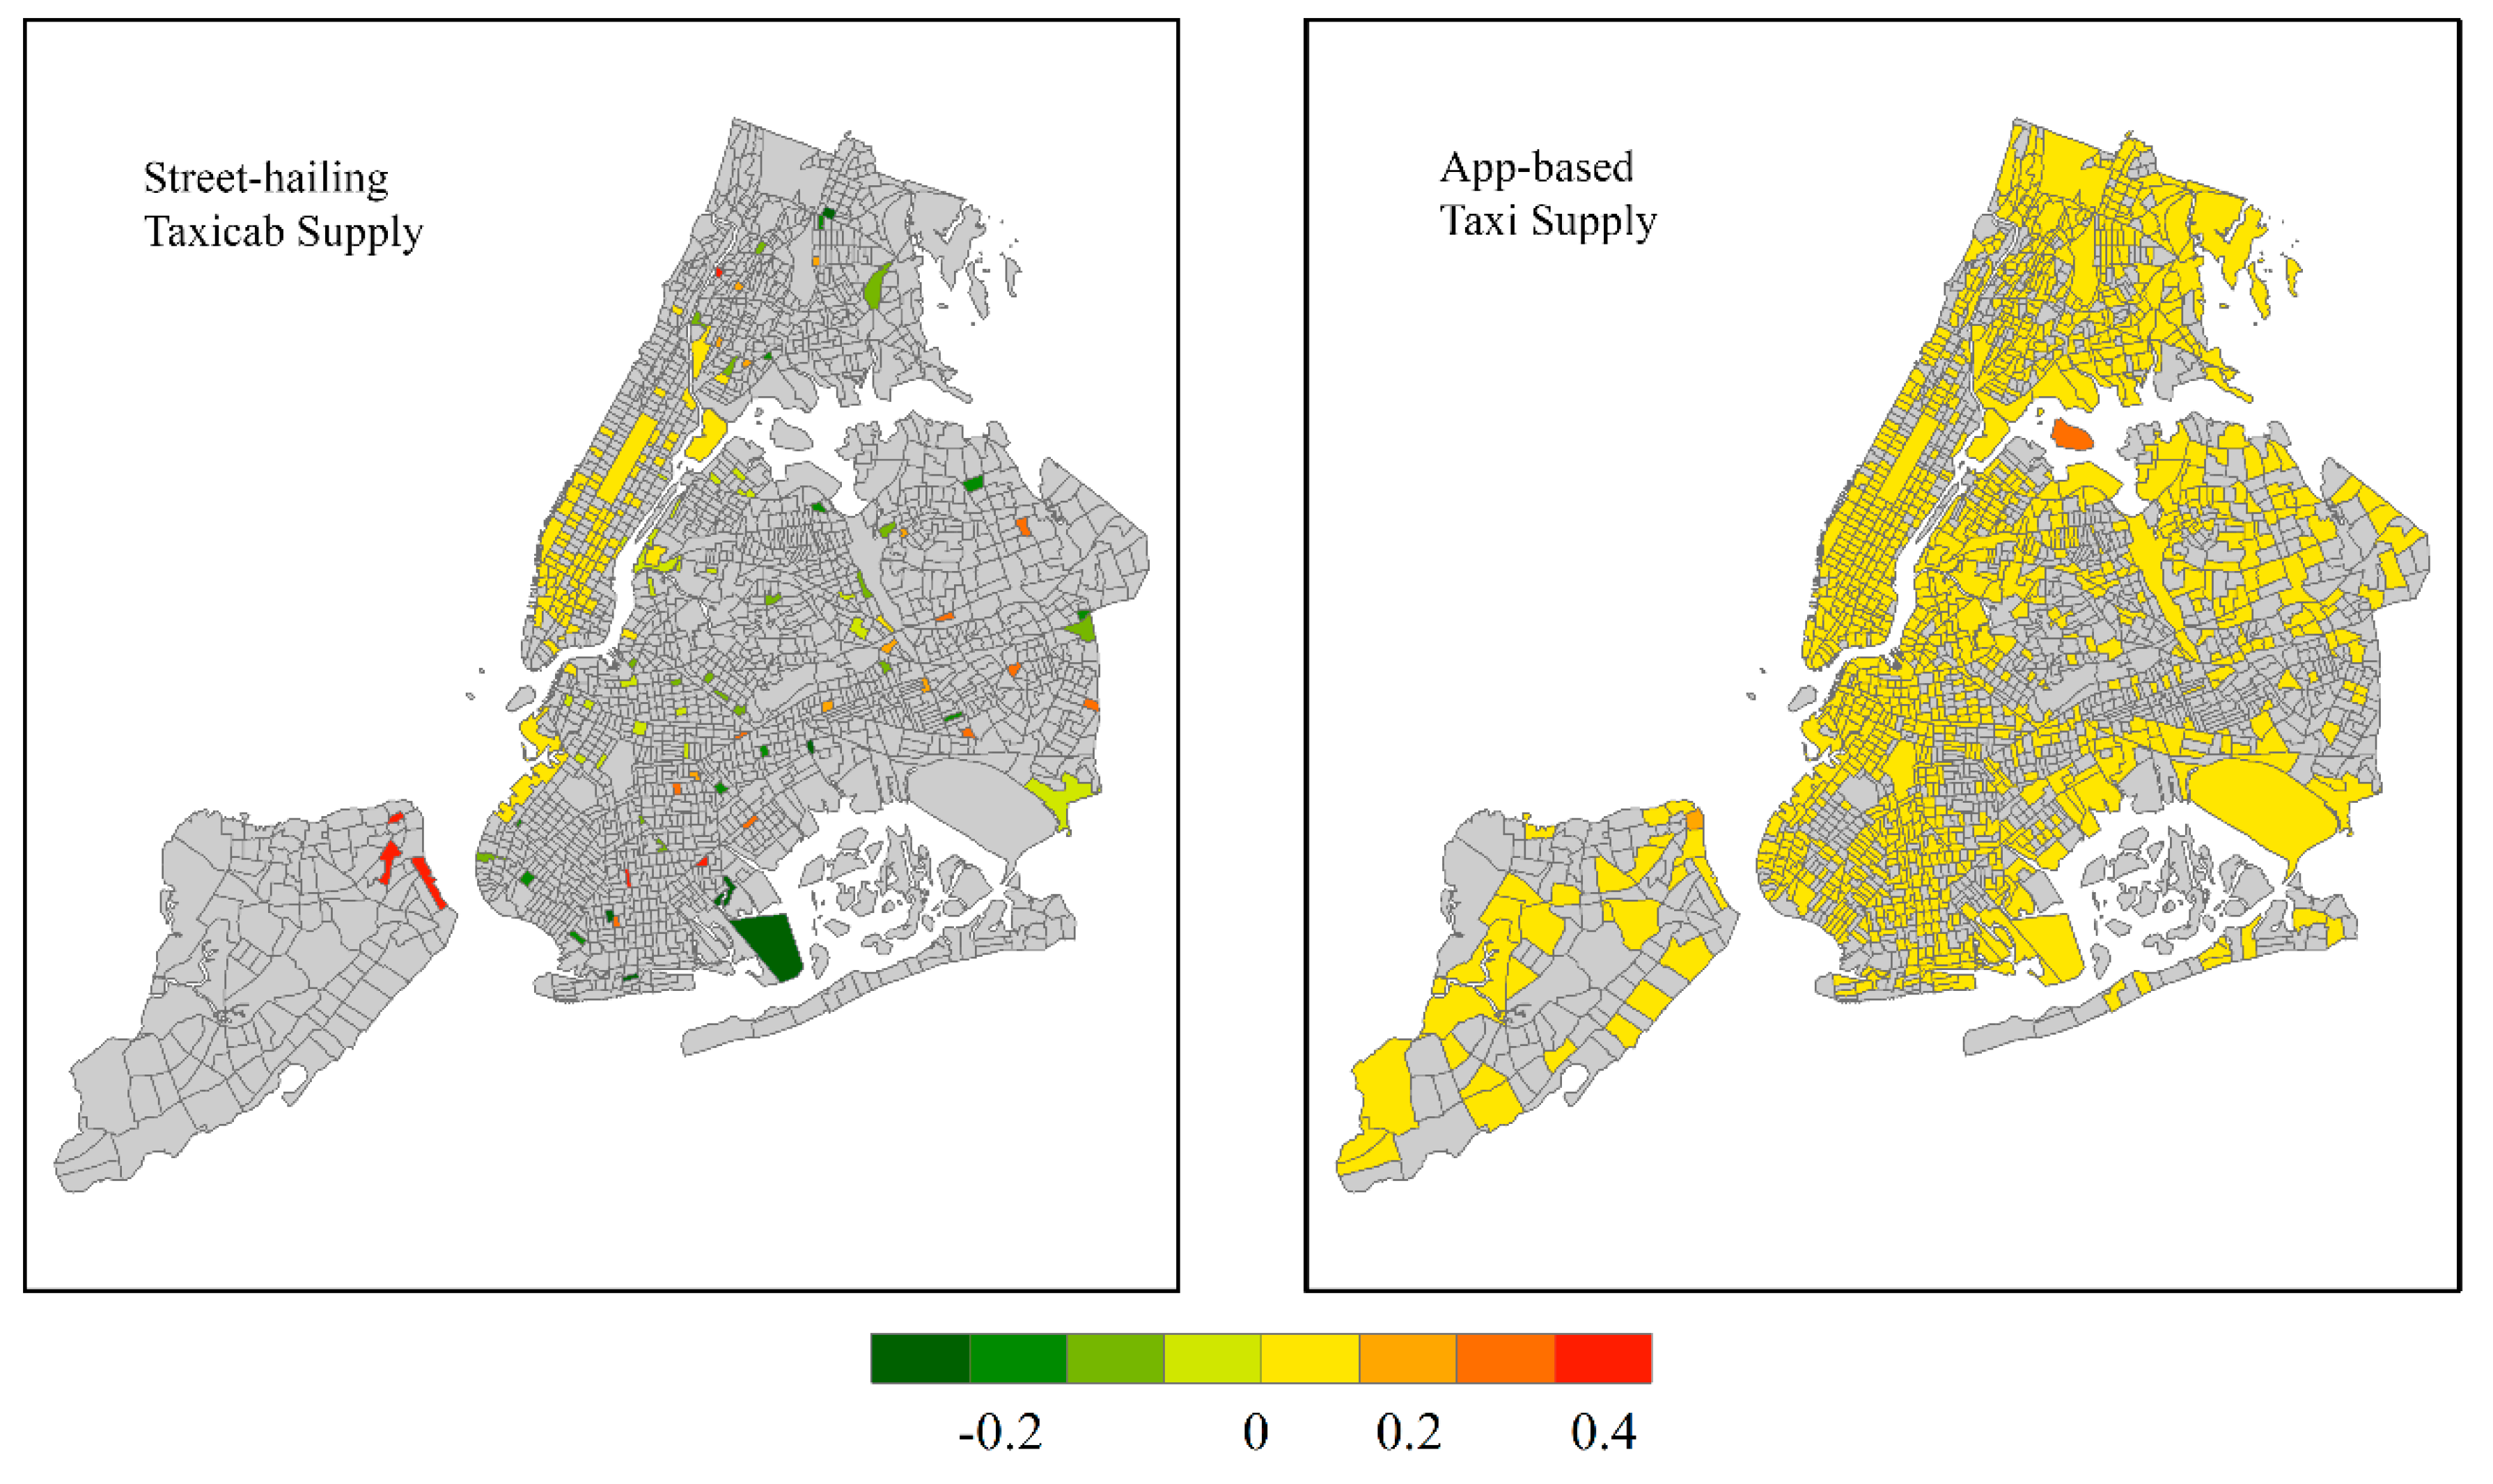
5.2. Case 1 Impacts of Presence of App-Based Taxi Services
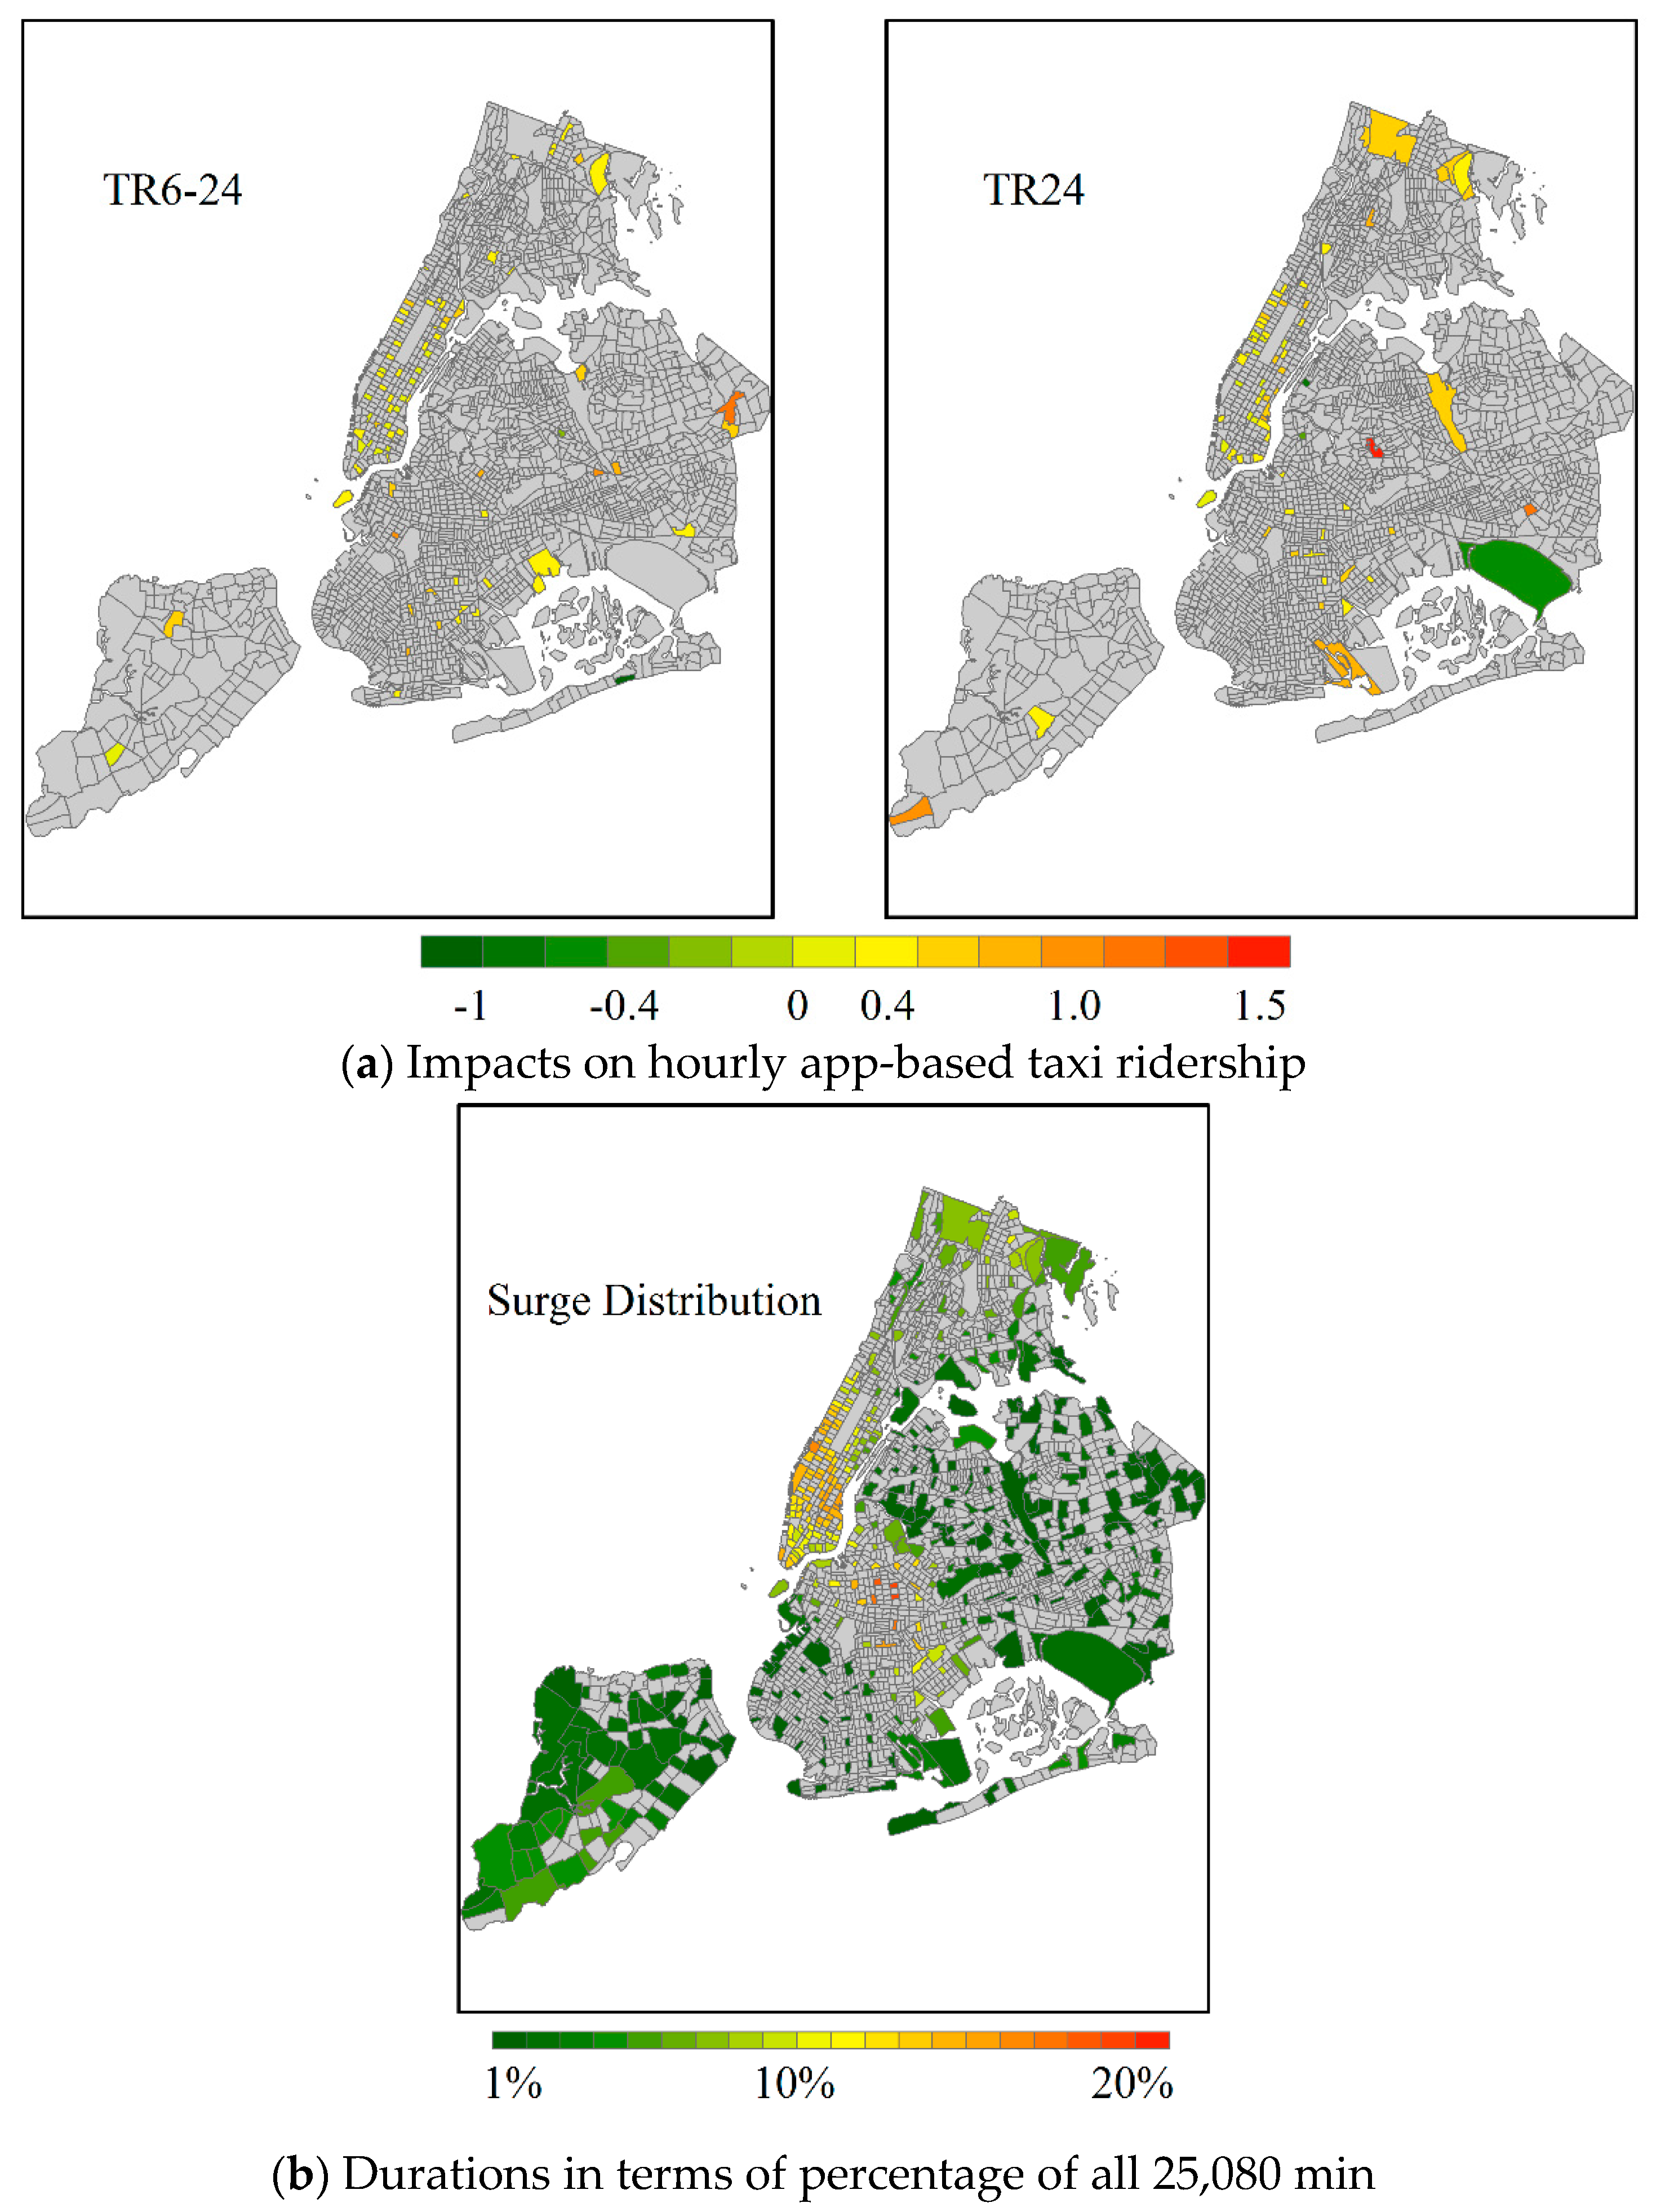
5.3. Case 2 Impacts of Dynamic Pricing
6. Conclusions
Author Contributions
Funding
Conflicts of Interest
References
- Schaller, B. The Growth of App-Based Ride Services and Traffic, Travel, and the Future of New York City; Schaller Consulting: New York, NY, USA, 2017. [Google Scholar]
- Fischer-Baum, R.; Carl, B. “Uber Is Taking Millions of Manhattan Rides away from Taxis”, FiveThirtyEight. 13 October 2015. Available online: https://fivethirtyeight.com/features/uber-is-taking-millions-of-manhattan-rides-away-from-taxis/ (accessed on 25 July 2017).
- Theis, M. “The Uber Effect: Austin Taxi Rides Drop Dramatically in Past Year,” Austin Business Journal. 19 January 2016. Available online: https://www.bizjournals.com/austin/news/2016/01/19/the-Uber-effect-austin-taxi-rides-drop.html (accessed on 25 July 2017).
- Newsham, J.; Adams, D. “Amid Fight with Uber, Lyft, Boston Taxi Ridership Plummets,” Boston Global. 19 August 2015. Available online: https://www.bostonglobe.com/business/2015/08/19/boston-taxi-ridership-down-percent-this-year/S9dZMELMye6puzTTYoDIrL/story.html (accessed on 25 July 2017).
- Garber, M. “After Uber, San Francisco Has Seen a 65% Decline in Cab Use,” the Atlantic. 17 September 2014. Available online: https://www.theatlantic.com/technology/archive/2014/09/what-uber-is-doing-to-cabs-in-san-francisco-in-1-crazy-chart/380378/ (accessed on 25 July 2017).
- Imbens, G.; Wooldridge, J. Recent Developments in the Econometrics of Program Evaluation. J. Econ. Lit. 2009, 47, 5–86. [Google Scholar] [CrossRef]
- Lechner, M. The Estimation of Causal Effects by Difference-in-Difference Methods. Found. Trends Econom. 2010, 4, 165–224. [Google Scholar] [CrossRef]
- Lechner, M. Treatment Effects and Panel Data. In The Oxford Handbook of Panel Data; Baltagi, B., Ed.; Oxford University Press: Oxford, UK, 2015; pp. 257–285. [Google Scholar]
- Zhang, W.; Qian, X.; Ukkusuri, S. Idenitfying temporal characteristics of intracity movement using taxi geo-location data. In Enriching Urban Spaces with Ambient Computing, the Internet of Things, and Smart City Design; Konomi, S., Roussos, G., Eds.; IGI Global: Hershey, PA, USA, 2016; pp. 68–88. [Google Scholar]
- Kamga, C.; Yazici, M.A.; Singhal, A. Analysis of taxi demand and supply in New York City: Implications of recent taxi regulations. Transp. Plan. Technol. 2015, 38, 601–625. [Google Scholar] [CrossRef]
- Yang, C.; Gonzales, E. Modeling Taxi Trip Demand by Time of Day in New York City. Transp. Res. Rec. J. Transp. Res. Board 2014, 2429, 110–120. [Google Scholar] [CrossRef]
- Qian, X.; Ukkusuri, S. Spatial variation of the urban taxi ridership using GPS data. Appl. Geogr. 2015, 59, 31–42. [Google Scholar] [CrossRef]
- Cohen, P.; Hahn, R.; Hall, J.; Levitt, S.; Metcalfe, R. Using Big Data to Estimate Consumer Surplus: The Case of Uber. Natl. Bur. Econ. Res. 2016. [Google Scholar] [CrossRef]
- Helbich, M.; Brunauer, W.; Vaz, E.; Nijkamp, P. Spatial Heterogeneity in Hedonic House Price Models: The Case of Austria. Urban Stud. 2014, 51, 390–411. [Google Scholar] [CrossRef]
- Liu, J.; Zhao, Y.; Yang, Y.; Xu, S.; Zhang, F.; Zhang, X.; Shi, L.; Qiu, A. A Mixed Geographically and Temporally Weighted Regression: Exploring Spatial-Temporal Variations from Global and Local Perspectives. Entropy 2017, 19, 53. [Google Scholar] [CrossRef]
- Ge, L.; Zhao, Y.; Sheng, Z.; Wang, N.; Zhou, K.; Mu, X.; Guo, L.; Wang, T.; Yang, Z.; Huo, X. Construction of a Seasonal Difference-Geographically and TemporallyWeighted Regression (SD-GTWR) Model and Comparative Analysis with GWR-Based Models for Hemorrhagic Fever with Renal Syndrome (HFRS) in Hubei Province (China). Int. J. Environ. Res. Public Health 2016, 13, 1062. [Google Scholar] [CrossRef] [PubMed]
- Zhang, X.; Huang, B.; Zhu, S. Spatiotemporal Varying Effects of Built Environment on Taxi and Ride-Hailing Ridership in New York City. ISPRS Int. J. Geo-Inf. 2020, 9, 475. [Google Scholar] [CrossRef]
- Bruna, F.; Yu, D. Geographically weighted panel regression. In Proceedings of the XI Congreso Galego de Estatística e Investigación de Operacións, La Coruña, Spain, 24–26 October 2013. [Google Scholar]
- Yu, D. Exploring spatiotemporally varying regressed relationships: The geographically weighted panel regression analysis. In Proceedings of the Joint International Conference on Theory, Data Handling and Modeling in GeoSpatial Information Science, Hong Kong, China, 26–28 May 2010. [Google Scholar]
- Cai, R.; Yu, D.; Oppenheimer, M. Estimating the spatially varying responses of corn yields to weather variations using geographically weighted panel regression. J. Agric. Resour. Econ. 2014, 39, 230–252. [Google Scholar]
- Leong, Y.; Yue, J. A modification to geographically weighted regression. Int. J. Health Geogr. 2017, 16, 1–18. [Google Scholar] [CrossRef] [PubMed]
- Kondo, M.; Keene, D.; Hohl, B.; MacDonald, J.; Branas, C. A Difference-In-Differences Study of the Effects of a New Abandoned Building Remediation Strategy on Safety. PLoS ONE 2015, 10, e0129582. [Google Scholar] [CrossRef] [PubMed]
- Dube, J.; Legros, D.; Theriault, M.; Rosiers, F. A spatial Difference-in-Differences estimator to evaluatethe effect of change in public mass transit systemson house prices. Transp. Res. Part B 2014, 64, 24–40. [Google Scholar] [CrossRef]
- Chagas, A.; Azzoni, C.; Almeida, A. A spatial difference-in-differences analysis of the impact of sugarcane production on respiratory diseases. Reg. Sci. Urban Econ. 2016, 59, 24–36. [Google Scholar] [CrossRef]
- Delgado, M.; Florax, R. Difference-in-Differences Techniques for Spatial Data: Local Autocorrelation and Spatial Interaction. Econ. Lett. 2015, 137, 123–126. [Google Scholar] [CrossRef]
- Heckert, M.; Mennis, J. The Economic Impact of Greening Urban Vacant Land: A Spatial Difference-In-Differences Analysis. Environ. Plan. A 2012, 44, 3010–3027. [Google Scholar] [CrossRef]
- Chen, L.; Mislove, A.; Wilson, C. Peeking Beneath the Hood of Uber. In Proceedings of the 2015 ACM Internet Measurement Conference, Tokyo, Japan, 28–30 October 2015. [Google Scholar]
- Qian, X.; Ukkusuri, S. Taxi market equilibrium with third-party hailing service. Transp. Res. Part B Methodol. 2017, 100, 43–63. [Google Scholar] [CrossRef]


| Variable | Description | Min | Max | Mean (Standard Deviation) or Percentage | Correlations (Absolute Value Greater than 0.5) | VIF |
|---|---|---|---|---|---|---|
| (a) Case 1-a | ||||||
| DTR | Daily Total Ridership of both app-based and street-hailing | 0 | 14,213 | 217.61 (830.21) | - | - |
| WK | Indicator variable of weekends, 1-if weekends, 0-if weekdays | 0 | 1 | 63.64%/36.36% | - | 1.00 |
| TR14 | Treatment indicator of Uber in 2014 | 0 | 1 | 85.71%/14.29% | - | 1.07 |
| TR16 | Treatment indicator of Uber in 2016 | 0 | 1 | 85.71%/14.29% | - | 1.07 |
| AGE | Density of population aged between 22 and 35 (100,000 per square mile) | 0 | 1032.28 | 110.94 (103.38) | NV (0.6944) *; TT45 | 2.57 |
| TT45 | Density of individual workers with commuting time over 45 min (10,000 per square mile) | 0 | 5325.23 | 830.49 (641.37) | AGE; NV | 1.91 |
| TT15 | Density of individual workers with commuting time less than 15 min (10,000 per square mile) | 0 | 4404.97 | 223.26 (278.69) | - | 1.18 |
| OU | Density of occupied household units (10,000 per square mile) | 0 | 11,964.11 | 633.35 (897.86) | - | 1.07 |
| NV | Density of household without vehicles (10,000 per square mile) | 0 | 9551.84 | 1125.53 (1282.60) | AGE; TT45; UP | 2.68 |
| UP | Density of population who is under poverty line (10,000 per square mile) | 0 | 1119.12 | 104.34 (122.21) | NV | 1.73 |
| (b) Case 1-b | ||||||
| DYR | Daily Street-hailing Taxicab Ridership | 0 | 13743 | 207.92 (811.29) | - | - |
| WK | Indicator variable of weekends, 1-if weekends, 0-if weekdays | 0 | 1 | 63.64%/36.36% | - | 1.00 |
| TR12 | Treatment indicator of Uber in 2012 | 0 | 1 | 87.5%/12.5% | 1.23 | |
| TR13 | Treatment indicator of Uber in 2013 | 0 | 1 | 87.5%/12.5% | 1.24 | |
| TR14 | Treatment indicator of Uber in 2014 | 0 | 1 | 87.5%/12.5% | - | 1.25 |
| TR15 | Treatment indicator of Uber in 2015 | 0 | 1 | 87.5%/12.5% | 1.27 | |
| TR16 | Treatment indicator of Uber in 2016 | 0 | 1 | 87.5%/12.5% | - | 1.26 |
| AGE | Density of population aged between 22 and 35 (100,000 per square mile) | 0 | 1032.28 | 111.76 (103.76) | NV (0.6713) *; TT45 | 2.18 |
| TT45 | Density of individual workers with commuting time over 45 min (10,000 per square mile) | 0 | 5325.23 | 837.51 (643.78) | AGE; NV | 1.12 |
| TT15 | Density of individual workers with commuting time less than 15 min (10,000 per square mile) | 0 | 4404.97 | 222.58 (278.17) | - | 1.64 |
| OU | Density of occupied household units (10,000 per square mile) | 0 | 11,964.11 | 614.10 (865.60) | - | 1.17 |
| NV | Density of household without vehicles (10,000 per square mile) | 0 | 9551.84 | 1130.10 (1284.04) | AGE; TT45; UP | 2.12 |
| UP | Density of population who is under poverty line (100,000 per square mile) | 0 | 1119.12 | 105.32 (123.02) | NV | 1.36 |
| (c) Case 2 | ||||||
| HUR | Hourly App-based Ridership | 0 | 399 | 2.17 (5.01) | - | - |
| WK | Indicator variable of weekends, 1-if weekends, 0-if weekdays | 0 | 1 | 63.64%/36.36% | - | 1.05 |
| T6-T23$ | Hour indicator of 6am to midnight | 0 | 1 | 94.74%/5.26% | - | <1.50 |
| TR24 | Treatment indicator of surge multiplier greater than 1.2 for more than 24 min in one hour | 0 | 1 | 99.15%/0.85% | - | 1.01 |
| TR624 | Treatment indicator of surge multiplier greater than 1.2 for more than 6 min but less than 24 min in one hour | 0 | 1 | 98.42%/1.58% | - | 1.03 |
| TS | Hourly available yellow taxicabs | 0 | 973 | 8.24 (32.58) | - | 1.19 |
| US | Hourly available Uber vehicles | 0 | 598 | 11.93 (15.66) | - | 1.09 |
| Model Performance | Case 1-a | Case 1-b | Case 2 |
|---|---|---|---|
| No. of Observations | 333,256 | 380,864 | 904,552 |
| Log-likelihood only with intercept | −521,120 | −376,563 | −1,053,514 |
| One-way fixed time effect model | |||
| Log-likelihood | −386,112 | −369,626 | −972,428 |
| Degree of freedom | 10 | 13 | 25 |
| R2 | 0.555 | 0.034 | 0.164 |
| AIC | 772,244 | 739,278 | 1,944,907 |
| AICc | 772,244 | 739,278 | 1,944,907 |
| Two-way fixed effect model | |||
| Log-likelihood | −386,112 | −399,292 | −972,363 |
| Degree of freedom | 2173 | 2176 | 2188 |
| R2 | 0.555 | 0.036 | 0.164 |
| AIC | 776,570 | 743,604 | 1,949,112 |
| AICc | 776,598 | 743,629 | 1,949,122 |
| Geographically weighted panel regression | |||
| Log-likelihood | −237,284 | −231,354 | −864,634 |
| Degree of freedom | 10,820 | 21620 | 50,472 |
| R2 | 0.864 | 0.279 | 0.294 |
| AIC | 496,209 | 505,949 | 1,830,212 |
| AICc | 496,935 | 508,551 | 1,836,184 |
Publisher’s Note: MDPI stays neutral with regard to jurisdictional claims in published maps and institutional affiliations. |
© 2020 by the authors. Licensee MDPI, Basel, Switzerland. This article is an open access article distributed under the terms and conditions of the Creative Commons Attribution (CC BY) license (http://creativecommons.org/licenses/by/4.0/).
Share and Cite
Zhang, W.; Xi, Y.; Ukkusuri, S.V. Understanding Spatiotemporal Variations of Ridership by Multiple Taxi Services. ISPRS Int. J. Geo-Inf. 2020, 9, 757. https://doi.org/10.3390/ijgi9120757
Zhang W, Xi Y, Ukkusuri SV. Understanding Spatiotemporal Variations of Ridership by Multiple Taxi Services. ISPRS International Journal of Geo-Information. 2020; 9(12):757. https://doi.org/10.3390/ijgi9120757
Chicago/Turabian StyleZhang, Wenbo, Yinfei Xi, and Satish V. Ukkusuri. 2020. "Understanding Spatiotemporal Variations of Ridership by Multiple Taxi Services" ISPRS International Journal of Geo-Information 9, no. 12: 757. https://doi.org/10.3390/ijgi9120757
APA StyleZhang, W., Xi, Y., & Ukkusuri, S. V. (2020). Understanding Spatiotemporal Variations of Ridership by Multiple Taxi Services. ISPRS International Journal of Geo-Information, 9(12), 757. https://doi.org/10.3390/ijgi9120757