Article

Design of Multiple Spatial Context Detection Method Considering Elongated Top-Bounded Spaces Based on GPS Signal-To-Noise Ratio and Fuzzy Inference

Graduate School of System Design and Management, Keio University, Kanagawa 223-8526, Japan
*
Author to whom correspondence should be addressed.
ISPRS Int. J. Geo-Inf. 2020, 9(12), 717; https://doi.org/10.3390/ijgi9120717
Submission received: 8 November 2020 / Revised: 25 November 2020 / Accepted: 30 November 2020 / Published: 2 December 2020

Abstract

:
Numerous studies have been conducted on indoor and outdoor seamless positioning and indoor–outdoor detection methods. However, the classification of real space into two types, outdoor space and indoor space, is difficult. One type of space that is difficult to classify is top-bounded space, which can be observed in commercial facilities, logistics facilities, and street-facing sidewalks. In this study, we designed a method for detecting stays in three spatial contexts: Outdoor, top-bounded space, and indoor. This method considers elongated top-bounded spaces covered with a roof and open on one of the sides. Specifically, we selected Global Positioning System (GPS) satellites for stay detection based on the simple extraction of the spatial characteristics of a top-bounded space and designed a decision flow using fuzzy inference based on the signal-to-noise ratio (SNR) of the selected GPS satellites. Moreover, we conducted an evaluation experiment to verify the effectiveness of the proposed method and confirmed that it could correctly detect the stay in three spatial contexts, outdoor, top-bounded space, and indoor, with a high probability of 93.1%.

1. Introduction

Since people frequently move between indoor and outdoor spaces, an indoor–outdoor (IO) seamless navigation is one of the main services they desire [1]. Among the important elemental technologies for seamless positioning is the detection of whether an object is staying indoors or outdoors. This technique is referred to as IO detection or handover [2]. To achieve accurate IO detection, various approaches have been studied [3,4,5]. Recently, methods that can help achieve IO detection with high probability using machine learning and so on have been proposed [6].
However, in reality, classifying real space into two types, outdoor space and indoor space, is difficult [7]. Such spaces include those whose upper part is covered with a roof or eaves but the sides are open and spaces whose upper part is open but the sides are covered. Thus, the classification of real space into four categories, outdoor, indoor, semi-outdoor space whose upper part is covered, and semi-outdoor space whose sides are covered, has also been proposed [8]. In particular, the space where the top is covered and the sides are not completely closed is defined as a top-bounded space (TBS) [9]. A TBS is expected to be less accurate in the Global Navigation Satellite System (GNSS) positioning due to the shielding of the upper part of the satellite. Therefore, this space requires an indoor positioning environment. However, the application of the IO detection method to two types of spatial detection, outdoor and indoor spaces, is difficult because the sides are open, and they can receive Global Positioning System (GPS) signals to some extent [10]. Some methods for detecting entry into the TBS have proposed using the attenuation of GPS signals and multiple sensors in smartphones such as light sensors [11,12,13]. However, under conditions where the spatial shape of the TBS varies from space to space and the satellite configuration is constantly changing, these methods have not become a general-purpose detection method for such special conditions.
In a situation where the spatial shape of the TBS differs from space to space and the satellite configuration is constantly changing, it is difficult to set a unique threshold to allow for a stable determination of the three spatial contexts: Outdoor, TBS, and indoor. Therefore, in this study, we focused on utilizing fuzzy inference. Fuzzy inference allowed us to make a decision, even in such a special environment where setting a clear threshold for determination is difficult. In this study, we designed a method that could detect stays in three spatial contexts: Outdoor, TBS, and indoor. Specifically, we selected GPS satellites for stay detection based on the simple extraction of the spatial characteristics of a top-bounded space and designed a decision flow using fuzzy inference based on the signal-to-noise ratio (SNR) of the selected GPS satellites. This method allowed us to determine which spatial context a receiving device was in, even when moving continuously within the three spaces. To validate the effectiveness of the designed method, we selected two spaces with three spatial contexts, outdoor TBS and indoor, and conducted an evaluation experiment. We also measured the SNR of the satellites selected by the proposed method at the outdoor, TBS, and indoor locations. Our method was able to correctly determine the stay in each space with a high probability.
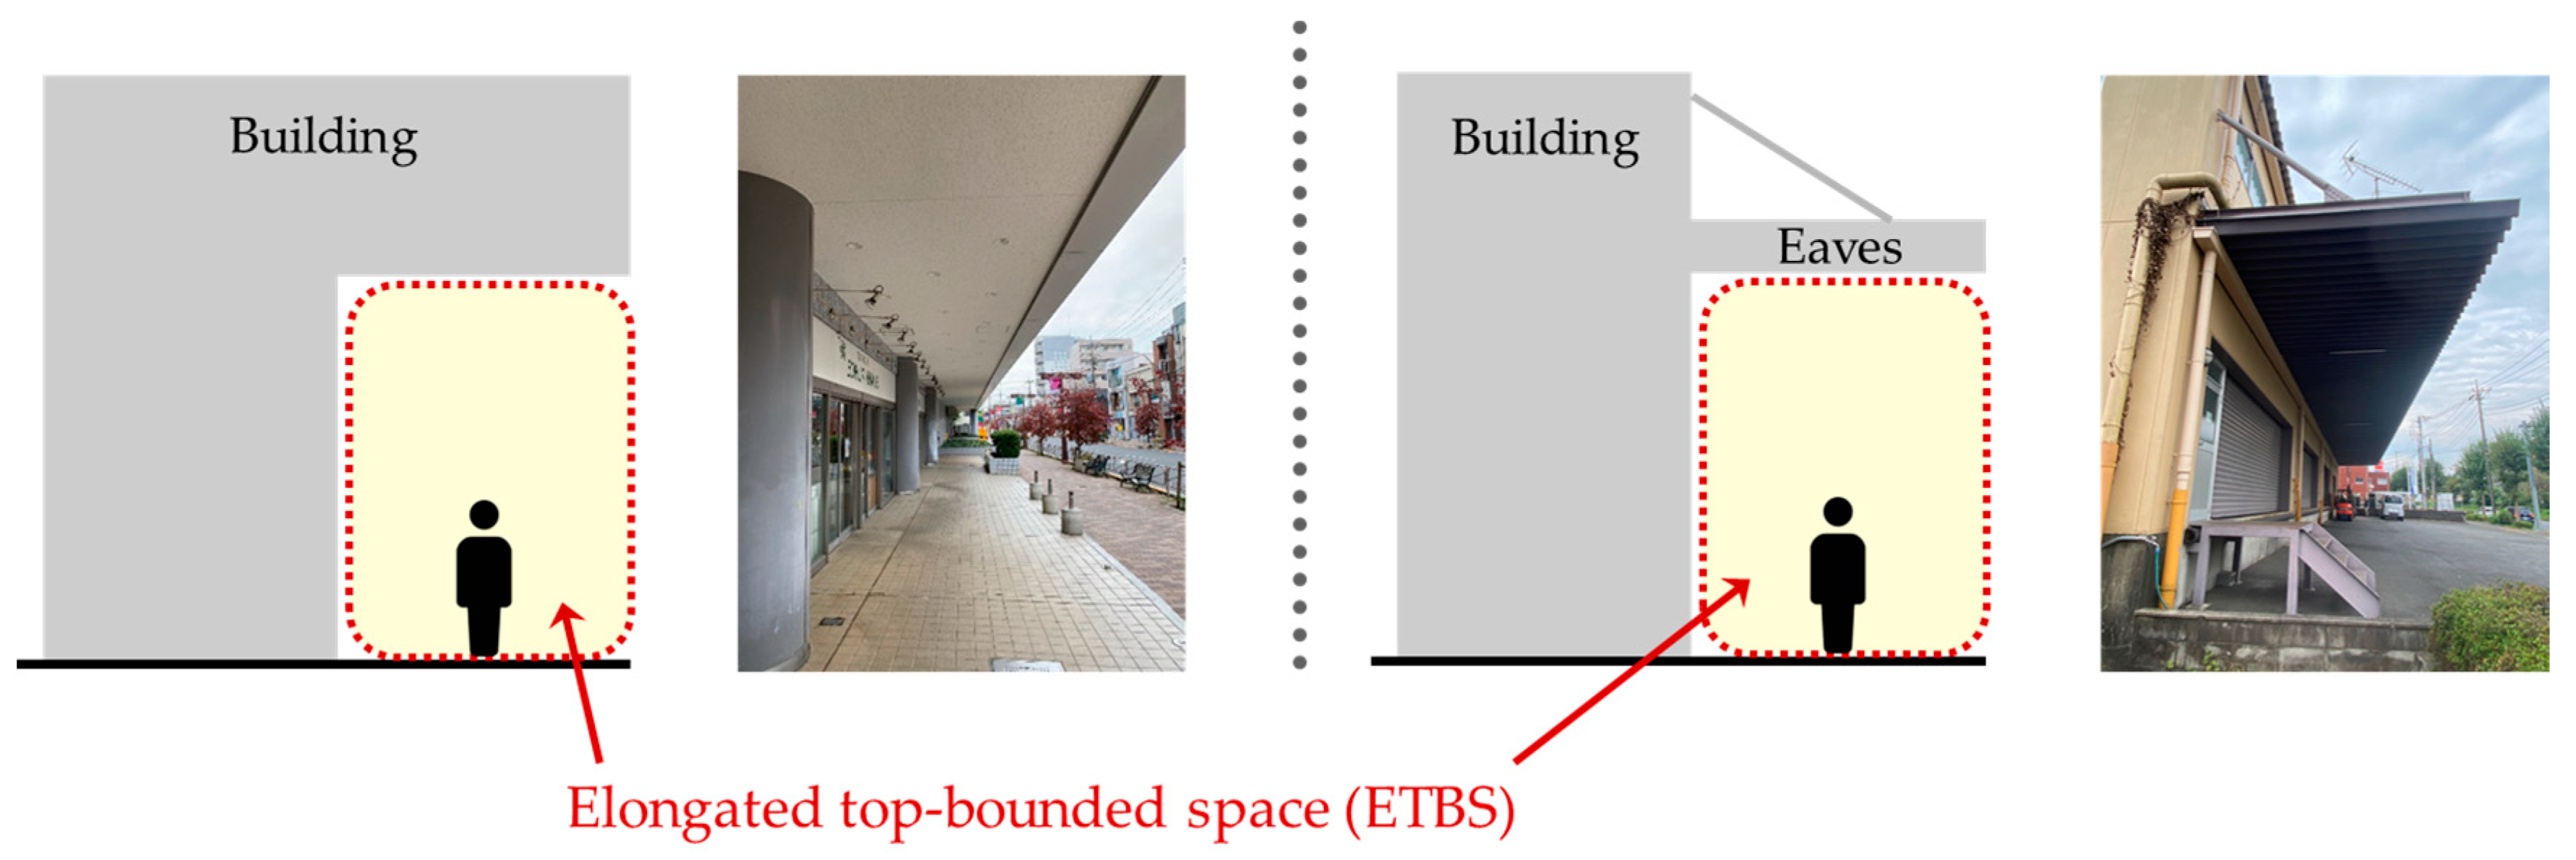
Conversely, the shapes of the TBSs in real space are varied, making it difficult to develop a method that can be applied to all cases. In this study, we focused on a corridor-like space or elongated rectangular shape that can be observed in commercial facilities, logistics facilities, and street-facing sidewalks. In this study, we defined the TBS of such spatial characteristics as elongated top-bounded space (ETBS).
The remainder of this paper is organized as follows. Section 2 provides an overview of the studies relevant to our proposed method. Section 3 describes the designed method that utilizes the spatial characteristics of ETBS and fuzzy inference to detect the stay in the three spatial contexts. Two spaces with three spatial contexts, including ETBS, were selected, and we conducted evaluation experiments in Section 4 to confirm the effectiveness of the proposed method. Based on the results of the evaluation experiments, a discussion is presented in Section 5. Finally, Section 6 concludes the paper.

2. Related Work

Numerous studies on seamless positioning have been conducted so far, but most of them have proposed positioning methods to seamlessly connect outdoor and indoor spaces. However, in reality, classifying real space into two types, outdoor space and indoor space, is difficult, and some studies have provided various definitions of semi-boundary space. The authors of [11] defined a corridor-like space with a roof as a “typical semi-outdoor” and proposed a method enabling seamless switching of positioning in three spatial classifications: Outdoor space, indoor space, and semi-outdoor space. Also, the authors of [12] proposed a method to discriminate four spatial classifications, open-sky, urban, intermediate, and indoor, in which intermediate is defined as a space whose upper part is covered by a building and at least one of the surrounding sides of the area is open. Thus, there has been no unified and quantitative definition of semi-boundary space. Therefore, a framework was also proposed to classify all spaces into four categories, outdoor, semi-outdoor, semi-indoor, and indoor, and spaces were quantitatively classified according to the degree of top closure and side closure [14]. However, from the point of view of GPS positioning, the degree of influence of GPS positioning is expected to change as the height of the space changes, even if the space has the same shape in two dimensions. The current definition on TBS does not consider this issue.
Also, although numerous methods for seamless positioning and IO detection have been proposed, only a few have been studied considering TBS. Some studies have used the changes in the GPS SNR values to detect TBS stay and determined TBS stay when the average value of the SNR of the available satellites is lower than that of the outdoor stay [11,12]. The authors of [11] proposed a threshold value of more than 20% attenuation of the mean SNR of the available satellite during a TBS stay compared with the outdoors. The authors of [12] proposed a method for detecting four spatial contexts, open-sky, urban, intermediate, and indoor, using GPS SNR. Specifically, this study utilized a clear difference between the sum of the satellites with SNR values greater than 25 dB-Hz and the total SNR compared with the case of outdoor. However, neither study has quantitatively demonstrated the characteristics of the TBSs under study. Therefore, whether the proposed method is universally applicable to other spaces is still unclear.
Conversely, the change in the SNR value at the time of TBS entry is based on the fact that the receiving device is in the NLOS condition where it cannot directly receive GNSS signals due to the shielding of buildings, and the value of SNR is reduced compared with that in the line-of-sight (LOS) condition where the receiving device can directly receive the signals [15]. One of the typical methods for determining LOS/NLOS is the use of a 3D building model. This method uses a 3D building model to determine if the position can receive satellite signals without blocking [16,17]. In most cases, this method aims to improve the positioning accuracy in urban areas using only satellite signals that can be directly received. Although the use of 3D building models makes it possible to predict LOS/NLOS to some extent, for the detection of TBS stay, precise 3D building models are required, which is a challenge in terms of cost. Another method for estimating LOS/NLOS is the use of image analysis using a fisheye camera or other techniques. However, it is difficult to use on devices such as smartphones [18,19].
In addition, as an example of using fuzzy inference to determine the spatial context, the authors of [12] proposed a decision flow that employs fuzzy inference using SNR data obtained from satellites as input values to determine whether a situation is an urban space or open sky. However, since this decision flow cannot be used to detect other spatial contexts, a new decision flow must be designed to detect ETBS.

3. Design of Multiple Spatial Context Detection Method Considering ETBS

The purpose of this study was to design a method that can stably detect a stay in three spaces: Outdoor, indoor, and ETBS. The research flow of this study to achieve this purpose is presented in Figure 1. Based on the findings of the related work in Section 2, we analyze requirements for ETBS stay detection in Section 3.1. Then, we design a multiple spatial context detection method for outdoor, indoor, and ETBS detection in Section 3.2. The effectiveness of the designed method is confirmed through evaluation experiments in Section 4.

3.1. Requirements for ETBS Stay Detection

An example of the ETBS to be targeted in this study is presented in Figure 2. Such spaces are often found in street-facing sidewalks and commercial and logistics facilities.
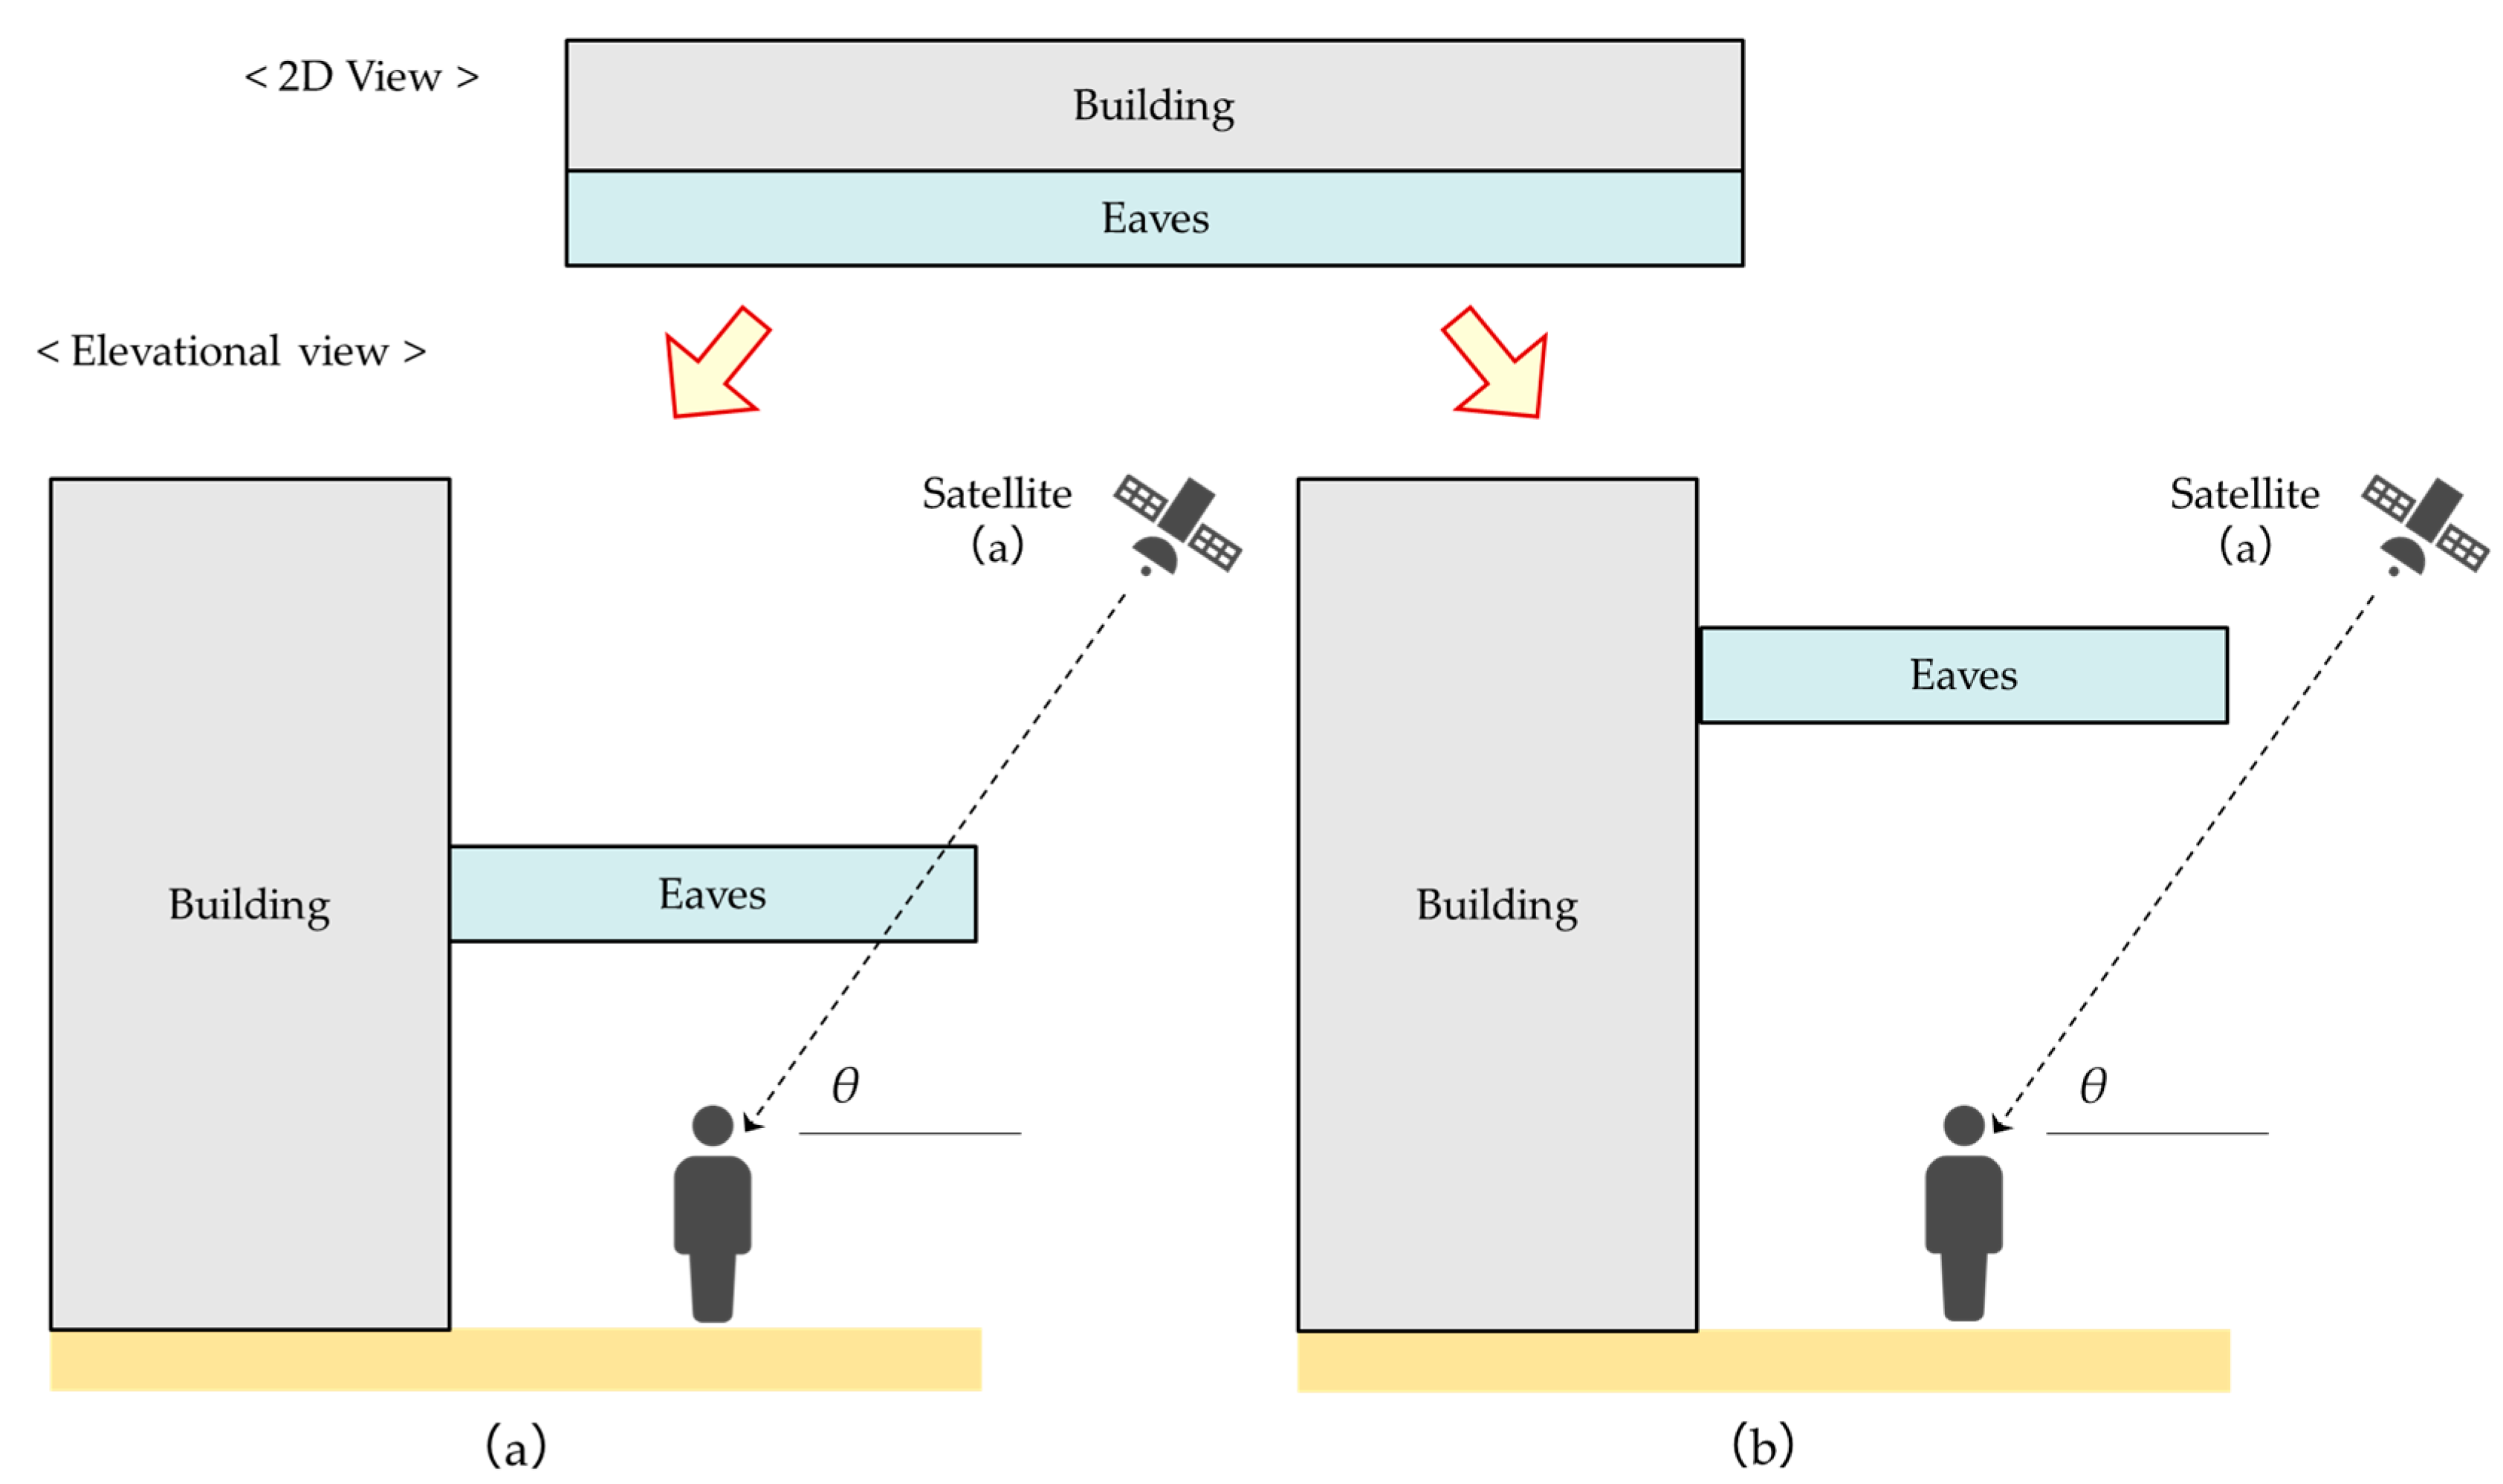
In detecting ETBS stay from two viewpoints, two challenges can be encountered. The first is that the shape of the ETBS varies from space to space, and the height of the ETBS must be considered. For example, as presented in Figure 3, if the shape is the same in two dimensions but the height is different, a clear difference in impact in terms of GPS positioning exists. In the case of Figure 3a, even if the satellite is in the same orbit, it is presumed to be in the NLOS state due to the shielding between the satellite and receiving device. However, in the case of Figure 3b, the receiving device can directly receive the satellite signal. Similarly, the differences in spatial depth are also important information for detection. If the depth is different even at the same height, the positional relationship between the satellite and receiving device is different, which may affect the GPS positioning.
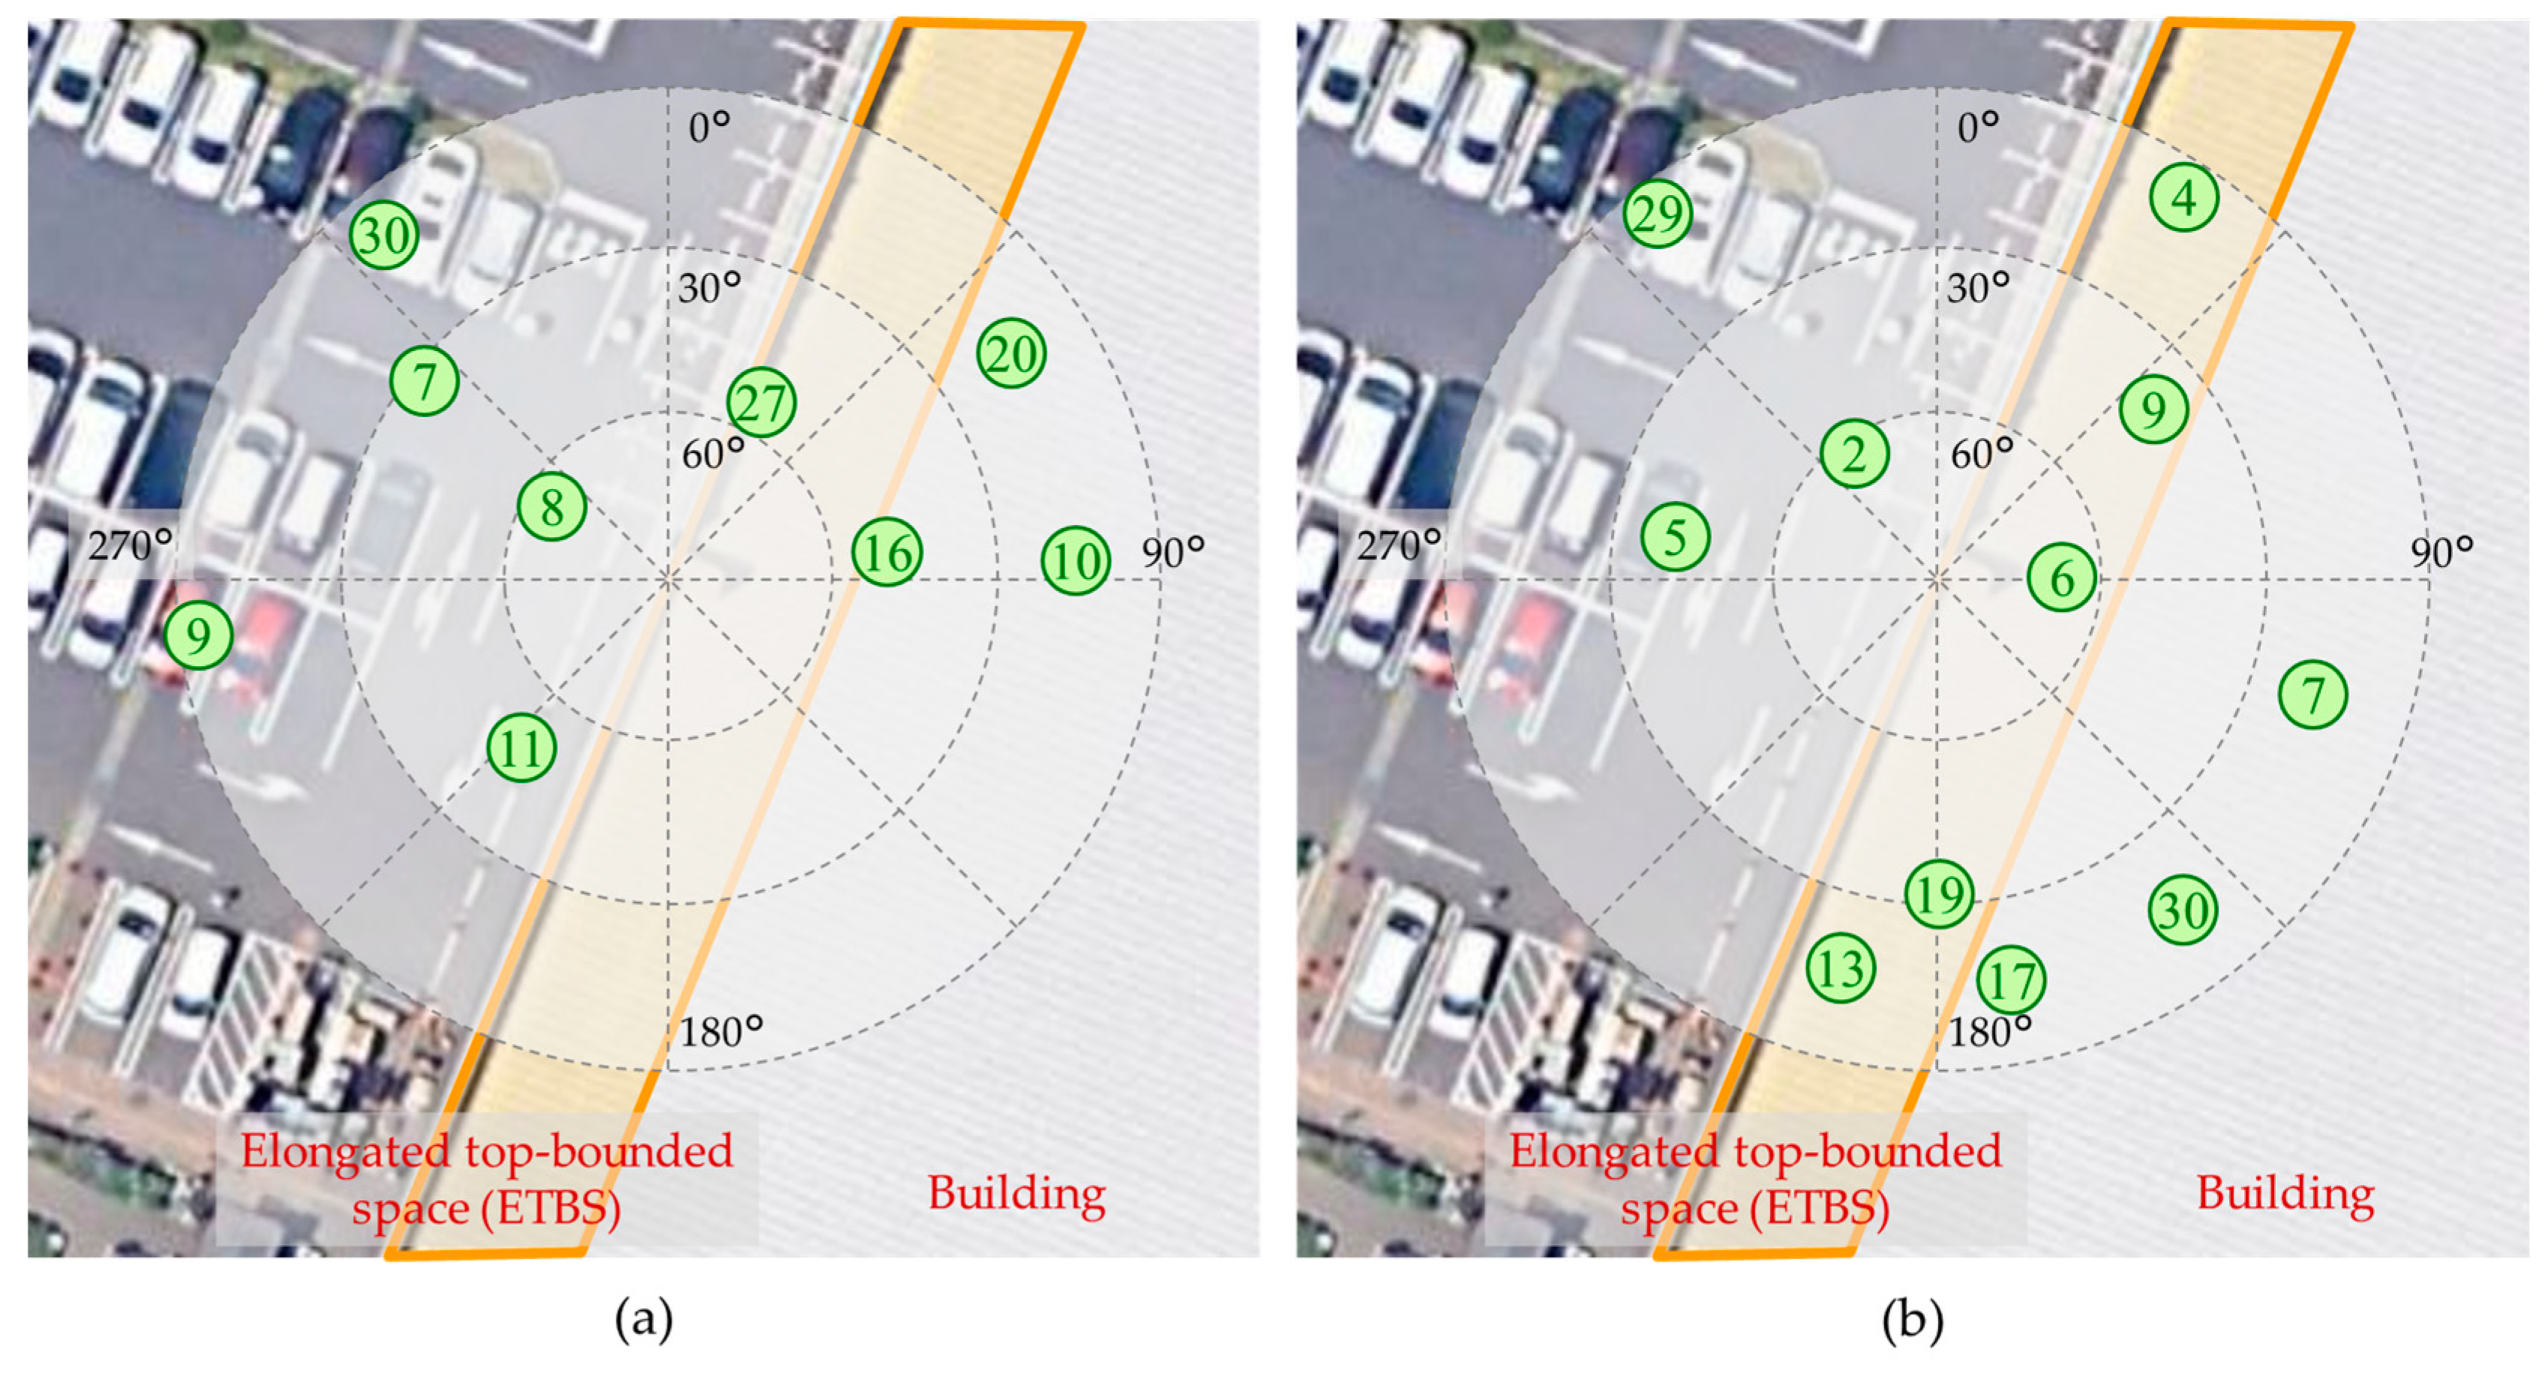
The second challenge is that the configuration of satellite in the orbit is constantly changing over time. Figure 4 presents an example of the difference between the morning and afternoon satellite configurations at the same location. For example, in Figure 4a, numerous satellites are plotted in the opposite orientation of the building, whereas in Figure 4b, numerous satellites are plotted in the orientation of the building. Satellite signals plotted in the orientation of a building may not directly receive the signal due to the shielding of the building. In designing a detection method, the ability of the method to respond to constantly changing satellite configurations must be considered.

3.2. Design of Multiple Spatial Context Detection Method Considering ETBS

3.2.1. Overview

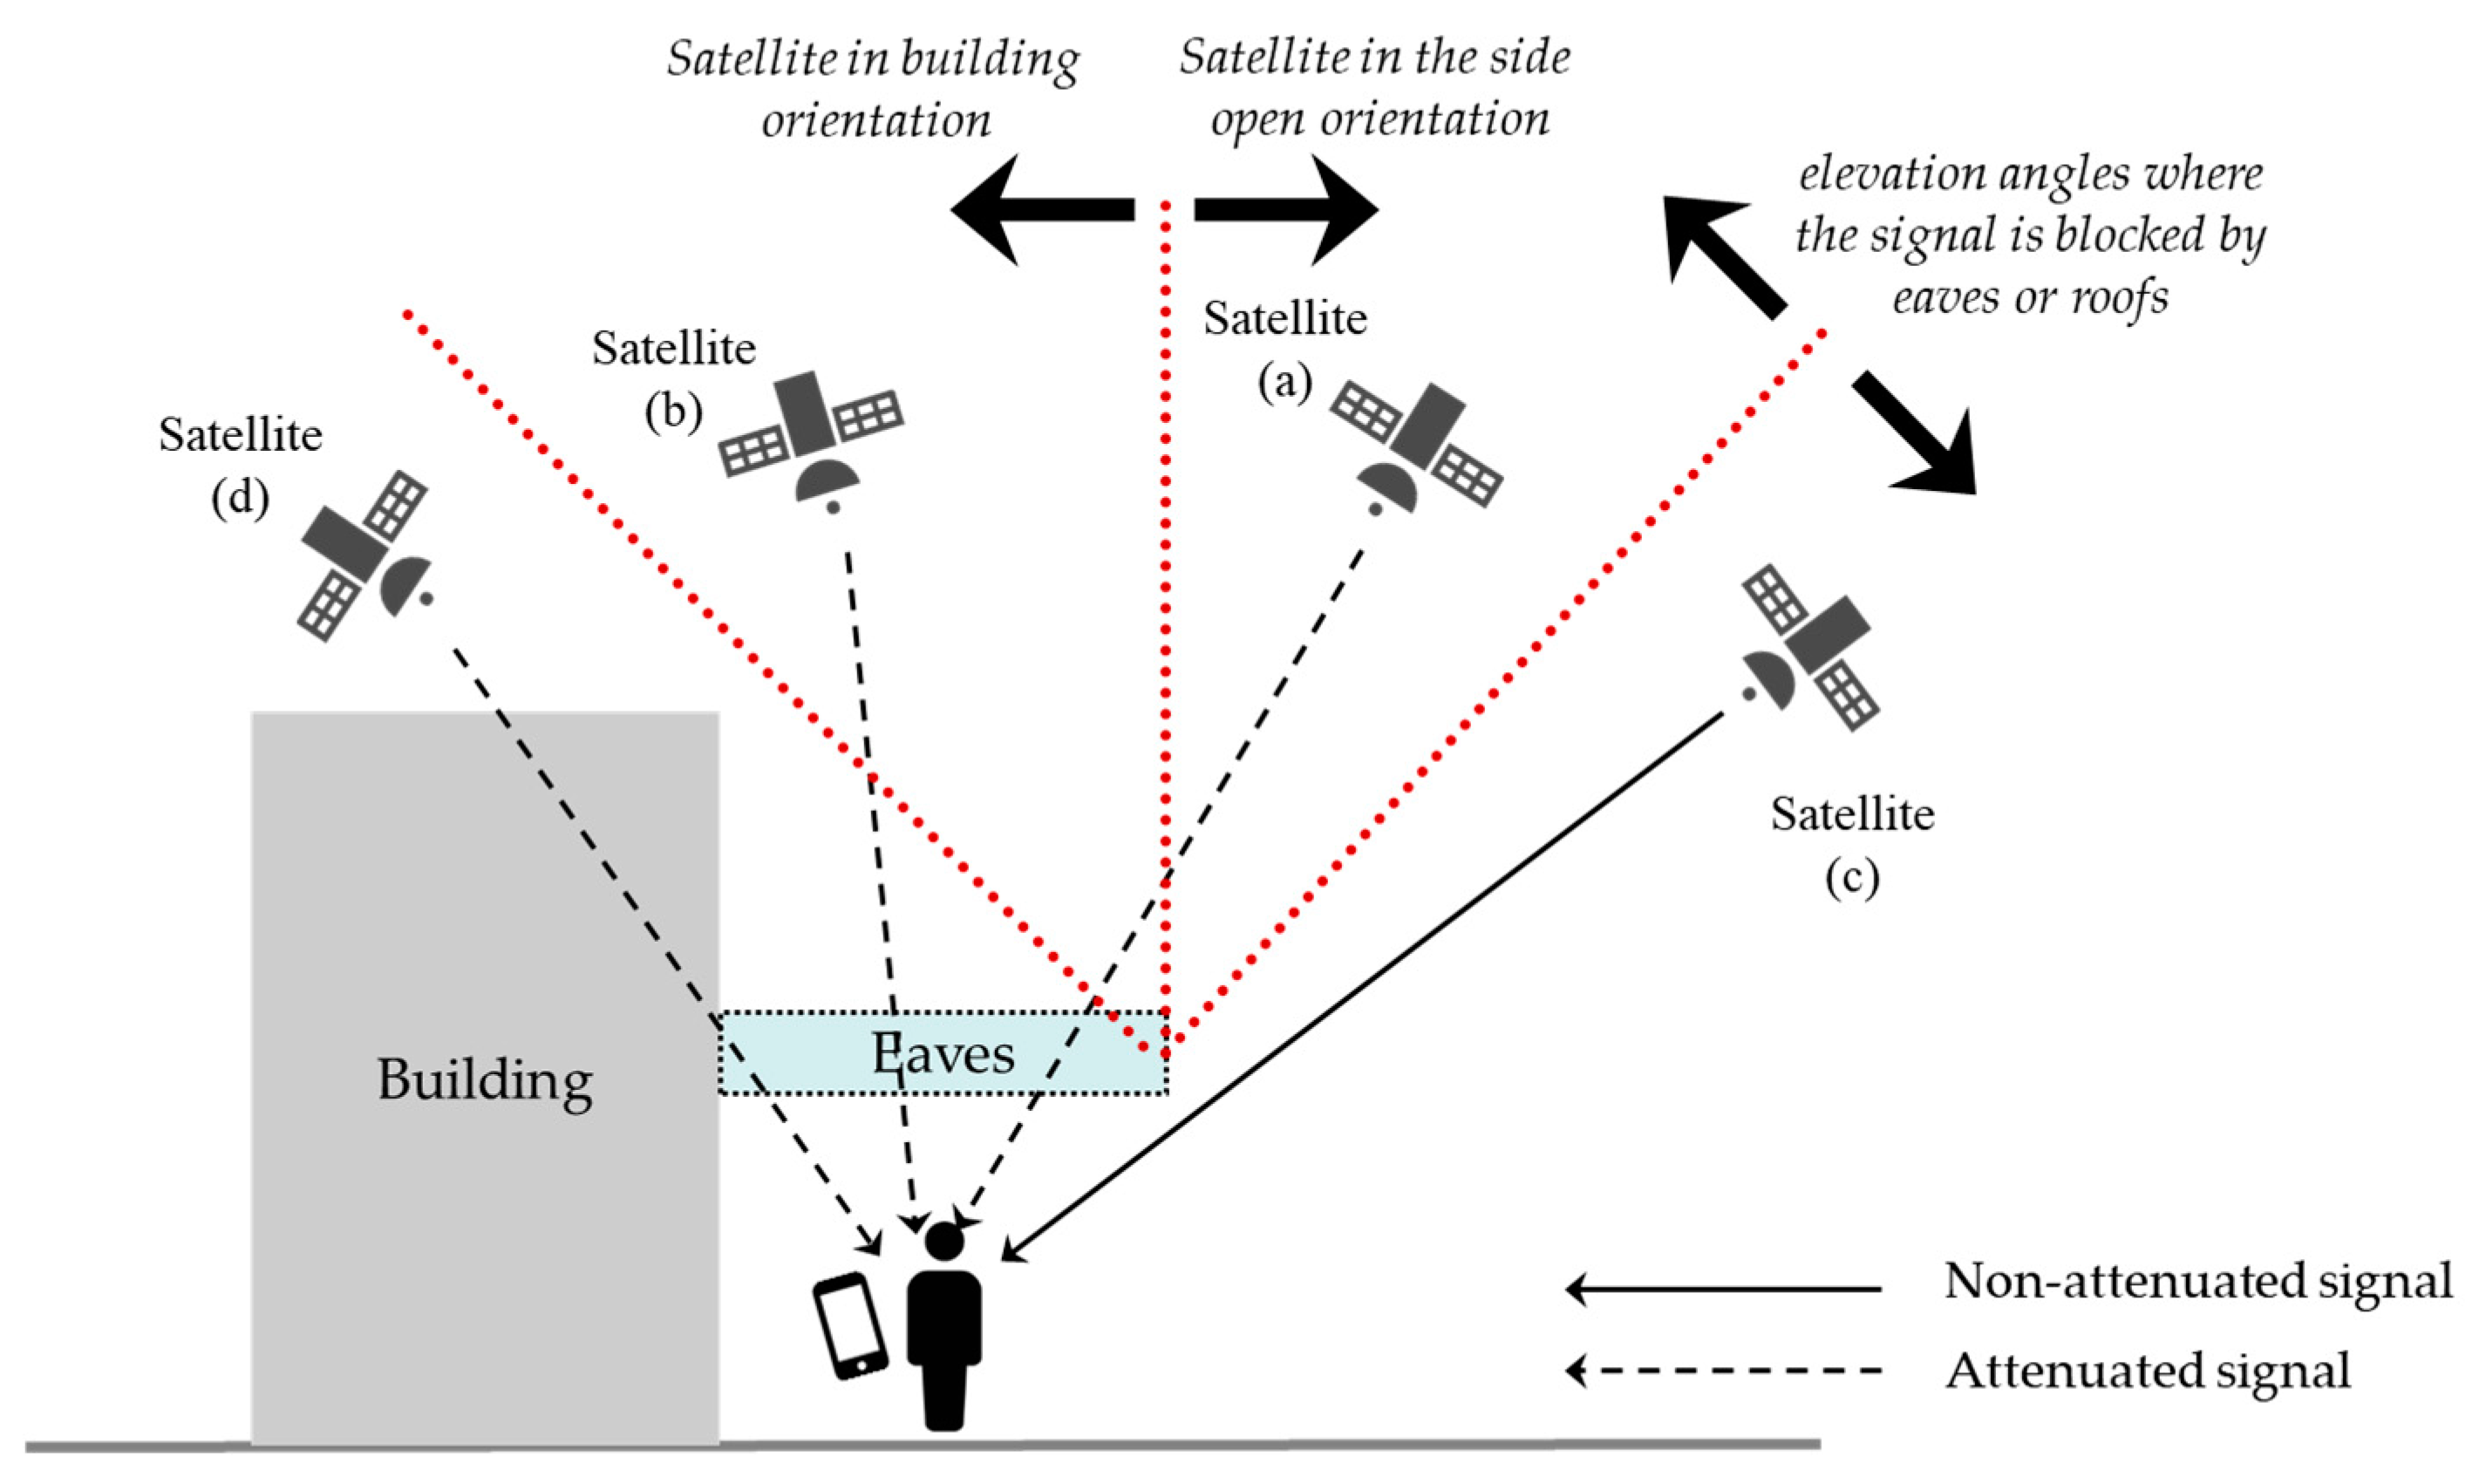
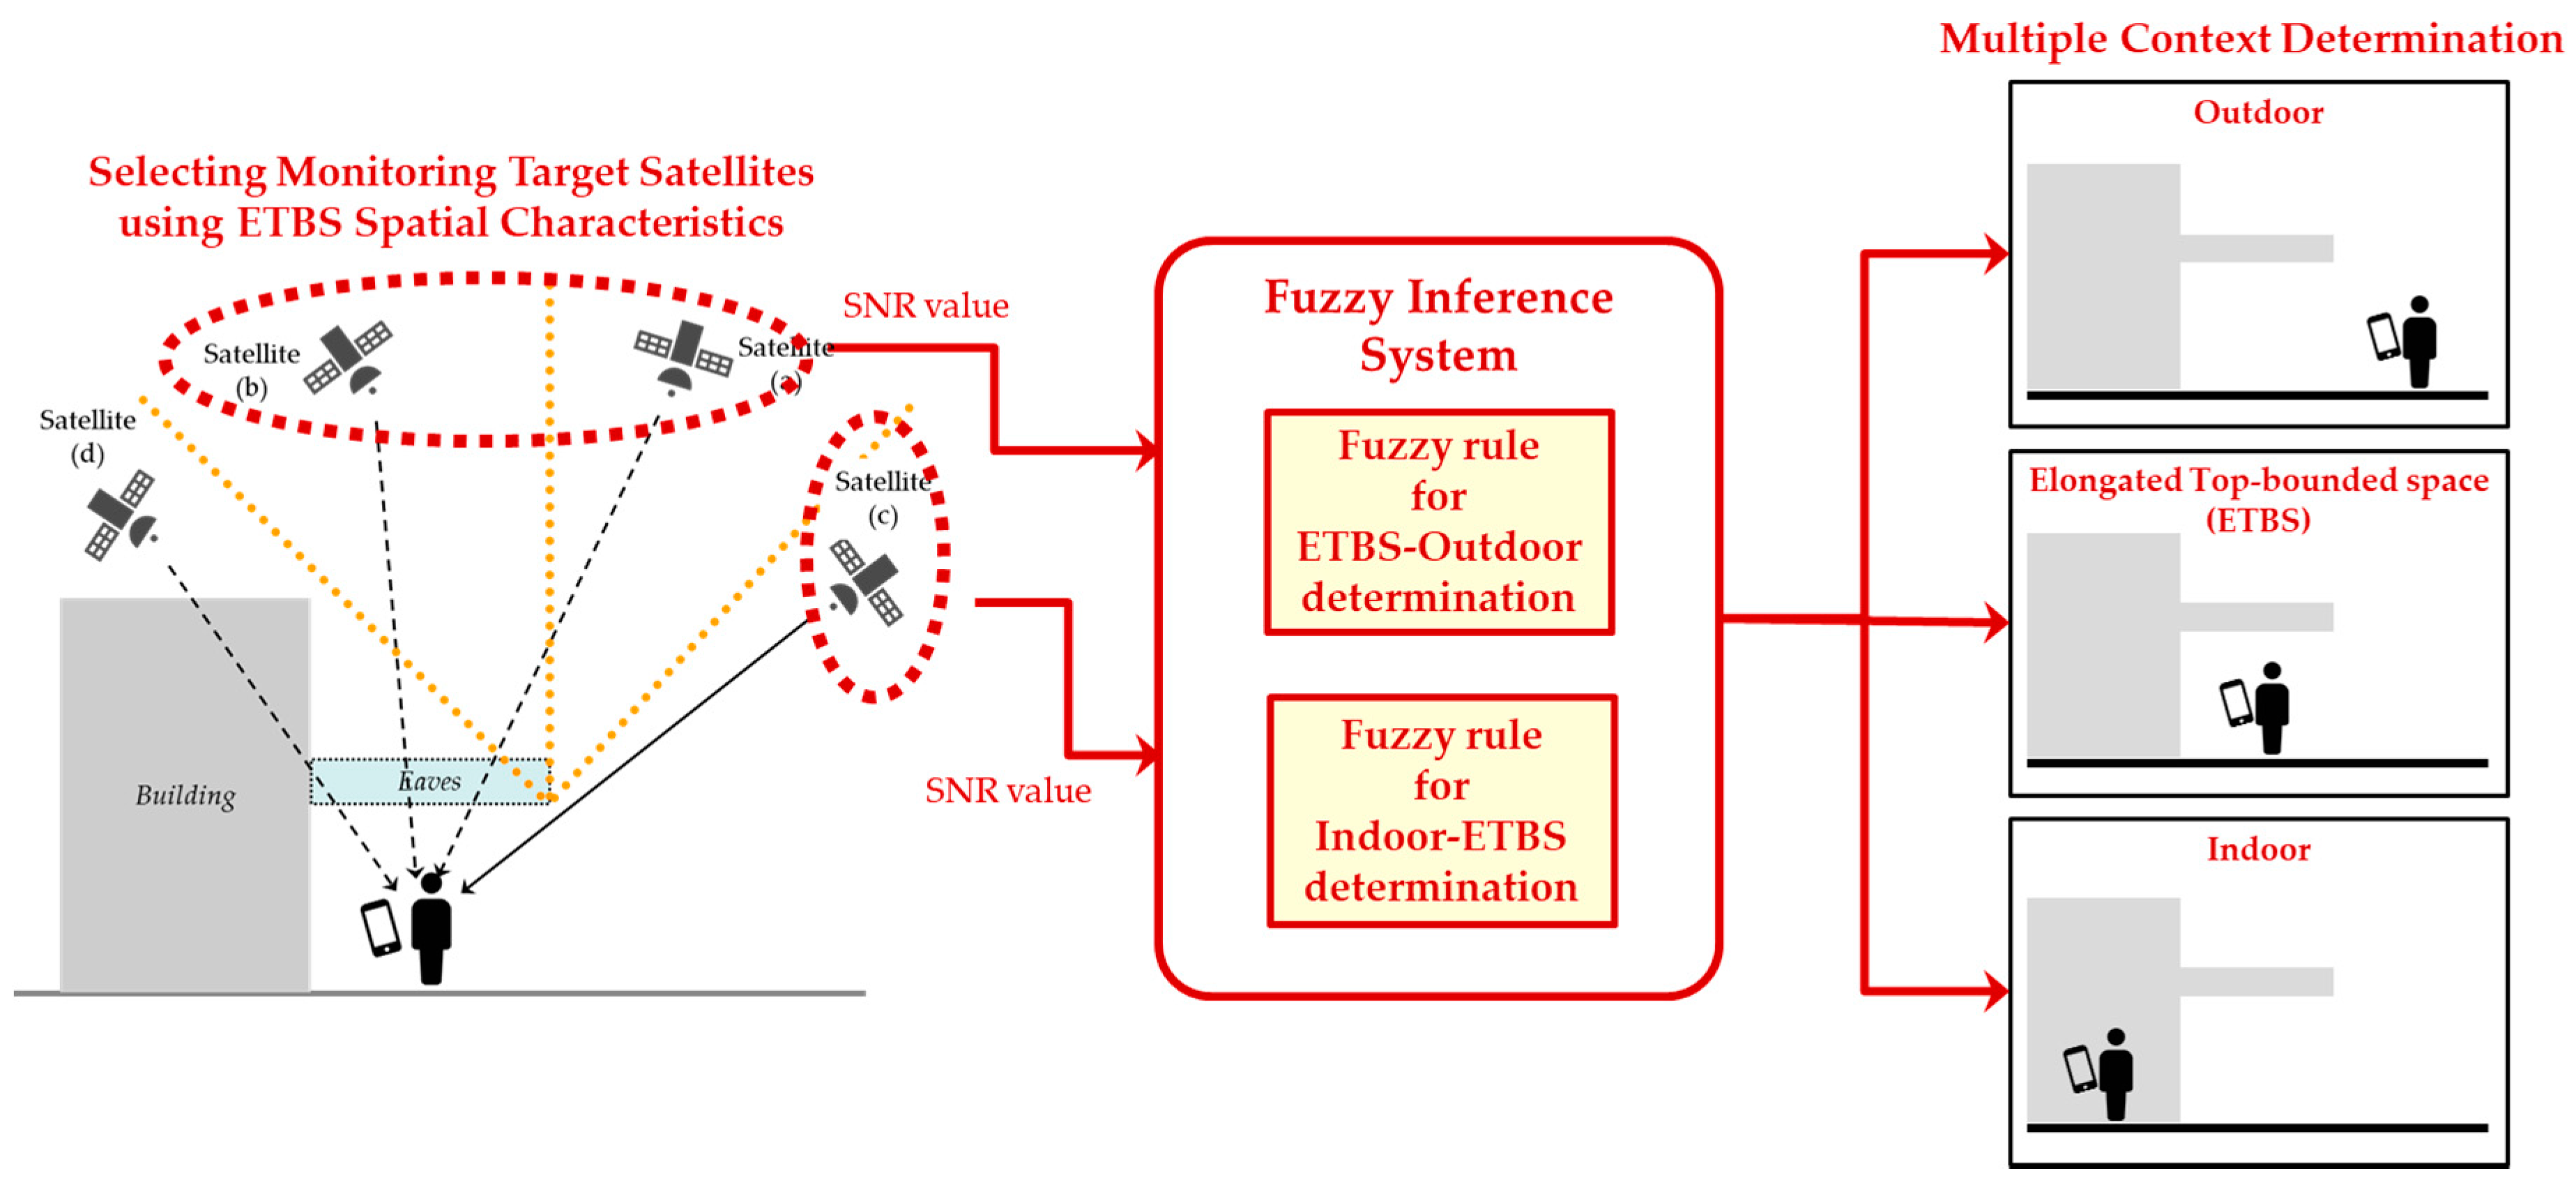
Although there is a constant change in satellite configuration over time, considering the ETBS, the satellites in the orbit can be classified into four categories, as presented in Figure 5. Selecting satellites that might change the receiving condition of the satellite signal as the ETBS stays makes the stable detection of ETBS stay possible. By selecting satellites where the reception conditions of the satellite signal may change as the ETBS stays, the ETBS stay can be stably detected. They are satellites that are located at high elevation angles where the signal is blocked by eaves or roofs, and in the open side orientation of the ETBS. In this study, we adopted a simple way to select satellites using three parameters of the ETBS, height, depth, and open orientation of the sides, instead of a 3D building model.
When the receiving device enters the ETBS and is unable to directly receive the GPS signal, the SNR value that can be obtained in the National Marine Electronics Association (NMEA) format is attenuated. However, setting a fixed threshold to determine the ETBS stay in a situation where the satellite configuration is constantly changing and the shape of the ETBS varies from space to space is difficult. One typical method of reasoning that deals with events for which it is difficult to set a fixed threshold is fuzzy inference. In this study, we designed a decision flow to determine the spatial context in which the receiving device stayed using the SNR values obtained by the receiving device using fuzzy inference.
Figure 6 presents the overall structure of the proposed method. The SNR of the selected satellite is used as an input to make a decision using fuzzy inference in order to detect which space the receiving device is in: Outdoor, ETBS, or indoor.

3.2.2. Satellite Classification Using the Entry Angle Threshold and Side Open Orientation

As presented in Figure 5, the satellites in the orbit can be classified into four groups, considering the spatial characteristics of the ETBS. Satellite (a), which has a high elevation angle and open side orientation, can receive satellite signals when it is located outdoor without being affected by eaves and buildings. However, it is expected to be influenced by the eaves when it enters the ETBS and will not be able to receive sufficient signals. Since Satellite (b) is located in the orientation of a building, determining whether the SNR attenuation is caused by the eaves or the building is difficult. However, the SNR attenuation is expected to occur and can be used as a complementary feature to detect the TBS stay. Since the elevation angle of Satellite (c) is not high, the SNR attenuation associated with the entry into the TBS is less likely to occur. Conversely, the combination of satellite attenuation in Satellite (a) and no attenuation in Satellite (c) can be used to detect the TBS stay. Alternatively, when the receiving device goes deep into the ETBS, the attenuation may occur. Satellite (d) is not expected to receive sufficient GPS signals, even outdoors, as it does not have a sufficiently high elevation angle to exist in the orientation of buildings.
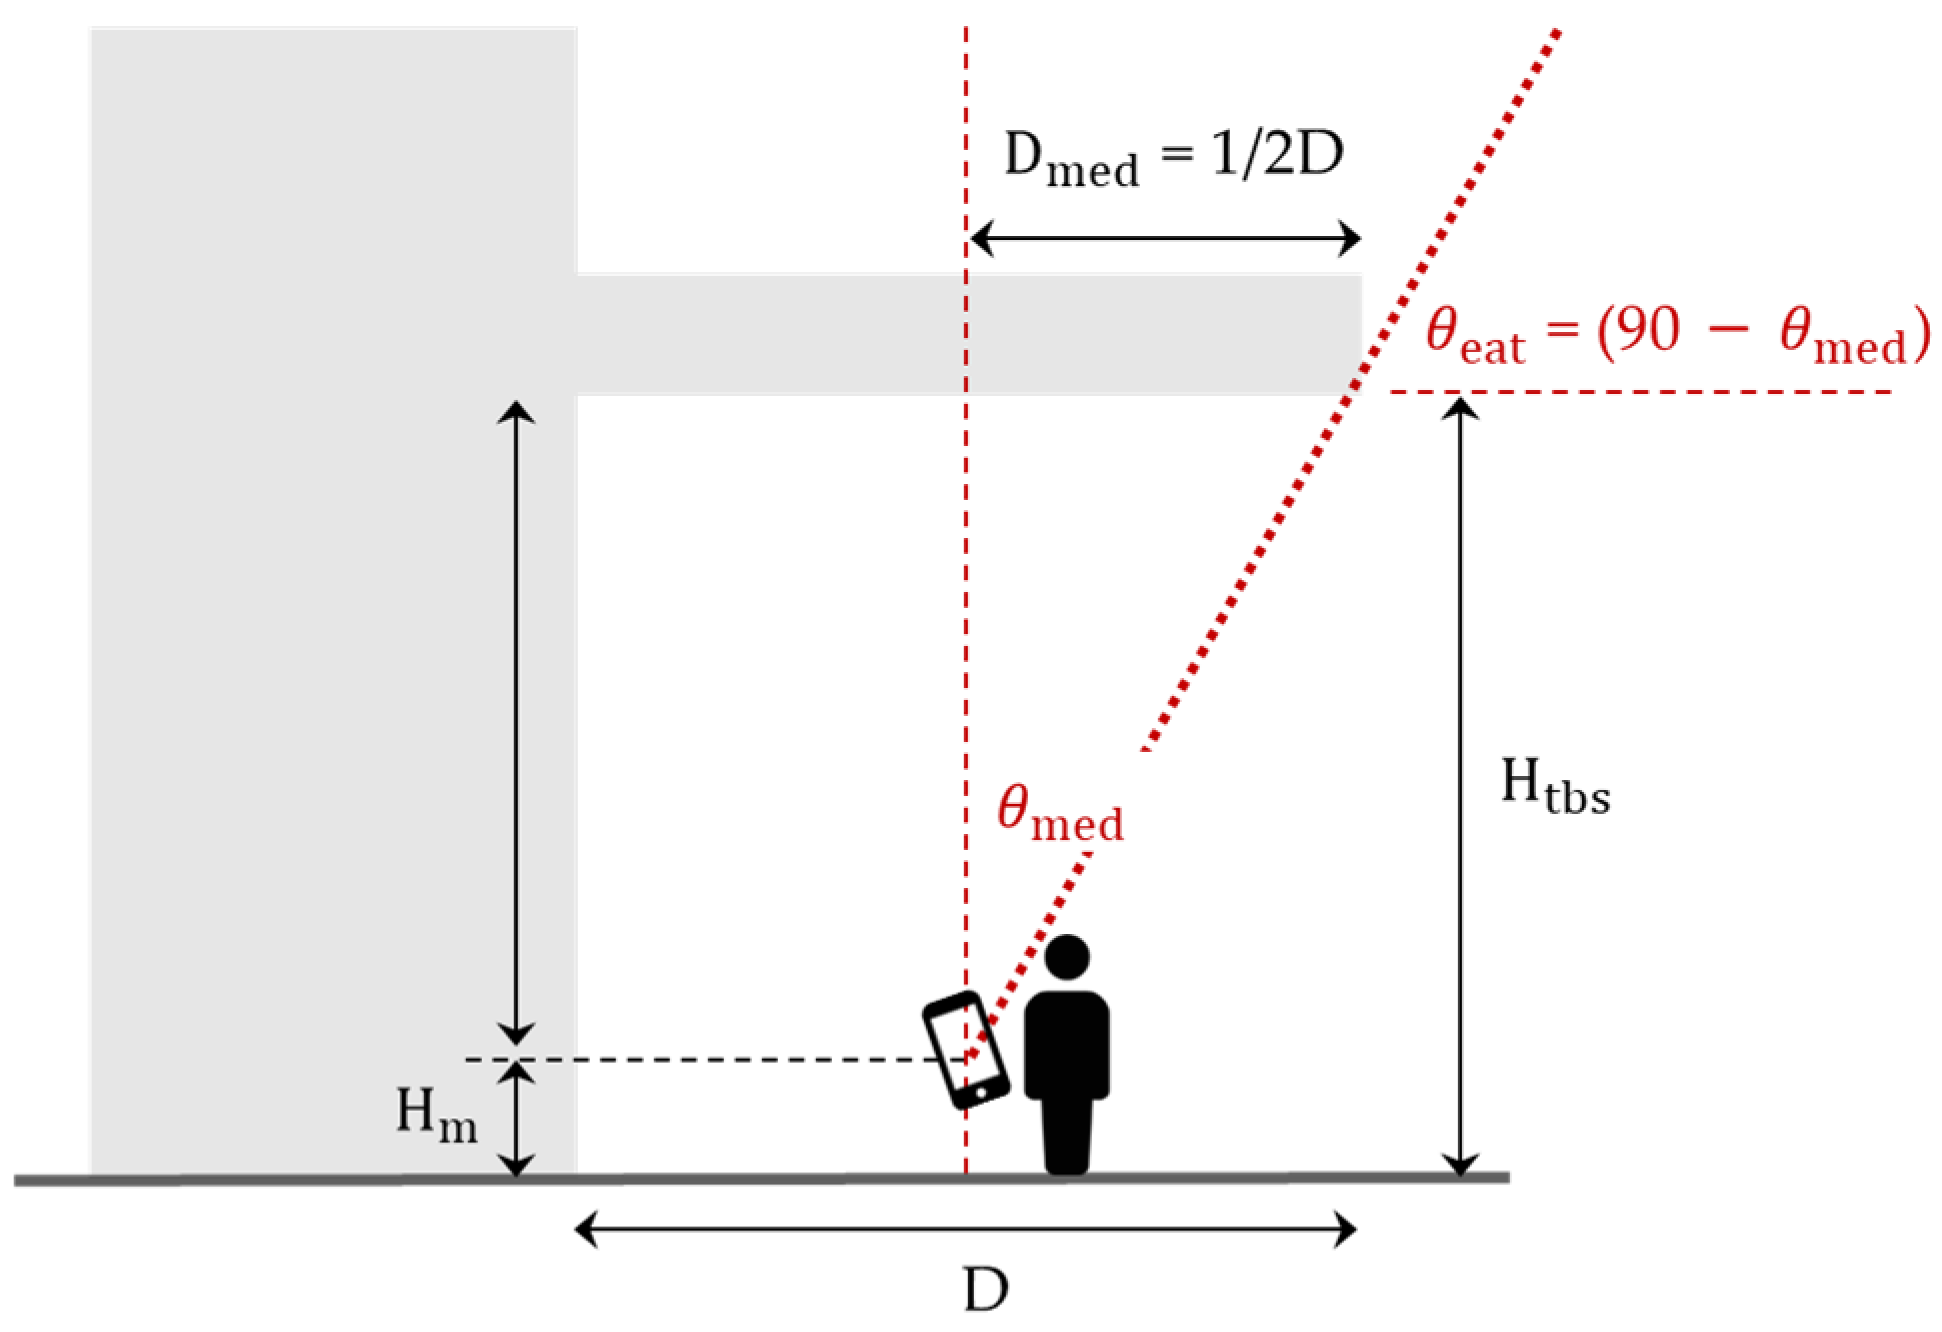
To be able to classify the satellites in the orbit into four categories, it is important to set the thresholds for two parameters, elevation and azimuth angle, and compare them with those of each satellite included in the NMEA format. For the elevation angle, the angle of entry can be calculated using Equations (1) and (2), utilizing the height and depth of the ETBS, as presented in Figure 7.
    θ e a t   =   90 θ m e d
    θ m e d   =   tan 1 1 2 D ( H t b s H m )
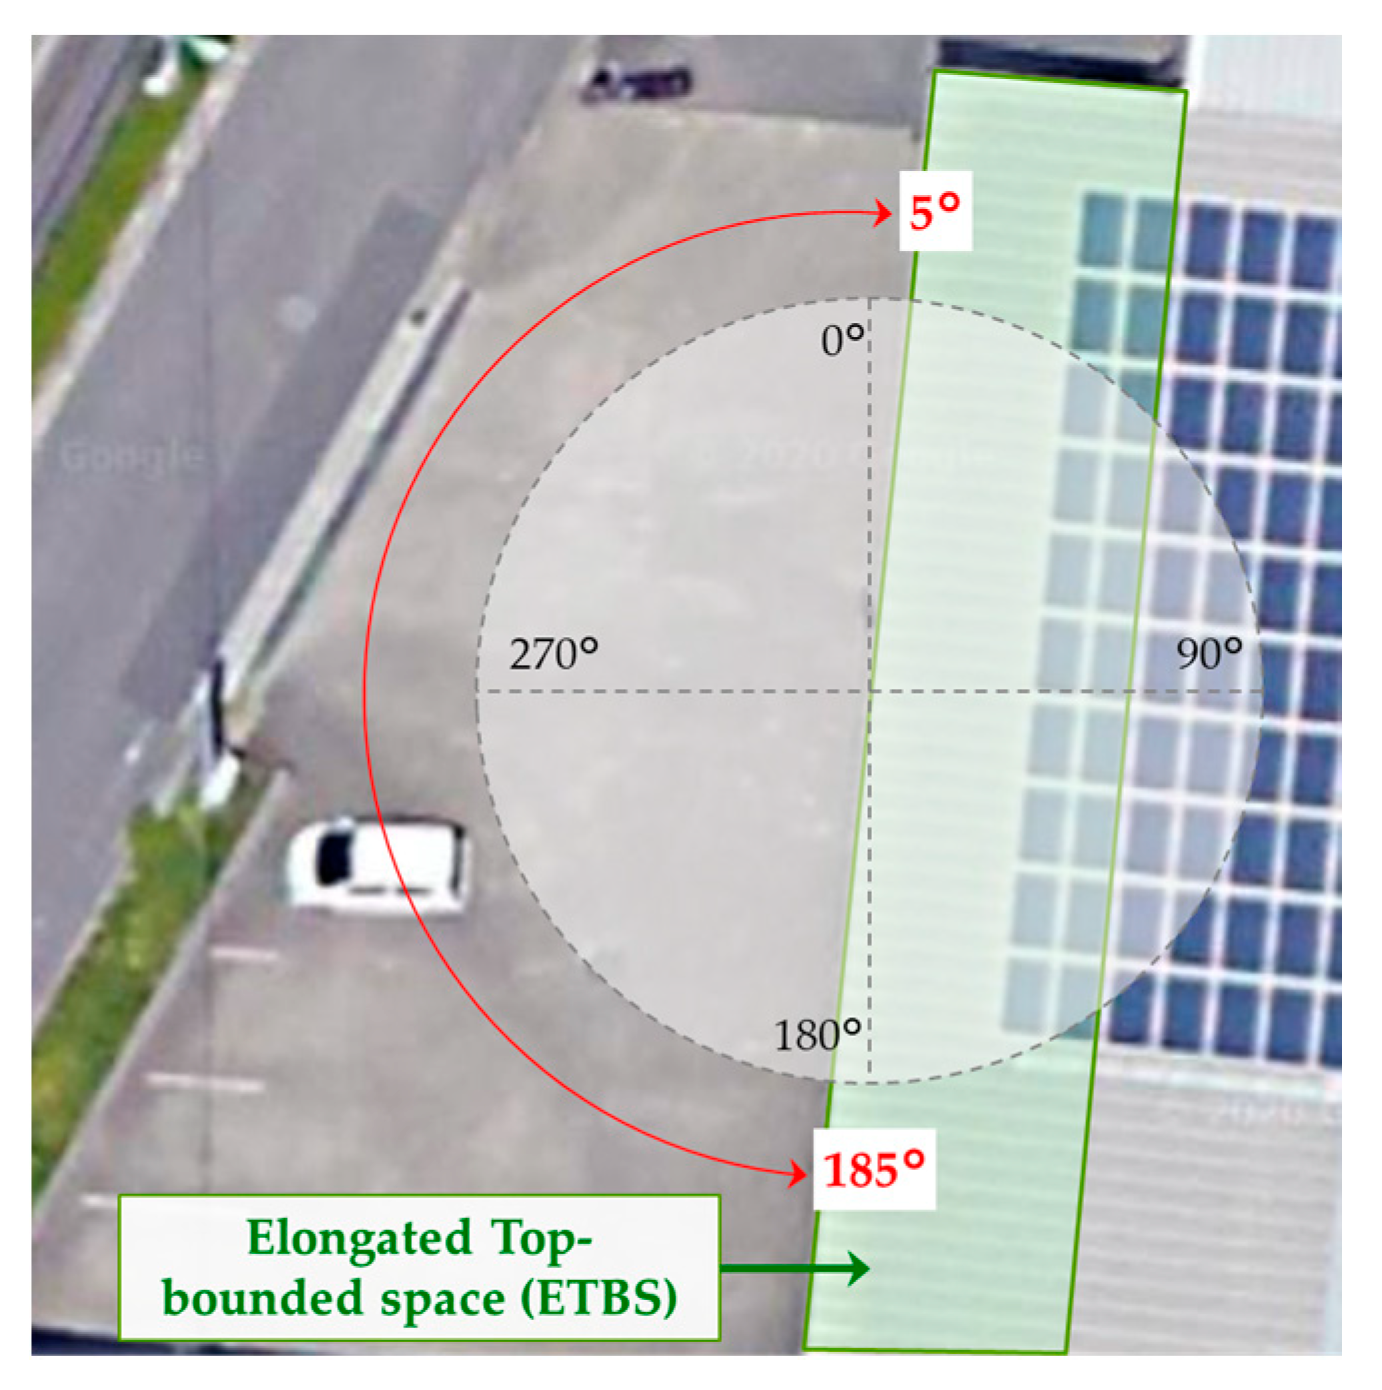
where θ e a t denotes the entry angle threshold of the ETBS; D, the depth of the ETBS; H t b s , the height of the ETBS; and H m , the height to hold the smartphone. The entry angle threshold can also be set at the angle of entry to the deepest point of the ETBS. However, it is assumed that a person with a receiving device may stay at a shallow angle of entry without needing to go to the back of the room. To increase the probability of ETBS stay detection in such conditions, we decided to extract the satellites influenced by the eaves using one-half of the depth as a criterion of the entry angle. The open orientation of the sides can be obtained using map services or geographic information systems, such as Google Maps. Figure 8 presents an example of the calculation of the open side orientation. The angle to be set is 180°, as this study focuses on a rectangular, elongated TBS.
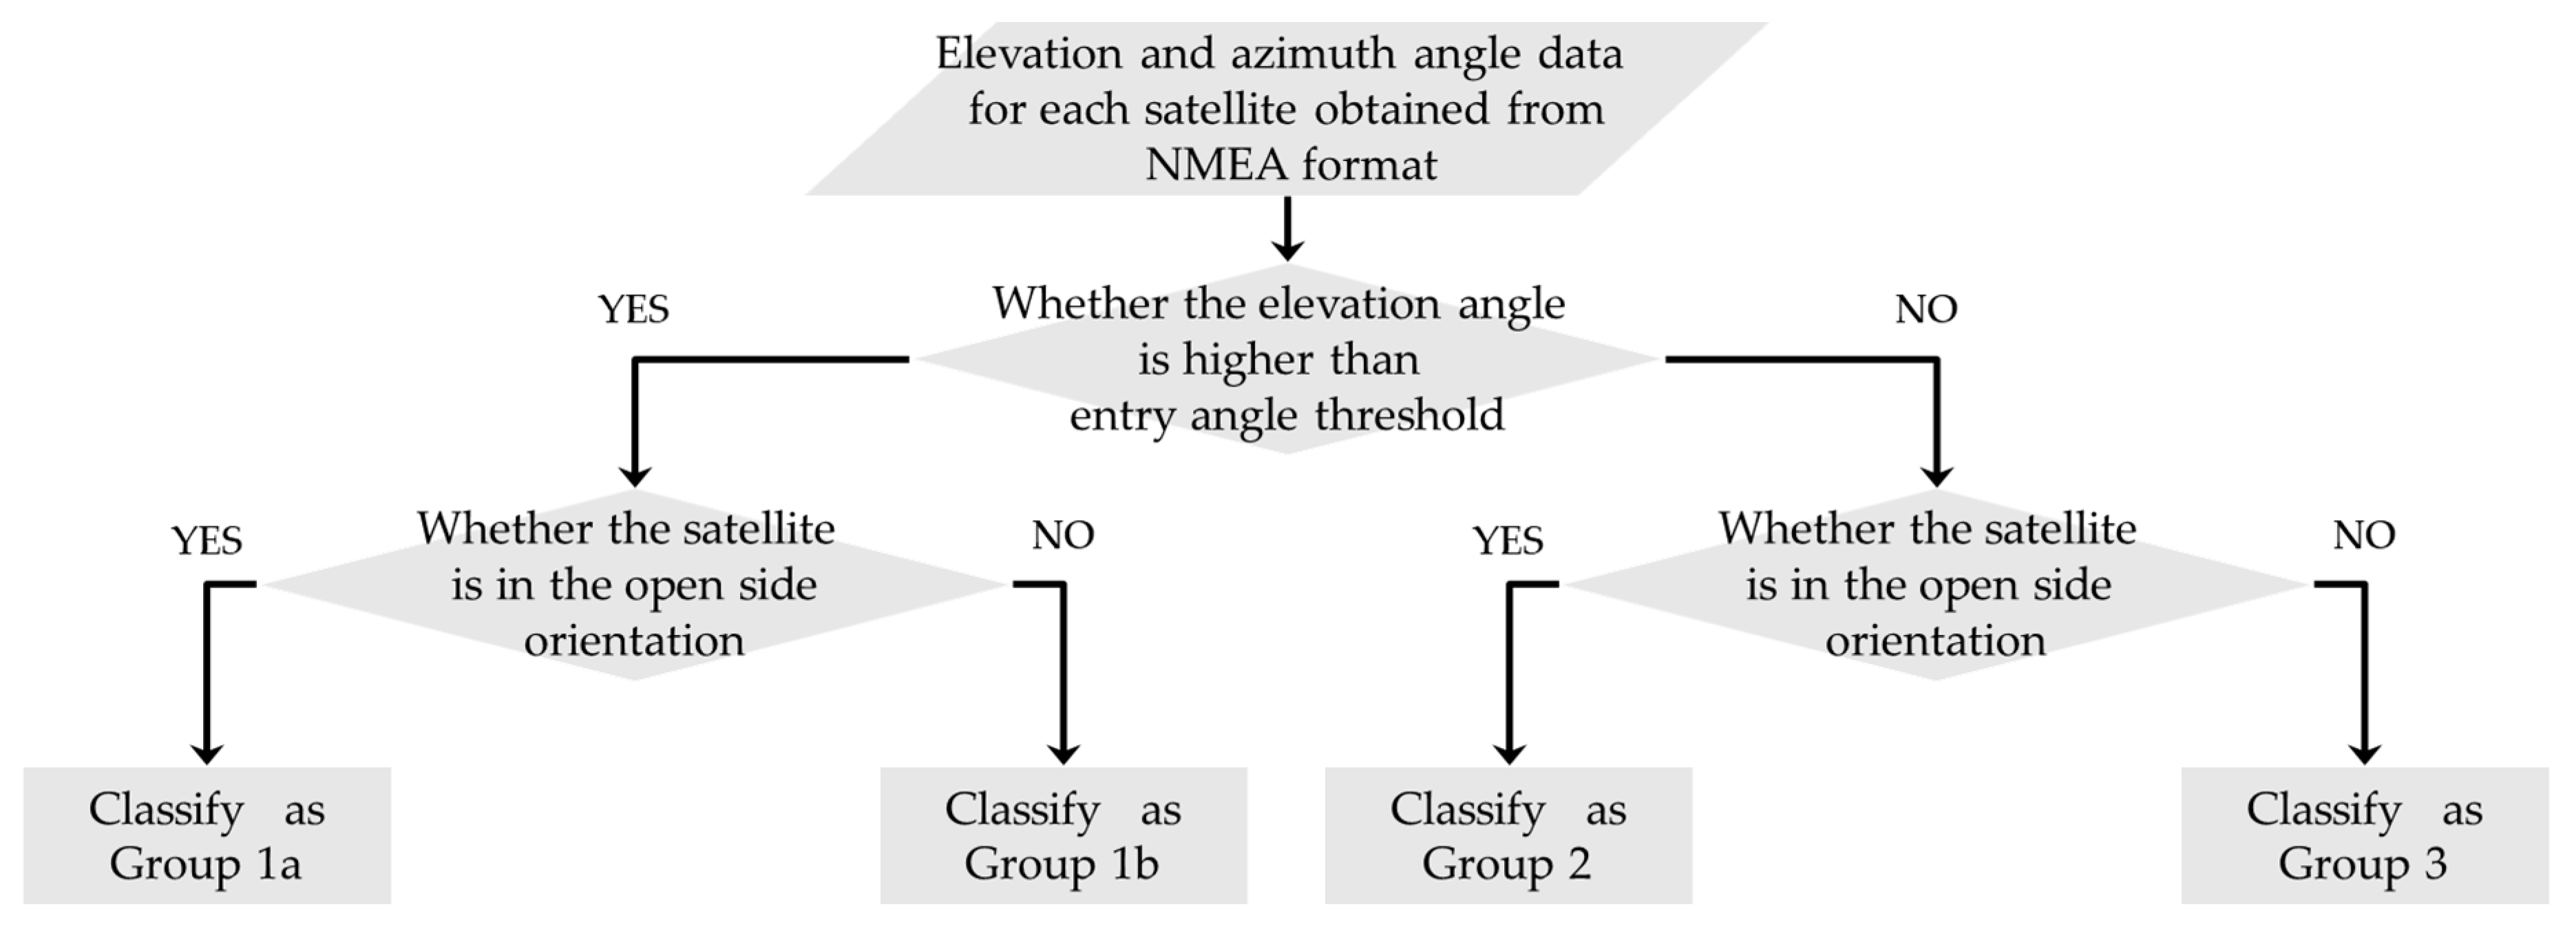
Satellites in the orbit can be classified into the groups presented in Figure 9 according to two parameters: “Entry Angle Threshold” and “Open Side Orientation.” Among them, Group 1 includes Group 1a and Group 1b, and the satellite that belongs to Group 1a has the highest priority for ETBS stay detection. If no Group 1a satellite exists in the group due to the satellite configuration, the second highest priority is Group 1b. Group 2 satellites do not have a high elevation angle, but they are in the open side orientation. Since the elevation angle of this group of satellites is lower than the entry angle threshold, the SNR value is unlikely to be attenuated even if the receiver is in the ETBS. However, it may be attenuated depending on the depth of entry and the location relationship with the side open orientation Group 3 satellites are not utilized for stay detection, owing to their low elevation in the building orientation. In the decision flow discussed in Section 3.2.3, we used one Group 1 and one Group 2 satellite. If there is more than one satellite in the same group, the satellite with the highest elevation angle should be utilized.

3.2.3. Design of the Decision Flow for Multiple Spatial Context Detection Using Fuzzy Inference

Some studies have used the SNR attenuation value to detect entry into the TBS compared with the outdoor stay. However, when using this method, it should be known in advance that the receiving device is located in the outdoor space. The SNR values were reported to range between 35 dB-Hz and 45 dB-Hz in outdoor spaces and attenuated to 25–35 dB-Hz in light indoor spaces, such as near windows [20]. However, since the SNR values calculated for each device model are different, determining whether a user is staying outdoor or indoor based only on these value is difficult. However, there is a clear trend that higher values indicate a higher probability of being outdoors, whereas lower values indicate a higher probability of being indoors or in the ETBS. Thus, one of the prominent inference methods used in dealing with ambiguous events for which it is difficult to set a uniform threshold is fuzzy inference [21,22]. In this study, we designed a decision flow to decide the stay in three spatial contexts, outdoor, ETBS, and indoor, using the SNR values obtained by the receiving device as input values employing fuzzy inference.
To successfully apply fuzzy inference, membership functions and fuzzy rules need to be established. A membership function is a function whose answer is a number between 0 and 1, which tells us how well the input values fit to a set. A fuzzy rule is a rule that describes what inference to extract from the output values obtained by the membership function, using the following equation:
If x is P then y is Q
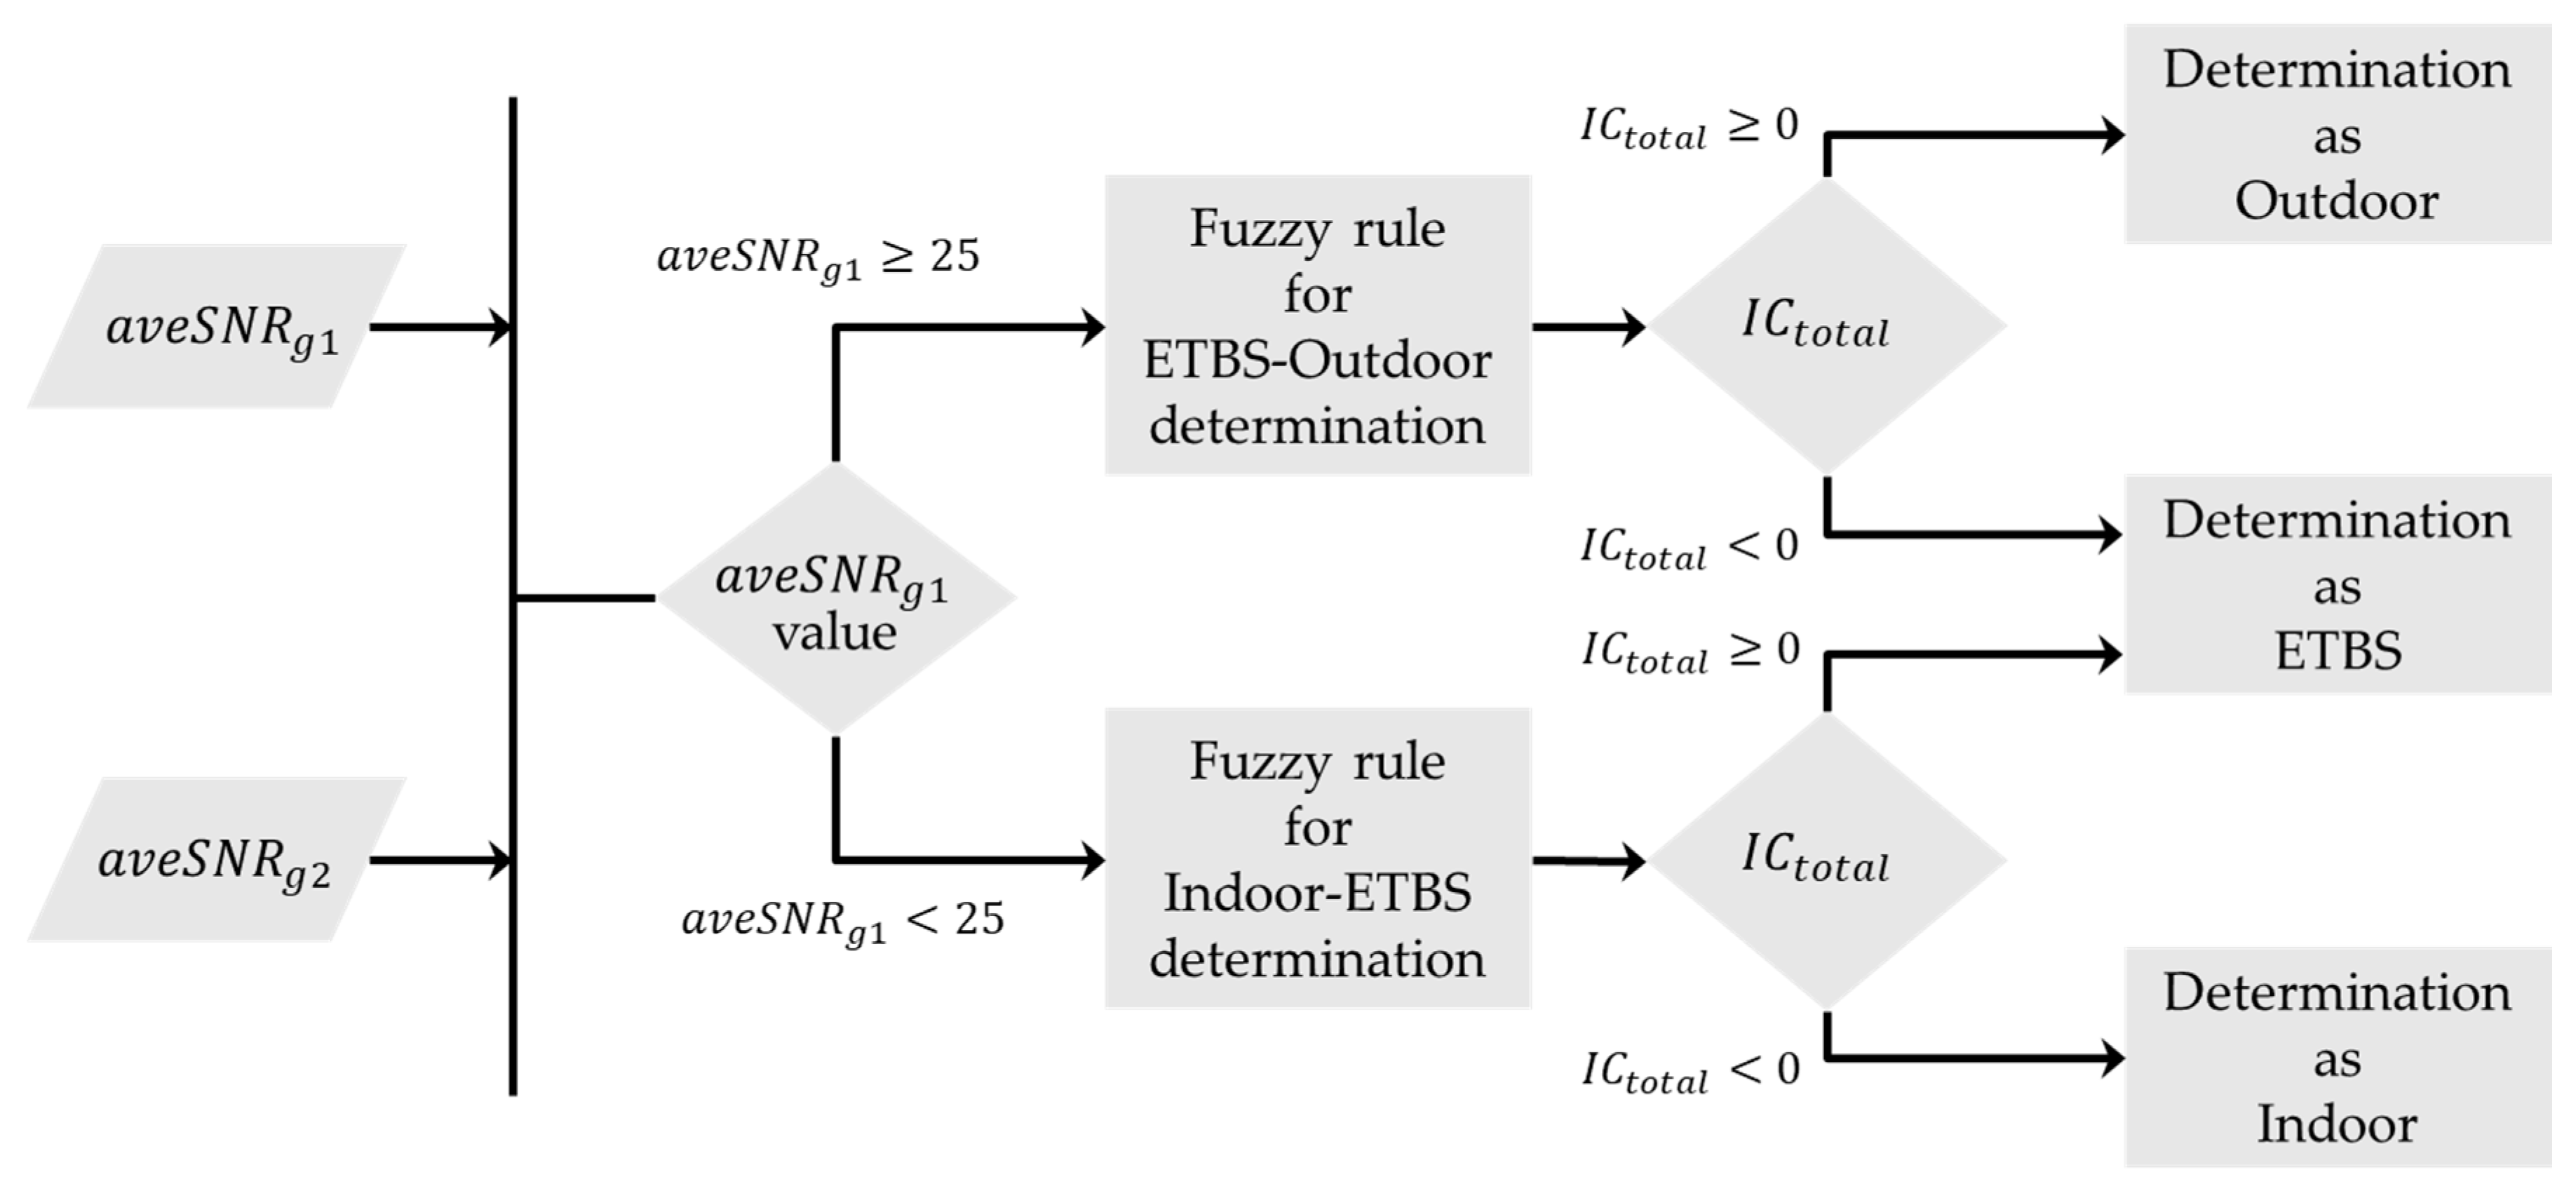
In this case, we call “x is P” the antecedent part and “y is Q” the consequent part. The decision flow designed in this study that enables us to determine where the receiving device is in the three spatial contexts is presented in Figure 10, where a v e S N R g 1 denotes the average of the SNR for 5 s at the measurement point of the satellite selected from Group 1, and a v e S N R g 2 denotes the average of the SNR for 5 s at the measurement point of the satellite selected from Group 2. Since it is difficult to assume the case in which the SNR of a Group 1 satellite is very low and the receiving device is outdoors, or, conversely, the case in which the SNR is very high and the receiving device is indoors, we designed two types of fuzzy rules in this study: One is to determine whether the receiving device is ETBS or outdoor, and the other is to determine whether it is indoor or ETBS. The value of a v e S N R g 1 determines which fuzzy rule is used.
The membership function for determining whether ETBS or outdoor is presented in Figure 11, and the fuzzy rules are presented in Table 1. Existing studies have reported that SNR values greater than 35 dB-Hz are almost always a LOS condition [20]. Conversely, for SNR values below 35 dB-Hz, LOS and NLOS signals are mixed, and the percentage of NLOS increases as the value decreases [12,16]. Figure 11a presents a function expressing such a characteristic. In this membership function, there are two states of SNR, “HIGH” and “MIDDLE,” that indicate the degrees of accordance with each. Figure 11b presents the value obtained by the inferred context in the consequent case from the results of the antecedent part. Since the spatial context we want to determine using this fuzzy rule is either ETBS or outdoor, we adopted singleton fuzzy inference and assigned a value of 1 or −1. Table 1 presents the fuzzy rules designed to determine whether the receiving device is in the ETBS or outdoor and consists of four rules, R1 to R4. The four rules indicate the status of the two selected satellites. For example, in the case of R1, the antecedent part demonstrates the estimation of the state when the values of both a v e S N R g 1 and a v e S N R g 2 are high. In this case, the value was set to 1 due to the assumed context of “outdoor.” In the case of R2 to R4, either one or both values of a v e S N R g 1 and a v e S N R g 2 were estimated to be low. Thus, we assigned the value of −1 as the value of I C i in the consequent part. From the four fuzzy rules, the value of I C t o t a l was calculated using Equation (4).
I C t o t a l   =   i μ i I C i i μ i
where I C t o t a l denotes the overall assumed context calculated from each of the rules constituting a fuzzy rule, and μ i denotes the degree of conformance in each rule. In this case, the value of I C t o t a l is
1 I C t o t a l 1
Therefore, the context I C f i n was determined using Equation (6).
  I C f i n     =     { E T B S     ( 1 I C t o t a l < 0 ) O u t d o o r   ( 0 I C t o t a l 1 )
As an example, the calculation of I C f i n when the two input values are a v e S N R g 1 = 28 and a v e S N R g 2 = 33 is presented in Figure 12. In this case, the value of I C t o t a l is −0.57. Thus, I C f i n was determined as ETBS.
Next, the membership function for determining whether ETBS or indoor is presented in Figure 13, whereas the fuzzy rules are presented in Table 2. SNR values lower than 15 dB-Hz are almost always considered to be NLOS conditions. For SNR values above 15 dB-Hz, Figure 13a demonstrates that the percentage of mixed NLOS and LOS increases as the value increases. There are two SNR states, “MIDDLE” and “LOW,” that indicate the degree of conformance with each other. Figure 13b presents the value obtained by the inferred context in the consequent case from the results of the antecedent part. Since the spatial context to be determined using this fuzzy rule is either ETBS or indoor, we assigned a value of 1 or −1, as we did for ETBS and outdoor. Table 2 presents the fuzzy rules designed to determine whether the receiving device is in ETBS or indoor.
As in the case of the ETBS and outdoor judgments, the I C t o t a l is as presented in Equation (5), and the final context I C f i n decision is determined using Equation (7).
I C f i n   =   { I n d o o r     ( 1 I C t o t a l < 0 ) E T B S   ( 0 I C t o t a l 1 )

4. Evaluation Experiments

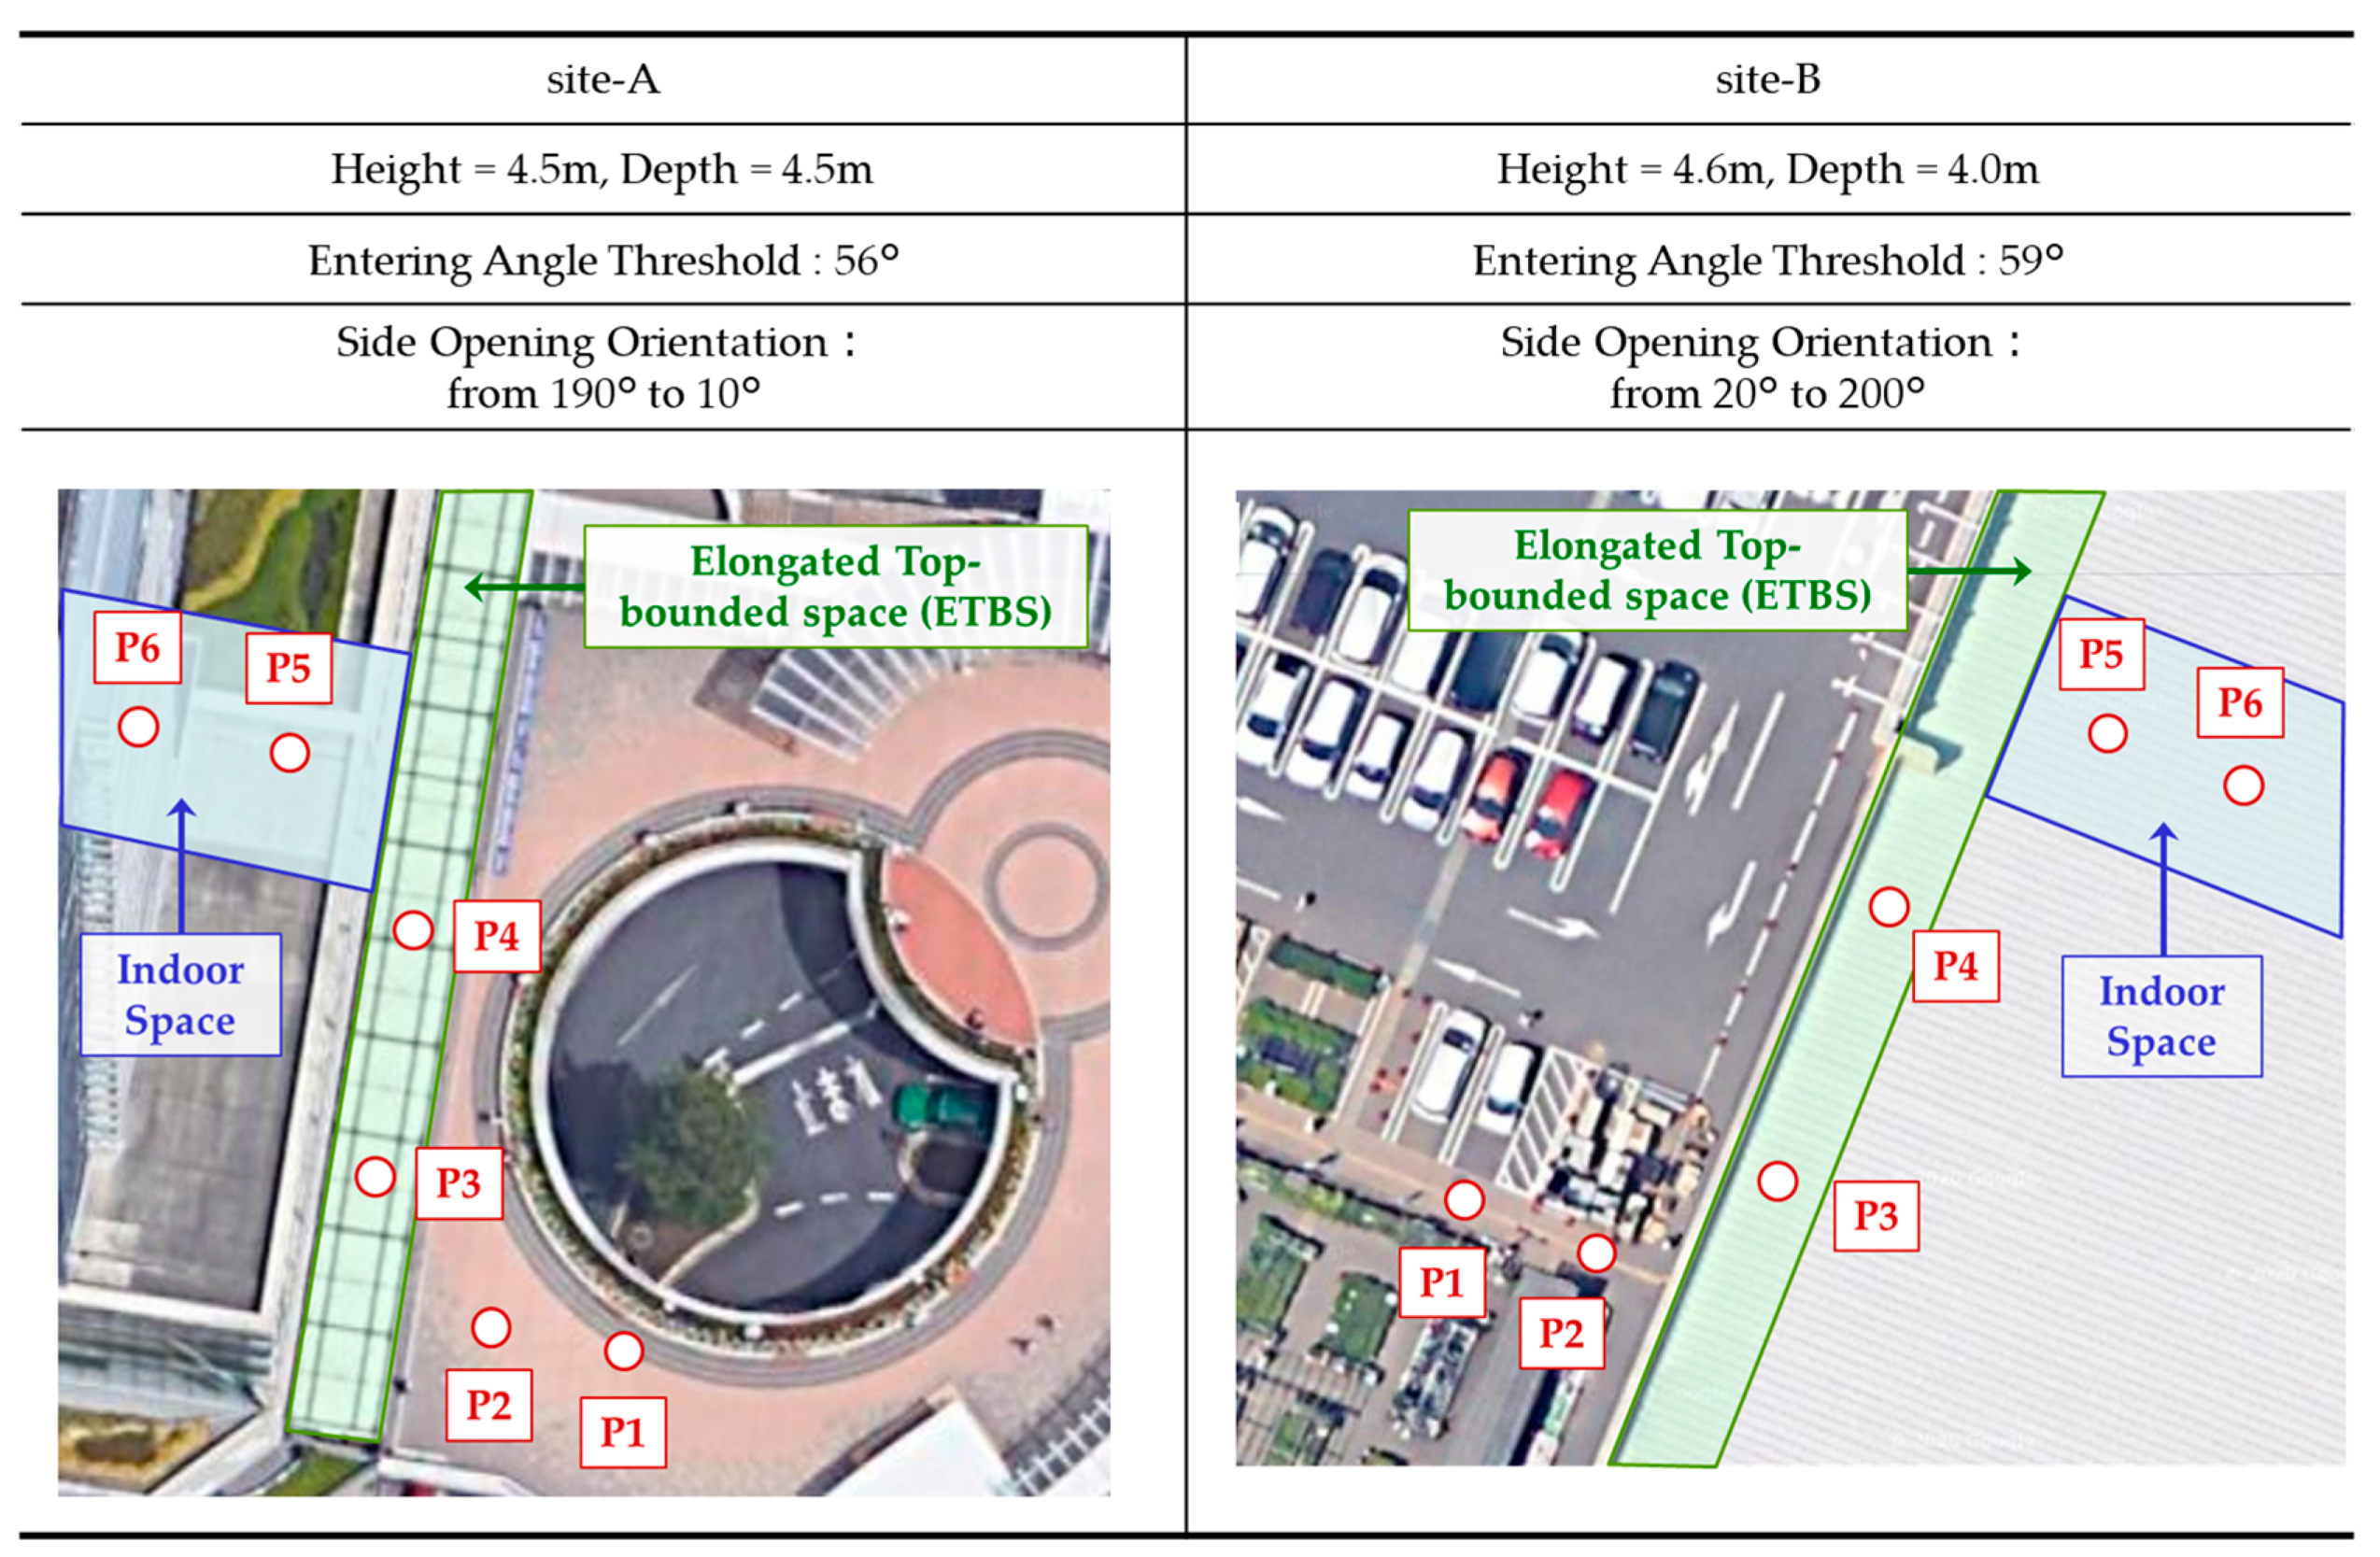
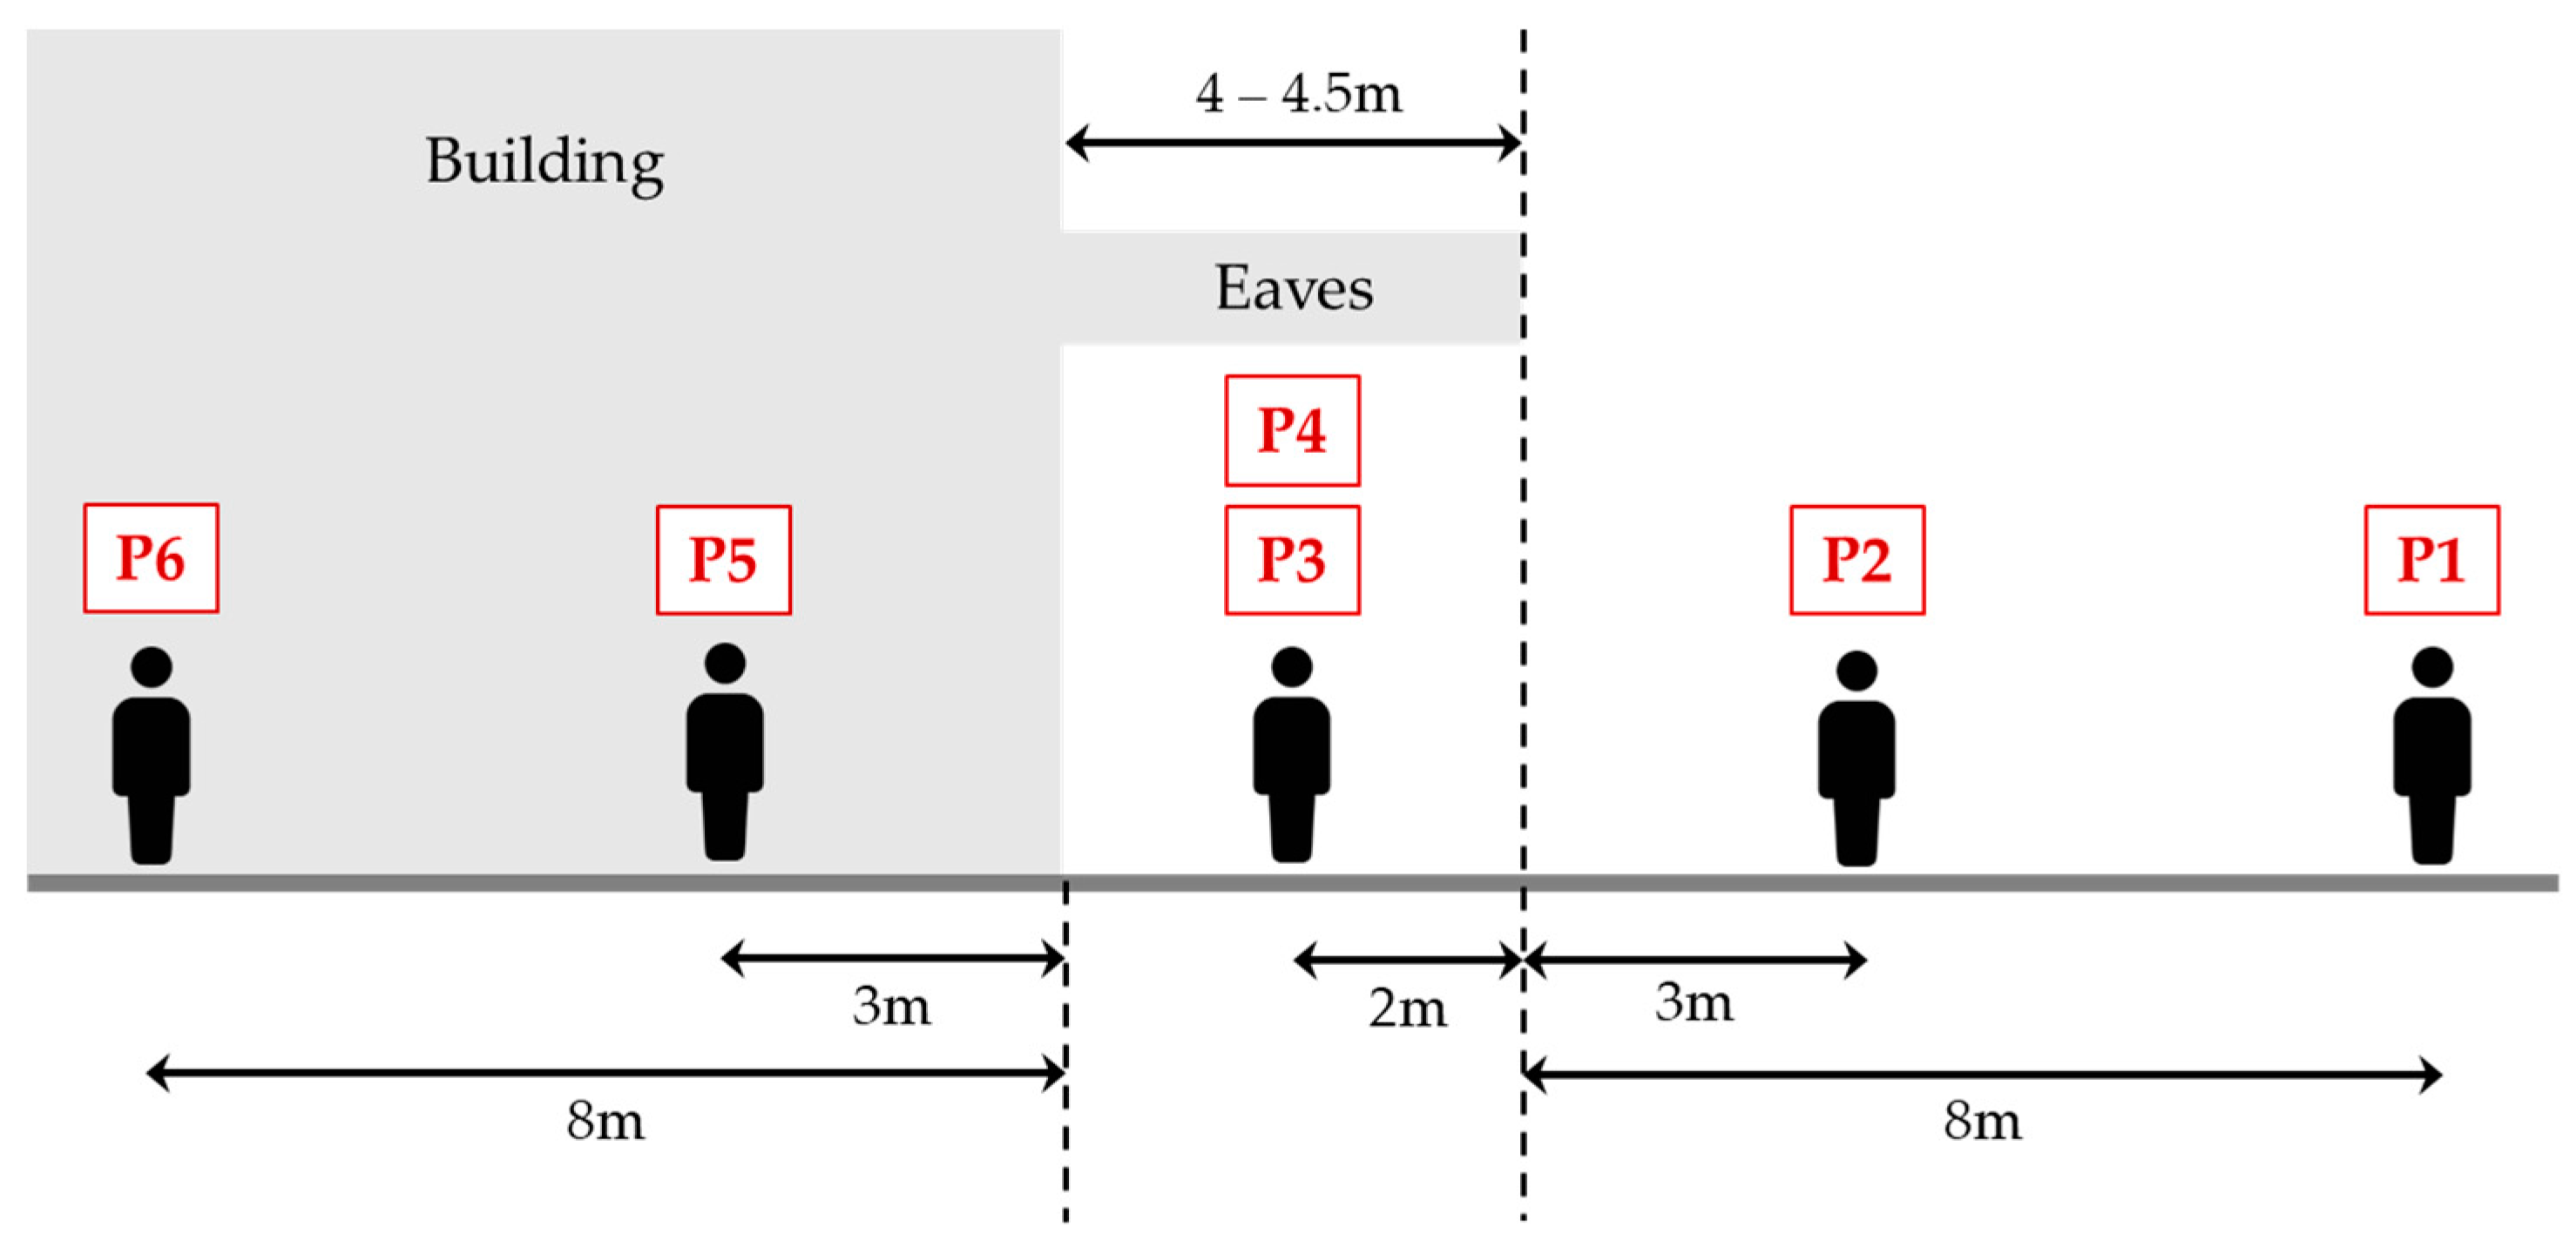
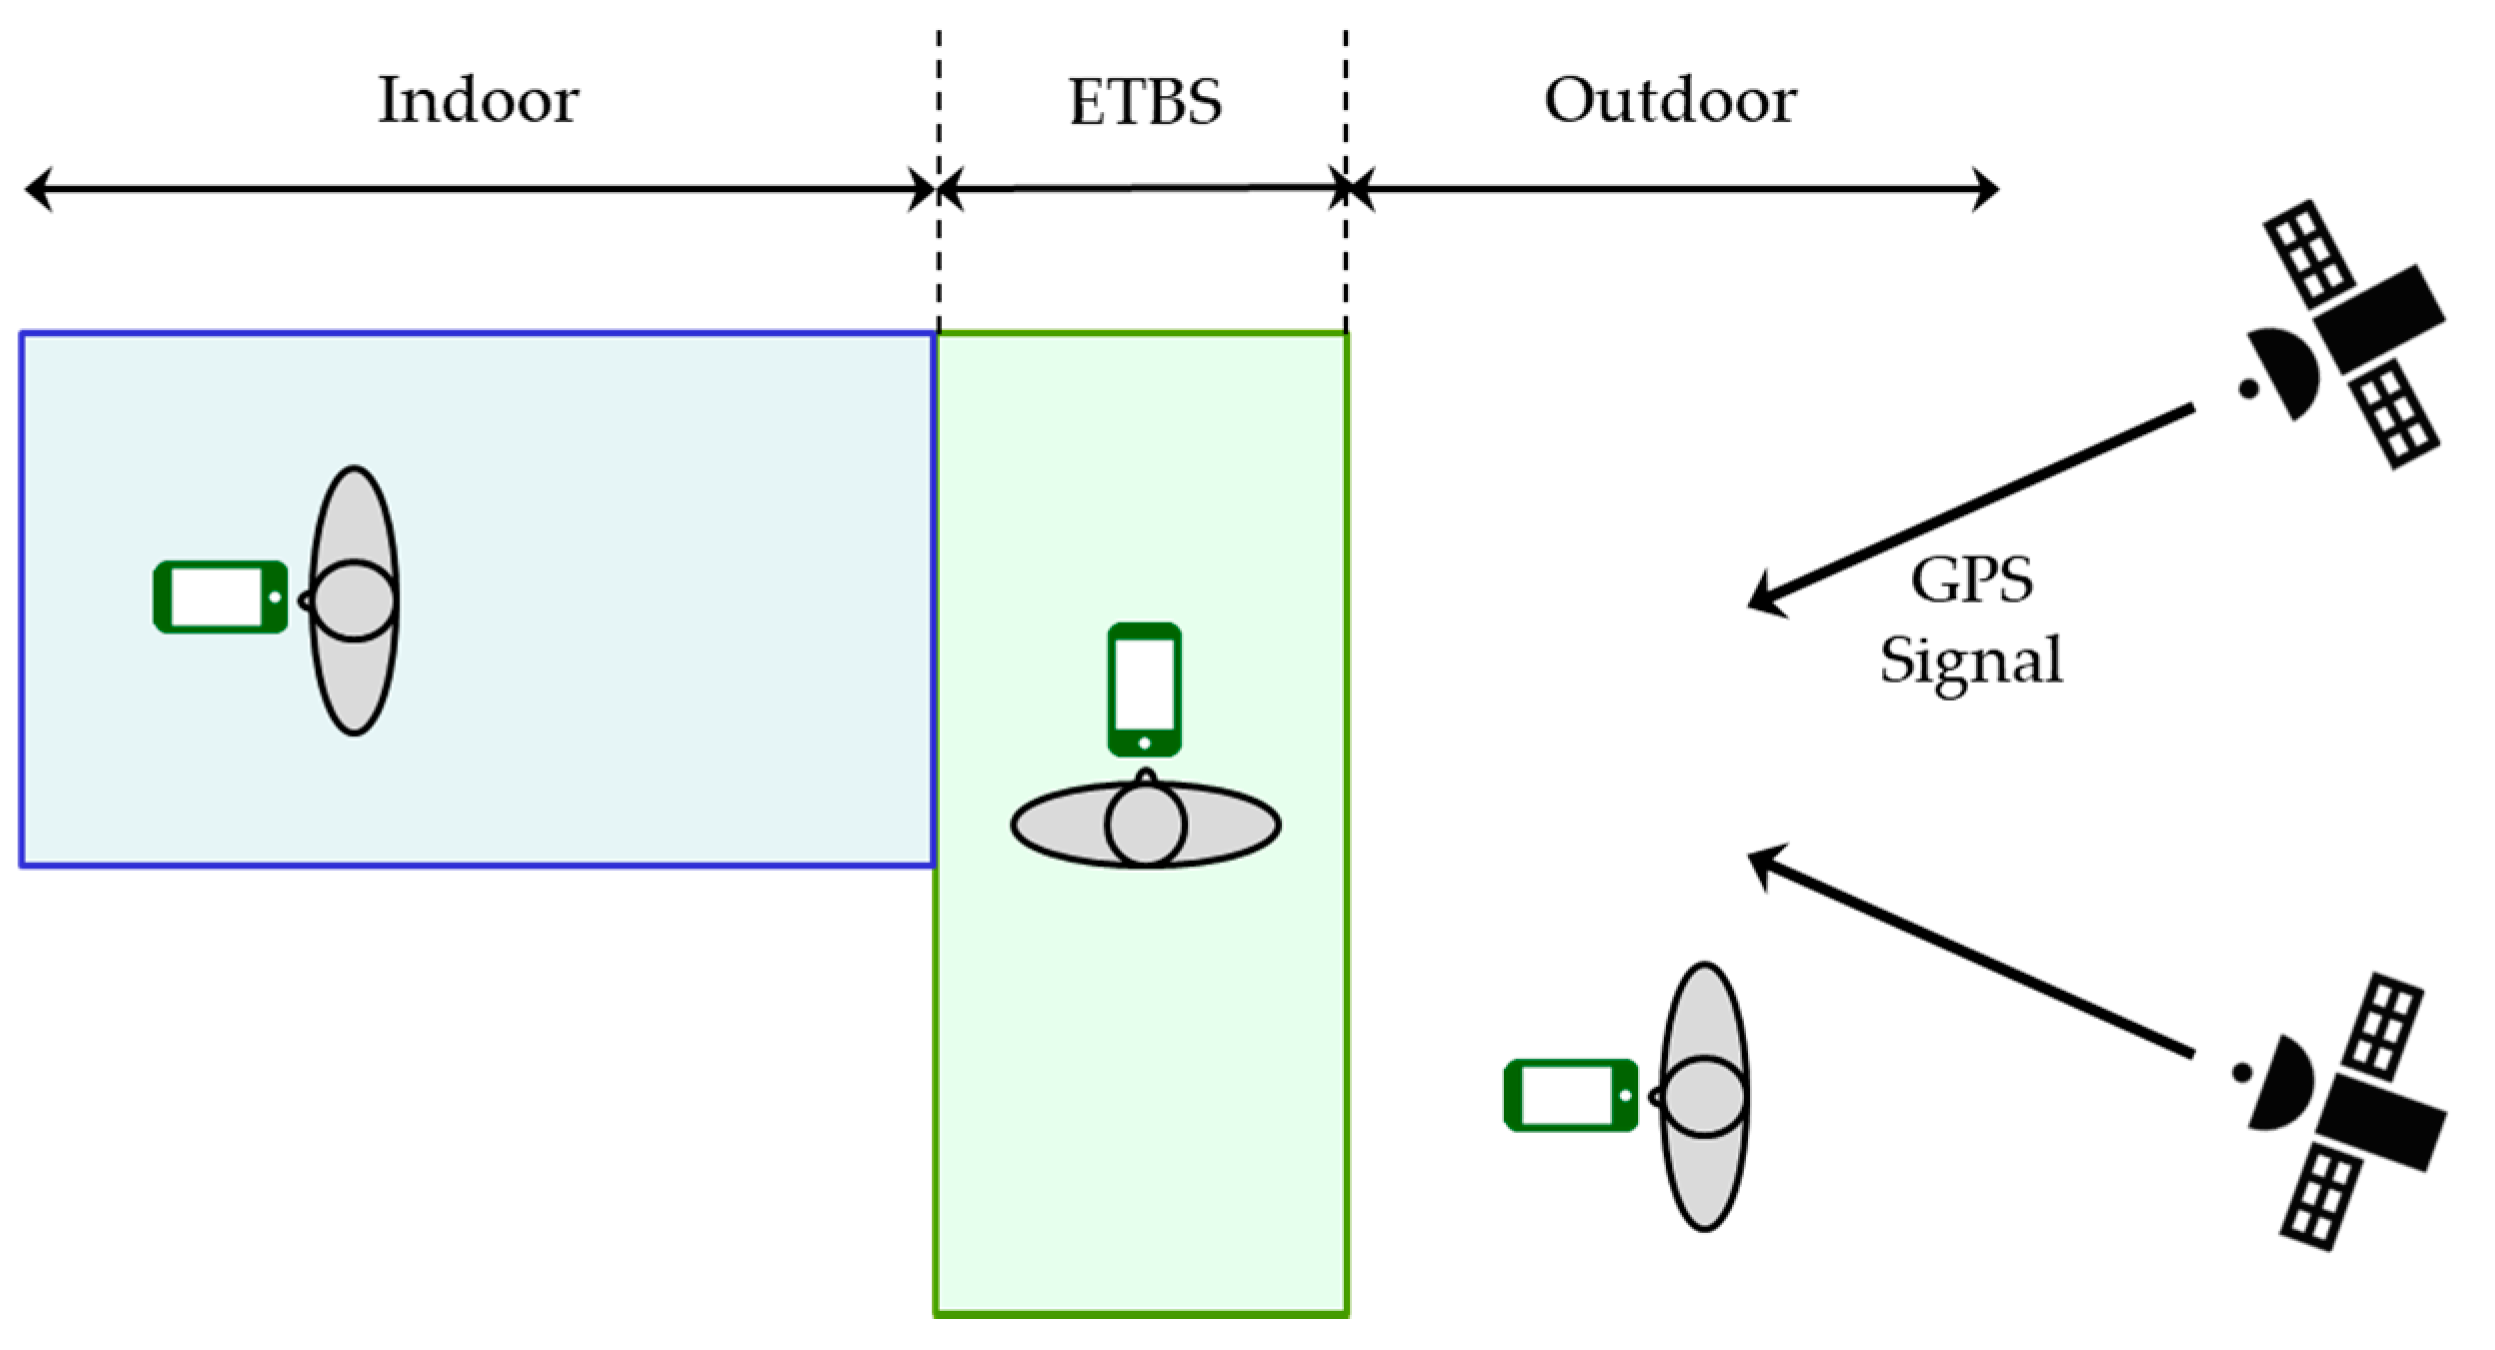
To confirm the effectiveness of the designed detection method, two locations with outdoor space, ETBS, and indoor space were selected for the evaluation experiments. Figure 14 presents an overview of the test sites of the evaluation experiment. Using a smartphone application, the SNR, elevation, and azimuth values of each satellite were recorded in the NMEA format with 5 s of static time at each measurement point. The position of each measurement point in the cross-sectional direction is presented in Figure 15. P1 and P2 are outdoor measurement points, with P2 being the closer measurement point to the building. P3 and P4 are the measurement points in the ETBS, and both have the same spatial features. P5 and P6 are indoor measurement points, with P5 being the closer measurement point to the entrance from the ETBS. The smartphone model A (Fujitsu Arrows m4, OS version: Android 7.1.1) was used as the measurement device, and the smartphone was held horizontally in front of the body at a height of 1.2 m from the ground. The positional relationship between the satellite, the person, and the smartphone that is the receiving device during the measurement is presented in Figure 16. In some experiments, the receiving device is set above the head because a person between the satellite and the receiving device would affect the reception situation. However, in this study, we chose to hold the receiving device in front of the body, considering that the measurement was close to the practical condition. On the other hand, in practice, the threshold used in the fuzzy rule designed in Section 3.2 may need to be changed depending on the actual holding condition of the receiving device. We performed three measurements at each measurement point. To consider the change in the configuration of the satellite with time, the measurements were performed in the morning and afternoon for each site, respectively. There was a total of 72 measurements.

4.1. Evaluation for Multiple Spatial Context Detection Using Our Proposed Method

First, we selected the satellites to be monitored according to the designed methodology. In Figure 17, the satellite configuration in the morning and afternoon of the experiment at site-A is presented as an example. The numbers in the dots indicate the pseudo-random noise (PRN) code of the satellite. Since the arrangement of satellites always changes with time, the selected satellites also change. However, at the time of Figure 17a, PRN = 2 of Group 1b was chosen as the satellite of Group 1, since there was no satellite of Group 1a. The satellite with the highest elevation angle in Group 2, PRN = 6, was selected as the Group 2 satellite. The average values of a v e S N R g 1 and a v e S N R g 2 were calculated from the SNR values of Group 1 and Group 2 satellites measured at each measurement point. Table 3 presents the results calculated separately for P1 to P6. Note that P3 and P4 are tabulated together due to their similar spatial characteristics. Both of the outdoor measurement points, P1 and P2, averaged over 35 dB-Hz, which was sufficiently large. At P3 and P4, the measurement points in the ETBS, the Group 1 satellite exhibited a significant decrease in the mean value, demonstrating the effect of signal attenuation due to the ETBS stay. However, there were some measurement times when the signal attenuation was not so noticeable, with a maximum value of 35.4 dB-Hz. In addition, the standard deviation is larger than that of the other measurement points, indicating that some variation existed between the measurement sessions. With respect to the Group 2 satellites, although the values are slightly lower than the outdoor measurement points, there is not much signal attenuation associated with the ETBS stay. At the indoor measurement points P5 and P6, the values of both Group 1 and Group 2 satellites exhibited a significant decrease. Conversely, for P5, the Group 2 satellites measured more than 25 dB-Hz on some sessions.
Next, based on the calculated values of a v e S N R g 1 and a v e S N R g 2 , we determined the spatial context according to the decision flow discussed in Section 3.2.3. The detection accuracy for each measurement point is presented in Table 4. As can be seen from the table, the overall detection accuracy reached 93.1%, and all the measurements were correct at the outdoor measurement points, P1 and P2, and at the inner measurement point, P6, which was located at the back of the indoor area. However, some measurement sessions were incorrectly determined at P3 and P4, the ETBS measurement points, and P5, which is the indoor entrance side measurement point.

4.2. Evaluation of Differences in the Detection Accuracy by the Receiving Devices

GPS receivers in smartphones differ from each other in terms of performance. The SNR values obtained from different models are expected to be different even in the same location. To confirm the effectiveness of the proposed method for different models, we conducted the same experiments using model B (Google Pixel 3a, OS version: Android 10) and evaluated the detection accuracy. The experiment was conducted at site-A, with two models A and B held in parallel and three measurements for 5 s at each measurement point as in Section 4.1. In addition, the measurements were performed in the morning and afternoon, respectively, to consider changes in satellite configuration. There was a total of 36 measurements. It is worth noting that, in analyzing the data obtained for the two models, we checked whether there was significant variation between the two data. We took measurements for 30 s with two models held outdoors in site-A and obtained SNR values for the same satellite at 1-s intervals. We conducted a Wilcoxon rank sum test using the obtained data (n = 30) and found a P-value of 0.36. Therefore, we did not identify a significant difference between the two data at the 5% significance level.
The measurements results for each model, calculated for each measurement point, are presented in Table 5. At the outdoor measurement points P1 and P2, model B received the Group 2 satellite signal more strongly than model A, with a difference of about 5 dB-Hz from that of model A. In addition, at P5, the indoor measurement point, model B was about 3 dB-Hz larger than model A. Otherwise, no significant difference in the SNR values obtained by the two models was observed.
In Table 6, the detection accuracy based on the proposed decision flow is presented. The results of the experiment are not significantly different from those of Section 4.1. Moreover, the results of the experiment for P1 and P2 outdoors and P6 indoors were correct for all measurements, even for the different models. However, the measurement points at P3 and P4 were sometimes not correctly determined, and the detection accuracy of Model B at P5, the indoor entrance side measurement point, was 50%.

5. Discussions

To stably detect outdoor, ETBS, and indoor stays in spaces containing ETBSs, to which the application of existing IO detection methods is difficult due to their covered top and open sides, we selected satellites for monitoring using the spatial characteristics of ETBSs and designed a decision flow using fuzzy inference. Moreover, we conducted evaluation experiments at two locations with outdoor space, ETBS, and indoor space and confirmed that the proposed method can be employed to achieve a correct detection, with an accuracy of 93.1%. The detection accuracy in other similar studies that have used fuzzy inference to detect the stay of more than three spaces was 88.2% [12]. Our proposed method achieved about 5% higher detection accuracy than their method. In particular, the detection accuracy of the ETBS stay was 87.5% in our proposed method compared to 71.4% in their method.
However, some challenges still remain in our proposed method. The first is that the detection accuracy of the ETBS stay was slightly lower, at 87.5%. The proposed method assumes that the SNR value attenuates during the ETBS stay and, as presented in Table 4, determining the ETBS stay in cases in which the SNR value does not attenuate at the P3 and P4 measurement points and obtains a high value of about 35 dB-Hz is difficult. To enable a more stable ETBS stay detection using the proposed method, satellites with higher elevation angles should be selected as Group 1 satellites. In this study, only the GPS was used in the evaluation experiments. However, other types of satellites can also be used, such as GLONASS, to make it easier to target satellites with high elevation angles. In particular, Japan has started operating a Quasi-Zenith Satellite System (QZSS) with one satellite near the zenith at all times. The use of QZSS is expected to improve the detection accuracy in some regions, such as East Asia, Southeast Asia, and Australia, where QZSS can be used due to its orbits [23].
Another challenge is that correct decision-making was sometimes not performed even at P5, which is the indoor entrance side measurement point. This may be due to the fact that although the SNRs of both Group 1 and Group 2 satellites are attenuated as they stay indoors, the Group 2 satellites do not have a high elevation angle. Thus, they are able to pass through the entrance opening and receive the GPS signal to some extent. If the SNR of the Group 2 satellite at the P5 measurement point is about 25 dB-Hz, it may be determined as ETBS by the proposed method. Indoor spaces that have windows or openings nearby and can receive GPS signals to some extent are also called “light indoor” or “shallow indoor.” Some studies have treated them as a different spatial context from indoor spaces that are not close to windows or openings [6,12,24]. We need to improve the proposed method to further classify the context of the indoor space in more detail, or the membership function designed in this study to ensure stable and correct detection even in light indoor spaces.

6. Conclusions

In this study, to enable the stable detection of outdoor, elongated top-bounded space (ETBS), and indoor stays in a space containing ETBS, to which the application of existing indoor–outdoor detection methods is difficult, we selected satellites for monitoring using the spatial characteristics of ETBS and also designed a multiple spatial context decision flow based on fuzzy inference using the signal-to-noise ratio (SNR) of the selected satellites. To confirm the effectiveness of the proposed method, we conducted evaluation experiments at two locations with outdoor space, ETBS, and indoor space and confirmed that the proposed method can successfully determine the stay of the three spatial contexts with high probability. Numerous researches on indoor and outdoor seamless positioning methods and indoor–outdoor (IO) detection methods have been conducted, but IO detection methods that consider TBS are still scarce. Our study is valuable in that we have demonstrated that the use of only Global Positioning System SNR as input data makes it possible to detect the stay in three spatial contexts, including ETBS, by employing a simple method without the use of 3D building models or other methods.

Author Contributions

Conceptualization, Kenichi Tabata; Methodology, Kenichi Tabata; Validation, Kenichi Tabata and Madoka Nakajima; Formal Analysis, Kenichi Tabata, Madoka Nakajima and Naohiko Kohtake; Investigation, Kenichi Tabata; Writing-Original Draft Preparation, Kenichi Tabata; Writing-Review & Editing, Madoka Nakajima and Naohiko Kohtake; Visualization, Kenichi Tabata; Supervision, Naohiko Kohtake; Project Administration, Kenichi Tabata. All authors have read and agreed to the published version of the manuscript.

Funding

Part of this study was carried out as part of the “Establishment of a Research and Education Center for Sustainable Space Utilization Cooperation Based on Social Service Design” funded by the Ministry of Education, Culture, Sports, Science and Technology of Japan.

Acknowledgments

We are thankful to the anonymous reviewers for their helpful comments.

Conflicts of Interest

The authors declare no conflict of interest.

References

  1. Maghdid, H.S.; Lami, I.A.; Ghafoor, K.Z.; Lloret, J. Seamless outdoors-indoors localization solutions on smartphones: Implementation and challenges. ACM Comput. Surv. (CSUR) 2016, 48, 1–34. [Google Scholar] [CrossRef]
  2. Gallagher, T.; Li, B.; Dempster, A.G.; Rizos, C. Power efficient indoor/outdoor positioning handover. In Proceedings of the 2nd International Conference on Indoor Positioning and Indoor Navigation (IPIN11), Guimarães, Portugal, 21–23 September 2011. [Google Scholar]
  3. Kohtake, N.; Morimoto, S.; Kogure, S.; Manandhar, D. Indoor and outdoor seamless positioning using indoor messaging system and GPS. In Proceedings of the International Conference on Indoor Positioning and Indoor Navigation (IPIN2011), Guimarães, Portugal, 21–23 September 2011; pp. 21–23. [Google Scholar]
  4. Cheng, R.S.; Hong, W.J.; Wang, J.S.; Lin, K.W. Seamless guidance system combining GPS, BLE beacon, and NFC technologies. Mob. Inf. Syst. 2016, 2016, 1–12. [Google Scholar] [CrossRef] [Green Version]
  5. Zeng, Q.; Wang, J.; Meng, Q.; Zhang, X.; Zeng, S. Seamless pedestrian navigation methodology optimized for indoor/outdoor detection. IEEE Sens. J. 2017, 18, 363–374. [Google Scholar] [CrossRef]
  6. Zhu, Y.; Luo, H.; Wang, Q.; Zhao, F.; Ning, B.; Ke, Q.; Zhang, C. A fast indoor/outdoor transition detection algorithm based on machine learning. Sensors 2019, 19, 786. [Google Scholar] [CrossRef] [Green Version]
  7. Zlatanova, S.; Yan, J.; Wang, Y.; Diakité, A.; Isikdag, U.; Sithole, G.; Barton, J. Spaces in spatial science and urban applications—State of the art review. ISPRS Int. J. Geo-Inf. 2020, 9, 58. [Google Scholar] [CrossRef] [Green Version]
  8. Yan, J.; Diakité, A.A.; Zlatanova, S.; Aleksandrov, M. Finding outdoor boundaries for 3D space-based navigation. Trans. GIS 2020, 24, 371–389. [Google Scholar] [CrossRef]
  9. Yan, J.; Diakité, A.A.; Zlatanova, S. An extraction approach of the top-bounded space formed by buildings for pedestrian navigation. ISPRS Ann. Photogramm. Remote. Sens. Spat. Inf. Sci. 2018, 4, 247–254. [Google Scholar] [CrossRef] [Green Version]
  10. Feriol, F.; Vivet, D.; Watanabe, Y. A Review of Environmental Context Detection for Navigation Based on Multiple Sensors. Sensors 2020, 20, 4532. [Google Scholar] [CrossRef]
  11. Zou, H.; Jiang, H.; Luo, Y.; Zhu, J.; Lu, X.; Xie, L. Bluedetect: An ibeacon-enabled scheme for accurate and energy-efficient indoor-outdoor detection and seamless location-based service. Sensors 2016, 16, 268. [Google Scholar] [CrossRef] [Green Version]
  12. Gao, H.; Groves, P.D. Environmental context detection for adaptive navigation using GNSS measurements from a smartphone. Navig. J. Inst. Navig. 2018, 65, 99–116. [Google Scholar] [CrossRef]
  13. Zhou, P.; Zheng, Y.; Li, Z.; Li, M.; Shen, G. Iodetector: A generic service for indoor outdoor detection. In Proceedings of the 10th Acm Conference on Embedded Network Sensor Systems, Toronto, ON, Canada, 6–9 November 2012; pp. 113–126. [Google Scholar]
  14. Yan, J.; Diakité, A.A.; Zlatanova, S. A generic space definition framework to support seamless indoor/outdoor navigation systems. Trans. GIS 2019, 23, 1273–1295. [Google Scholar] [CrossRef]
  15. Hsu, L.T. Analysis and modeling GPS NLOS effect in highly urbanized area. GPS Solut. 2018, 22, 7. [Google Scholar] [CrossRef] [Green Version]
  16. Wang, L.; Groves, P.D.; Ziebart, M.K. Smartphone shadow matching for better cross-street GNSS positioning in urban environments. J. Navig. 2015, 68, 411–433. [Google Scholar] [CrossRef] [Green Version]
  17. Adjrad, M.; Groves, P.D. Enhancing least squares GNSS positioning with 3D mapping without accurate prior knowledge. Navig. J. Inst. Navig. 2017, 64, 75–91. [Google Scholar] [CrossRef]
  18. Wen, W.; Bai, X.; Kan, Y.C.; Hsu, L.T. Tightly coupled GNSS/INS integration via factor graph and aided by fish-eye camera. IEEE Trans. Veh. Technol. 2019, 68, 10651–10662. [Google Scholar] [CrossRef] [Green Version]
  19. Peyraud, S.; Bétaille, D.; Renault, S.; Ortiz, M.; Mougel, F.; Meizel, D.; Peyret, F. About non-line-of-sight satellite detection and exclusion in a 3D map-aided localization algorithm. Sensors 2013, 13, 829–847. [Google Scholar] [CrossRef] [Green Version]
  20. Seco-Granados, G.; Lopez-Salcedo, J.; Jimenez-Banos, D.; Lopez-Risueno, G. Challenges in indoor global navigation satellite systems: Unveiling its core features in signal processing. IEEE Signal Process. Mag. 2012, 29, 108–131. [Google Scholar] [CrossRef]
  21. Zimmermann, H.-J. Fuzzy set theory. Wiley Interdiscip. Rev. Comput. Stat. 2010, 2, 317–332. [Google Scholar] [CrossRef]
  22. Takagi, T.; Sugeno, M. Fuzzy identification of systems and its applications to modeling and control. IEEE Trans. Syst. Man Cybern. 1985, 1, 116–132. [Google Scholar] [CrossRef]
  23. Zaminpardaz, S.; Wang, K.; Teunissen, P.J.G. Australia-first high-precision positioning results with new Japanese QZSS regional satellite system. GPS Solut. 2018, 22, 101. [Google Scholar] [CrossRef] [Green Version]
  24. Wang, W.; Chang, Q.; Li, Q.; Shi, Z.; Chen, W. Indoor-Outdoor Detection Using a Smart Phone Sensor. Sensors 2016, 16, 1563. [Google Scholar] [CrossRef] [Green Version]
Figure 1. Research flow of this study.
Ijgi 09 00717 g001
Figure 2. Typical examples of elongated top-bounded space (ETBS).
Ijgi 09 00717 g002
Figure 3. Effect of height difference on GPS signal reception: (a) the case affected by the eaves; (b) the case not affected by the eaves.
Ijgi 09 00717 g003
Figure 4. Example of a satellite configuration that changes with time: (a) morning; (b) afternoon.
Ijgi 09 00717 g004
Figure 5. Classification of satellites in the orbit considering elongated top-bounded spaces (ETBS).
Ijgi 09 00717 g005
Figure 6. Overall structure of our proposed method.
Ijgi 09 00717 g006
Figure 7. Calculation of the angle of entry using elongated top-bounded spaces (ETBS).
Ijgi 09 00717 g007
Figure 8. Example of open side orientation calculation.
Ijgi 09 00717 g008
Figure 9. Classification flow of satellites in the orbit.
Ijgi 09 00717 g009
Figure 10. Decision flow for multiple spatial context determination.
Ijgi 09 00717 g010
Figure 11. Membership functions for determining elongated top-bounded space (ETBS) and outdoor: (a) membership function for antecedent part; (b) membership function for consequent part.
Ijgi 09 00717 g011
Figure 12. Example of context determination based on the proposed method.
Ijgi 09 00717 g012
Figure 13. Membership functions for determining elongated top-bounded space (ETBS) and indoor: (a) membership function for antecedent part; (b) membership function for consequent part.
Ijgi 09 00717 g013
Figure 14. Overview of the test site-A and site-B for the evaluation experiment.
Ijgi 09 00717 g014
Figure 15. Cross-sectional position of the measurement points.
Ijgi 09 00717 g015
Figure 16. Position relationship of satellites, people, and smartphones during measurement.
Ijgi 09 00717 g016
Figure 17. Example of satellite configuration in the evaluation experiment at site-A: (a) morning; (b) afternoon.
Ijgi 09 00717 g017
Table 1. Fuzzy rules for elongated top-bounded space (ETBS)–outdoor determination.
IDContents
R1If a v e S N R g 1 is HIGH, and a v e S N R g 2 is HIGH, then I C i = 1
R2If a v e S N R g 1 is HIGH, and a v e S N R g 2 is MIDDLE, then I C i =−1
R3If a v e S N R g 1 is MIDDLE, and a v e S N R g 2 is HIGH, then I C i =−1
R4If a v e S N R g 1 is MIDDLE, and a v e S N R g 2 is MIDDLE, then I C i =−1
Table 2. Fuzzy rules for elongated top-bounded space (ETBS)–indoor determination.
IDContents
R1If a v e S N R g 1 is MIDDLE, and a v e S N R g 2 is MIDDLE, then I C i = 1
R2If a v e S N R g 1 is MIDDLE, and a v e S N R g 2 is LOW, then I C i = −1
R3If a v e S N R g 1 is LOW, and a v e S N R g 2 is MIDDLE, then I C i = −1
R4If a v e S N R g 1 is LOW, and a v e S N R g 2 is LOW, then I C i = −1
Table 3. SNR average at each measurement point.
aveSNR
Value
(dB-Hz)
P1P2P3 and P4P5P6
Group
1
Group
2
Group
1
Group
2
Group
1
Group
2
Group
1
Group
2
Group
1
Group
2
Average36.535.136.936.227.634.921.223.219.919.7
Max40.64038.439.635.440.624.226.62421.2
Min33.43335.433.820.828.81920.21618.2
Standard
Deviation
2.021.951.111.553.922.921.571.862.450.92
Table 4. Detection accuracy result.
Number of MeasurementNumber of Correct DetectionsDetection Accuracy
OutdoorP11212100.0%
P21212100.0%
Elongated top-bounded space (ETBS)P3 and P4242187.5%
IndoorP5121083.3%
P61212100.0%
Total726793.1%
Table 5. Comparison of the obtained SNR for different models.
Model AModel B
Model NameFujitsu Arrows m4Google Pixel3a
OS versionAndroid 7.1.1Android 10
Group 1Group 2Group 1Group 2
Average
of
aveSNR
(dB-Hz)
P137.235.936.940.6
P236.836.535.741.5
P3 and P427.73327.734.8
P521.4222225.2
P620.718.919.721.4
Table 6. Detection accuracy at each measurement point in each model.
Model AModel B
Number of MeasurementNumber of Correct DetectionsNumber of Correct Detections
OutdoorP1666
P2666
Elongated top-bounded space (ETBS)P3 and P412109
IndoorP4653
P5666
Total363330
Publisher’s Note: MDPI stays neutral with regard to jurisdictional claims in published maps and institutional affiliations.