Evaluating a Workflow Tool for Simplifying Scenario Planning with the Online WhatIf? Planning Support System

 , and
, and
Abstract
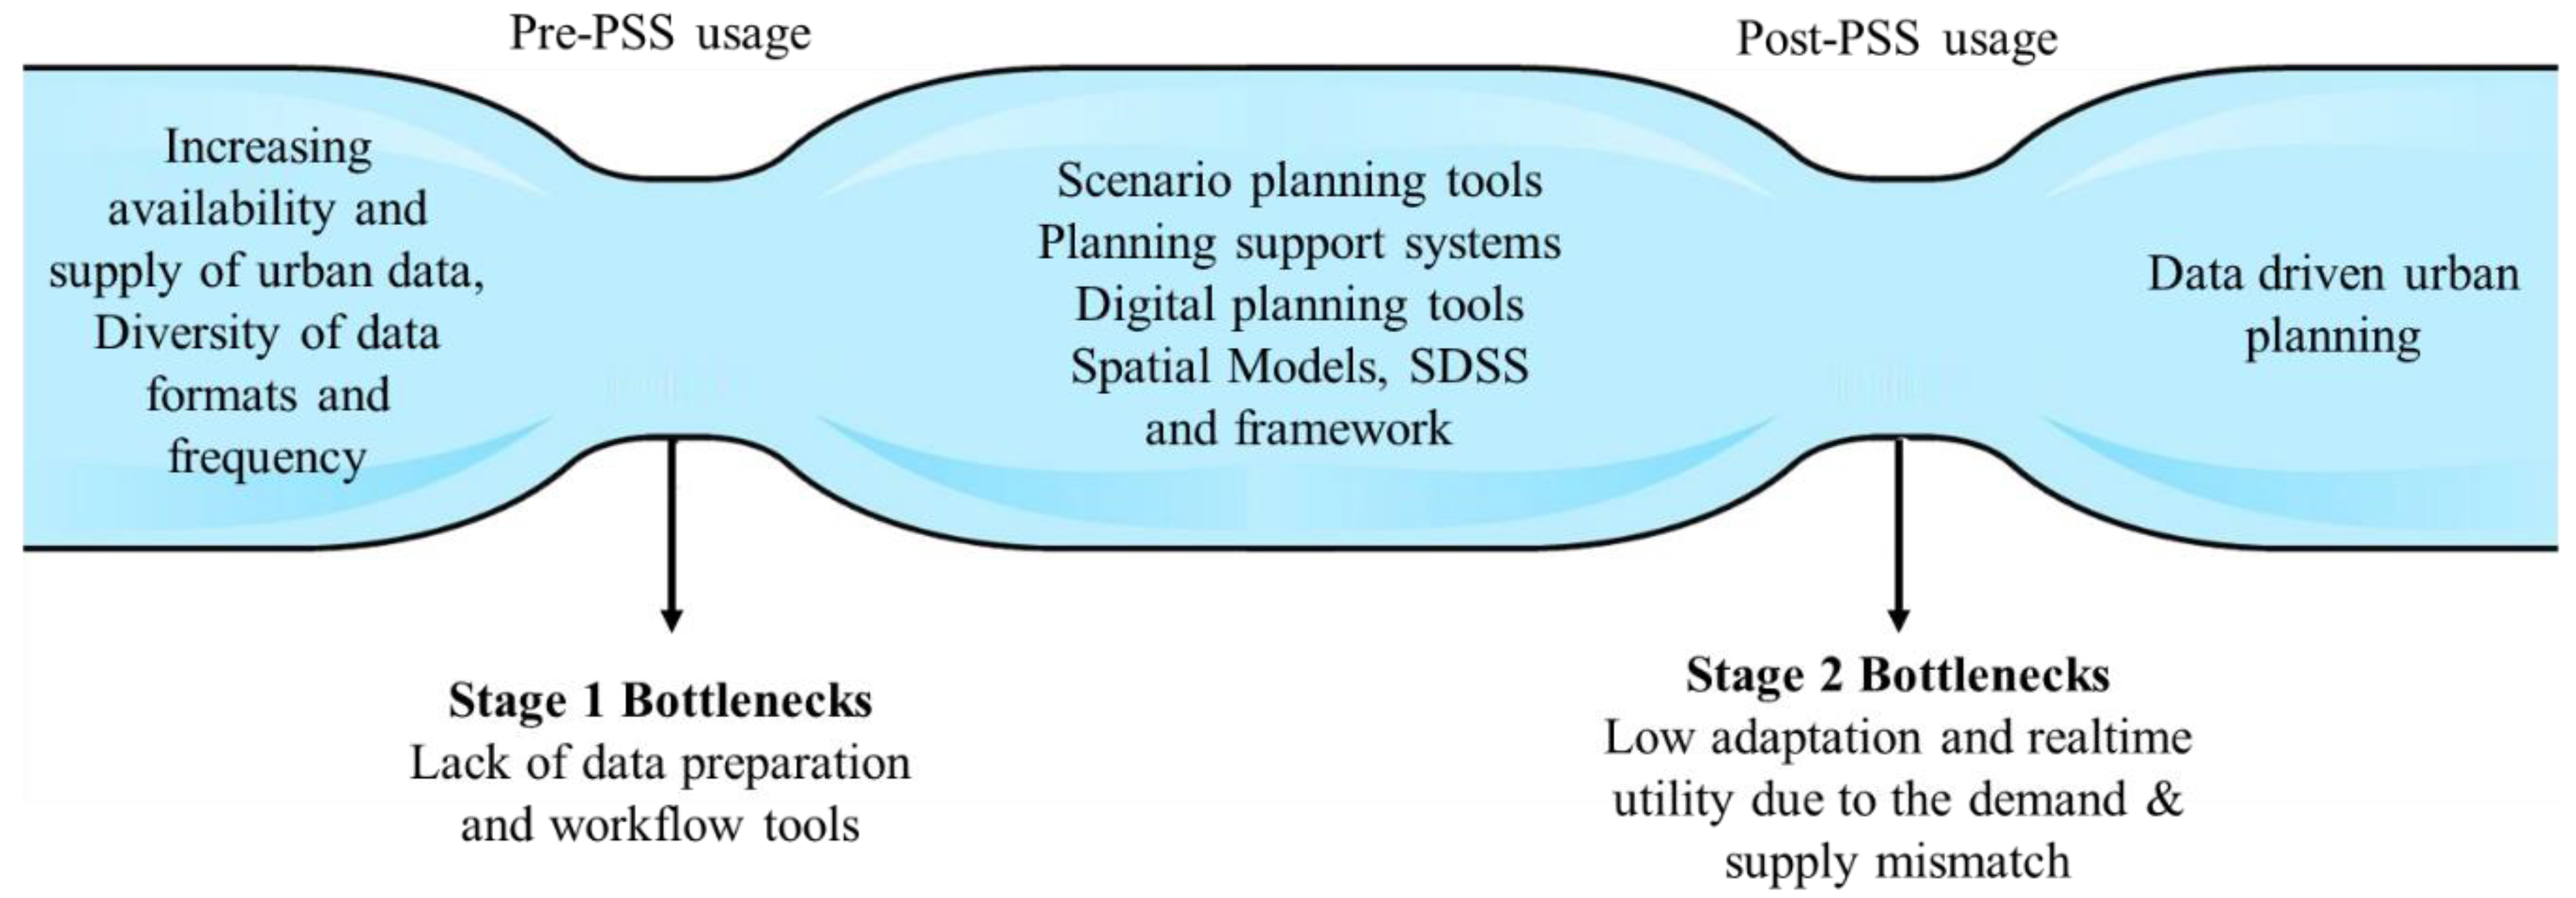
:1. Introduction
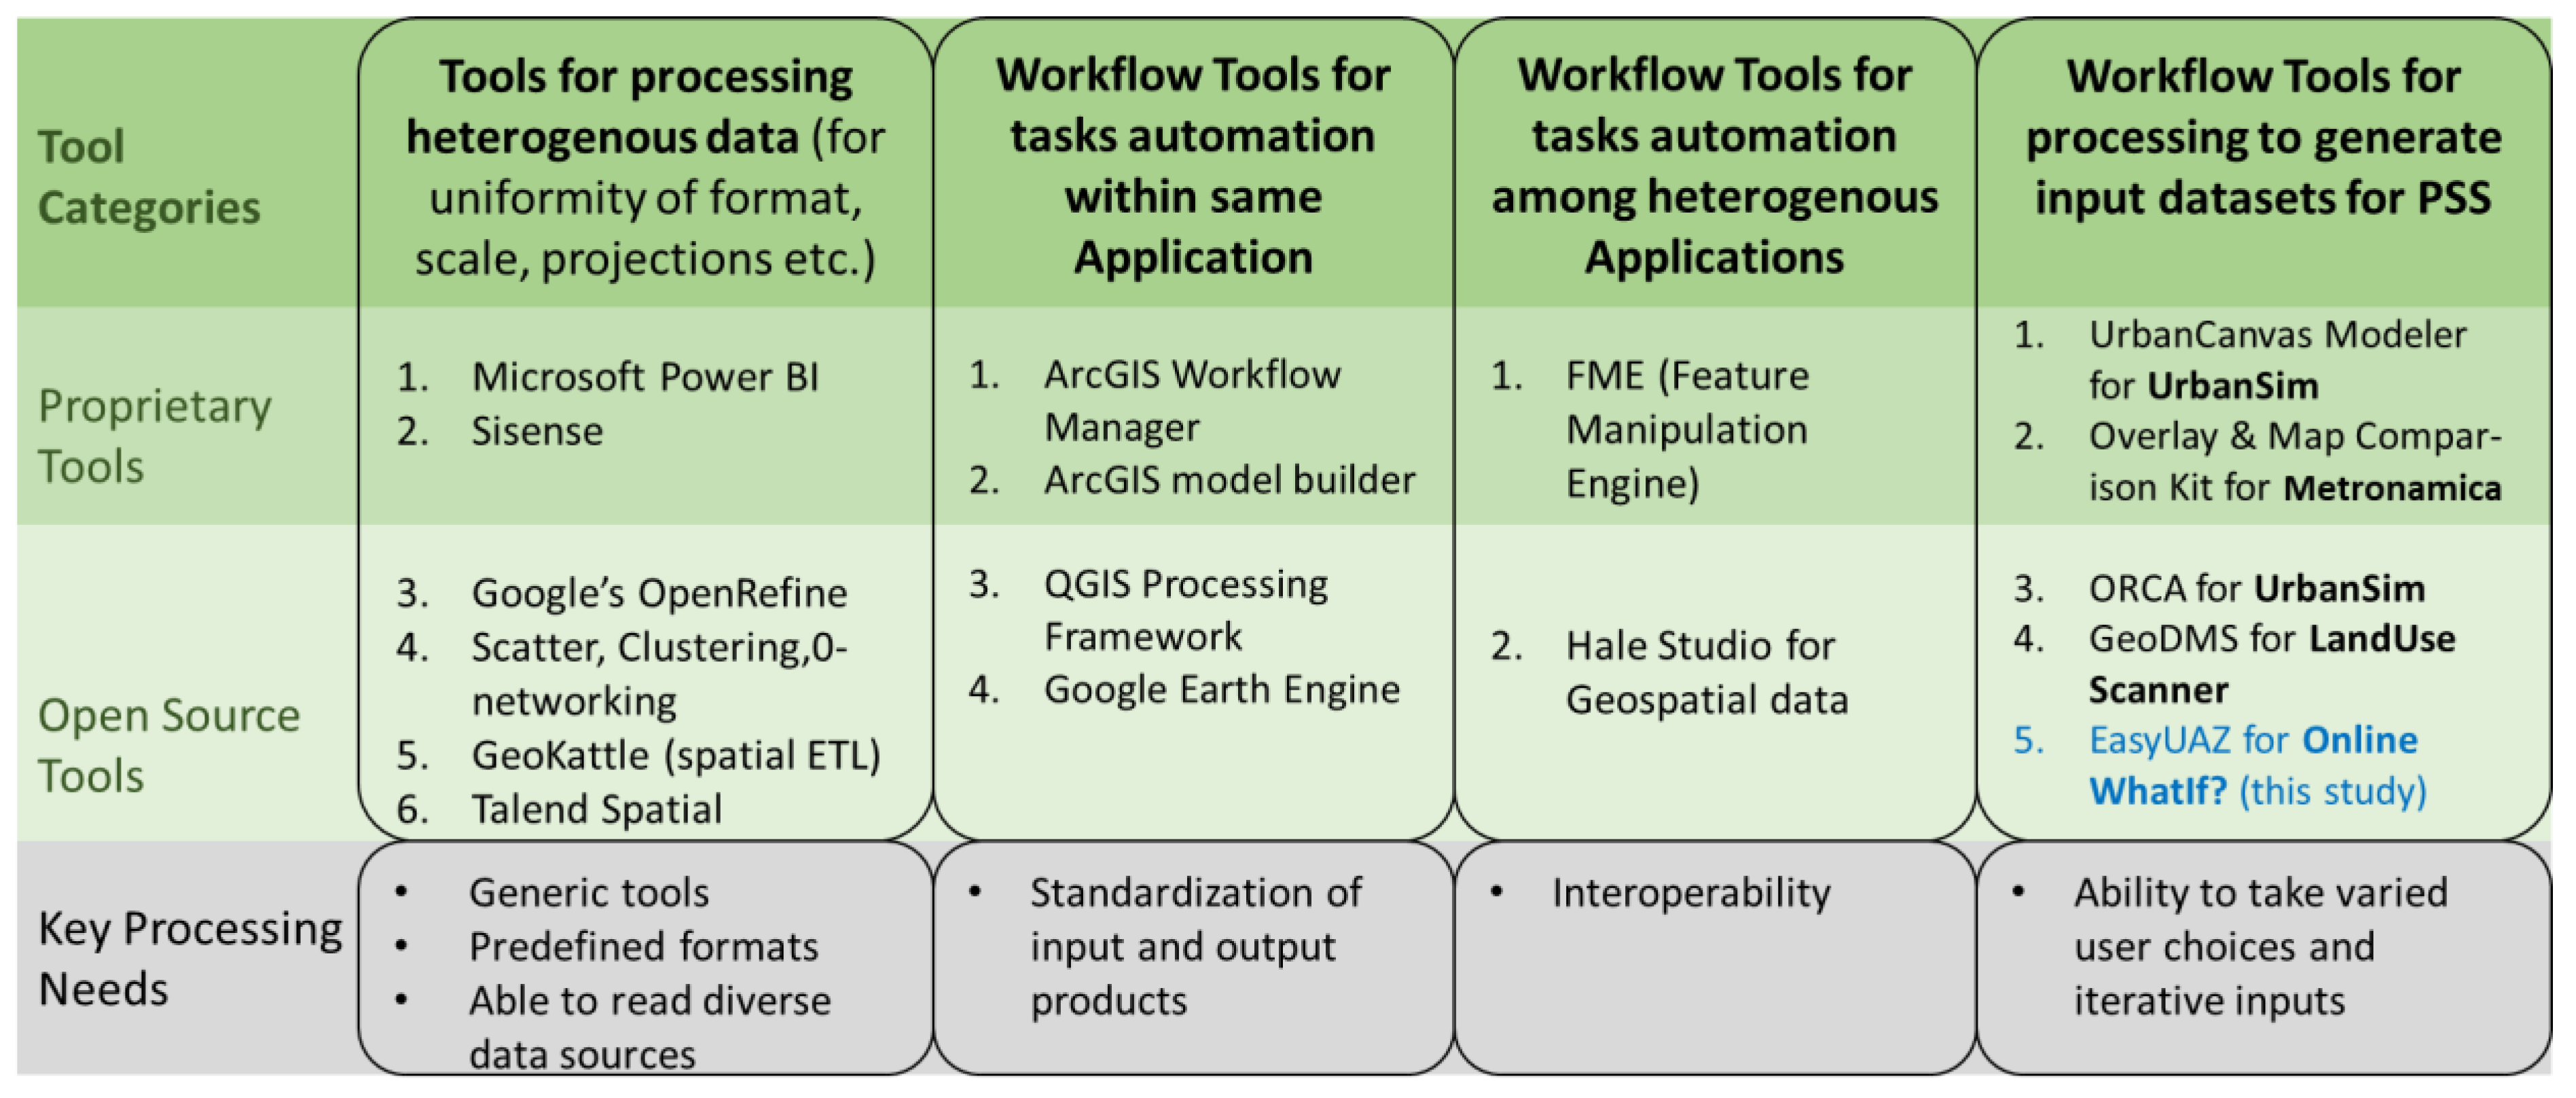
2. State of the Data Pre-Processing and Workflow Tools
2.1. Tools for Pre-Processing Heterogeneous Data
2.2. Tools for Task Automation within the Same Application
2.3. Tools for Task Automation among Heterogeneous Applications
2.4. Pre-Processing Workflow Tools to Generate Input Datasets for PSS
3. Materials and Methods
3.1. Data and Preparation Requirements for the Online Whatif? PSS
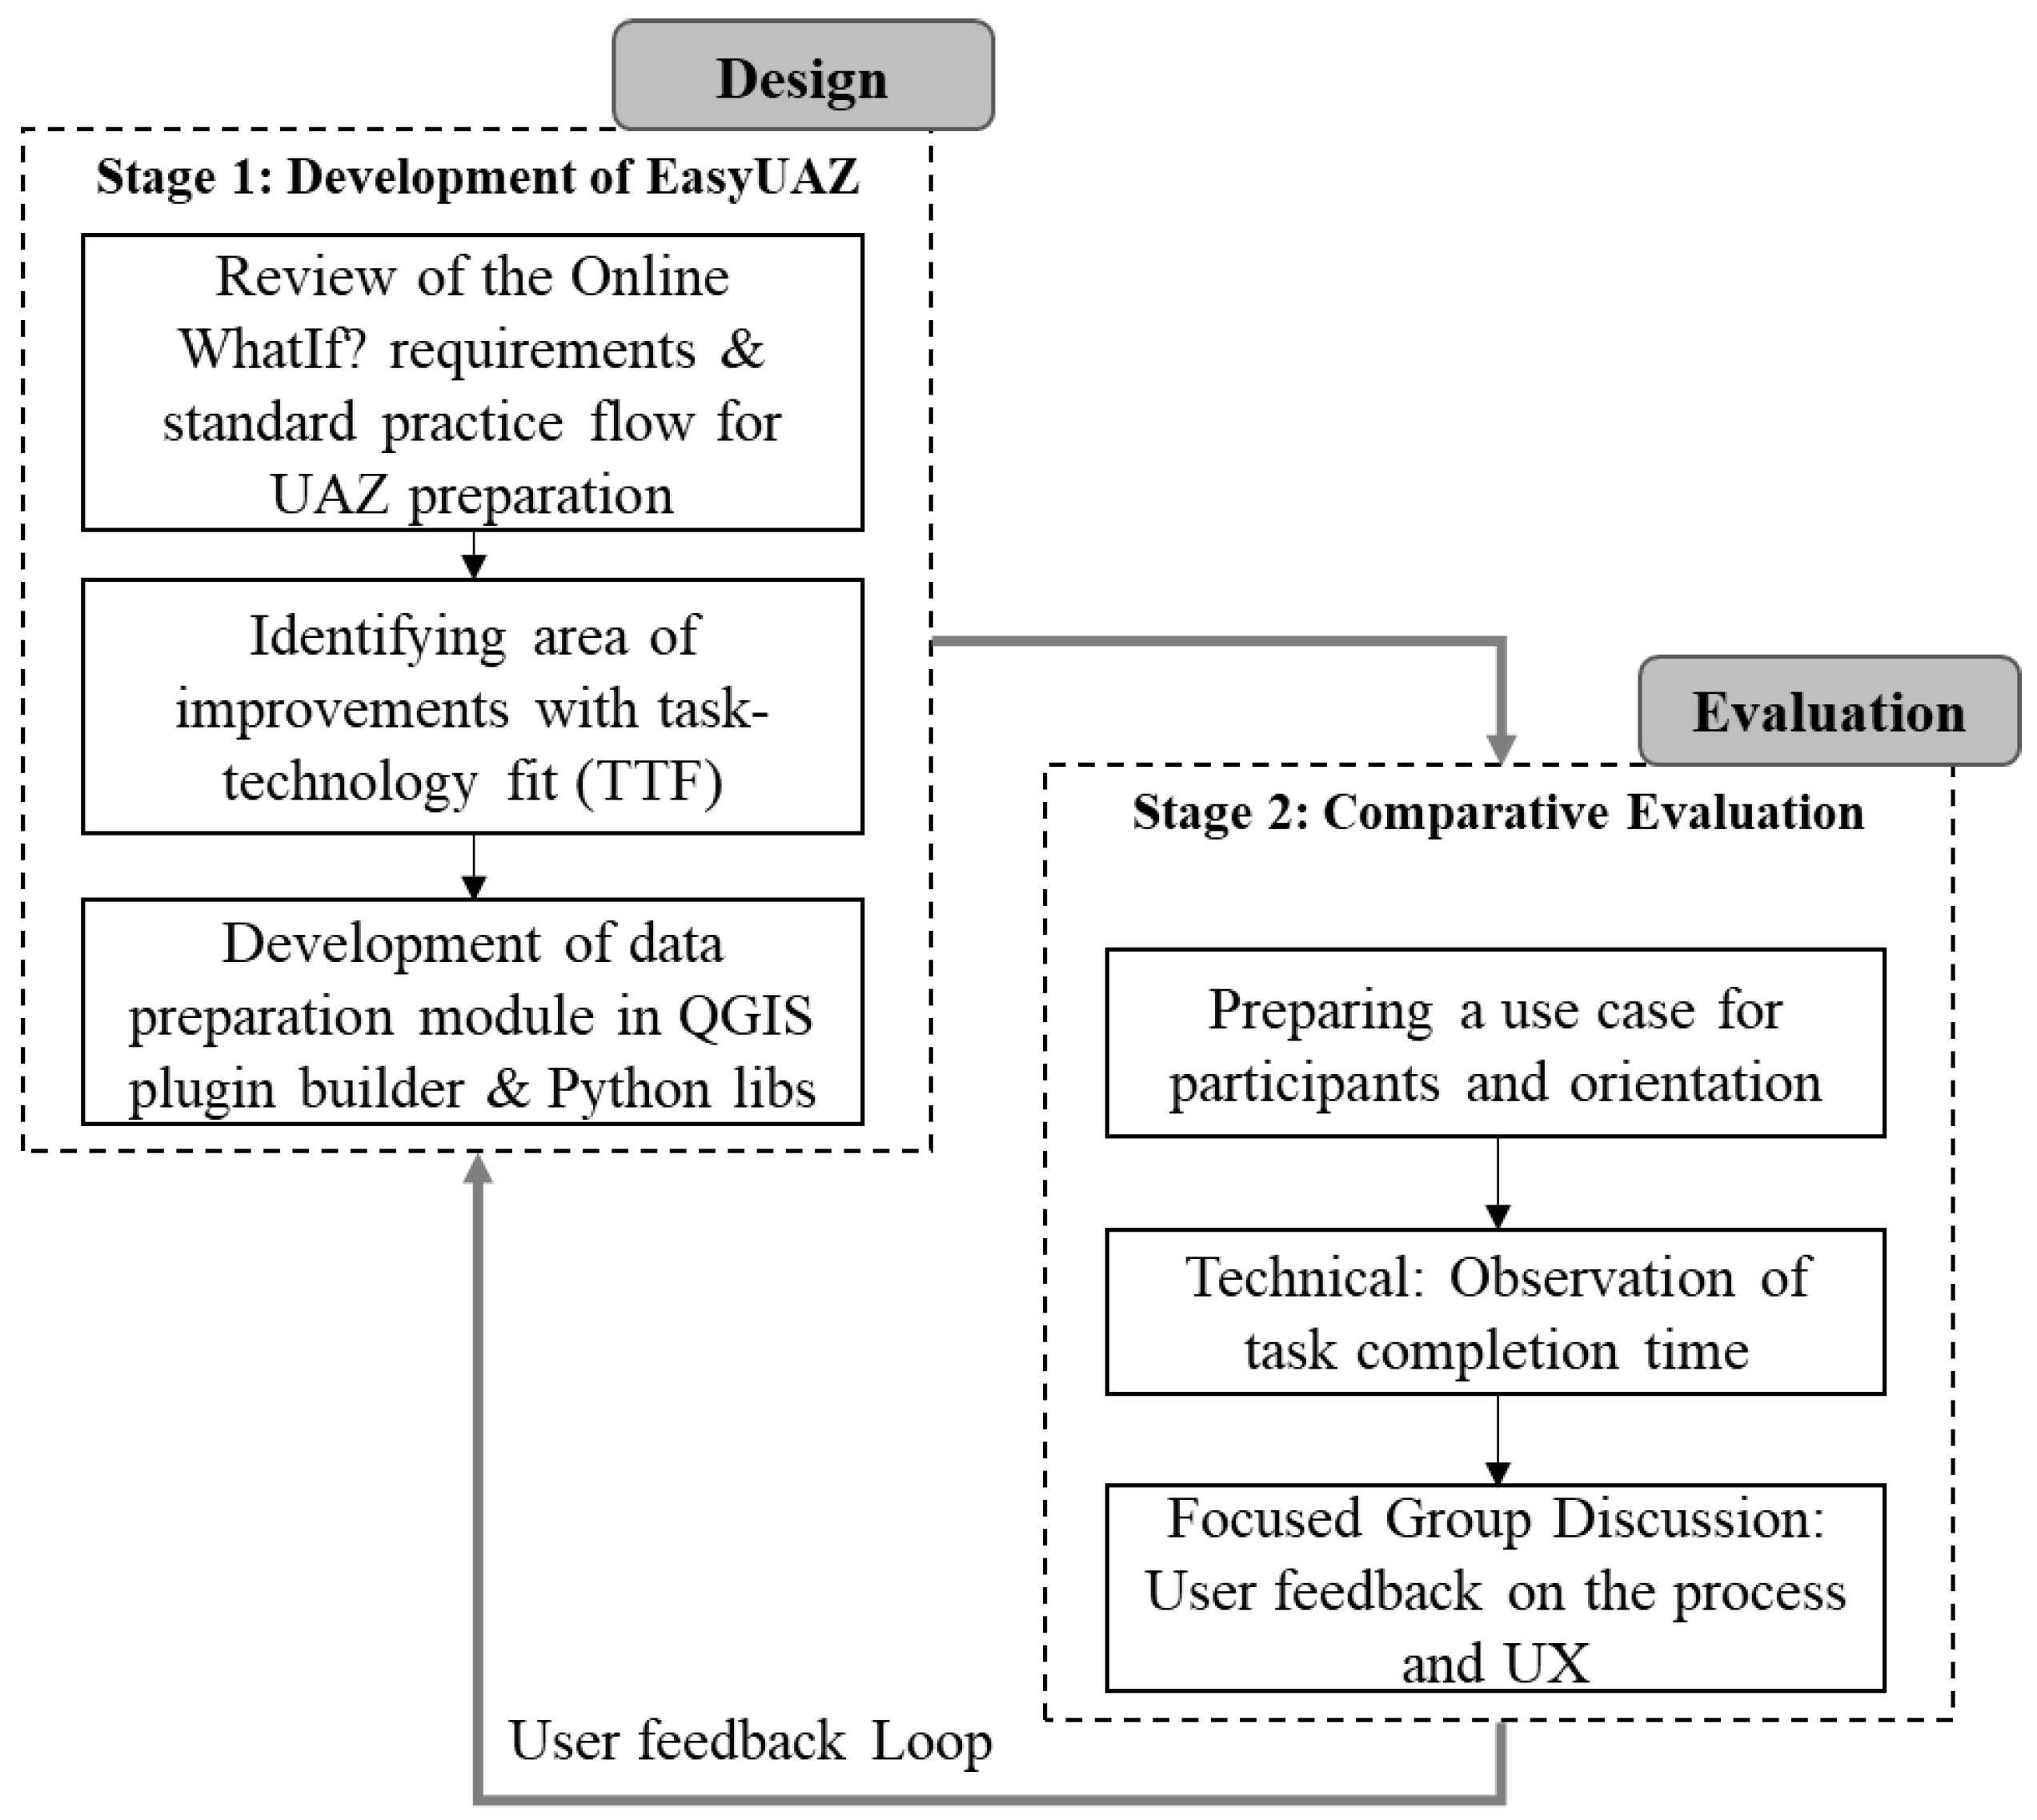
3.2. Research Design
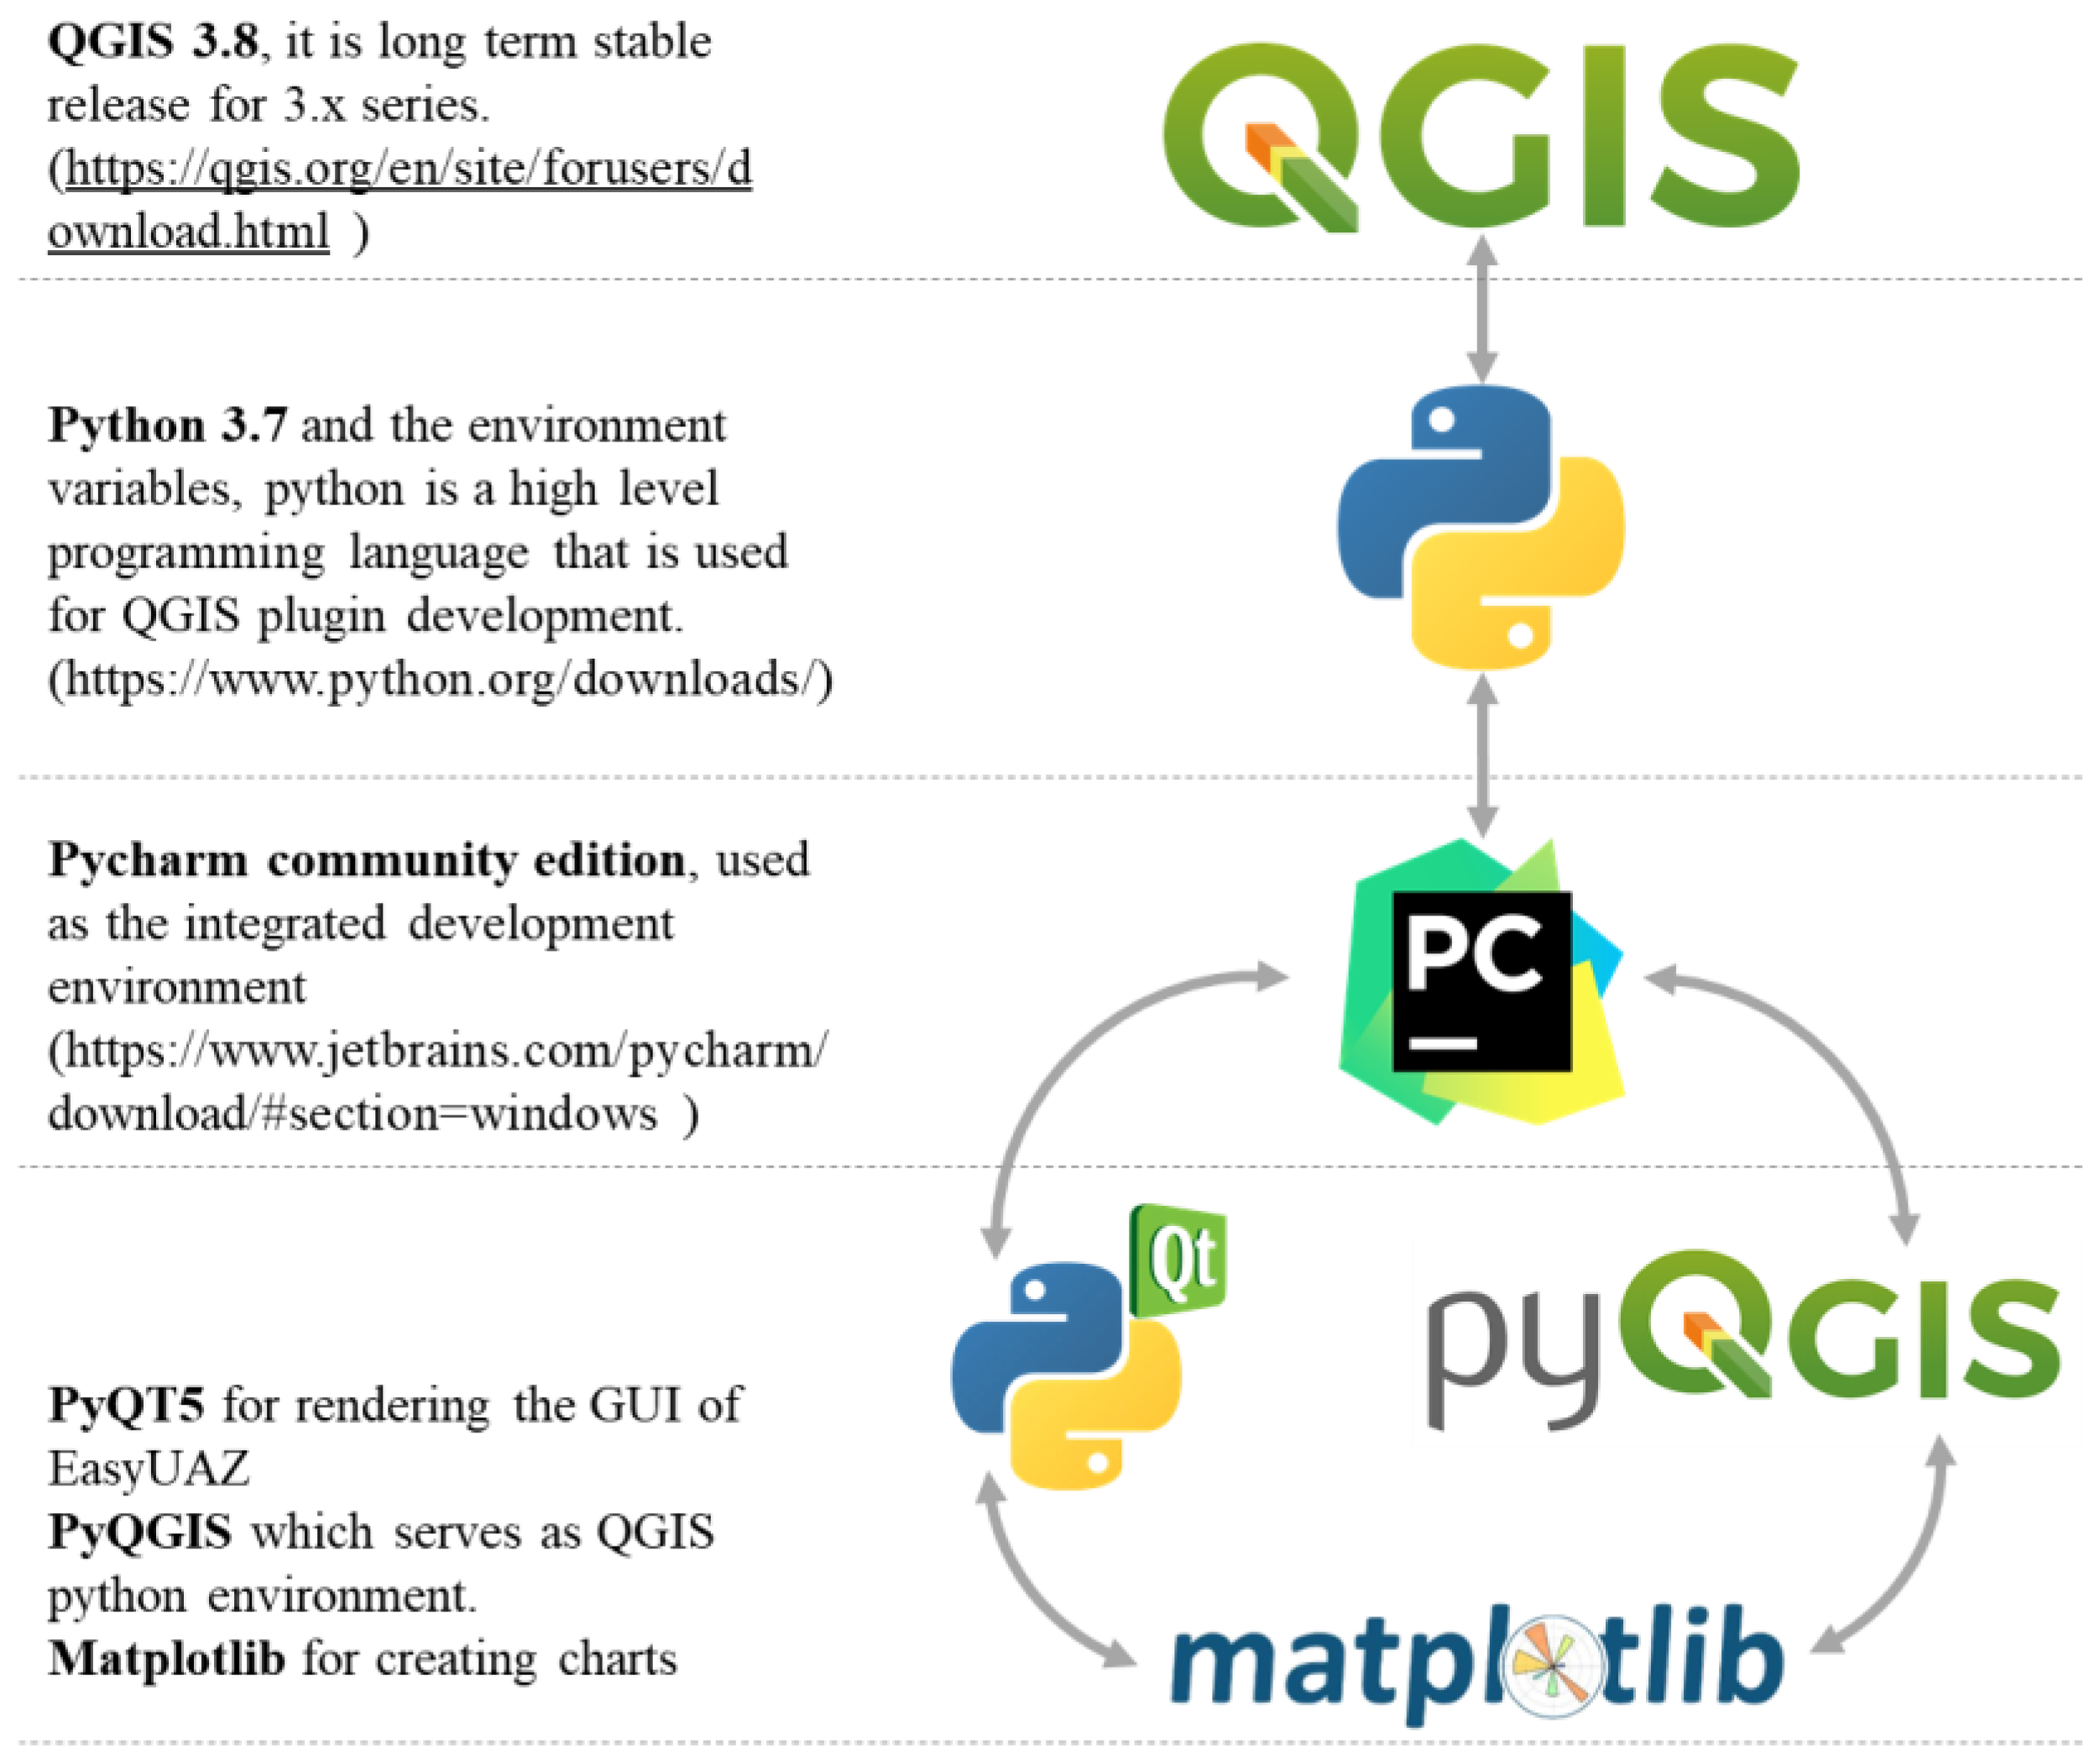
3.3. Stage 1: Development of the EasyUAZ; a Preparatory Workflow Tool for Online WhatIf?
3.4. Stage 2: Comparative Evaluation
3.4.1. User Experience (Technical)
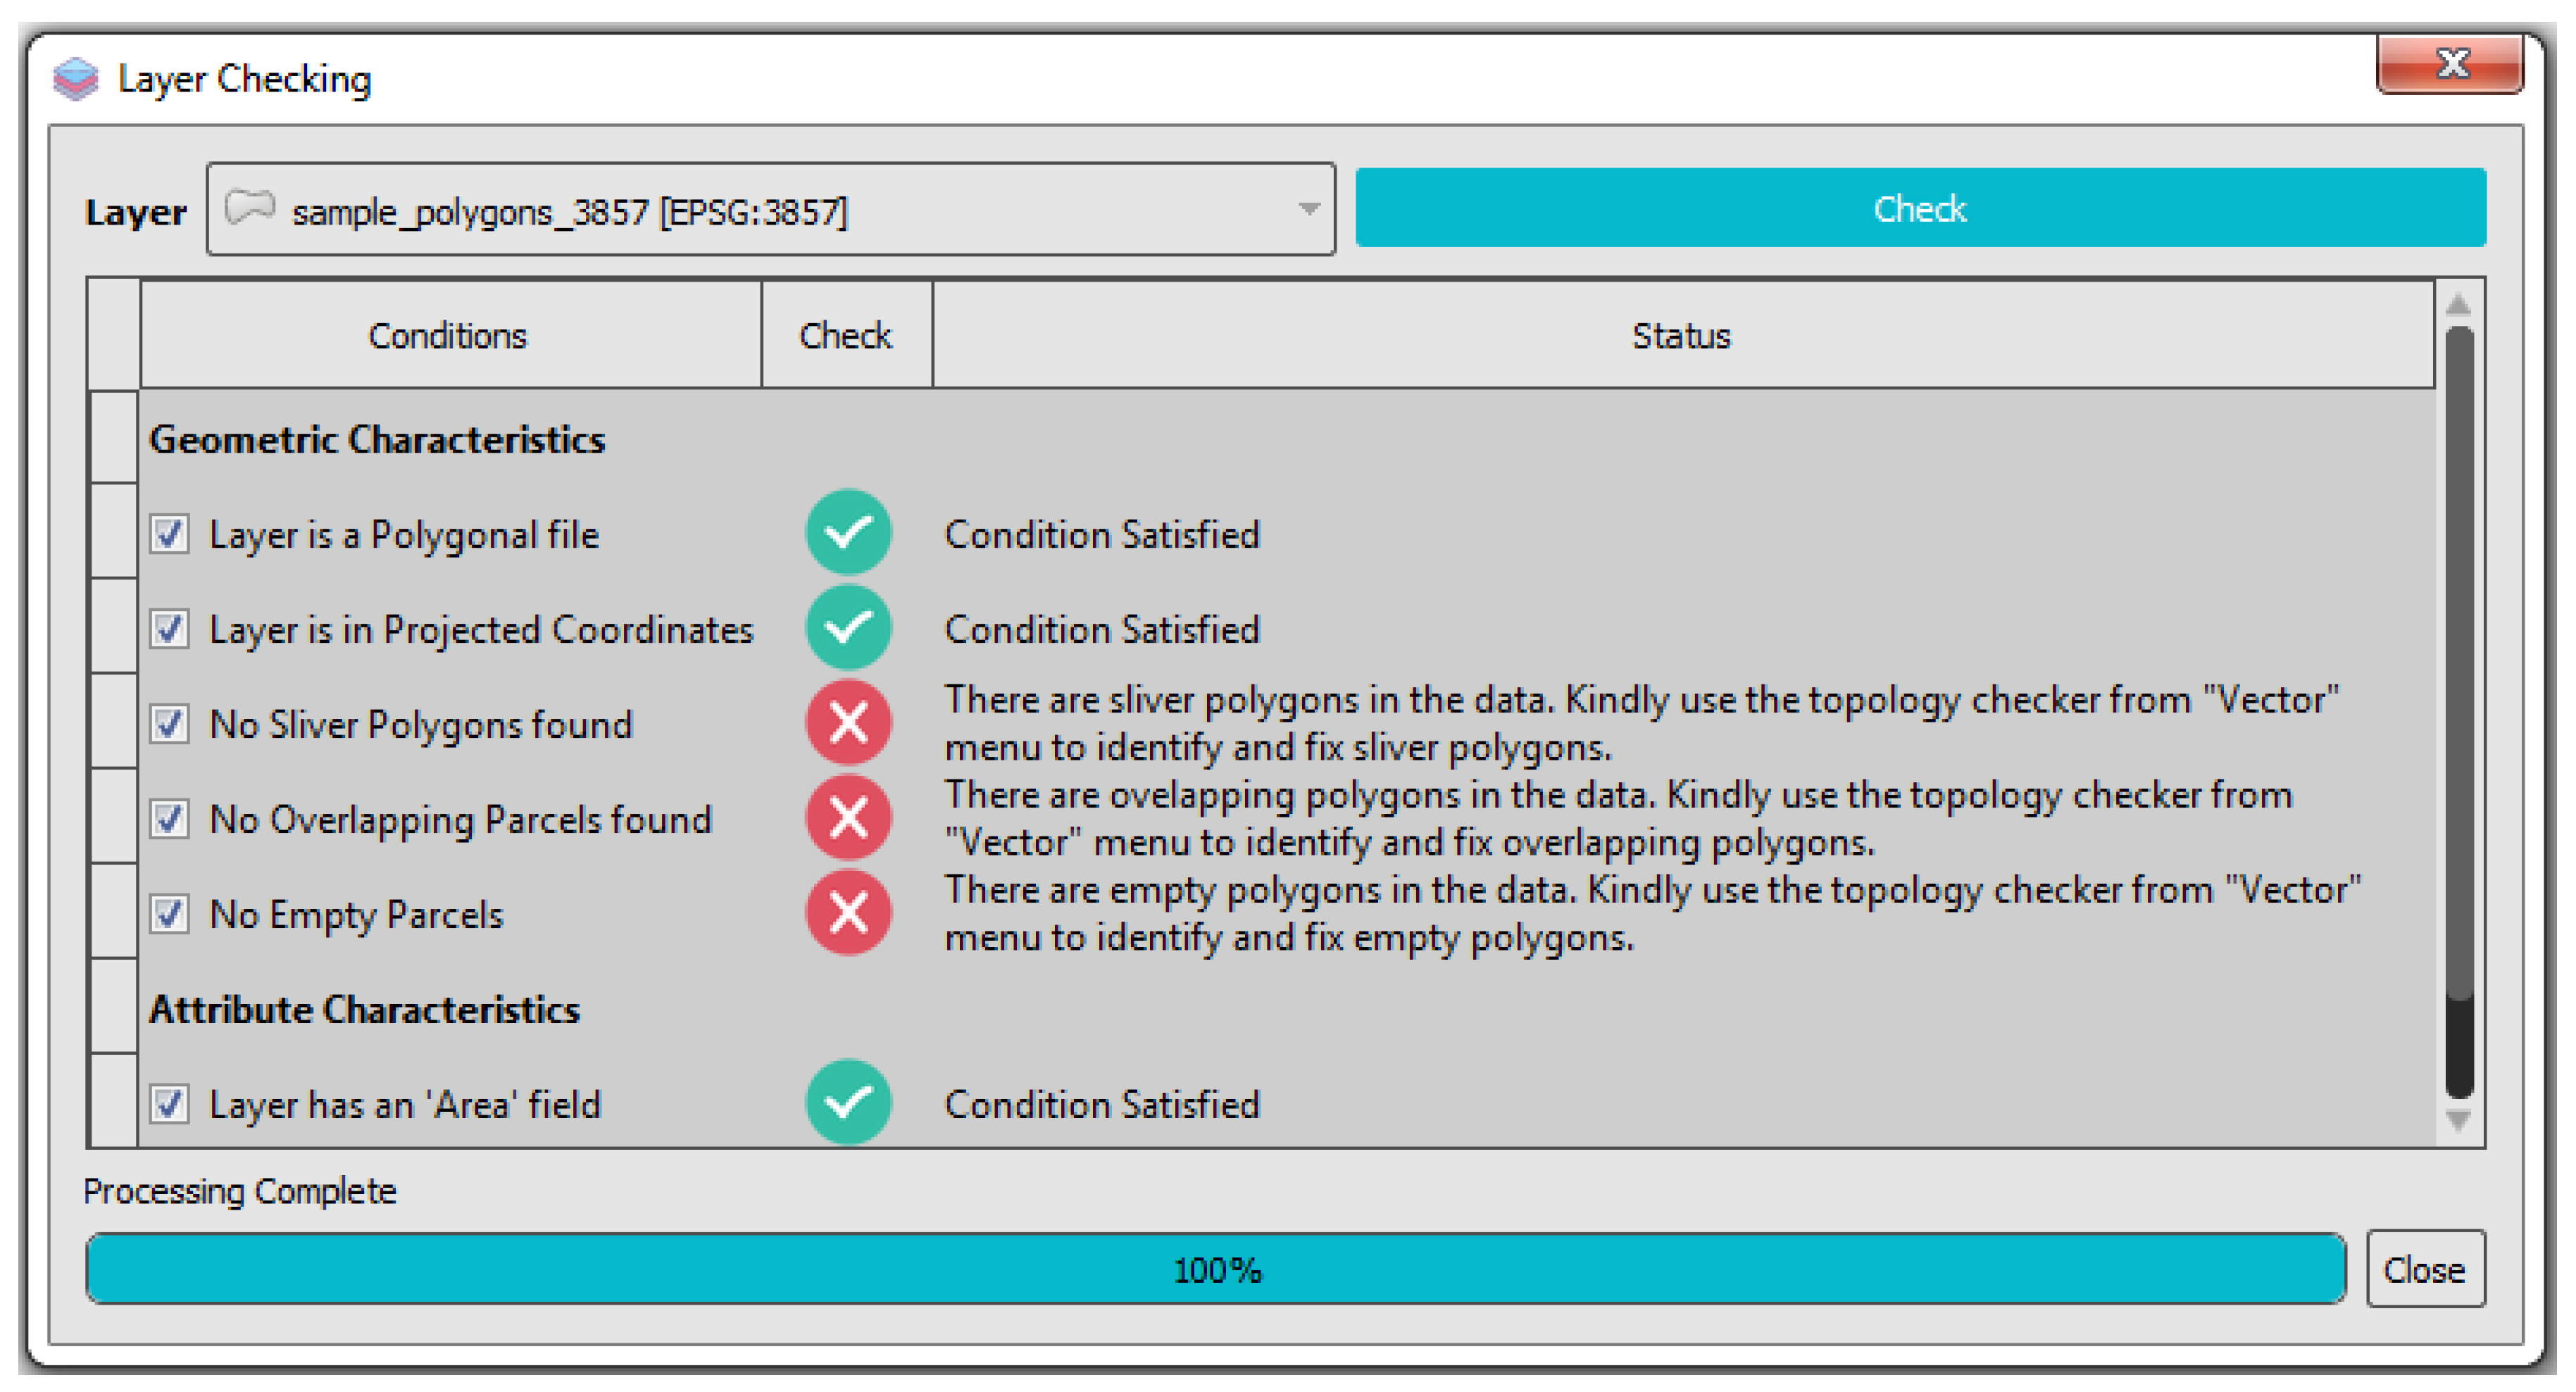
- is free from geometric errors and comply with the topology rules of no overlaps, must not have gaps, and must not have slivers
- the factor layers need to be prepared and assigned to the main polygon file as columns containing required classes
3.4.2. User Experience (Focused Group Discussion)
4. Use Case
5. Results and Discussion
5.1. Development of EasyUAZ
5.1.1. Layer Checking Module
5.1.2. Situational Analysis Module
5.1.3. UAZ Preparation
5.2. Evaluation of the Workflow Tool
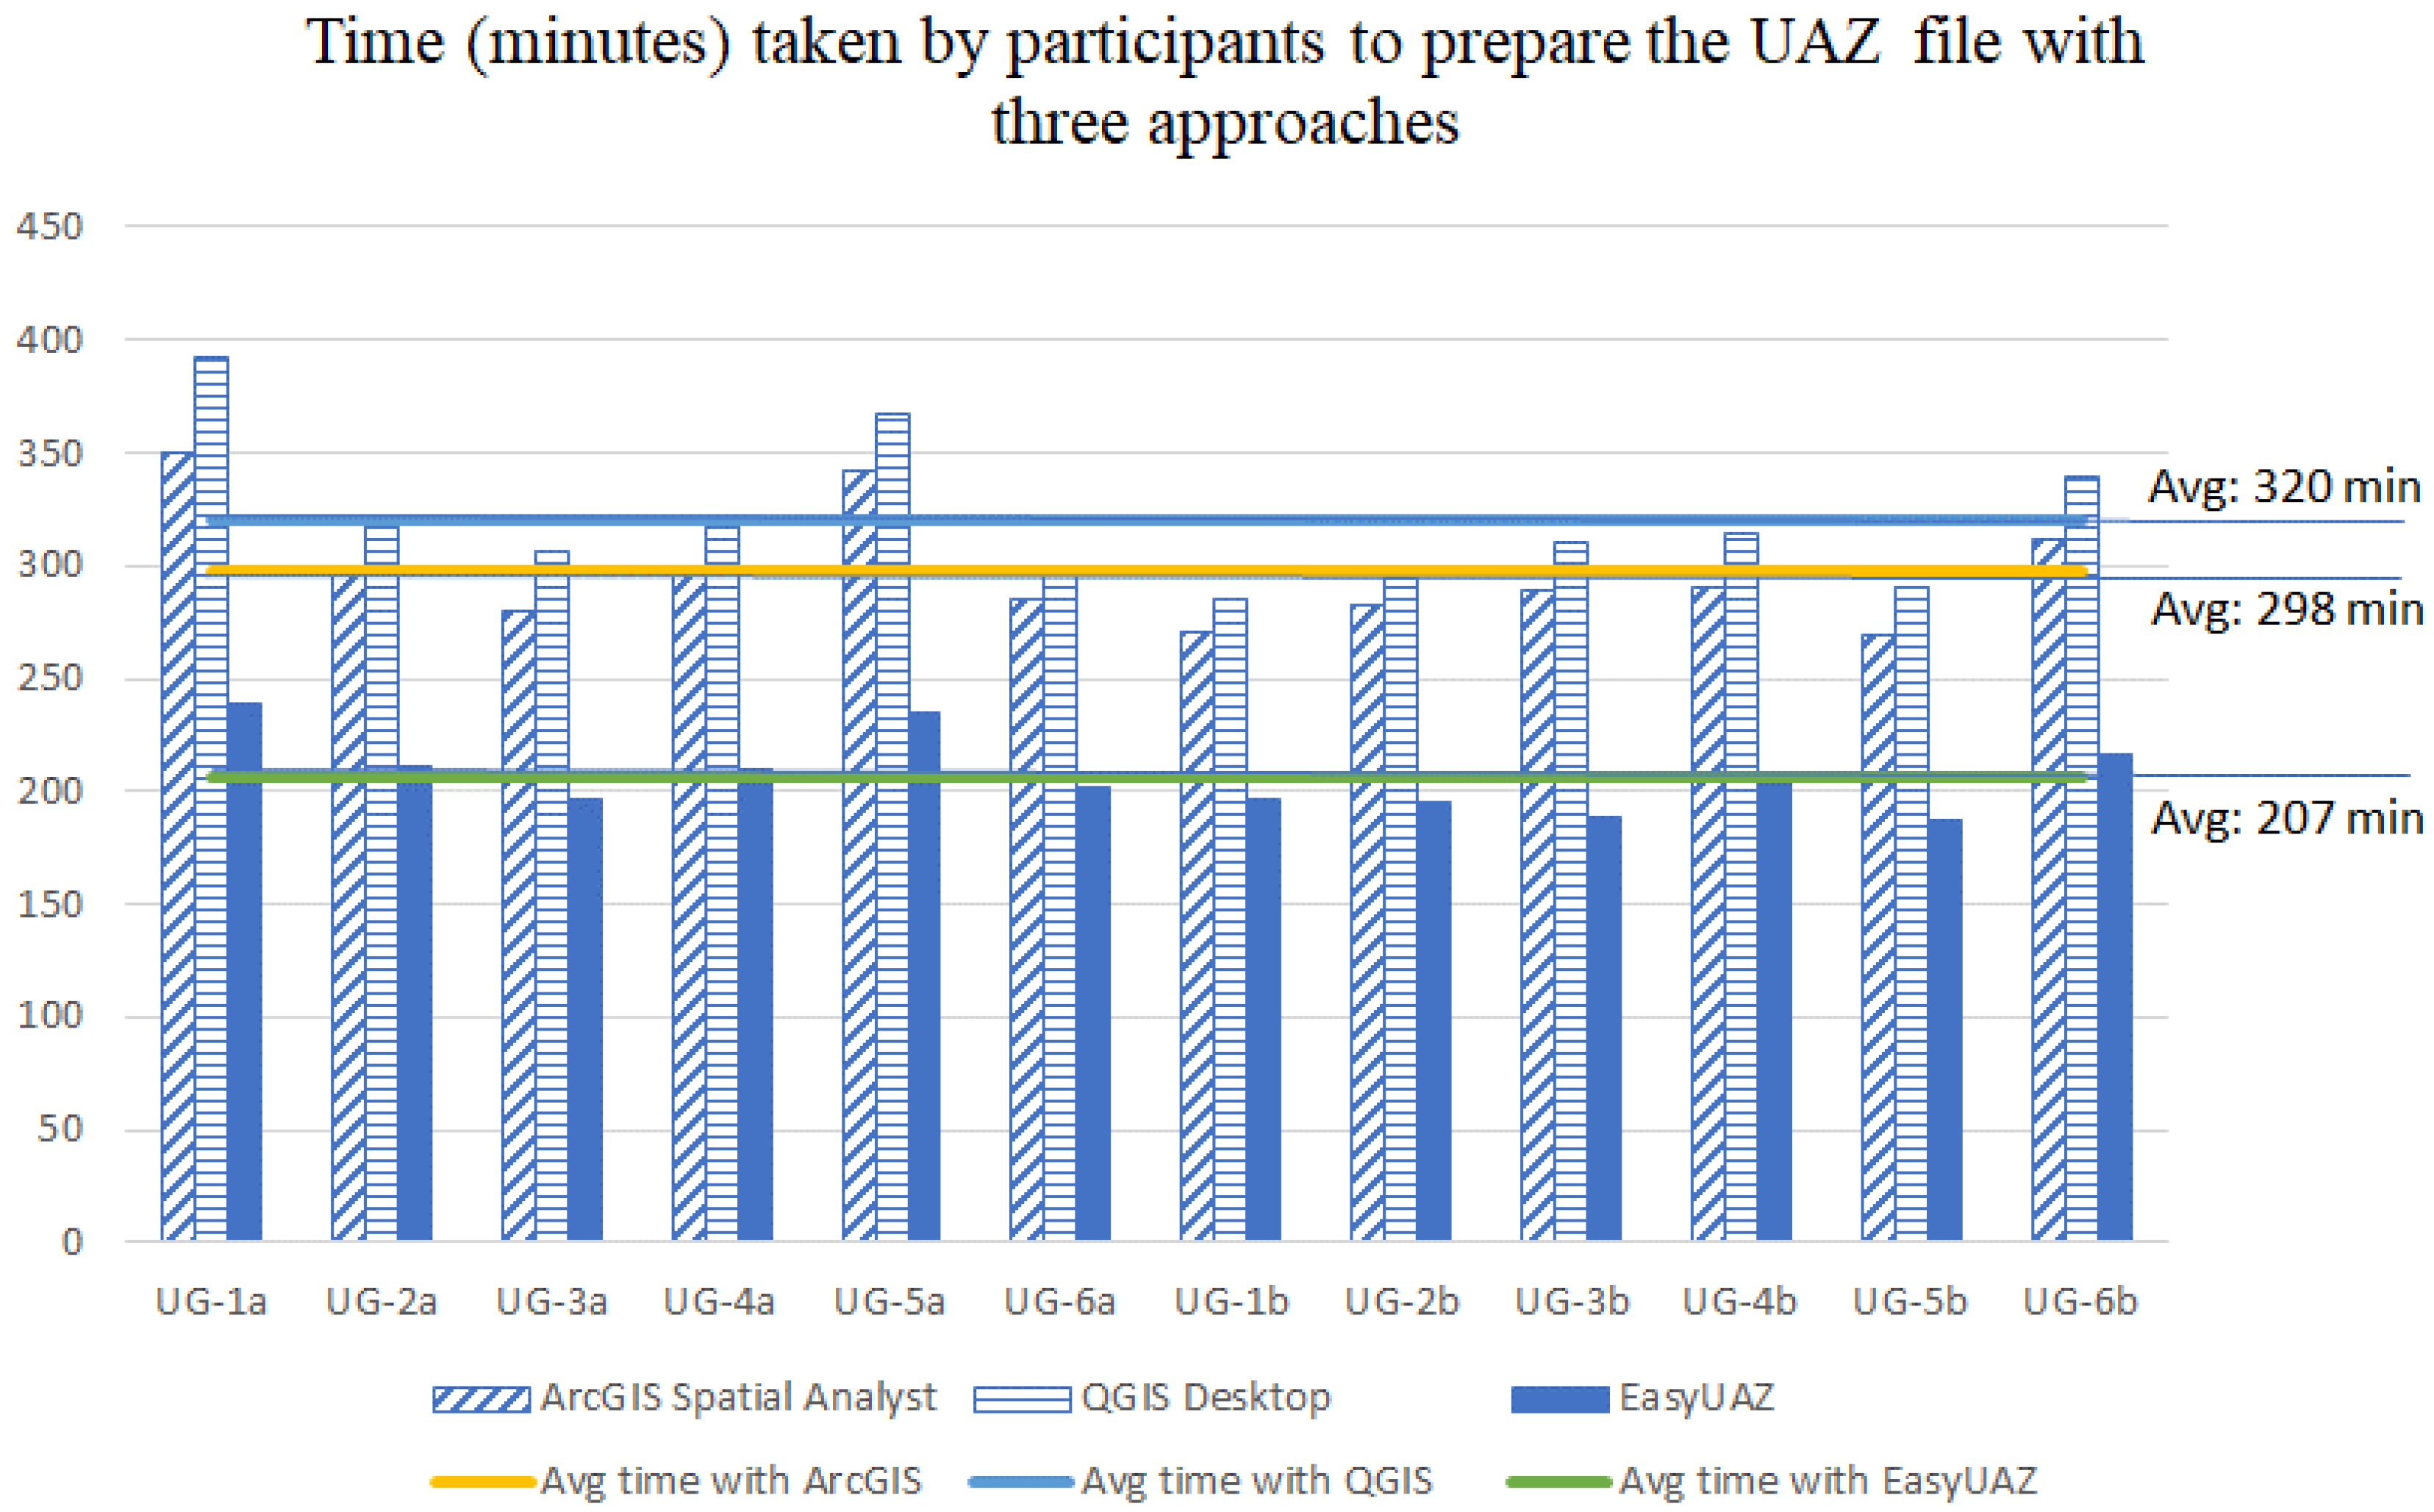
5.2.1. Technical Evaluation of the Workflow Tool
5.2.2. User Experience (Focused Group Discussion)
5.2.3. Other Use Cases
6. Conclusions
Author Contributions
Funding
Acknowledgments
Conflicts of Interest
References
- Russo, P.; Costabile, M.F.; Lanzilotti, R.; Pettit, C.J. Planning Support Systems and Smart Cities; Springer: New York, NY, USA, 2015; pp. 337–353. [Google Scholar] [CrossRef]
- Pettit, C.; Bakelmun, A.; Lieske, S.N.; Glackin, S.; Hargroves, K.; Thomson, G.; Shearer, H.; Dia, H.; Newman, P. Planning support systems for smart cities. City Cult. Soc. 2018, 12, 13–24. [Google Scholar] [CrossRef]
- Vonk, G.; Geertman, S. Improving the Adoption and Use of Planning Support Systems in Practice. J. Appl. Spat. Anal. Policy 2008, 1, 153–173. [Google Scholar] [CrossRef] [Green Version]
- Russo, P.; Lanzilotti, R.; Costabile, M.F.; Pettit, C.J. Adoption and Use of Software in Land Use Planning Practice: A Multiple-Country Study. Int. J. Hum. Comput. Interact. 2017, 34, 57–72. [Google Scholar] [CrossRef]
- Holway, J.; Gabbe, C.; Hebbert, F.; Lally, J.; Mathews, R.; Quay, R. Opening Access to Scenario Planning Tools, Cambridge, 2012. Available online: https://www.lincolninst.edu/pubs/2027_Opening-Access-to-Scenario-Planning-Tools (accessed on 25 November 2020).
- Vonk, G.; Geertman, S.; Schot, P. Bottlenecks blocking widespread usage of planning support systems. Environ. Plan. A 2005, 37, 909–924. [Google Scholar] [CrossRef] [Green Version]
- Hussnain, M.Q.; Waheed, A.; Anjum, G.A.; Naeem, M.A.; Hussain, E.; Wakil, K.; Pettit, C.J. A framework to bridge digital planning tools’ utilisation gap in peri-urban spatial planning; lessons from Pakistan. Comput. Environ. Urban Syst. 2020, 80, 101451. [Google Scholar] [CrossRef]
- Waddell, P. UrbanSim: Modeling Urban Development for Land Use, Transportation, and Environmental Planning. J. Am. Plan. Assoc. 2002, 68, 297–314. [Google Scholar] [CrossRef]
- Kim, D.; Batty, M. Calibrating Cellular Automata Models for Simulating Urban Growth: Comparative Analysis of SLEUTH and Metronamica. UCL Work. Pap. Ser. 2011, 176, 38. Available online: https://www.ucl.ac.uk/bartlett/casa/sites/bartlett/files/migrated-files/paper176.pdf (accessed on 25 November 2019).
- Clarke, K.C. A Decade of Cellular Urban Modeling with SLEUTH: Unresolved Issues and Problems, Ch. 3 in Planning Support Systems for Cities and Regions. 2008. Available online: http://bbs.geog.ucsb.edu (accessed on 28 April 2020).
- Boulangé, C.; Pettit, C.; Giles-Corti, B. The Walkability Planning Support System: An Evidence-Based Tool to Design Healthy Communities. In Planning Support Science for Smarter Urban Futures; Geertman, S., Allan, A., Pettit, C., Stillwell, J., Eds.; Springer International Publishing: Cham, Switzerland, 2017; pp. 153–165. [Google Scholar]
- Pelzer, P.; Geertman, S.; van der Heijden, R. A comparison of the perceived added value of PSS applications in group settings. Comput. Environ. Urban Syst. 2016, 56, 25–35. [Google Scholar] [CrossRef]
- Brömmelstroet, M.; Pelzer, P.; Klerkx, R.; Schaminée, S. Do Planning Support Systems Improve Planning? Testing the claim in a controlled experiment. In Planning Support Systems for Sustainable Urban Development; Springer: New York, NY, USA, 2013; pp. 1–21. [Google Scholar]
- Pelzer, P.; Arciniegas, G.; Geertman, S.; Lenferink, S. Planning Support Systems and Task-Technology Fit: A Comparative Case Study. Appl. Spat. Anal. Policy 2015, 8, 155–175. [Google Scholar] [CrossRef] [Green Version]
- Pettit, C.J.; Wyatt, R. A Planning Support System Toolkit Approach for Formulating and Evaluating Land-use Change Scenarios. In Planning Support Systems Best Practice and New Methods; Geertman, S., Stillwell, J., Eds.; Springer: Dordrecht, The Netherlands, 2009; pp. 137–157. [Google Scholar]
- Waddell, P. Integrated land use and transportation planning and modelling: Addressing challenges in research and practice. Transp. Rev. 2011, 31, 209–229. [Google Scholar] [CrossRef]
- Rainis, R.; Shamsudin, K.; Jaafar, M.N.; Shah, H.H. Development of the Klang Valley Regional Planning Support System. In Planning Support Systems in Practice; Geertman, S., Stillwell, J., Eds.; Springer: Berlin/Heidelberg, Germany, 2003; pp. 409–433. [Google Scholar]
- Schnaars, S.P. How to develop and use scenarios. Long Range Plan. 1987, 20, 105–114. [Google Scholar] [CrossRef]
- Godet, M. How to be rigorous with scenario planning. Foresight 2000, 2, 5–9. [Google Scholar] [CrossRef]
- Goodspeed, R. Scenario Planning for Cities and Regions Managing and Envisioning Uncertain Futures; Lincoln Institute of Land Policy: Cambridge, MA, USA, 2020. [Google Scholar]
- Pettit, C.J.; Klosterman, R.E.; Delaney, P.; Whitehead, A.L.; Kujala, H.; Bromage, A.; Nino-Ruiz, M. The Online What if? Planning Support System; Springer: Berlin/Heidelberg, Germany, 2013; Volume 195, pp. 107–125. [Google Scholar] [CrossRef]
- Pettit, C.; Klosterman, R.E.; Delaney, P.; Whitehead, A.; Kujala, H.; Bromage, A.; Nino-Ruiz, M. The Online What if? Planning Support System: A Land Suitability Application in Western Australia. Appl. Spat. Anal. Policy 2015, 8, 93–112. [Google Scholar] [CrossRef]
- Klosterman, R.E. The What if? Collaborative planning support system. Environ. Plan. B 1999, 26, 393–408. [Google Scholar] [CrossRef]
- Brail, R.K.; Klosterman, R.E. Planning Support Systems: Integrating Geographic Information Systems, Models, and Visualisation Tools; ESRI Inc.: New York, NY, USA, 2001. [Google Scholar]
- Pettit, C.; Keysers, J.; Bishop, I.; Klosterman, R. Applying the What If? Planning Support System for Better Understanding Urban Fringe Growth. In Landscape Analysis and Visualisation: Spatial Models for Natural Resource Management and Planning; Pettit, C., Cartwright, W., Bishop, I., Lowell, K., Pullar, D., Duncan, D., Eds.; Springer: Berlin/Heidelberg, Germany, 2008; pp. 435–454. [Google Scholar]
- Hussnain, M.Q.; Waheed, A.; Wakil, K.; Tahir, A.; Pettit, C.; Pelizaro, C.; Jabbar, J.A. A Planning Support System to Aid Spatial Planning in Pakistan. In Computers in Urban Planning and Urban Management (CUPUM2017); University of South Australia: Adelaide, Australia, 2017. [Google Scholar]
- Pettit, C.; Biermann, S.; Pelizaro, C.; Bakelmun, A. A Data-Driven Approach to Exploring Future Land Use and Transport Scenarios: The Online What If? Tool. J. Urban Technol. 2020, 732, 20–44. [Google Scholar] [CrossRef]
- Hussnain, M.Q.; Waheed, A.; Anjum, G.A.; Naeem, M.A.; Wakil, K.; Tahir, A.; Pettit, C.; Hussain, E. Application of the Online WhatIf? Planning Support System in Peri-urban Spatial Planning; Case study of Muzaffargarh, Pakistan. In Proceedings of the 24th International Conference on Urban Planning and Regional Development in the Information Society, Karlsruhe, Germany, 2–4 April 2019; pp. 77–87. [Google Scholar]
- Russo, P.; Lanzilotti, R.; Costabile, M.F.; Pettit, C.J. Towards satisfying practitioners in using Planning Support Systems. Comput. Environ. Urban Syst. 2018, 67, 9–20. [Google Scholar] [CrossRef]
- Pettit, C.; Shyy, T.-K.; Stimson, R. An On-line Planning Support System to Evaluate Urban and Regional Planning Scenarios. In Planning Support Systems in Practice. Advances in Spatial Science; Geertman, S., Stillwell, J., Eds.; Springer: Berlin/Heidelberg, Germany, 2003. [Google Scholar]
- Bishop, I.; Pettit, C.J.; Van, B.D.; Lynch, J. Visualising What If? Generated Land Use Planning Scenarios. Available online: http://www.dupad.hku.hk/cupumhk/ (accessed on 25 November 2020).
- Pettit, C.; Pullar, D. A way forward for land-use planning to achieve policy goals by using spatial modelling scenarios. Environ. Plan. B Plan. Des. 2004, 31, 213–233. [Google Scholar] [CrossRef] [Green Version]
- Guhathakurta, S. Urban modeling and contemporary planning theory: Is there a common ground? J. Plan. Educ. Res. 1999, 18, 281–292. [Google Scholar] [CrossRef]
- Pelzer, P.; Geertman, S.; van der Heijden, R.; Rouwette, E. The added value of Planning Support Systems: A practitioner’s perspective. Comput. Environ. Urban Syst. 2014, 48, 16–27. [Google Scholar] [CrossRef]
- Pelzer, P.; Geertman, S.; van der Heijden, R. Knowledge in communicative planning practice: A different perspective for planning support systems. Environ. Plan. B Plan. Des. 2015, 42, 638–651. [Google Scholar] [CrossRef]
- Ratti, C.; Claudel, M. The City of Tomorrow: Sensors, Networks, Hackers, and the Future of Urban Life; Yale University Press: London, UK, 2016. [Google Scholar]
- Townsend, A.M. Smart Cities: Big Data, Civic Hackers, and the Quest for a New Utopia; WW Norton & Company: New York, NY, USA, 2013. [Google Scholar]
- Hamilton, A.; Wang, H.; Tanyer, A.M.; Arayici, Y.; Zhang, X.; Song, Y. Urban information model for city planning. J. Inf. Technol. Constr. 2005, 10, 55–67. [Google Scholar]
- Thakuriah, P.; Tilahun, N.Y.; Zellner, M. Big data and urban informatics: Innovations and challenges to urban planning and knowledge discovery. In Springer Geography; Springer: Berlin/Heidelberg, Germany, 2017; pp. 11–45. [Google Scholar]
- Ahmed, N.S. Big Data and Urban Planning in Pakistan: A Case Study of The Urban Unit; York University: Toronto, ON, Canada, 2018. [Google Scholar]
- Stohr, E.A.; Zhao, J.L. Workflow Automation: Overview and Research Issues. Inf. Syst. Front. 2001, 3, 281–296. [Google Scholar] [CrossRef]
- Verborgh, R.; de Wilde, M. Using OpenRefine; Packt Publishing Ltd.: Birmingham, UK, 2013. [Google Scholar]
- Kusumasari, T.F. Fitria Data profiling for data quality improvement with OpenRefine. In Proceedings of the 2016 International Conference on Information Technology Systems and Innovation (ICITSI), Bandung, Indonesia, 24–27 October 2016; pp. 1–6. [Google Scholar] [CrossRef]
- Groves, A. Beyond Excel: How to start cleaning data with OpenRefine. Multimed. Inf. Technol. 2016, 42, 18–22. [Google Scholar]
- Golubev, A.; Chechetkin, I.; Parygin, D.; Sokolov, A.; Shcherbakov, M. Geospatial Data Generation and Preprocessing Tools for Urban Computing System Development. Procedia Comput. Sci. 2016, 101, 217–226. [Google Scholar] [CrossRef]
- GeoKettle. Available online: https://live.osgeo.org/archive/10.0/en/overview/geokettle_overview.html (accessed on 9 June 2020).
- Data Visualisation | Microsoft Power BI. Available online: https://powerbi.microsoft.com/en-us/ (accessed on 9 June 2020).
- ESRI. ArcGIS Workflow Manager | Enterprise Workflow Management System. Available online: https://www.esri.com/en-us/arcgis/products/arcgis-workflow-manager/overview (accessed on 9 June 2020).
- ESRI. What Is ModelBuilder? Available online: https://pro.arcgis.com/en/pro-app/help/analysis/geoprocessing/modelbuilder/what-is-modelbuilder-.htm (accessed on 9 June 2020).
- Olaya, V.; Cavallini, P. QGIS Processing Framework. Available online: https://docs.qgis.org/3.10/en/docs/training_manual/processing/index.html (accessed on 7 June 2020).
- Google. Google Earth Engine. Available online: https://earthengine.google.com/ (accessed on 9 June 2020).
- SAFE, FME Workflow Management. 2020. Available online: https://www.safe.com/training/recorded/fme-workflow-management/ (accessed on 27 May 2020).
- SAFE, Safe Software |FME| Data Integration Platform. Available online: https://www.safe.com/ (accessed on 22 June 2020).
- Hale Studio—Fast, Interactive Data Transformation. Available online: https://www.wetransform.to/products/halestudio/ (accessed on 7 June 2020).
- Waddell, P.; Janowicz, E.; Blanchard, S.; Maurer, S. UrbanCanvas: A collaborative platform for informed planning. In Handbook of Planning Support Science; Edward Elgar Publishing: Northampton, MA, USA, 2020. [Google Scholar]
- UrbanCanvas—UrbanSim. Available online: https://urbansim.com/urbancanvas (accessed on 28 June 2020).
- UrbanSim, Urban Data Science Toolkit. Available online: https://urbansim.com/udst (accessed on 16 June 2020).
- USGS. Project Gigalopolis. Available online: http://www.ncgia.ucsb.edu/projects/gig/Imp/imSetUp.htm (accessed on 28 June 2020).
- Chaudhuri, G.; Clarke, K.C. The SLEUTH Land Use Change Model: A Review. Int. J. Environ. Resour. Res. 2013, 1, 88–104. [Google Scholar]
- Hilferink, M.; Rietveld, P. LAND USE SCANNER: An integrated GIS based model for long term projections of land use in urban and rural areas. J. Geogr. Syst. 1999, 1, 155–177. [Google Scholar] [CrossRef] [Green Version]
- Koomen, E.; Hilferink, M.; Beurden, J.B. Introducing land use scanner. In Land-Use Modelling in Planning Practice; Springer: Dordrecht, Germany, 2011; pp. 3–21. [Google Scholar]
- Van Delden, H.; Escudero, J.C.; Uljee, I.; Engelen, G. METRONAMICA: A dynamic spatial land use model applied to Vitoria-Gasteiz. In Virtual Seminar of the MILES Project; Centro de Estudios Ambientales: Vitoria-Gasteiz, Spain, 2005; pp. 1–8. [Google Scholar]
- De Silva, C.; Wimaladasa, J.; Munasinghe, J. Calibrating Metronamica Land Use Simulation Model for Colombo, Sri Lanka. Bhumi Plan. Res. J. 2015, 4, 1. [Google Scholar] [CrossRef] [Green Version]
- Van Delden, H.; Vanhout, R. A Short Presentation of Metronamica. In Geomatic Approaches for Modeling Land Change Scenarios; Olmedo, M.T.C., Paegelow, M., Mas, J.-F., Escobar, F., Eds.; Springer International Publishing: Cham, Switzerland, 2018; pp. 511–519. [Google Scholar]
- Li, Y.; Jiao, J. Comparative Analysis of Three Planning Support Software (PSS) Programs and Current Applications of Planning Support System in China. In Proceedings of the 13th International Conference on Computers in Urban Planning and Urban Management, Utrecht, Vietnam, 2–5 July 2013; pp. 1–20. [Google Scholar]
- INDEX PlanBuilder User Notebook; Criterion Planners: Portland, OR, USA, 2007.
- Kwartler, M.; Bernard, R.N. CommunityViz: An Integrated Planning Support System; Esri Press: New York, NY, USA, 2001; pp. 285–308. [Google Scholar]
- Petzold, I.; Burghardt, D.; Bobzien, M. Workflow Management and Generalisation Services. In Proceedings of the 9th ICA Workshop on Generalization and Multiple Representation, Portland, OR, USA, 5 June 2006. [Google Scholar]
- Jusuf, S.K.; Mousseau, B.; Godfroid, G.; Hui, V.S.J. Integrated modeling of CityGML and IFC for city/neighborhood development for urban microclimates analysis. Energy Procedia 2017, 122, 145–150. [Google Scholar] [CrossRef]
- Pettit, C.J.; Barton, J.; Goldie, X.; Sinnott, R.; Stimson, R.; Kvan, T. The Australian Urban Intelligence Network Supporting Smart Cities. In Planning Support Systems and Smart Cities; Geertman, S., Goodspeed, J.F., Jr., Stillwell, J., Eds.; Springer International Publishing: Cham, Switzerland, 2015; pp. 243–259. [Google Scholar]
- Sinnott, R.O.; Bayliss, C.; Bromage, A.; Galang, G.; Grazioli, G.; Greenwood, P.; Macaulay, A.; Morandini, L.; Nogoorani, G.; Nino-Ruiz, M.; et al. The Australia urban research gateway. Concurr. Comput. Pract. Exp. 2014, 27, 358–375. [Google Scholar] [CrossRef]
- AURIN, Online WhatIf? User Guide. 2016. Available online: https://docs.aurin.org.au/what-if/online-whatif-user-guide/ (accessed on 25 November 2020).
- Pettit, C.; Shi, Y.; Han, H.; Rittenbruch, M.; Foth, M.; Lieske, S.; Nouwelant, R.V.D.; Mitchell, P.; Leao, S.; Christensen, B.; et al. A new toolkit for land value analysis and scenario planning. Environ. Plan. B Urban Anal. City Sci. 2020. [Google Scholar] [CrossRef]
- Pelzer, P. Usefulness of planning support systems: A conceptual framework and an empirical illustration. Transp. Res. Part A Policy Pract. 2017, 104, 84–95. [Google Scholar] [CrossRef]
- Pettit, C.J.; Tanton, R.; Hunter, J. An online platform for conducting spatial-statistical analyses of national census data across Australia. Comput. Environ. Urban Syst. 2017, 63, 68–79. [Google Scholar] [CrossRef]
- Barton, J.E.; Goldie, X.H.; Pettit, C.J. Introducing a usability framework to support urban information discovery and analytics. J. Spat. Sci. 2015, 60, 311–327. [Google Scholar] [CrossRef]
- ESRI. ArcMap | Documentation. Available online: https://desktop.arcgis.com/en/arcmap/ (accessed on 8 May 2020).
- QGIS, QGIS: A Free and Open Source Geographic Information System. 2019. Available online: https://www.qgis.org/en/site/ (accessed on 22 May 2019).
- Graziano, A.M.; Raulin, M.L. Research Methods: A process of Inquiry; HarperCollins College Publishers: New York, NY, USA, 1993. [Google Scholar]
- Allen, M. The SAGE Encyclopedia of Communication Research Methods; SAGE: Thousand Oaks, CA, USA, 2017. [Google Scholar] [CrossRef]
- GoP. 6th Population and Housing Census 2017 (Provisional Results). Pakistan Bureau of Statistics: Islamabad, Pakistan, 2018. Available online: http://www.pbs.gov.pk/sites/default/files//Population_Census_2017_Results_0.pdf (accessed on 13 May 2019).
- Hussnain, M.Q.U.; Waheed, A.; Wakil, K.; Pettit, C.; Hussain, E.; Naeem, M.A.; Anjum, G.A. Shaping up the Future Spatial Plans for Urban Areas in Pakistan. Sustainability 2020, 12, 4216. [Google Scholar] [CrossRef]
- Afzal, M. Evaluation of Peri-Urban Structure Plan Practices in Punjab; University of Engineering and Technology: Lahore, Pakistan, 2016. [Google Scholar]
- Coetzee, S.; Ivánová, I.; Mitasova, H.; Brovelli, M.A. Open geospatial software and data: A review of the current state and a perspective into the future. ISPRS Int. J. Geo-Inf. 2020, 9, 90. [Google Scholar] [CrossRef] [Green Version]
- Steiniger, S.; Bocher, E. An overview on current free and open source desktop GIS developments. Int. J. Geogr. Inf. Sci. 2009, 23, 1345–1370. [Google Scholar] [CrossRef]
- Friedrich, C. Comparison of ArcGIS and QGIS for Applications in Sustainable Spatial Planning; Universität Wien: Wien, Austria, 2014. [Google Scholar]
- Khan, S.; Aaqib, S.M. Empirical Evaluation of ArcGIS with Contemporary Open Source Solutions-A Study. Int. J. Adv. Res. Sci. Eng. 2017, 6, 724–736. [Google Scholar]
- Khan, S.; Mohiuddin, K. Evaluating the parameters of ArcGIS and QGIS for GIS Applications. Int. J. Adv. Res. Sci. Eng. 2018, 7, 582–594. [Google Scholar]
- Dobesova, Z. Cartoevaluation method for assessment of gis software. Geod. Cartogr. 2013, 39, 164–170. [Google Scholar] [CrossRef]
- Carver, S.J. Integrating multi-criteria evaluation with geographical information systems geographical information systems. Int. J. Geogr. Inf. Syst. 1991, 5, 321–339. [Google Scholar] [CrossRef] [Green Version]
- Glackin, S. Redeveloping the Greyfields With Envision: Using Participatory Support Systems To Reduce Urban Sprawl in Australia. Eur. J. Geogr. 2013, 3, 6–22. [Google Scholar]


| Participants | Order | Day 1 | Day 2 | Day 3 |
|---|---|---|---|---|
| UG-1a | ABC * | ArcMap—ws1 * | QGIS—ws1 | EasyUAZ—ws1 |
| UG-2a | ACB | ArcMap—ws2 | EasyUAZ—ws2 | QGIS—ws2 |
| UG-3a | BAC | QGIS—ws1 | ArcMap—ws1 | EasyUAZ—ws1 |
| UG-4a | BCA | QGIS—ws3 | EasyUAZ—ws3 | ArcMap—ws3 |
| UG-5a | CAB | EasyUAZ—ws2 | ArcMap—ws2 | QGIS—ws2 |
| UG-6a | CBA | EasyUAZ—ws3 | QGIS—ws3 | ArcMap—ws3 |
| UG-1b | ABC | ArcMap—ws1 | QGIS—ws1 | EasyUAZ—ws1 |
| UG-2b | ACB | ArcMap—ws2 | EasyUAZ—ws2 | QGIS—ws2 |
| UG-3b | BAC | QGIS—ws1 | ArcMap—ws1 | EasyUAZ—ws1 |
| UG-4b | BCA | QGIS—ws3 | EasyUAZ—ws3 | ArcMap—ws3 |
| UG-5b | CAB | EasyUAZ—ws2 | ArcMap—ws2 | QGIS—ws2 |
| UG-6b | CBA | EasyUAZ—ws3 | QGIS—ws3 | ArcMap—ws3 |
| Sr. | Layers * | Type | Key Attributes (Other than Spatial) | Relevant Module ** |
|---|---|---|---|---|
| 1 | Land parcels | Polygon | Land uses | S |
| 2 | Water bodies | Polygon | River bed (Active, inactive) | S |
| 3 | Dumping Site | Polygon | Location | S |
| 4 | Housing schemes | Polygons | Approval status, number of plots, area | S |
| 5 | Government-owned land | Polygon | Area | S |
| 6 | Health facilities | Polygon | Name, type, coverage | S |
| 7 | Industries | Polygon | Name, type, size | S |
| 8 | Education institutions | Points | Type, class | S |
| 9 | Community facilities | Points | Name, type, area | S |
| 10 | Road network | Lines | Existing road, names, road class | S |
| 11 | Water supply network | Lines | Service area existing & future | S, A |
| 12 | Sewerage network | Lines | Service area existing & future | S, A |
| 13 | Electric power network | Lines | Service area existing & future | S, A |
| 14 | Priority areas | Polygons | Future development priority | A |
| 15 | Planned land uses | Polygons | Pre-determined allocations | A, D |
| 16 | Demography | Polygons | Demographic information | D, A |
| Sr.No. | Factor Name | Classes | Factor Type |
|---|---|---|---|
| 1 | Distance from Airport | 5 classes of 500 m | Proximity |
| 2 | Distance from existing City Limits | 5 classes of 500 m | Proximity |
| 3 | Distance from Community Facilities | 5 classes of 500 m | Proximity |
| 4 | Distance from Employment centres | 5 classes of 500 m | Proximity |
| 5 | Distance from Industrial Areas | 5 classes of 500 m | Proximity |
| 7 | Distance from Irrigation Network | 5 classes of 500 m | Proximity |
| 8 | Distance from Landfill Sites | 5 classes of 500 m | Proximity |
| 9 | Distance from commercial centres | 5 classes of 500 m | Proximity |
| 10 | Protected Sites | 2 classes | Proximity |
| 11 | Distance from Public Water and Sewer Services | 5 classes of 500 m | Proximity |
| 12 | Distance from Residential Areas | 5 classes of 500 m | Proximity |
| 13 | Priority areas for future development | 3 classes | Policy |
| 14 | Distance from Transport Network | 5 classes of 500 m | Proximity |
| 15 | Flood Prone Area | 3 classes of 2 km | Proximity |
| 16 | Land Agriculture Value | 2 classes | Policy |
| ArcGIS Spatial Analyst | QGIS Desktop | EasyUAZ | |
|---|---|---|---|
| Min | 269 | 285 | 187 |
| Q1 | 282 | 298 | 195 |
| Median | 290 | 312 | 205 |
| Q3 | 302 | 325 | 212 |
| Max | 350 | 392 | 239 |
| Mean | 297 | 320 | 207 |
| Range | 81 | 107 | 52 |
Publisher’s Note: MDPI stays neutral with regard to jurisdictional claims in published maps and institutional affiliations. |
© 2020 by the authors. Licensee MDPI, Basel, Switzerland. This article is an open access article distributed under the terms and conditions of the Creative Commons Attribution (CC BY) license (http://creativecommons.org/licenses/by/4.0/).
Share and Cite
Hussnain, M.Q.u.; Waheed, A.; Wakil, K.; Jabbar, J.A.; Pettit, C.J.; Tahir, A. Evaluating a Workflow Tool for Simplifying Scenario Planning with the Online WhatIf? Planning Support System. ISPRS Int. J. Geo-Inf. 2020, 9, 706. https://doi.org/10.3390/ijgi9120706
Hussnain MQu, Waheed A, Wakil K, Jabbar JA, Pettit CJ, Tahir A. Evaluating a Workflow Tool for Simplifying Scenario Planning with the Online WhatIf? Planning Support System. ISPRS International Journal of Geo-Information. 2020; 9(12):706. https://doi.org/10.3390/ijgi9120706
Chicago/Turabian StyleHussnain, Muhammad Qadeer ul, Abdul Waheed, Khydija Wakil, Junaid Abdul Jabbar, Christopher James Pettit, and Ali Tahir. 2020. "Evaluating a Workflow Tool for Simplifying Scenario Planning with the Online WhatIf? Planning Support System" ISPRS International Journal of Geo-Information 9, no. 12: 706. https://doi.org/10.3390/ijgi9120706