1. Introduction
Quality of life (QoL) is one of the most studied issues in the human, social and health sciences, and it has been widely argued that it is a complex and multidimensional concept which is difficult to define [
1,
2,
3]. The concept of QoL is variously used; to refer to prosperous societies, to the conditions of the environment in which people live, to people’s attributes, even to people feeling happy and being satisfied by life [
4,
5]. Since the conditions of the natural and living environment, the needs of the individuals in a society, as well as the importance of these needs are constantly changing over time, QoL assessment remains in the focus of research interest.
Many studies have reported the spatial aspect of QoL, underlying the importance of a “good place” as a place where people live a good life [
6,
7,
8]. Based on this aspect, the assessment of QoL is linked with the evaluation of the place. According to Murgaš and Klobučník [
9] (p. 225) “when trying to evaluate a place, we examine its quality, which can be measured by means of a wide scope of demographic, social, economic, and environmental indicators as well as according to the amenities that can be found there”. Several authors have developed methods to measure QoL and evaluate various geographic areas, throughout a range of factors and indicators [
8,
10,
11,
12,
13,
14,
15,
16,
17,
18].
The spatial aspect of QoL has been also receiving increased interest from governments and local authorities, which face difficult and complex decisions about how to make regions and cities better places to live. The improvement of QoL is often included in the policy agendas of decision makers and numerous studies have been carried out to asses QoL, by governments, as well as European and global organizations [
19,
20,
21,
22].
Due to the multidimensional nature of QoL, a number of conceptual and methodological issues have to be defined. The geographical scale is of great significance in a QoL study [
4,
23]. QoL can be measured on various scales, from the local to the global level. In area-based analyses these levels are defined in geographical terms and can vary from a block to a country, setting out specific spatial units. The larger the spatial unit of reference, the greater the potential ignorance of internal heterogeneity. For instance, the approach of the QoL at national level could hide local issues the population is confronted with. Hence, although QoL assessment at national or regional level is an important pointer to detailed investigation, policy decision making targeting to enhance QoL of individuals is more likely to be based on a local scale analysis [
4]. Furthermore, geographical scale defines the indicators that measure QoL. Indicators used to assess QoL at small spatial scale of analysis are usually not reliable at larger scales, or the opposite; e.g., Gross Domestic Product (GDP) is illustrative at the national scale, but the same indicator is not of value at a local scale.
A further matter of interest in QoL research is the level of specificity that QoL is approached. This refers to the domains of overall QoL that are specified in each research in order to define the concept of QoL under study. By examining the place where people live, each domain is related to specific attributes of the environment, such as the characteristics of the social environment, the physical environment, housing conditions etc. [
13,
14,
24]. The assessment of QoL aims to evaluate these characteristics by using relevant indicators, and even constructing composite indexes [
22]. In this way different indicators are integrated and linked together in order to evaluate each domain and as a consequence QoL.
Another fundamental concern in the assessment of QoL is related to the concept of QoL and whether it is defined in subjective or objective terms. Subjective aspect refers to the sense of well-being and the perception of life satisfaction by individuals [
25]. Regarding the quality of a place, studies based on this aspect use subjective indicators of how people perceive and evaluate the conditions around them. On the other hand, these conditions can be assessed in an objective way, independently of the individuals’ opinion, by using objective indicators (census data, secondary data on statistics, geospatial data, etc.) that describe the environment in which individuals live [
26]. However, there is no conclusive evidence that the first type of indicators is more reliable than the second one, or the opposite, and some researchers advocate for employing both of them [
4,
19].
This study aims to develop a methodology for evaluating and mapping QoL at local level. The methodology focuses on zoning local administrative units (LAU) according to the level of QoL they provide as residence areas. LAU level is a subdivision of the NUTS 3 (Nomenclature of territorial units for statistics, level 3) regions, consisting of municipalities or equivalent units [
27]. LAUs meet the needs of analysis at local level and as administrative units allow policy implementation capacity.
The case study area is the Municipality of Katerini, Greece. In Greece, research on QoL is limited to health-related issues and there are very few studies that evaluate the place and the QoL it provides [
28]. In this study, an integrated methodology was developed in order to map the characteristics and the conditions of the living environment that reflect the well-being of individuals. The methodology was based on geographic information systems (GIS) by using objective indicators (statistical variables and spatial indexes), weighted by the subjective importance of each one, according to the preferences of the study area’s residents.
QoL mapping is a powerful tool for supporting decision making by identifying factors on which action must be taken to improve QoL. GIS can contribute to the assessment of QoL as it allows the connection of statistical variables with spatial data, provides specialized spatial analysis functions and conduces to mapping and creating of data visualizations [
29]. The role of GIS in QoL research is also noticed in many studies [
16,
30,
31,
32,
33,
34,
35,
36,
37,
38].
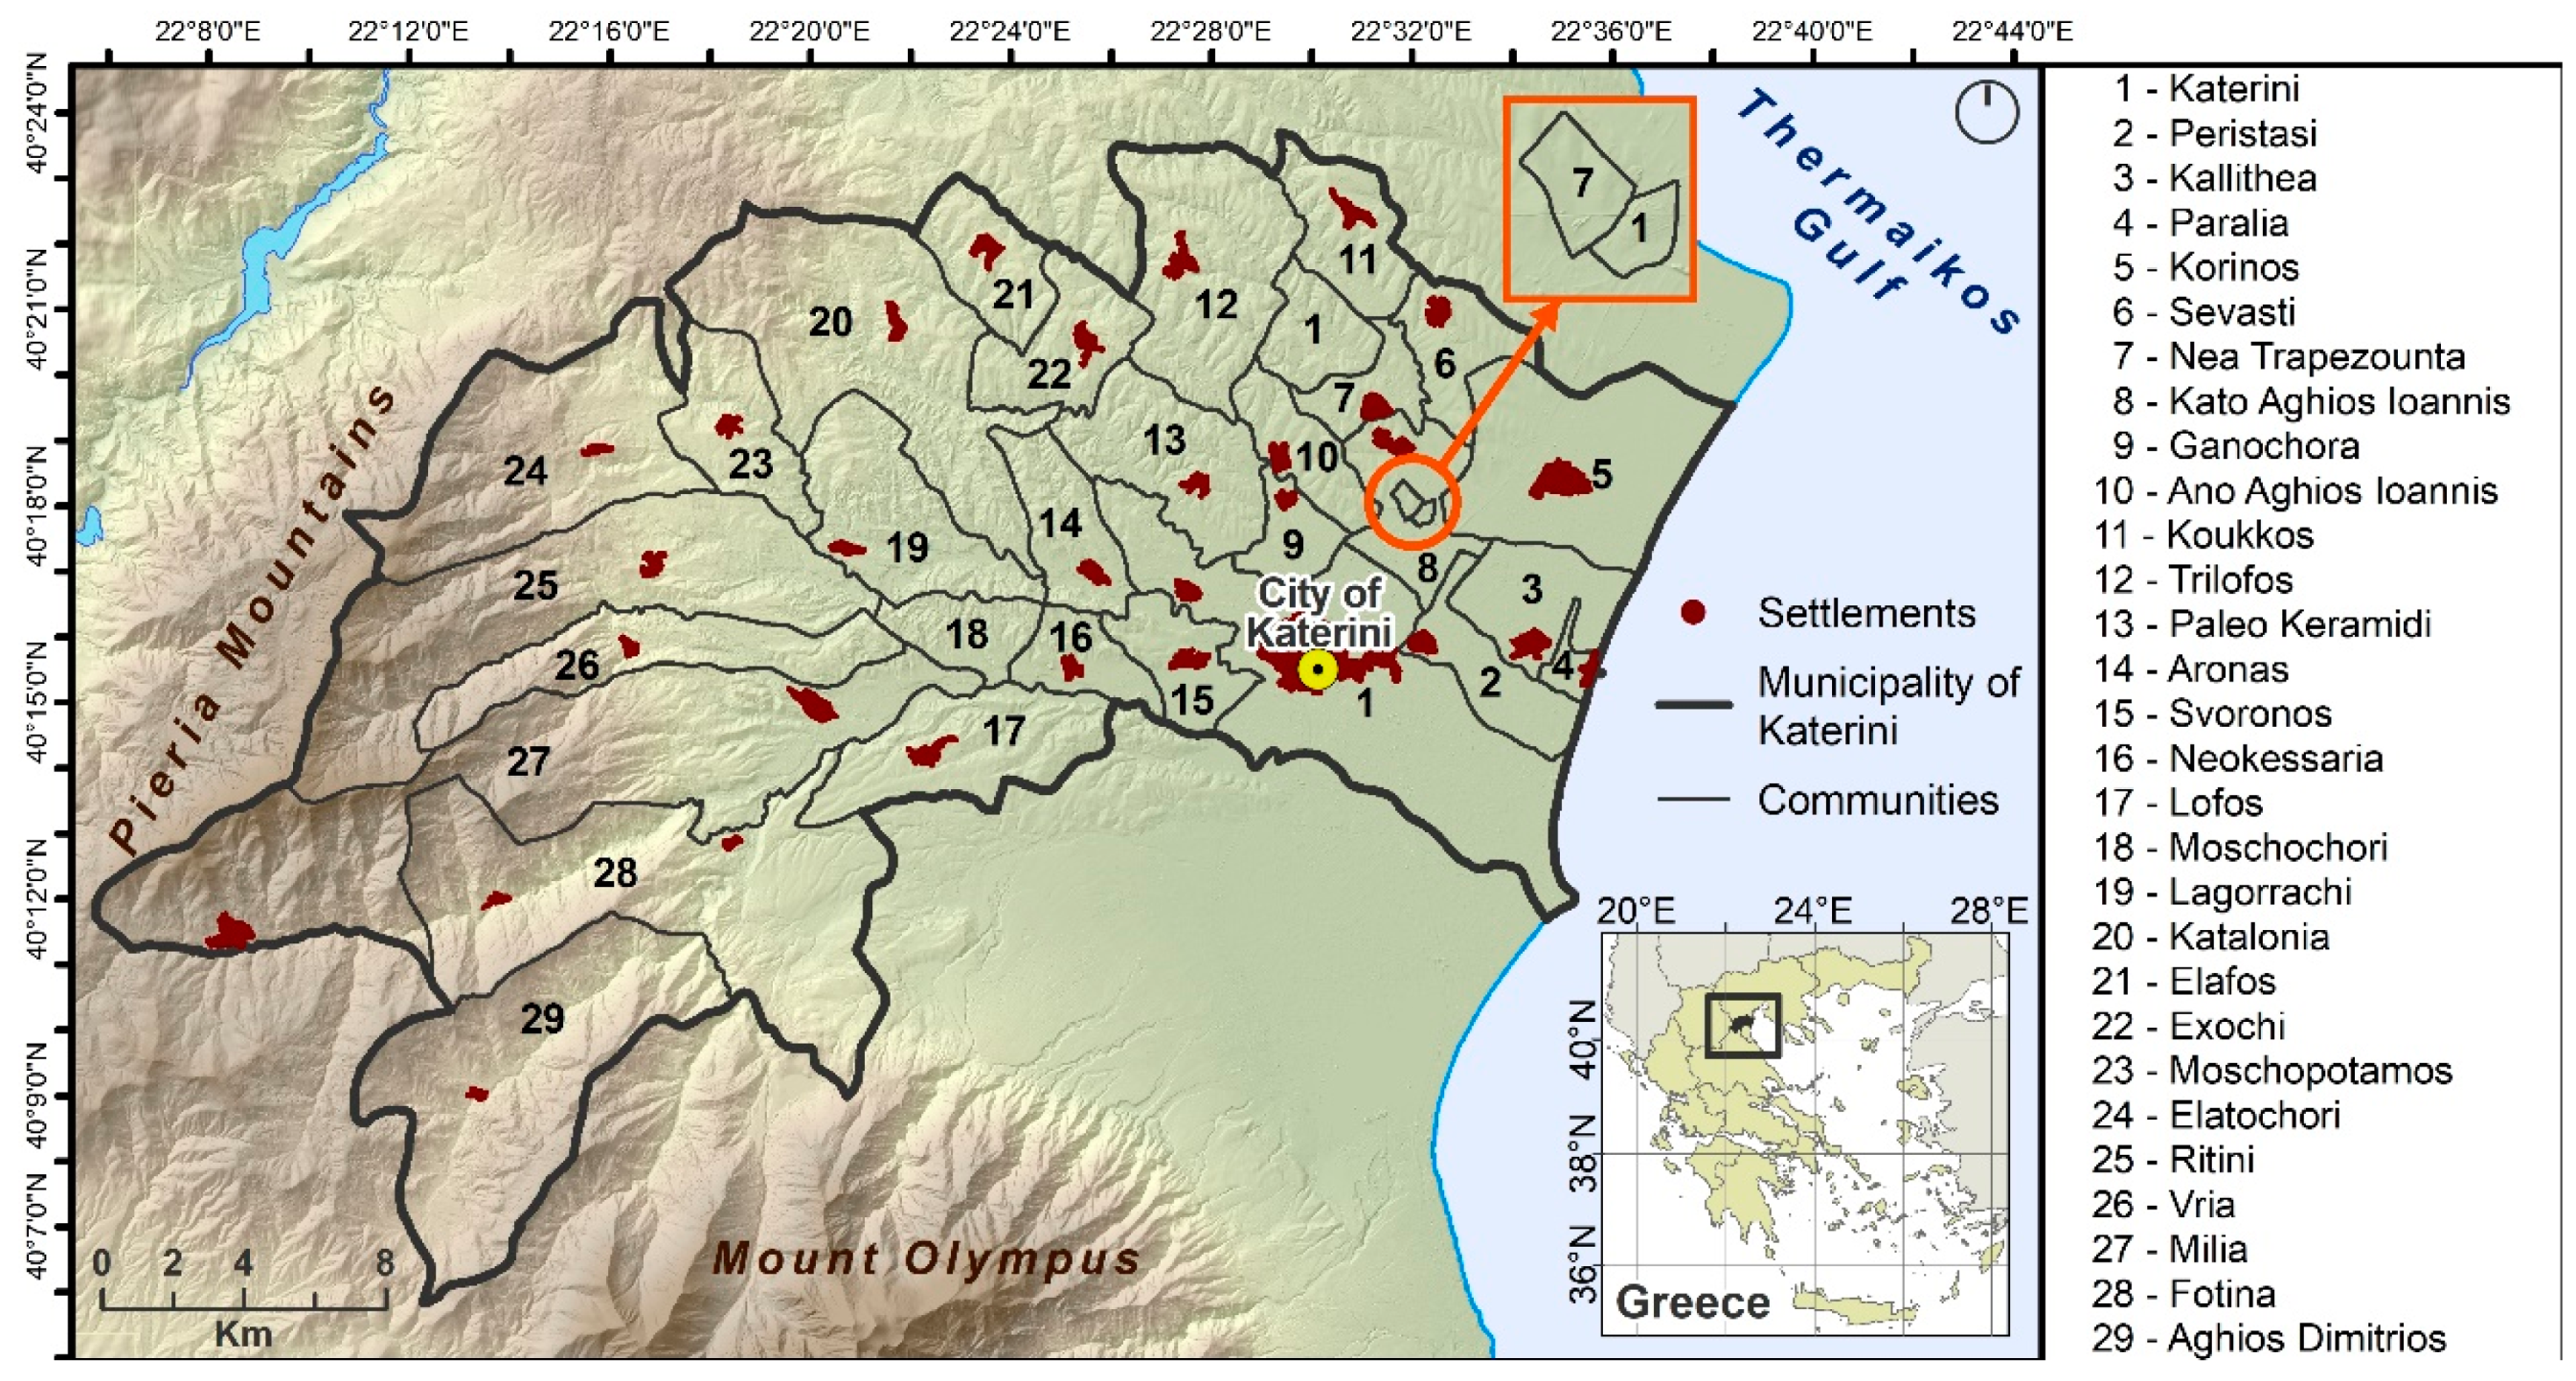
2. Study Area
The Municipality of Katerini is one of the three municipalities of the Pieria Regional Unit (Region of Central Macedonia), and is approximately 55 km south-west of Thessaloniki city. It has permanent population of 85,851 habitants (Statistical Authority of Greece, 2011) and covers an area of 684 km
2 among Pieria Mountains, Mount Olympus and Thermaikos Gulf (
Figure 1).
The Municipality of Katerini is divided into 29 local and municipal communities (LAUs). The community of Katerini is the most populated community and according to the latest census (2011) it had 58,309 inhabitants, corresponding to 69% of the total population of the municipality (
Table 1). The city of Katerini in this community is the largest urban center of the municipality and the capital of Pieria Regional Unit. The settlement of Peristasi, in the homonymous community, is an extension of the urban fabric of Katerini city. Consequently, these two communities concentrate the largest urban areas in the municipality, whereas the rest communities are mostly characterized by rural areas.
The coastal site of the municipality is a tourist pole due to the proximity to long sandy beaches, to several archaeological sites throughout the region (the ancient city of Dion, the Castle of Platamon etc.), as well as to Mount Olympus. The community of Paralia, which is the smallest community with just 2 km2 area, is a popular tourist destination and its population is highly increased in summer time due to massive arrival of tourists. On the other hand, large areas of the western communities are mountainous, particularly inaccessible, with intense slopes and dense forest vegetation.
In general, the Municipality of Katerini is characterized by heterogeneity, constituting a typical provincial municipality in Greece. The large mountain ranges, the plains, the long beaches, the tourist coastal zone, the rural hinterland, the traditional settlements and the large urban center where all the public services are concentrated, are some of these heterogeneous characteristics. Therefore, the communities with these completely different characteristics are of particular interest in the assessment of the QoL they provide as residential areas.
3. Materials and Methods
3.1. Methods
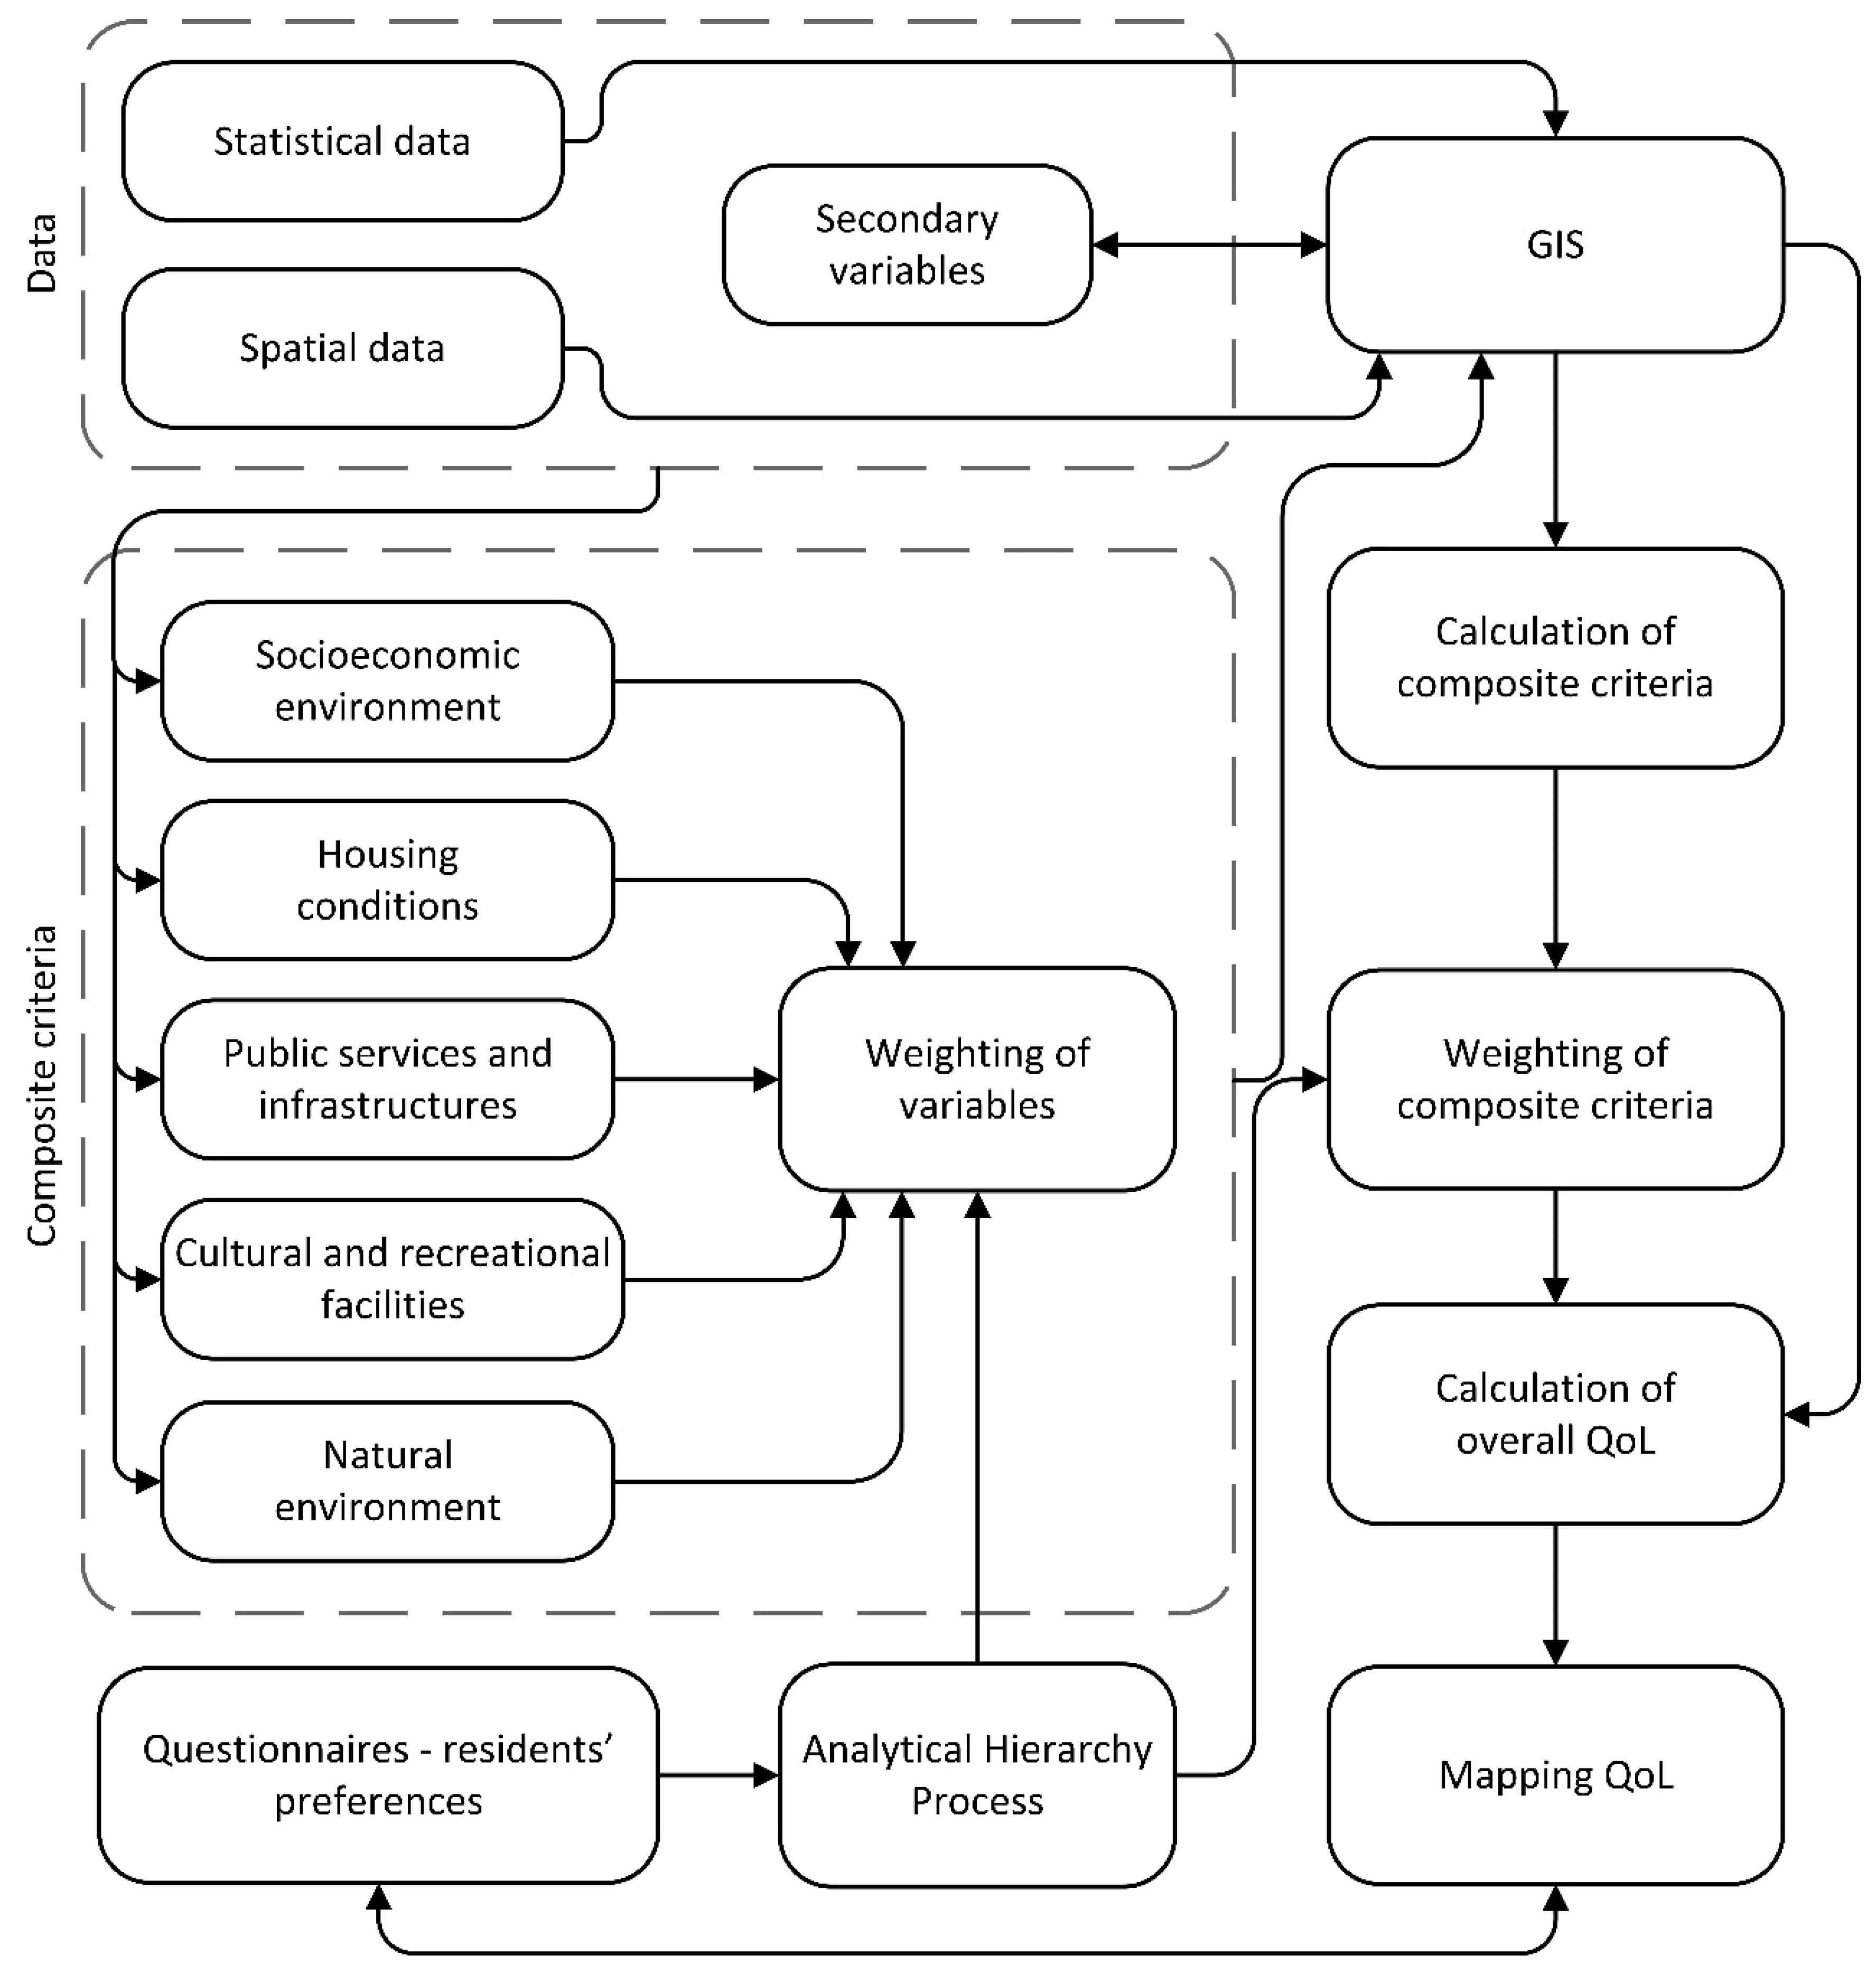
The proposed methodology used a set of statistical and spatial data and fundamental GIS functions to assess and map QoL (
Figure 2). Each domain of QoL was evaluated by a composite criterion and each criterion was estimated by a set of weighted variables. The weights of criteria and variables were based on the preferences of the study area’s residents and the analytical hierarchy process (AHP) [
39].
3.1.1. Composite Criteria and Data
Although the range of the domains and the indicators of QoL vary, some of them recur in a number of studies, such as the social environment, the housing conditions, the public services and infrastructures, the cultural and recreational facilities, and the natural environment [
3,
31,
40,
41]. In this study, these five domains constitute the QoL criteria. Each criterion is composed by a number of factors that evaluate the specific domain of QoL (
Table 2).
The socioeconomic environment refers to the composition of the population, in terms of age, social position, economic level, etc. It is usually described by aggregate individual-level data, such as unemployment, income and educational attainment. The indicators that were selected to assess the social environment (percentage of unemployment, percentage of higher educated population (International Standard Classification of Education—ISCED Levels 5 and 6, according to UNESCO’s classification standard for educational level [
42]) were based on 2011 census’ data of the Statistical Authority of Greece. Due to lack of income data at the specific geographical level of analysis, percentage of employed population in the upper (International Standard Classification of Occupations (ISCO)-08 Major Groups 1 and 2, an International Labor Office’s tool for organizing jobs into a clearly defined set of groups according to the tasks and duties undertaken in the job [
43]) and lowest (ISCO-08 Major Groups 8 and 9) occupational groups were used as proxy of the economic level.
Economic level is a key component of individual well-being. Difficulties in satisfying basic needs and making ends meet, material deprivation etc., have a strong impact on QoL [
5]. Education is also linked to QoL, as higher education leads to higher earnings and greater employability, affecting the material living conditions of individuals [
44]. According to the Third European QoL survey [
45], low income, being in a non-professional or non-managerial occupational group, and low educational attainment were associated with increased material deprivation.
Housing environment and structural conditions affect everyday life. The housing conditions can be measured with indicators of insufficient housing space or indicators that assess the building’s quality, amenities etc. [
13,
19,
41]. In this study, the criterion of housing conditions is composed of variables related to the percentage of households without basic facilities (heating, water closet, bathroom, kitchen), households in detached houses, in newly built units (during the last decade) and housing space (m
2) per person, obtained from the 2011 census’ database of the Statistical Authority of Greece.
The importance of the accessibility to public services and facilities in QoL has been noticed in many studies [
18,
19,
46,
47]. Limited access to essential facilities and public services impacts residents’ overall life, including health, economic prosperity, sense of security and the general well-being of the community [
30]. The criterion of public services and facilities is evaluated by the variables of accessibility, in terms of proximity (minutes to access), to hospitals, secondary schools, sport facilities and urban amenities, and the index of internet network density (Km-length of network per Km
2-area). The accessibility indicators were produced through GIS spatial analysis functions using the corresponding spatial layers of points of interest, the road network and the topography of the study area. Topography was represented by a 5 × 5 m resolution digital elevation model (DEM) obtained from the Hellenic Cadastre. Internet network (year 2014) was obtained from the Geographic Broadband System of the Hellenic Telecommunications and Post Commission (
http://mapsrv1.terra.gr/eettutilities/mapnew.aspx), as polyline spatial layer, whereas all other services and facilities were recorded with the use of Global Positioning System (GPS) as points or polygons (
Figure 3a) during the field research in the study area, which conducted in 2014.
Recreational and cultural facilities, as meeting-places where social relationships can be formed and maintained, are beneficial to residents’ well-being [
48,
49]. On the other hand, archaeological monuments, traditional settlements and other sites of cultural and natural heritage contribute to the promotion of an attractive “image” of the region, leading to the tourist development and economic growth [
50]. The access to cultural and recreational facilities was also evaluated by proximity indicators at respective points of interest recorded during the field research in the study area. Points of interest included places of recreational and leisure activities, cultural sites such as archaeological sites and monuments, and the coastline which also concentrate places for recreation and entertainment, as pole of tourism (
Figure 3b).
The last criterion is related to the natural environment, which has a strong impact on people’s QoL, affecting both their physical and mental health. Air and noise pollution, adverse climate conditions etc. have negative effects on people’s health [
51,
52], while natural landscape, such as forestlands, play an important role in relaxation and stress decrease [
53]. In this study, the criterion of natural environment is evaluated by the percentage of urban areas and forestlands, based on land cover polygon layers for the reference year 2016 (
Figure 3c), obtained from Payment and Control Agency for Guidance and Guarantee Community Aid (OPEKEPE).
3.1.2. Analytical Hierarchy Process
All factors and criteria were weighted by their subjective importance, according to the preferences of the study area’s residents, applying the AHP [
39]. AHP is an effective tool for dealing with multi-criteria decision making, by generating a weight for each component (criterion/variable) of the decision problem, according to their relative importance. This method conducts pairwise comparisons between the components and develops a preference scale among them based on experts’ or stakeholders’ estimates.
Other methods, such as multicriteria analysis, are also effective to address hierarchy of a decision-problem’s components and offer advantages of combining qualitative and quantitative analysis, as well. However, in this study, the relative importance of each factor and criterion was based on the residents’ preferences, asking them to complete a questionnaire. As a result, the weighting procedure should be decoded into simple questions and the simplicity of pairwise comparisons, easy to understand even from not experts, offered this advantage over other methods.
Data about the residents’ preferences gathered using questionnaires to 205 residents of Katerini municipality. The sample covered all the settlements of the study area, and the questionnaires distribution was based on the communities’ population density. A multistage random spatial sampling procedure was used to select the respondents for the questionnaires. In the first stage, the residential areas were divided into 500 m × 500 m grid cells and randomly cells were selected. The procedure was repeated by dividing the selected grid cells into 250 m × 250 m sub-grids. The building polygons were overlaid to the final selected cells and simple random sampling was applied to choose the residence to visit. The questionnaire contained closed-ended question regarding the classification of QoL criteria and the factors valuing them. The importance that residents attributed to each factor and each criterion contributed to their weighting process. The AHP was implemented in three stages; pairwise comparisons of the factors per criterion/criteria, calculation of factors’/criteria weights, check of the comparisons’ consistency.
The residents rated the factors of each criterion, according to their preference of the one it contributes most to their QoL to the one that contributes less. Afterwards, factors of each criterion were pairwise compared, based on the arithmetic scores per variable and Saaty’s scale of relative importance [
39]. This scale determines the degree of importance of an alternative over another, attributing values from 1 to 9 (1 = equal importance to 9 = absolute importance). To perform pairwise comparisons a cross-matrix with the factors for each criterion was created and filled according to the importance values. Next, each value in the matrix was divided by the sum of its column, normalizing the comparison matrix. The mean of each row of this matrix corresponded to the weight of the factor the row represented. The pairwise comparisons procedure was repeated to weight each criterion, based on the residents’ preference, as well. Finally, the consistency of comparisons was estimated, using consistency ratio CR. CR is calculated by dividing the consistency index (
CI) for the set of comparisons by the random index (RI).
CI is defined as follows:
where:
CI = consistency index
λmax = maximum eigenvalue of the matrix
n = number of variables
For each matrix of size
n, Saaty generated random matrices and computed their mean
CI value, corresponding to RI (
Table 3).
Saaty suggests that if CR’s value is smaller or equal to 0.1 the set of comparisons are consistent and acceptable, whereas if CR exceeds 0.1 the set of comparisons should be revised [
39].
3.2. GIS Modeling
All datasets, including the series of statistical data tables and the spatial layers, were stored in a common geodatabase in GIS environment. A series of GIS-supported procedures were implemented to geocode and aggregate all data in the corresponding spatial units (communities), as well as to produce secondary variables of accessibility to the QoL-related points of interest and calculate the internet network density, percentage of urban cover and forestlands.
Specifically, a unique code was attributed to each spatial unit and the same code was assigned to the corresponding values of the variables of the socioeconomic environment and the housing conditions in the statistical tables. Based on this unique code, the data tables were joined to the communities’ spatial layer. As a result, each variable’s value was attributed to the corresponding community.
To evaluate accessibility to hospitals, schools, sport facilities, urban amenities, leisure facilities, cultural facilities and the coastline, the average time access to the respective points was calculated for each community, performing a cost distance analysis. The cost distance algorithm used [
54], calculates for each point-location of the study area the least accumulative cost, in this case time cost, to specified points of interest, over a cost surface. A cost surface identifies the cost of traveling through space and it is created from the combination of factors contributing to the time travel. In this study, cost surface was defined by two factors; (a) travel speed on-road and off-road, to cover the entire area of each community, and (b) slope, which affects speed on any surface.
Travel speed was determined by the mean of transport and the category of the road network. Traveling on-road, according to the speed a vehicle travel in each category of road network (maximum speed limits according to the road traffic code), and off-road, based on the mean speed of a pedestrian. Slope was used to define the deceleration in travel speed. The slope surface, created from the DEM, was categorized into five classes, from smooth slopes to intense slopes, determining the travel speed deceleration.
Combining the raster layers of travel speed through space and speed deceleration, the cost surface defining the final time of traveling through the study area was created. The cost distance tool was implemented for each spatial layer (dataset) of points/areas of interest, creating the corresponding accumulative time-cost distance surfaces. Finally, the mean access time (in minutes) to each spatial layer of public services and infrastructures, as well as of cultural and recreational facilities, was calculated for every community.
Regarding the variables of the last criterion, the urban areas and forestlands (polygon spatial layers) were cartographically overlaid on the communities’ layer. Based on the polygons’ geometry, the total urban cover area and forestlands area were computed (Km2) for each community, enabling the calculation of the corresponding percentages. In a same way, the internet network density (Km/Km2) was estimated, by computing the length of internet network (Km) per community and the community’s area (Km2).
Completing the calculation of all variables, their values were reclassified to a common ordinal scale of five categories, according to which QoL ranks from the very low (Category 1) to the very high level (Category 5). The variables’ values limits for each category were defined by the natural breaks method [
55]. This method is designed to create distinct categories with internal consistency and it is widely used in both cartography and social analyses [
56]. The natural breaks method forms classes by minimizing the intra-class variance and maximizing the variance among the means of classes. In this way, spatial units are clustered into similarly-valued groups.
Afterwards, each classified variable was weighed according to the weights resulted from the AHP, in order to compute the composite criteria. Particularly, each composite criterion was defined by the weighted sum of the variables that compose it:
where:
Ci = composite criterion
n = number of variables
wi = weight
Ri = variable
Finally, each criterion was weighed based on the AHP results, in order to compute overall
QoL defined by the weighted sum of the composite criteria:
where:
QoL = overall quality of life
n = number of criteria
wi = weight
Ci = composite criterion
All criteria and overall QoL were mapped and a series of choropleth maps was created that illustrates QoL levels among the communities of Katerini Municipality. The geodatabase, spatial functions and mapping were performed using the ArcGIS version 10.2 (ESRI Inc., Redlands, CA, USA) software.
4. Results
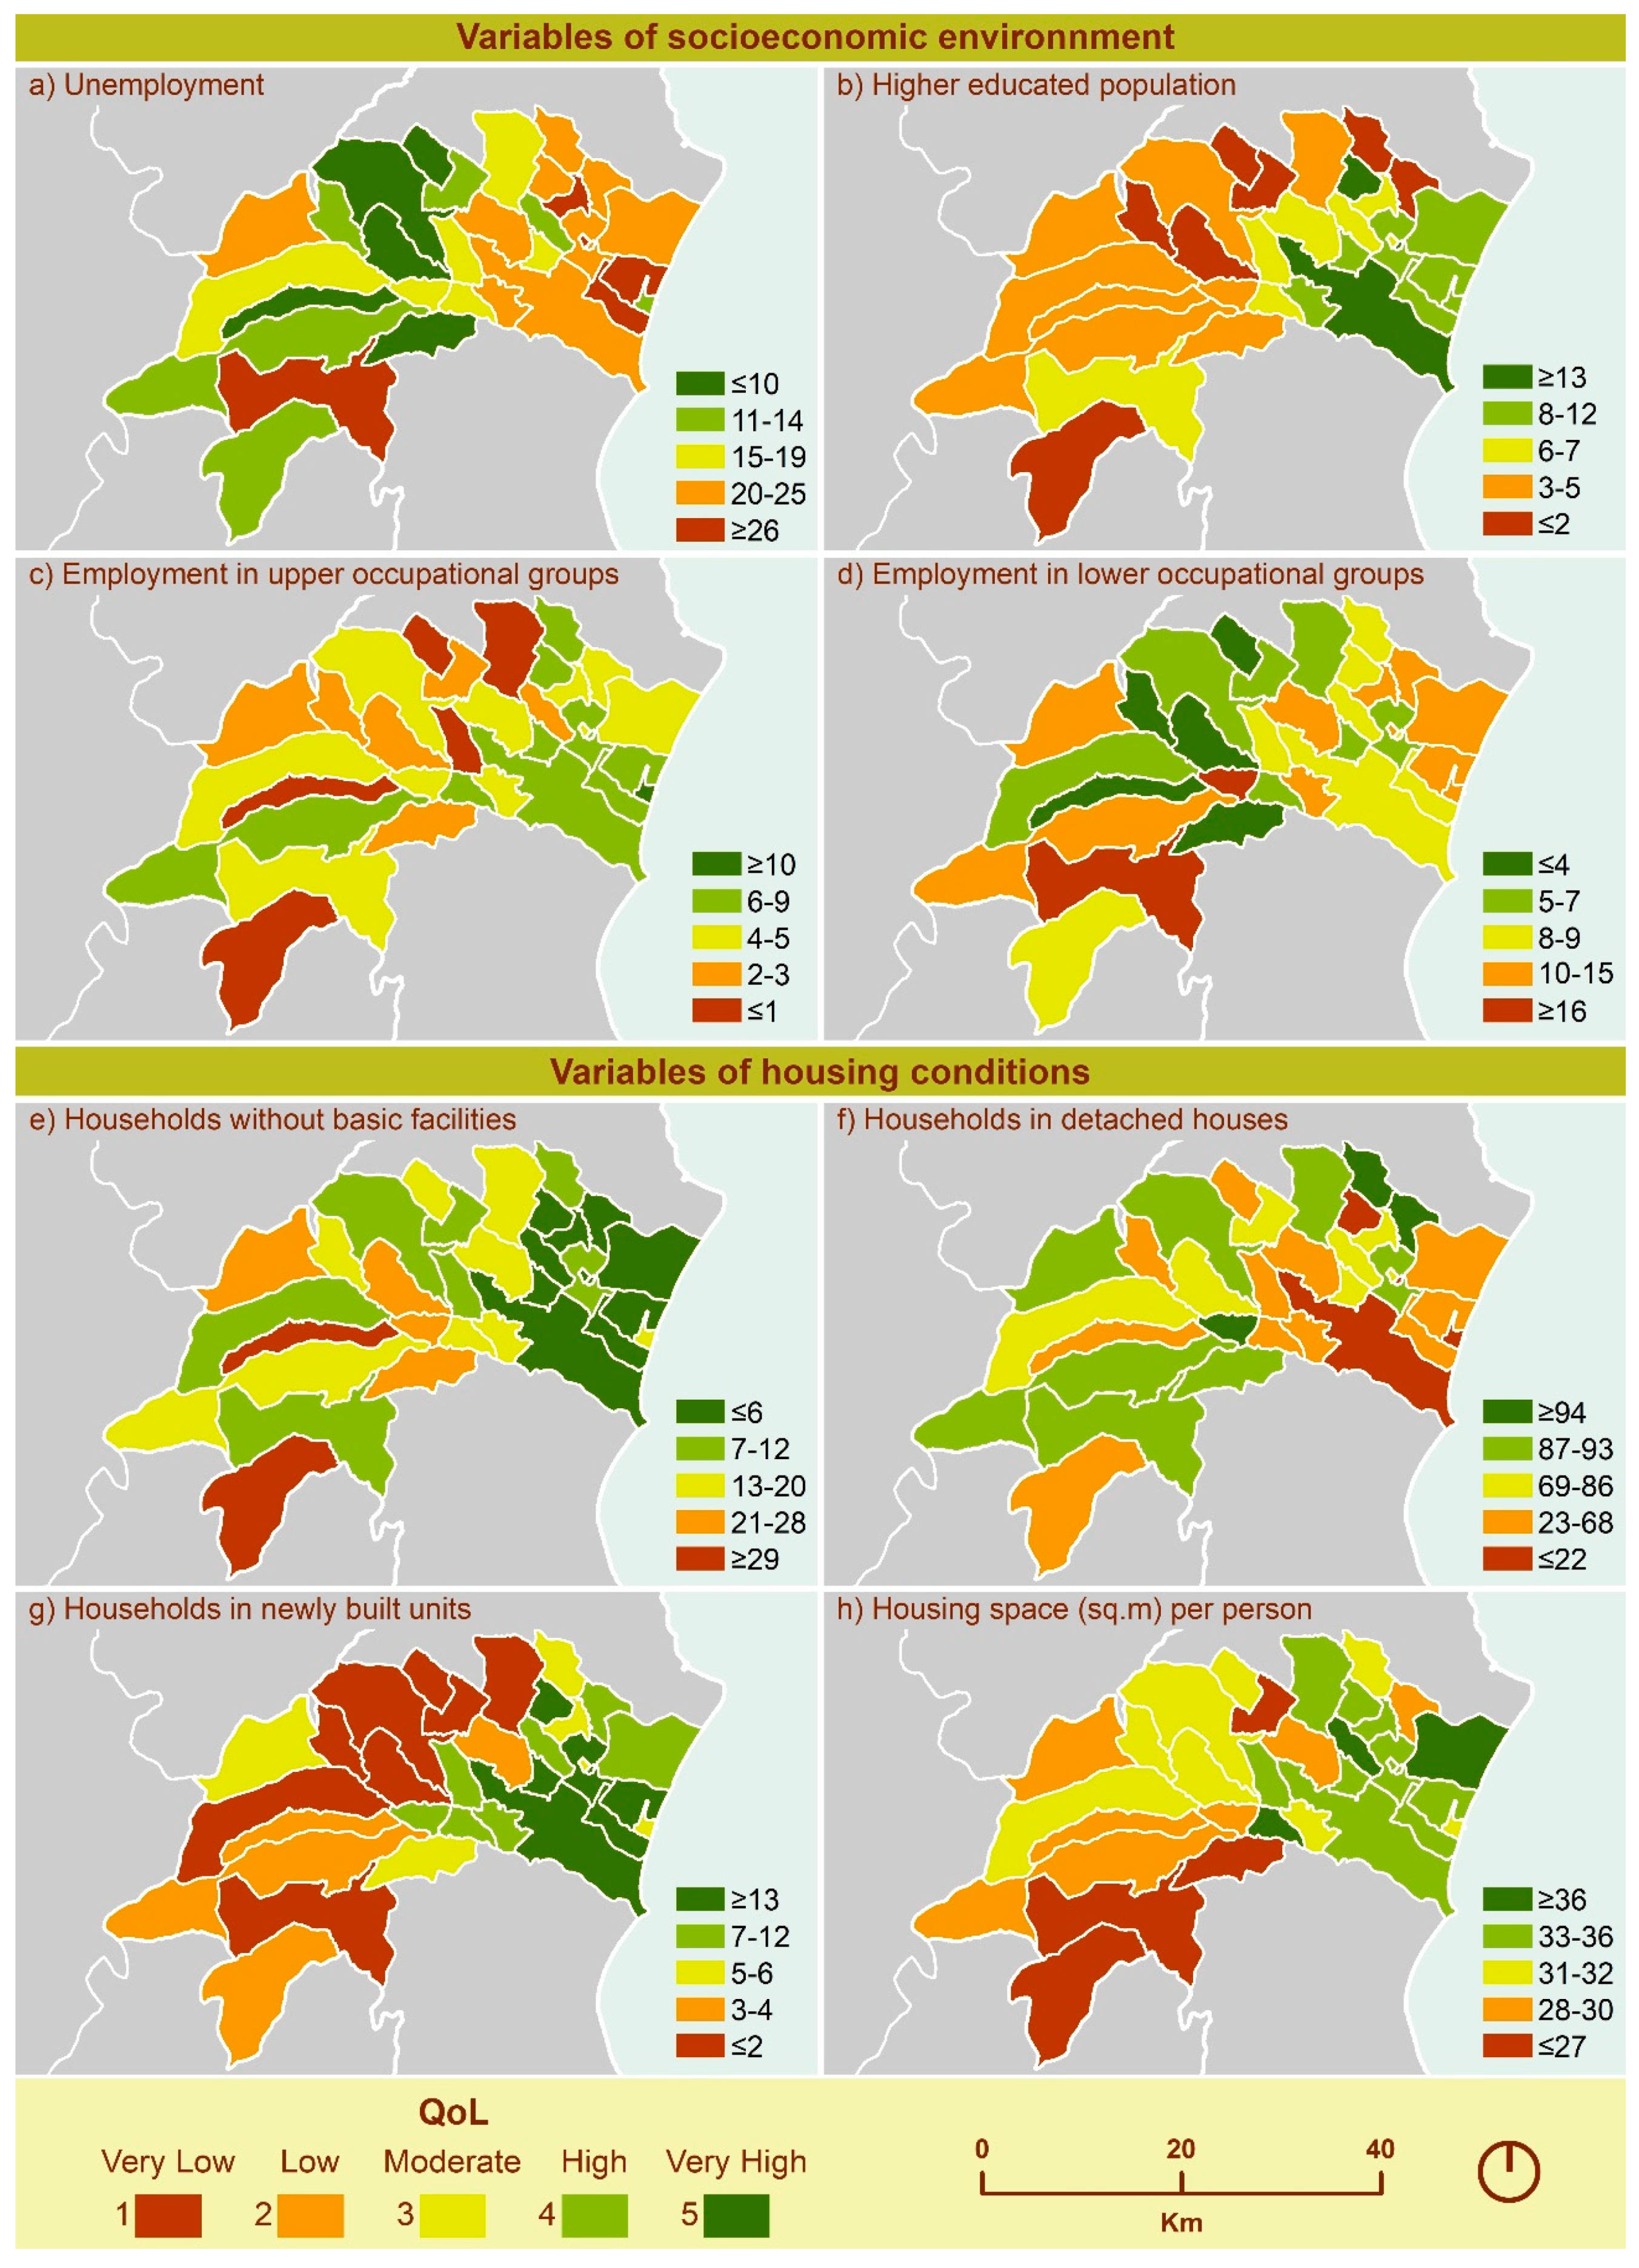
The variables’ values categorization to five classes and the corresponding categorization of Katerini municipality’s communities is demonstrated in
Figure 4 and
Figure 5. The urban and coastal communities had higher rates than most of the rural and mountainous communities, in all socioeconomic variables (
Figure 4a–d), as well as in the variables of households in newly built units and housing space (
Figure 4g,h). On the other hand, higher rates of households without basic facilities and households in detached houses were revealed in most of the western mountainous communities (
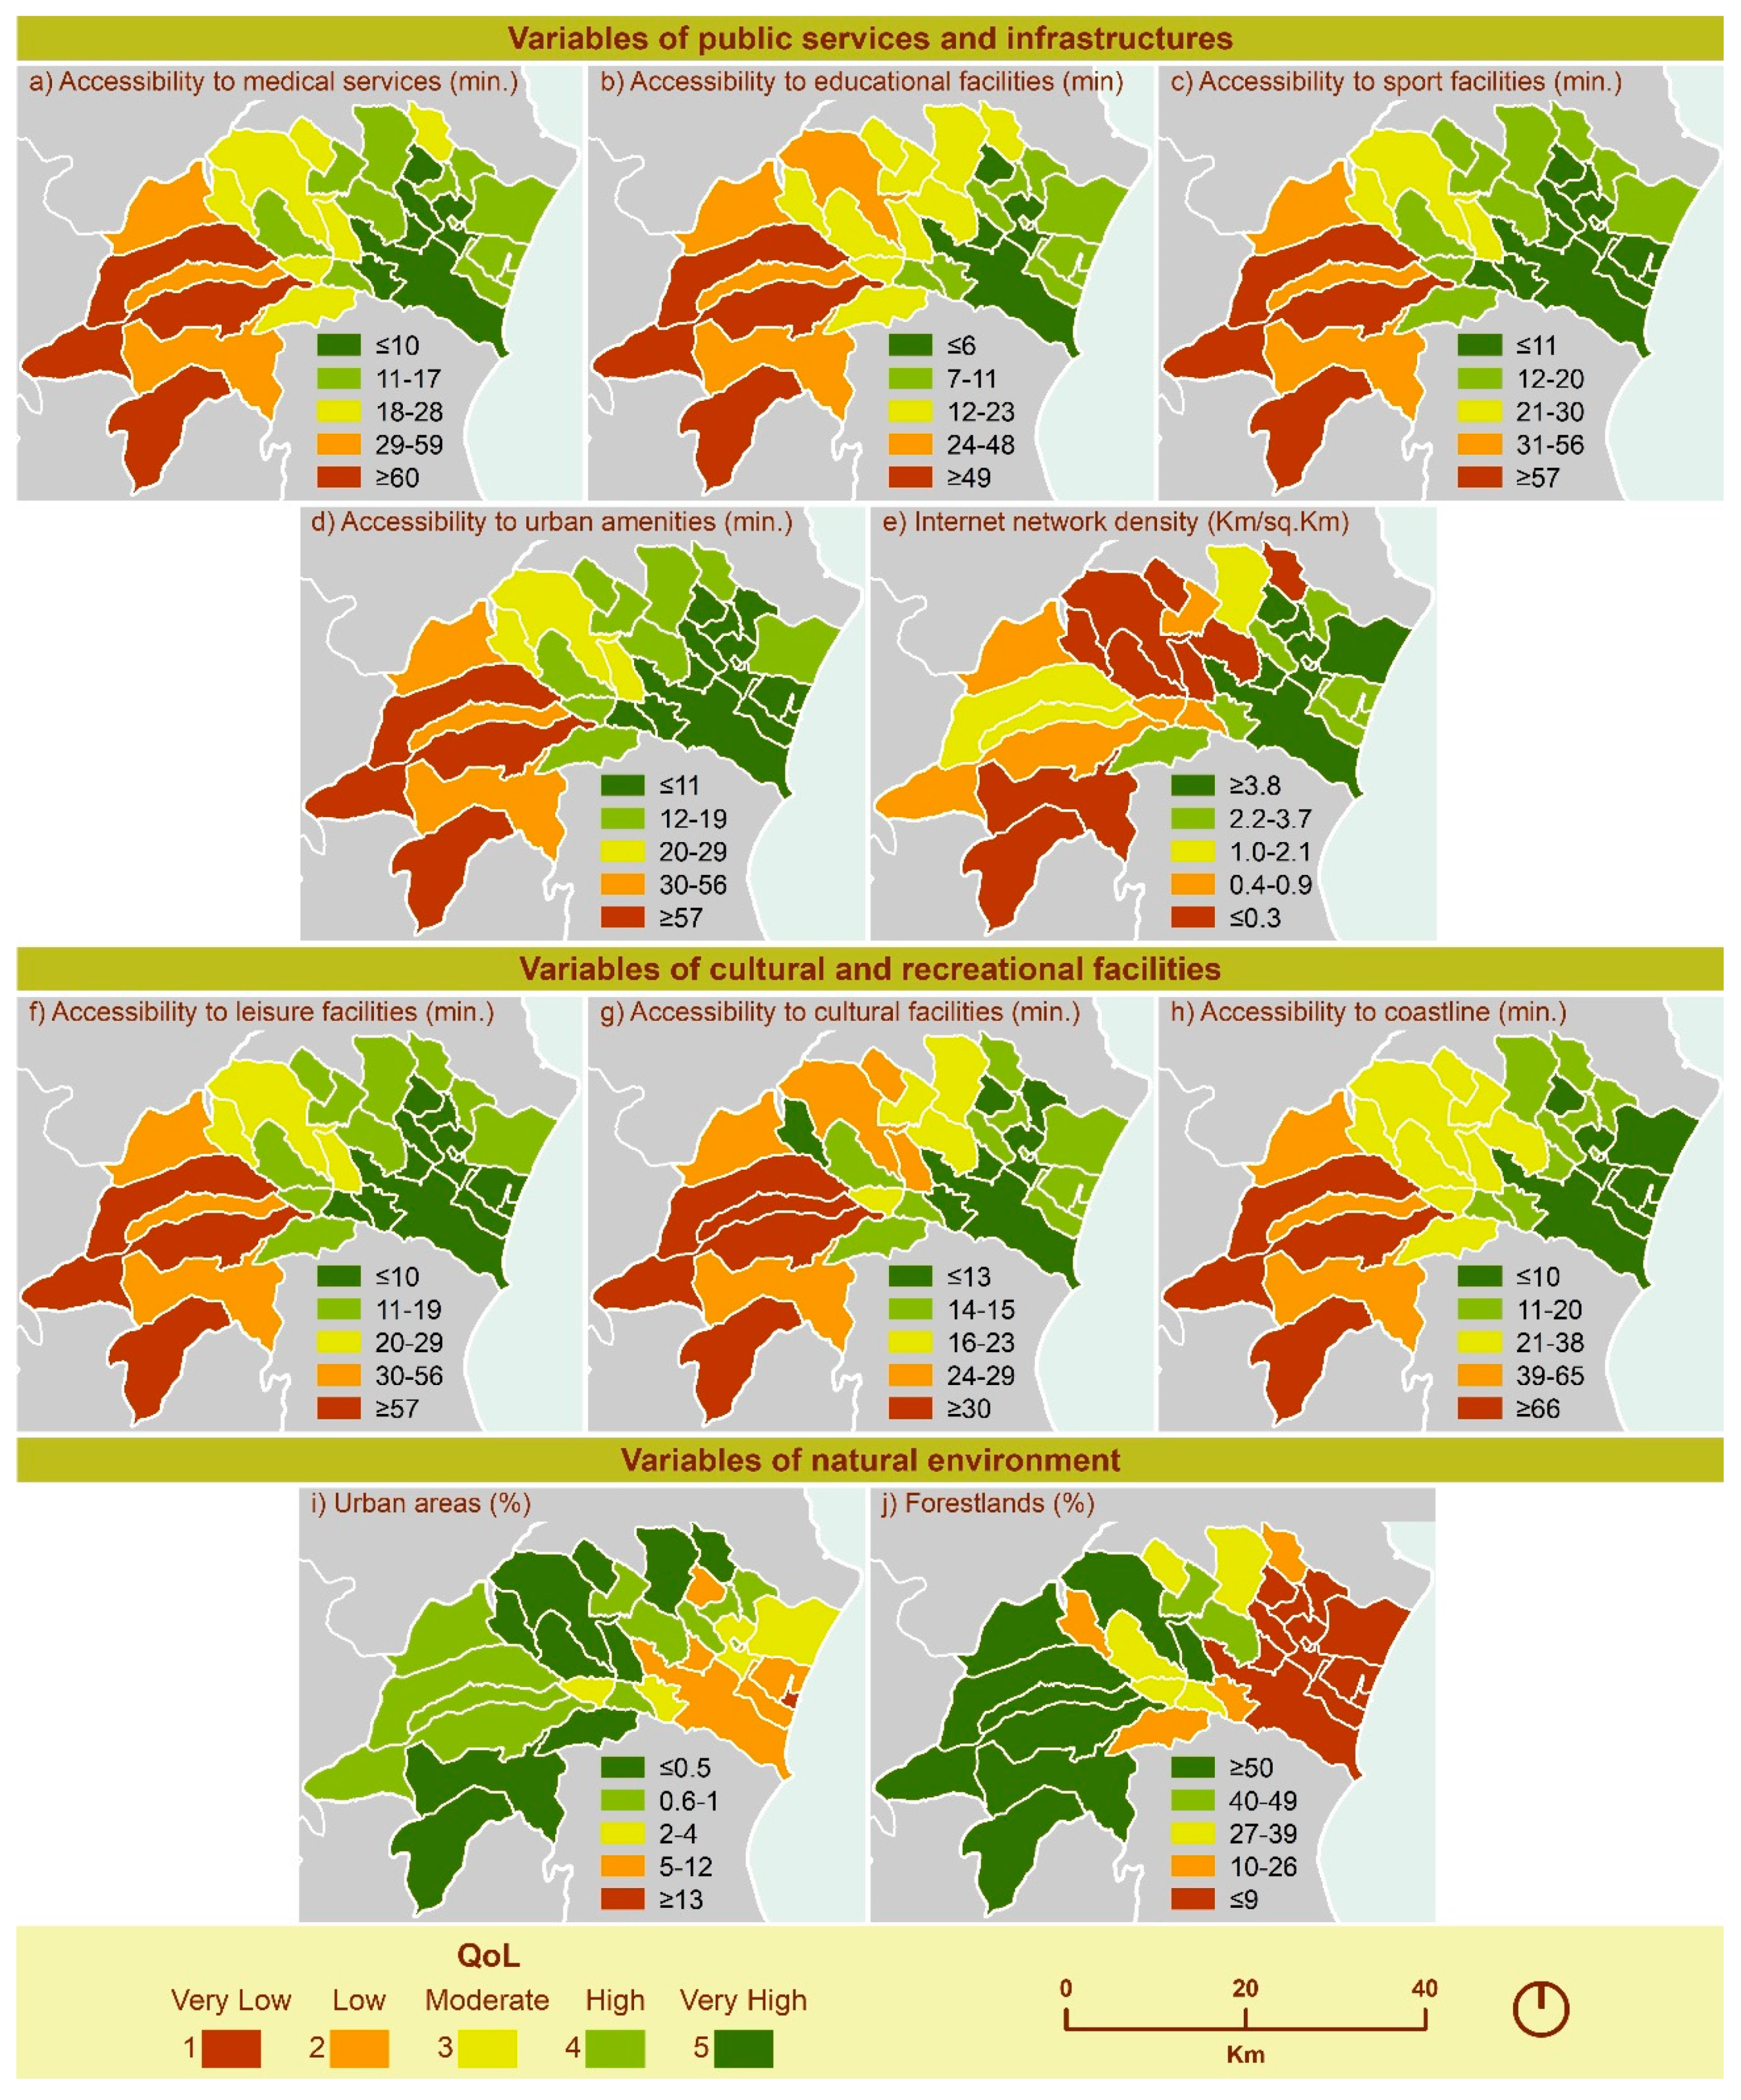
Figure 4e,f). The mean time to access public services and infrastructures, and cultural and recreational facilities, is also higher in the western communities (
Figure 5a–d,f–h), taking up even more than an hour to access the corresponding points of interest. The highest density of internet network was revealed in the eastern communities, contrary to the western and northern ones (
Figure 5e). Finally, regarding the natural environment, the urban areas were more extensive in the coastal zone (
Figure 5i), whereas higher percentages of forestlands were noticed in the hinterlands (
Figure 5j).
The majority of the respondents of the questionnaires was more interested in the housing conditions and in public services and infrastructures, especially in the basic facilities of the house and the accessibility to medical services. They also attributed great importance to the proximity to leisure facilities. However, the cultural and recreational facilities, as well as the socioeconomic status of their residence area, were not of great importance compared to other criteria. The results of AHP, based on the preferences of the respondents, are summarized in
Table 4. In the criterion of socioeconomic environment, employed population in the upper occupational groups was revealed as the most important variable (0.39). For the evaluation of the criterion of housing conditions, the highest weight was attributed to basic facilities (0.48), while housing space was the least important factor (0.09). Very low weight was also attributed to sport facilities accessibility (0.05), in the criterion of public services and infrastructures. On the other hand, accessibility to medical services was a very important factor (0.48) for the residents of the study area. Regarding the cultural and recreational facilities, the residents attributed higher relative importance to leisure facilities (0.59). In the last criterion of natural environment, residents believe that the negative contribution of the urban areas in QoL is of greater significance compared with the positive contribution of the forestlands (0.33). With regard to the final criteria weighting, the criterion of housing conditions scored the highest weight (0.32), whereas the lowest weight was attributed to the socioeconomic environment (0.11).
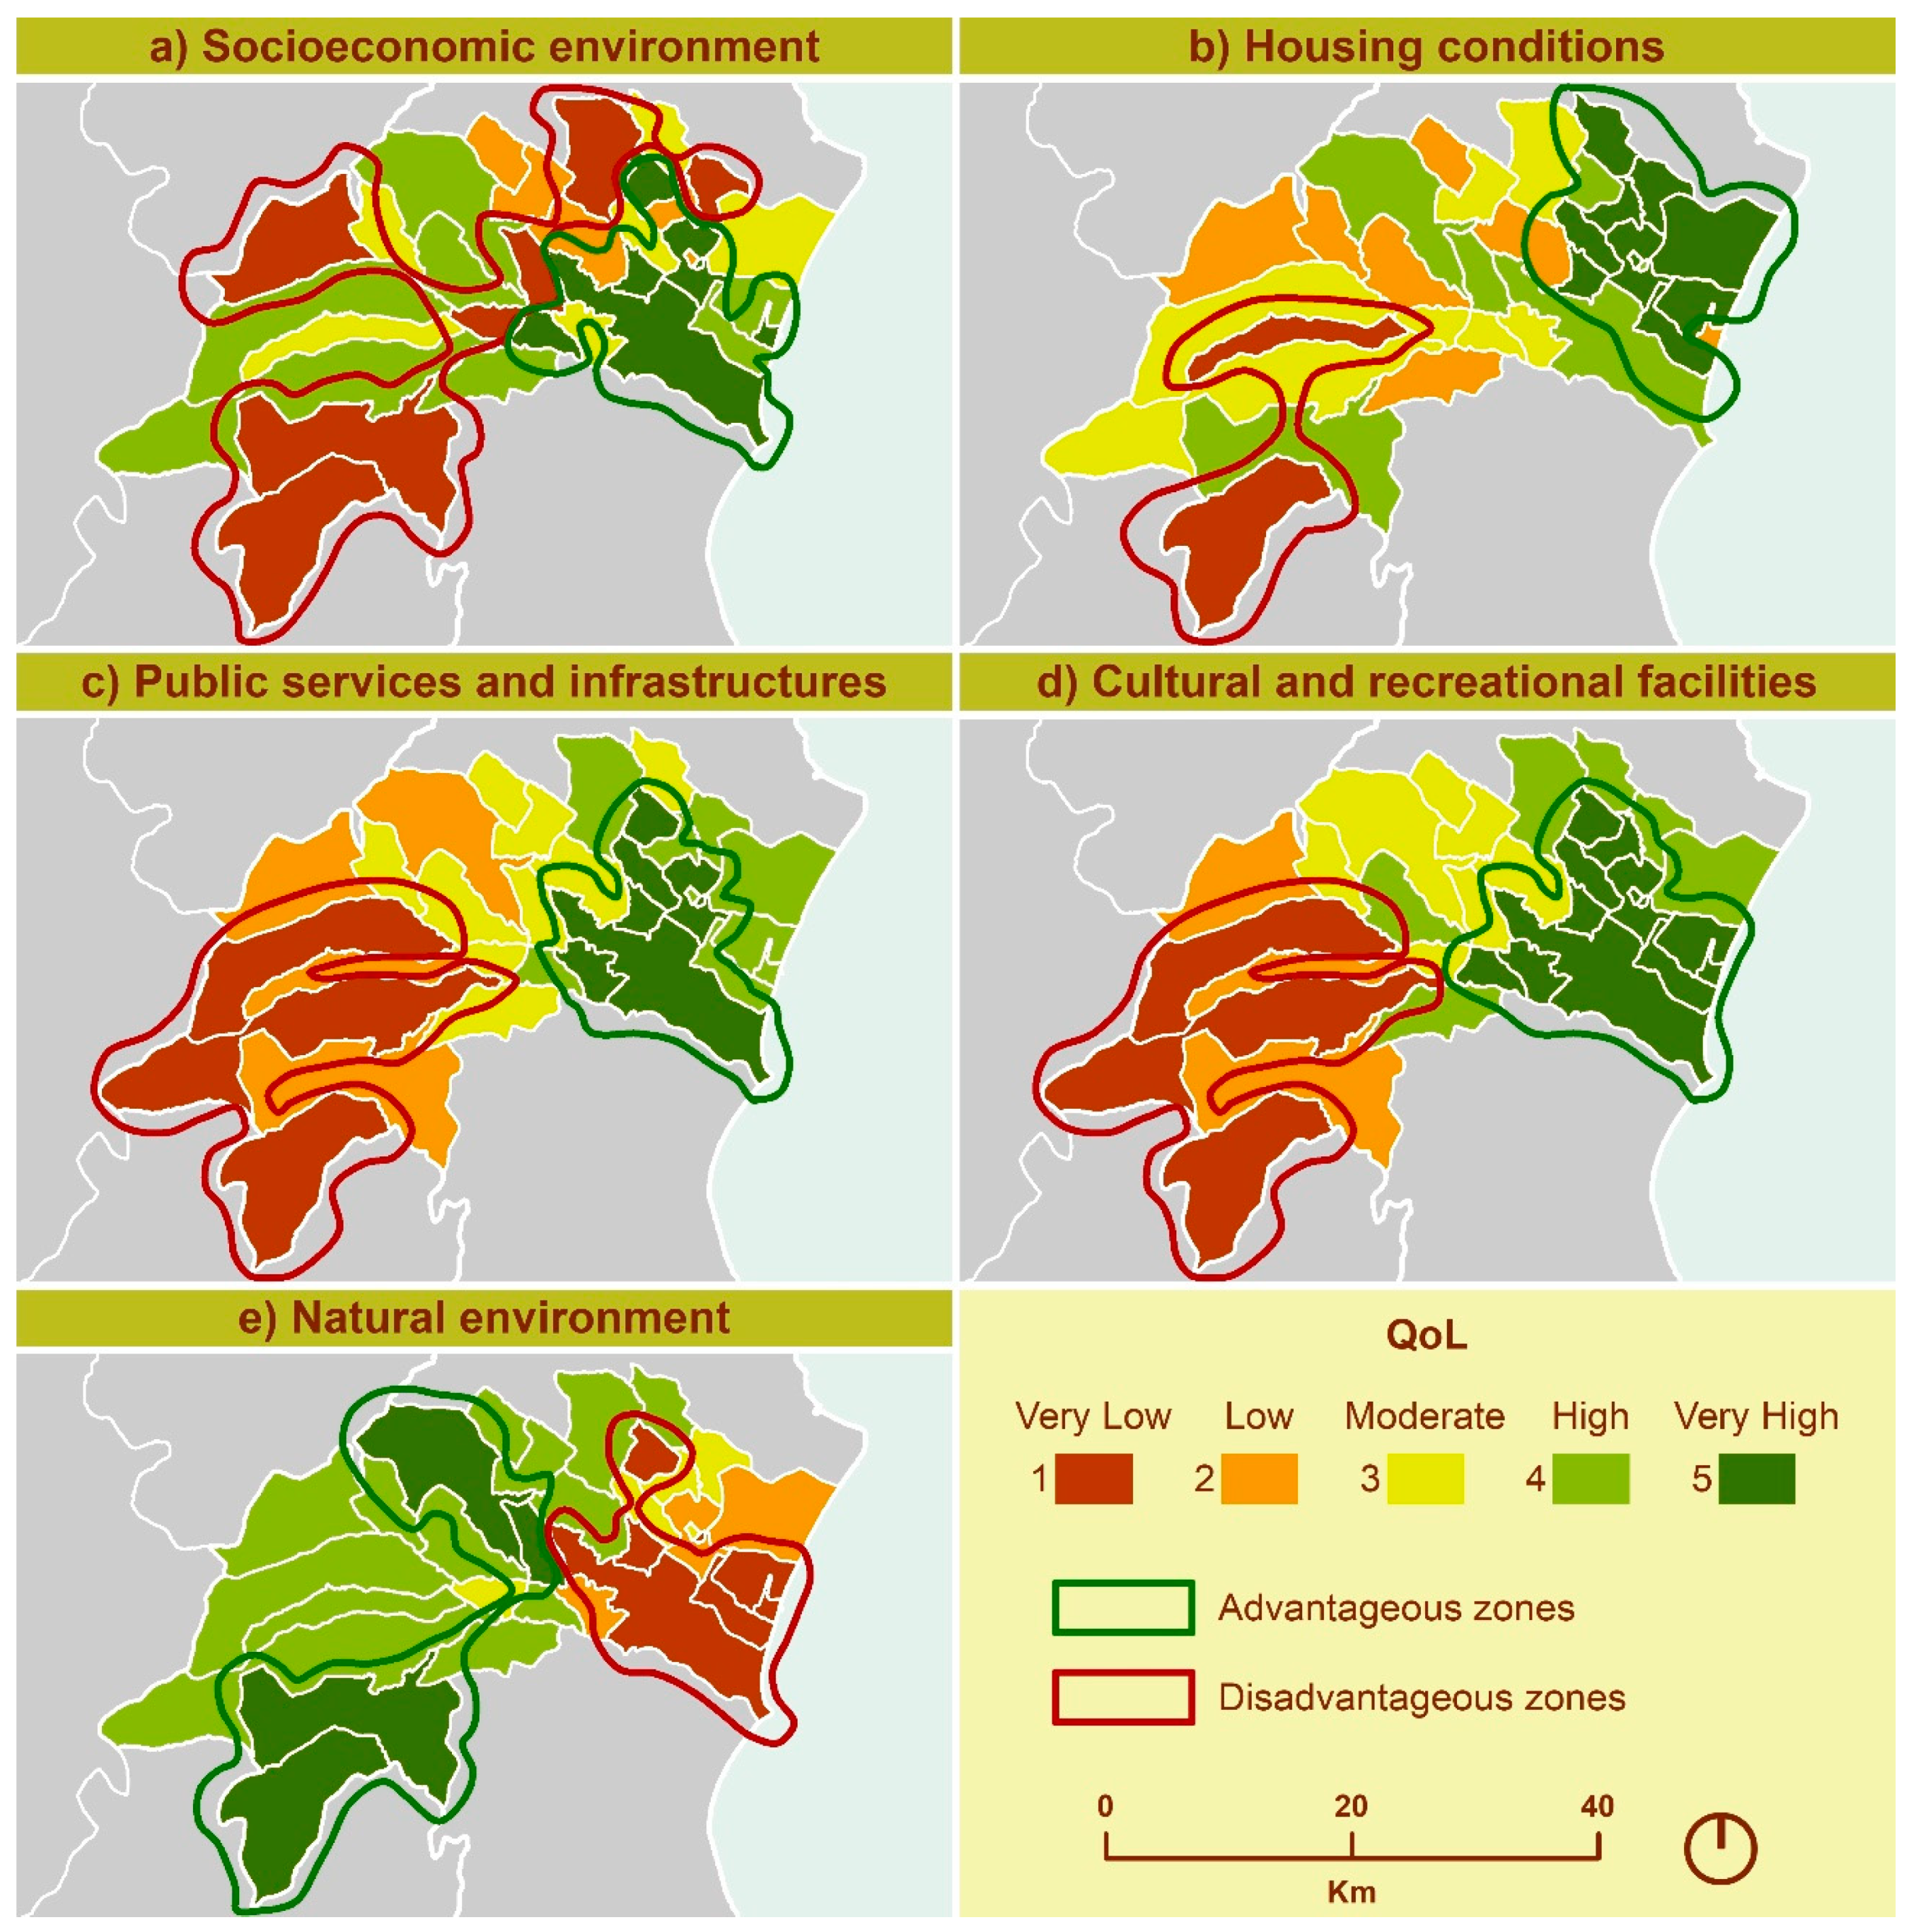
Figure 6 illustrates the classification of Katerini Municipality’s communities according to the QoL level they scored in each composite criterion. In the socioeconomic environment, high levels were observed in the community of Katerini and in communities both in the coastal zone and the hinterland of the municipality (
Figure 6a). However, the most distant communities (i.e., Aghios Dimitrios, Fotina, Elatochori) and two communities located in the central part of the municipality (Aronas and Moschochori) showed very low levels. Regarding the criterion of housing conditions, an advantageous zone of QoL was formed in the eastern and northern communities (
Figure 6b). Most of the rural communities in the west of the municipality showed low and moderate levels, and only two communities were classified in the lowest level.
Figure 6c shows that the urban community of Katerini and its neighboring communities scored the highest level in the criterion of public services and infrastructures, whereas the level gradually decreased towards the western and mountainous communities of the municipality. The QoL levels followed similar distribution among the municipalities in the criterion of cultural and recreational facilities, as the highest levels demonstrated in the urban and coastal communities (
Figure 6d). On the contrary, in the natural environment criterion, these communities scored the lowest levels of QoL, while the hinterland communities were classified to the high and very high category (
Figure 6e).
Summarizing the values each community had scored in the five criteria (each LAU could get values from 5 to 25 by scoring 1 or 5 in all criteria respectively), it was noticed that most communities scored 15–20 (
Table 4). Regarding the highest and lowest scores, only four communities recorded over 20 (Kato Aghios Ioannis: 22, Ganochora: 21, Ano Aghios Ioannis: 21 and Neokessaria: 21), while one community scored under 10 (Aghios Dimitrios: 9).
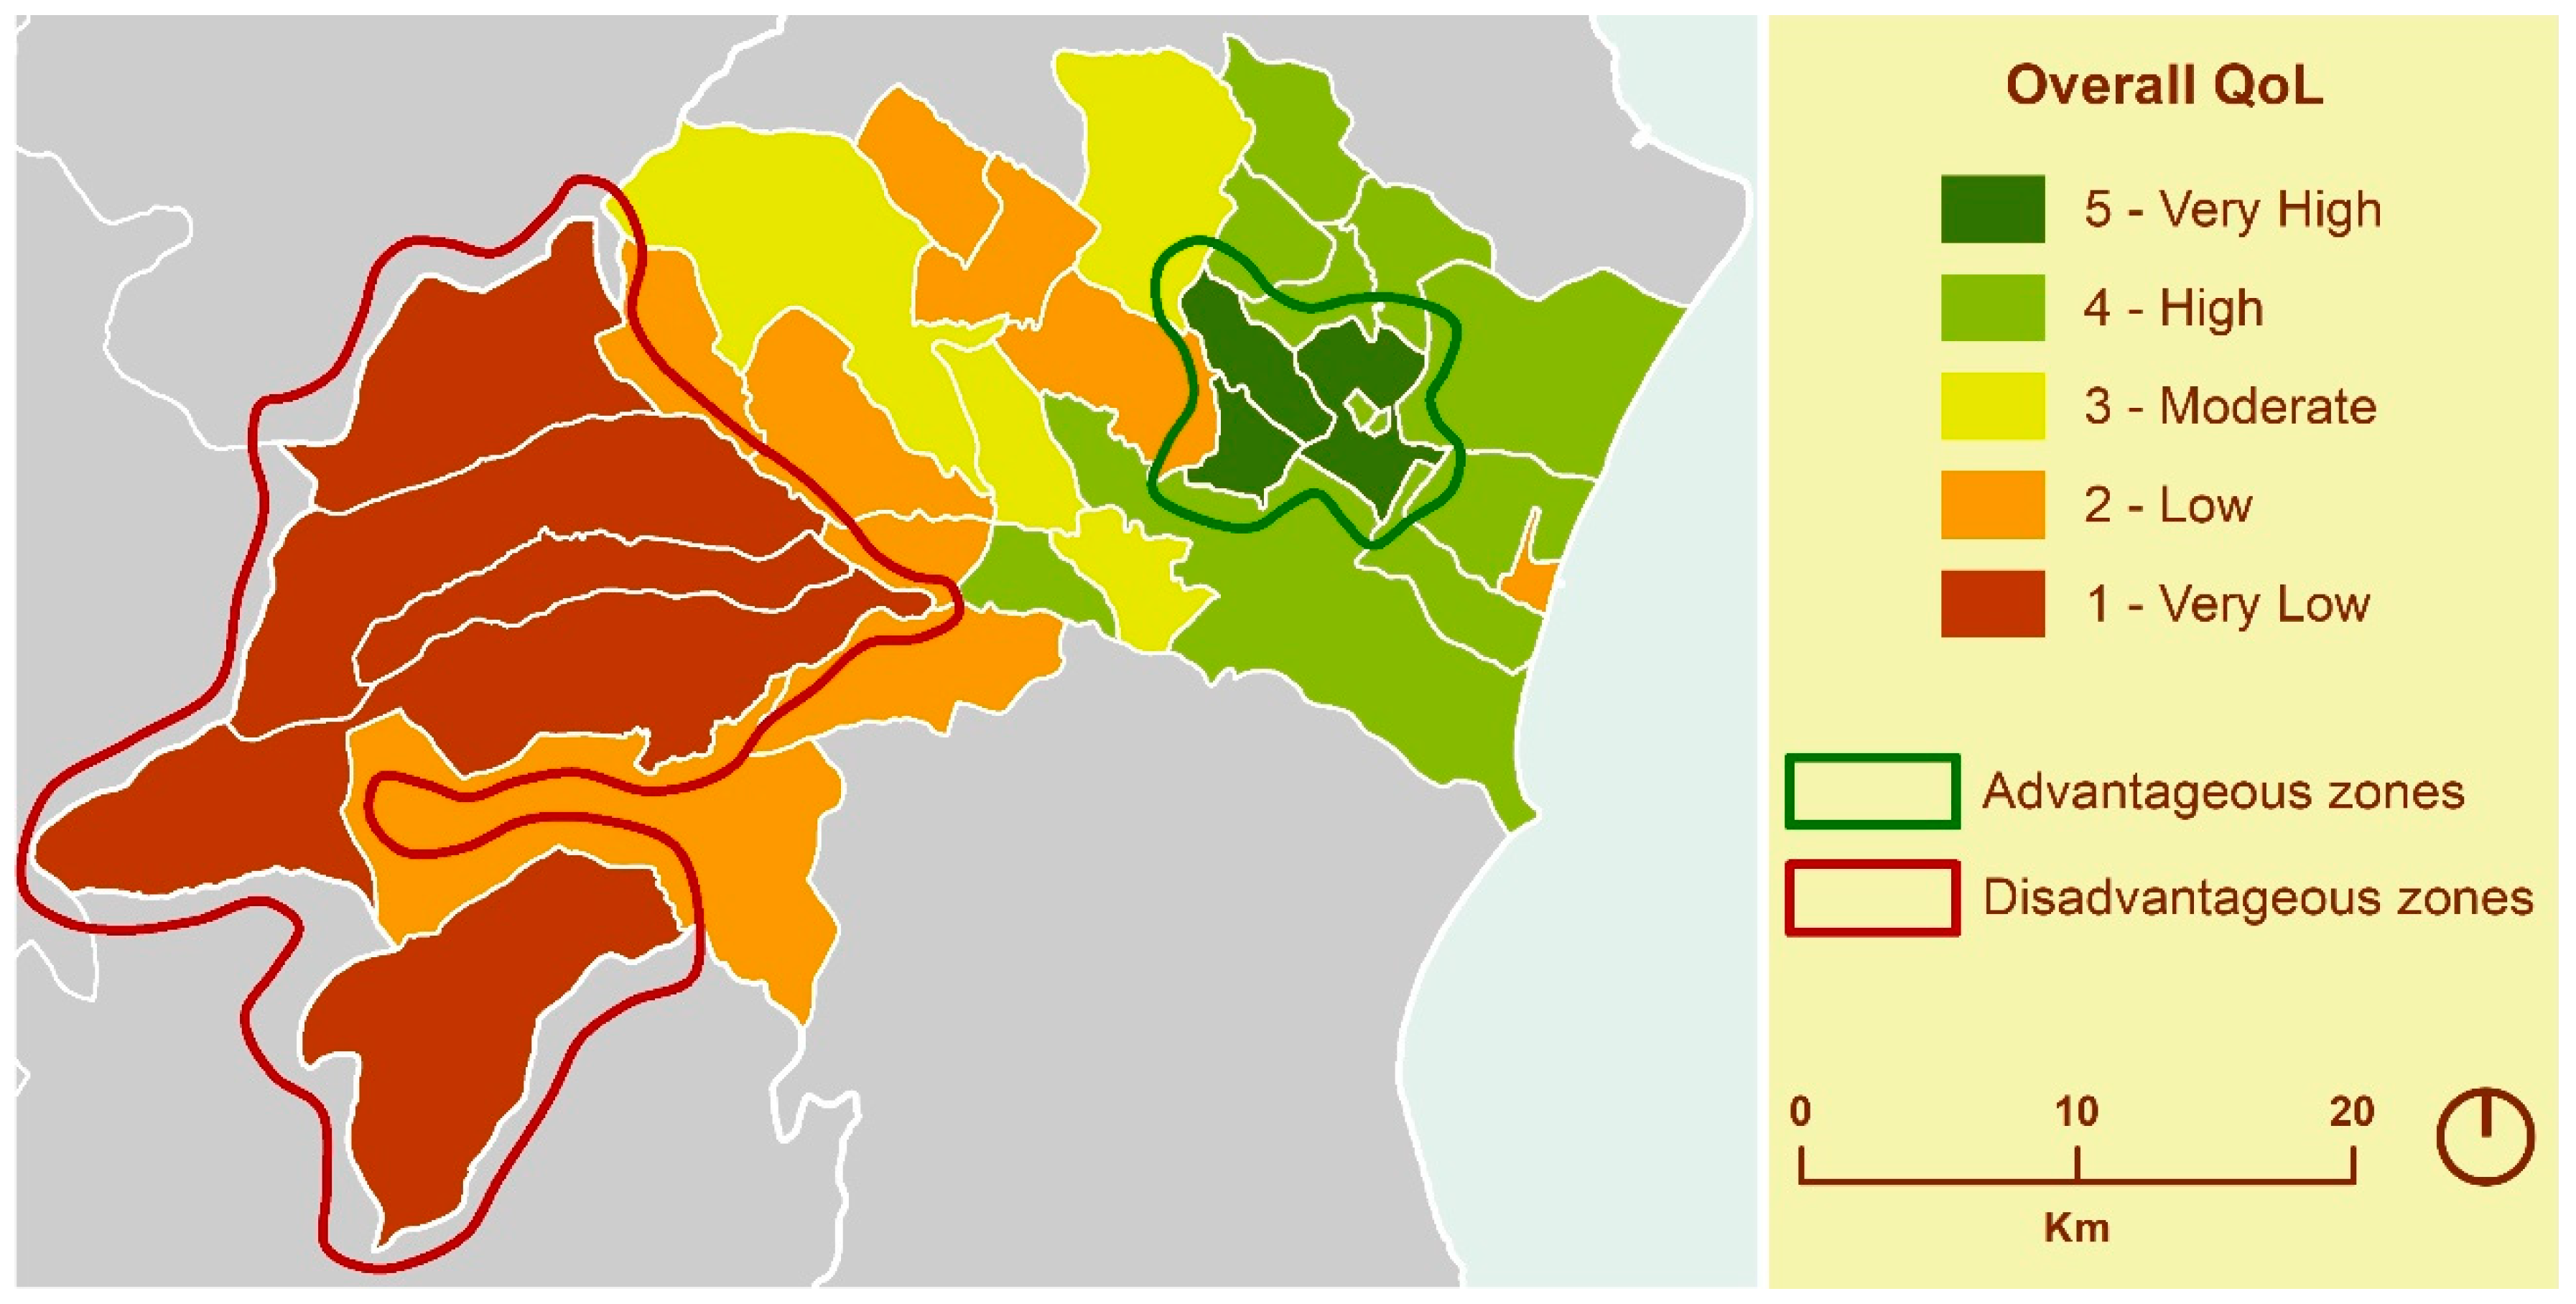
The overall QoL classification of Katerini Municipality’s communities, after combining the individual criteria, revealed an advantageous zone in the east-central municipality, including three communities (
Figure 7). QoL levels decreased towards the western communities, forming a disadvantageous zone in the mountainous and most remote communities of the municipality.
5. Discussion
The aim of this study was to develop a methodology for the assessment of QoL at local level. The methodology was implemented to a Greek typical provincial municipality. QoL composite criteria, based on the domains that evaluate the quality of place, were estimated and mapped, zoning the Municipality of Katerini and classifying LAUs as very high, high, moderate, low or very low level of QoL.
The results revealed the zoning of the eastern-western communities to advantageous-disadvantageous respectively (
Figure 7). In the criteria of public services and infrastructure, and of cultural and recreational facilities, this zoning is even more evident (
Figure 6c,d) between the rural/mountainous communities and the urban/coastal communities where the corresponding services and facilities are concentrated. It is characteristic, that in enough mountainous and rural communities were not noticed high or very high levels in any criterion but the natural environment (community of Paleo Keramidi, Elafos, Exochi, Moschopotamos, Elatochori, Vria, Aghios Dimitrios). In contrast, only the communities of Ano Aghios Ioannis and Neokaissaria, did not have low or very low levels in any criterion, as a result of their advantageous location characterized by a qualitative natural environment alongside the proximity to urban communities. Two neighboring communities to the urban center of Katerini, Kato Aghios Ioannis and Ganochora, scored five in all criteria except of the natural environment, while one of the most remote communities, Aghios Dimitrios, recorded one in four out of five criteria (
Table 5).
The highest overall QoL levels were noticed in suburban communities that combine the proximity to urban amenities and the qualified natural environment. The better QoL providing by suburban areas has been also reported by other studies [
14,
41]. In contrast, lowest levels of overall QoL was revealed in communities with poor access to public services and infrastructures, and to cultural and recreational facilities. This finding is in line with previous studies where access to health care centers, to educational facilities, to sport centers, and to cultural and leisure facilities are significant predictors of QoL [
12,
18,
45,
48]. Furthermore, the criterion of housing conditions revealed to be of great importance for a better overall QoL. The significance of housing size, type and quality in terms of facilities has been noticed in many studies [
13,
19,
41].
These findings could guide the priorities of local authorities to enhance each domain of QoL among the LAUs. Natural environment should take priority in the communities of Katerini, Peristasi, Kallithea, Paralia, Korinos, Kato Aghios Ioannis, Ganochora and Svoronos over any other domain of QoL. On the other hand, accessibility to public services and facilities, as well as to cultural and recreational facilities should be improved, e.g., by expanding and upgrading the road network, in the mountainous and remote communities of Katalonia, Elatochori, Ritini, Milia, Fotina, Vria and Aghios Dimitrios. In the last two communities, financial resources could also be available for the improvement of the housing conditions. Finally, priority in policies that target underlying social and economic determinants should be given to communities that scored low levels in the socioeconomic criterion. Interventions at the level of macroeconomic and social policy could promote socioeconomic status of underprivileged communities.
One of the strengths of the proposed methodology is that it was designed to be implementable in any Greek provincial municipality, while the variables that evaluate each criterion can be easily readjusted. Moreover, in Greece, social and geographic research faces constraints on the availability of local level data. However, the variables selected to evaluate QoL criteria in the proposed methodology are either available at this level or can be produced by using spatial data and GIS. Consequently, this methodology can be the basis of a methodological approach for the assessment of QoL at local level in Greece.
A GIS-based QoL assessment facilitates the decision-making process. The use of mappable geographic variables enables the variables and criteria mapping, facilitating the identification of spatial patterns with low or high levels of QoL. Mapping QoL also highlighted the strengths and weaknesses of the administrative units in each criterion, as well as in overall QoL, which can help local authorities to develop future strategies.
GIS, which provides an integrated environment for spatial analysis, was proved a powerful tool to data processing and QoL mapping [
34,
35,
36,
37]. The contribution of GIS was particularly valuable in the production of secondary geographical variables, through specialized spatial analysis functions (e.g., cost distance), especially in criteria with no available statistical variables.
The combination of the objective statistical data with the subjective importance of each variable, integrated the strengths of both approaches in QoL assessment [
19,
28]. In this way, the evaluation of QoL was based on both indicators that objectively estimated the living conditions in the study area [
26] and the preferences of the study area’s residents.
The AHP, implemented to prioritize variables in each criterion, is one of the most effective methods to address hierarchy of a decision-problem’s components. AHP can structure the components of a multi-criteria issue into a plain framework, combine qualitative and quantitative factors and enables the conversion of qualitative preferences into ratio scaled data [
39,
57,
58].
The classification of the variable values to a common ordinal scale allowed the combination of heterogeneous data. Nevertheless, it has to be noted that the use of the Jenks natural breaks method highlights the differences among the administrative units but the thresholds of the classes refer only to the specific case study. This method creates classes according to the values variance [
55] and since the values of the variables may differ, the classification used in this study can represent QoL levels neither in other study cases nor in other reference time.


