Article

Can Urban Street Network Characteristics Indicate Economic Development Level? Evidence from Chinese Cities

1
School of Architecture and Urban Planning, Nanjing University, Nanjing 210093, China
2
Provincial Engineering Laboratory of Smart City Design Simulation and Visualization, Nanjing 210093, China
*
Author to whom correspondence should be addressed.
ISPRS Int. J. Geo-Inf. 2020, 9(1), 3; https://doi.org/10.3390/ijgi9010003
Submission received: 8 November 2019 / Revised: 1 December 2019 / Accepted: 16 December 2019 / Published: 18 December 2019

Abstract

:
The street network is considered the skeleton of the city structure; it determines the efficiency and productivity of the city in that it acts like blood vessels transporting people, goods, and information. The relationship between street networks and economic development is an important research topic in urban geography. In recent years, complex network theory has been successfully used for understanding the characteristics of street network structure. However, researchers lack an analytical framework and methods for studying the relationship between the morphological structure of urban streets and the economic development level of cities. Accordingly, this paper proposes a methodological framework for first, quantitatively characterizing the urban morphological structure based on open street network data, and second, exploring the relationship between the morphological structure of the urban street and the urban economic development level. The proposed methodology was applied to 31 provincial capital cities in China. The results indicate that urban morphological structure can be quantitatively described by betweenness and closeness centrality extracted from street networks. Cities with similar structures have similar levels of economic development. Moreover, the results suggest a significant positive correlation between street network betweenness centrality Gini coefficients and cities’ economic development levels, indicating that the street network may affect city productivity. This study makes two major contributions to the scholarly literature. Methodologically, the proposed framework provides technical and methodological support for a better understanding of the relationship between cities’ economic development and urban street structure. Empirically, the demonstrated case study may guide decision-making involving regional development and the optimization of urban space.

1. Introduction

The street network is considered the skeleton of a city as it links geographical units in urban space. To some extent, the morphological structure of streets determines the breadth and intensity of interconnections between different functional areas in urban settings and accordingly affects the flows and operational efficiencies of various resource elements in the city and urban spatial structure [1,2,3,4,5]. Therefore, the relationship between street networks and economic development level is an important research area in urban geography and urban planning. A rich body of literature has examined whether economic development is correlated with the accessibility of the traffic network, the density of traffic infrastructure, or the density of street networks [6,7,8,9,10,11]. These studies have suggested that there is a mutual promotion and mutual restriction relationship between the transportation network and economic development. On the one hand, the expansion of a transportation network improves the linkages among regional cities, accelerates the flow of factors, and promotes the development of a regional economy [12,13]; on the other hand, economic development further promotes the expansion and improvement of the transportation network [10,14]. However, due to the limitation of acquiring high spatial resolution street network data and computational power, traditional research has primarily focused on regional scales using economic annual and multi-year remote sensing image data [15]. Only recently, a few studies have emerged that examine how street network structures may influence economic activities such as the allocation and operational efficiency of various elements in the cities [16,17]. However, studies that fully consider the inter-relationships within the street networks from a micro-scale perspective (e.g., the complex interactions among street network elements) or that provide a quantitative methods framework for studying the morphology and structure of the street networks are still generally lacking.
In recent years, technologies including information and communication technology (ICT) and volunteer geographic information (VGI) have developed rapidly and have made abundant high-resolution city street network data publicly available and provided new opportunities for quantitative analysis of the morphology and structure of street networks at the city level [18,19,20]. Moreover, complex network methods, which are integrated into geography and regional science, have provided new insight into understanding the street network from a system and structure perspective [21,22]. Compared to traditional methods, complex network methods address the complex interactions within a street network and have the advantage of capturing inherent patterns and characteristics of connections among urban elements from a systematic and holistic perspective. Therefore, complex network methods may assist in providing new insight into the relationship between street network structures and urban economic activities.
Along these lines, many studies have deployed complex network approaches for evaluating the integrity and accessibility of street networks by analyzing street networks’ topological characteristics and their spatial distributions [23,24,25,26]. While there are burgeoning studies that explore the relationship between street network characteristics and social-economic activities, most of the existing work focuses on analyzing the topological characteristics of nodes within a city street network and their association with a particular type of economic activity (e.g., retail). Few studies, to the best of the authors’ knowledge, have considered a city’s street network as a whole and examined whether or not the characteristics of its morphological structures may correlate to the economic development levels of the city.
To bridge these research gaps, this paper proposes a general analytical framework for characterizing cities’ street network structures and for quantitatively examining the relationship between a city’s street network structure and its economic development level using open street network data. The framework includes a full life cycle of data collection, processing, modeling, and applications in urban planning and management. The rest of the paper is organized as follows: Section 2 reviews relevant studies that use complex network methods to examine the street network; Section 3 presents the proposed methodological framework and describes analytical methods in detail; Section 4 uses a case study to examine the proposed methods by first briefly introducing the study area and data source, and then discussing the results of the case study; and finally, Section 5 concludes the paper with a discussion about the potential applications of the proposed method and how insights gained from the case study may shed light on regional planning and development as well as future research.

2. Related Literature

2.1. Characterizing Street Networks Using Complex Network Approaches

Complex network approaches have provided a powerful perspective and methods in studies of the traffic network. Most early research focuses on extracting the topological indicators of urban transportation networks, analyzing the attribute characteristics of indicators, and exploring the network characteristics such as scale-free and small-world properties. A few studies further attempt to identify the cities’ morphology and structure based on the spatial distributions of street network topological indicators. For example, Crucitti et al. used urban street networks that are characterized by different patterns and historical roots and used different network construction methods to analyze the topological characteristics of six street networks. The results showed that the streets have a broad distribution of typical scale-free networks and small-world properties [27]. Jiang derived a topological pattern of urban street networks using a large sample extracted from the TIGER database from the US Census Bureau. The study suggested that for both street length and connectivity degree of the street–street intersection, the topologies of urban street networks all demonstrate a small-world structure and scale-free property [28].
However, the difficulty of acquiring detailed street network data has limited previous research in the study of quantifying and comparing urban street structures using samples with a larger size. In recent years, OpenStreetMap (OSM), an Internet-based mapping platform based on voluntary contributions from worldwide users, has rapidly developed and allowed urban researchers access to a valuable open source of worldwide geospatial data. A number of preliminary studies suggest that OSM road networks are useful in identifying urban structures [29,30]. For instance, Boeing used the OSMnx software to obtain 27,000 US street networks from OSM at the metropolitan, municipal, and neighborhood scales and then extracted average street segment length, node density, edge density, and more than 20 indicators to describe the street network characteristics [31]. Domingues et al. acquired several 1150 world cities’ street networks from OSM based on filtering conditions, and took the concentric node degree, concentric clustering coefficient, accessibility, and matching index as indicators of measurements for the topological properties of the street networks. Firstly, they analyzed the distribution of each indicator, then they examined pairwise relationships between such indicators as quantified by the Pearson correlation coefficient, and finally they applied Principal Components Analysis (PCA) to investigate the overall distribution of cities. The results showed that cities from specific continents tend to have many similar street network topological properties [32]. Yet the study focused only on the physical characteristics of the street networks and lacked an examination of the relationship between street network characteristics and urban economic development.

2.2. Understanding the Relationship between Street Networks and Economic Development from a Network Perspective

Street networks not only determine urban structures but also affect economic activities in the city. Studies have explored the relationship between street networks and social-economic activities at different spatial scales. At the city scale, several studies use the spatial distribution densities of commercial places as indicators of economic activities and analyze the relationships between the density of street centrality and economic activities. For example, Porta et al. examined the relationship between street centrality and economic activities (i.e., retail and services) in the city of Bologna, Italy. They first measured the betweenness, closeness, and straightness centrality of streets and then applied correlation analysis between centrality measures and the density of retail and service. The results showed that economic activities correlate with both measures of the street network at a global level [33]. Cardillo et al. similarly examined the correlation of the geographies of street centrality and various types of economic activities in Barcelona, Spain. Three types of centrality measurements, namely betweenness, closeness, and straightness were used in the study [34]. Along similar lines, several studies suggested that street centrality may impact the location of commercial places. For instance, Wang et al. through a case study of Changchun, China, found that street centrality is critical to the intensity of commercial land-use intensity and therefore would impact the locations of retail stores [17]. Based on multiple centrality assessment models, Lin et al. suggested that street centrality could reveal the location advantages of retail stores in traditional commercial metropolises [35]. Liu et al. further considered spatial heterogeneity in the relationship between street network centrality and land use intensity. By using the geographically weighted regression (GWR) method, their study identified strong relationships between street centrality and land-use intensity [36].
At the urban agglomeration level, researchers have pointed out the lack of methods for characterizing the relationship between cities that use road network topological features [37]. As such, recent studies have explored whether cities that have similar street network topology properties share similar characteristics in their populations and economic development levels. For instance, Spadon, Gimenes, and Rodrigues classified 645 cities in the state of Sao Paulo, Brazil based on their street network features and found that the topological characteristics of urban streets could, at a large scale, indicate or even predict their demography [37]. Along similar lines, Lee and Jung analyzed the topological features of street networks using multi-centralities methods and classified a series of cities into several groups that share common meta-information based on centrality. Their results indicated that the topological factors of the street structures are closely related to analyzing the meta-information of the city [38].
Despite the growing body of literature that studies the physical structural characteristics of urban street networks using complex network theory and methods, the quantitative and comparative analysis of city street network structure characteristics from a network perspective is only emerging. Only a few recent studies have paid attention to the relationships between street network structures and socioeconomic statuses of cities. Yet those studies have not provided evidence to show whether city street networks can indicate economic development levels. Moreover, current studies use empirical research, which has not provided a common methodological framework for analyzing the relationship between street networks and economic development. To this end, this study attempts to build a common analytical framework that can quantify street structure characteristics based on complex network theory and methods, differentiate cities from the perspectives of street network features, and examine the correlation between cities’ street network structures and their economic development level.

3. Methodology

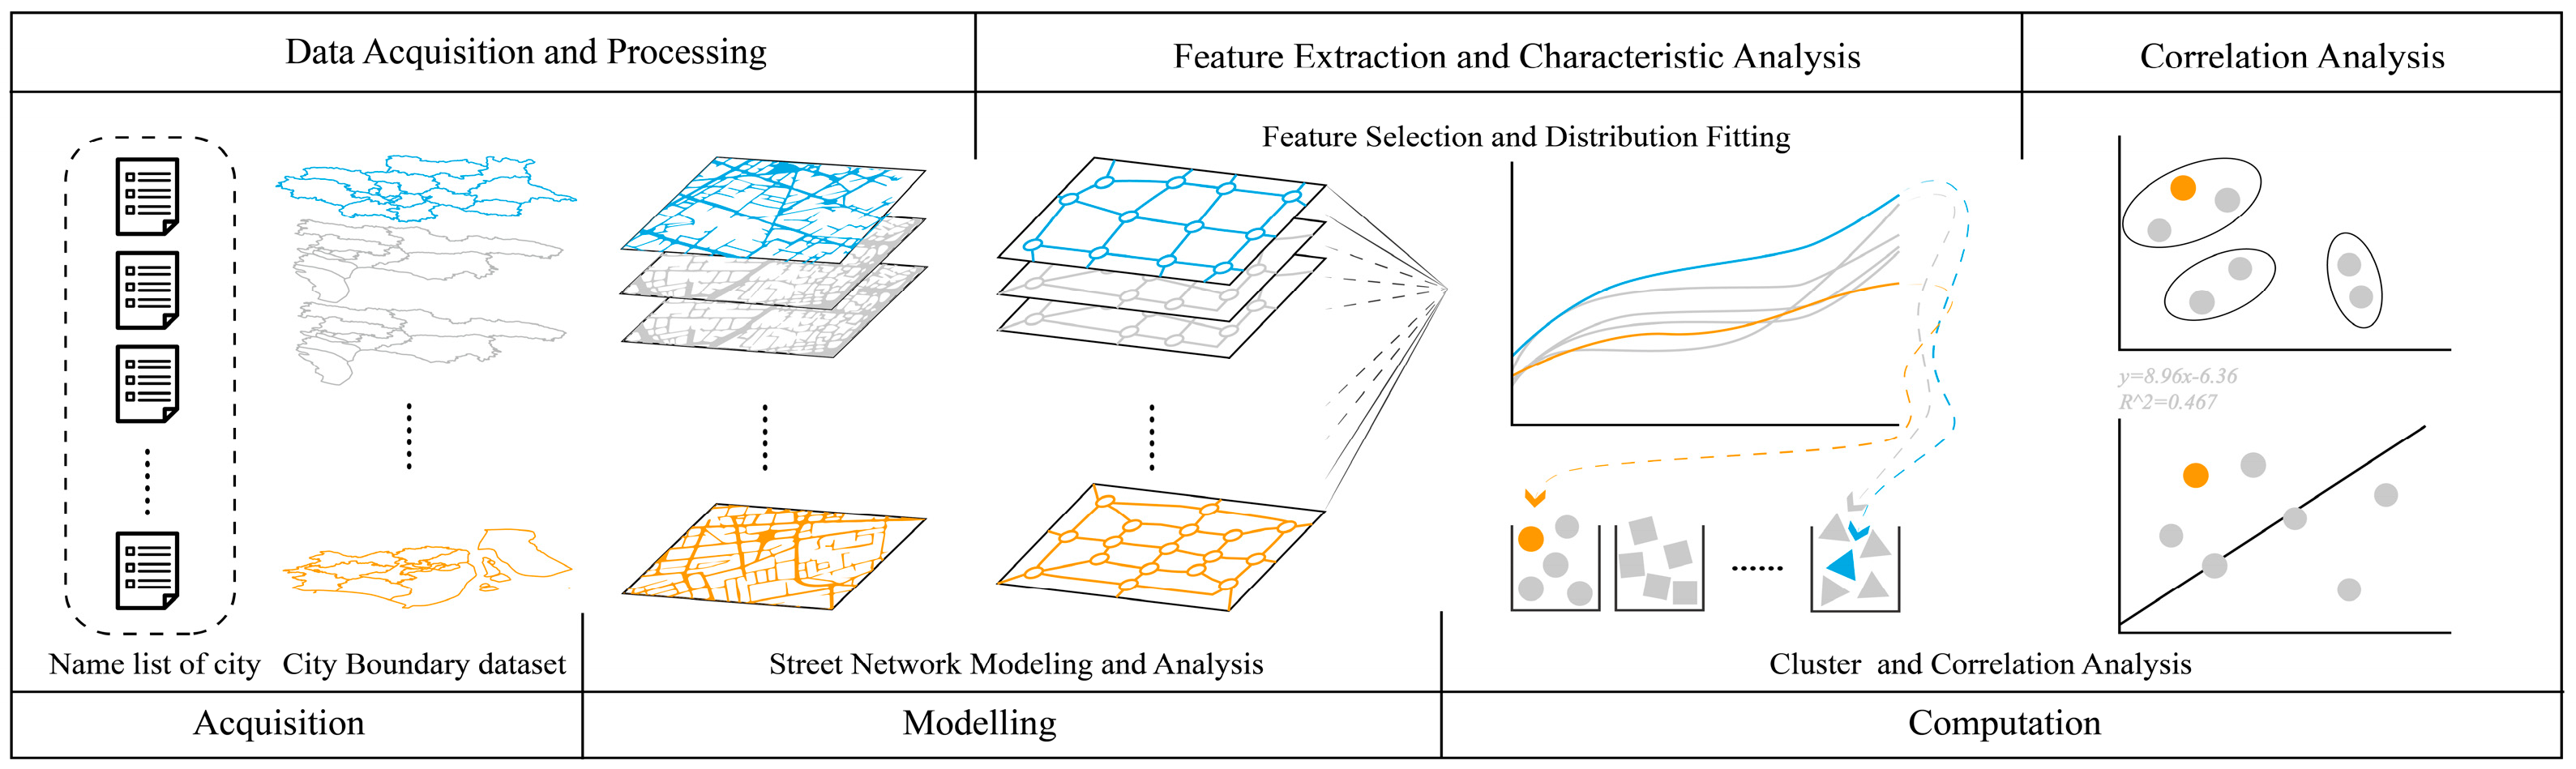
3.1. The Proposed Analytical Framework

We are proposing an analytical framework adapted from Spadon et al. [37], as shown in Figure 1, which includes three steps: data acquisition, characterizing urban street networks, and investigating the relationship between urban street networks and economic development. First, we acquired cities’ street network data from OpenStreetMap using OSMnx [31], a software for downloading spatial entities and for modeling, projecting, visualizing, and analyzing complex street networks from OpenStreetMap’s Application Programming Interfaces (APIs). Street networks (graphs) were then constructed using the obtained OSM street data. In this paper, we consider street intersections as nodes and the street segment between each pair of street intersections as edges in the network. The lengths of the edges are considered weights in the network.
Second, we characterized a city’s street network based on two commonly used topological features, namely betweenness (see Appendix A Figure A1) and closeness centrality. The choice of the two indicators was based on the considerations that: (1) previous studies have suggested that betweenness and closeness centrality are two indicators that are significantly related to economic activities [17,33]; and (2) albeit the diversity of indicators that can describe street network characteristics, some of the indicators are quite similar. For instance, studies have suggested that information centrality is highly correlated with betweenness centrality in representing a street network [27]. As such, representative and distinct network indicators (e.g., betweenness and closeness centrality) should be used. For each city’s street network, the two indicators were calculated using Networkx, a python package for the creation, manipulation, and study of the structure, dynamics, and functions of complex networks. We then quantified the characteristics of a city’s street network as a whole by applying the linear fitting method to extract the slope of the statistical distribution of the two features.
Third, based on the identified characteristics, we investigated whether cities that have similar street structures have similar levels of economic development or not. Specifically, we classified the cities into different clusters using hierarchical clustering analysis and compared the clustering results with indicators of economic development, including traditional economic zoning that is determined by economic development levels, gross domestic product (GDP), and population. The comparison is based on the assumption that cities that belong to the same cluster will be in the same economic zoning and will be close in the dimension space of GDP and population. If a correlation between urban street network characteristics and economic development is observed, the correlation coefficients of the two will be extracted to examine the statistical significance of the observed relationship.

3.2. Characterizing Street Network Structures

Centrality analysis is commonly used to characterize street network structure by quantifying the nodes and/or links within the network [22,37]. Among various centrality measurements, we employed two widely used indicators: betweenness centrality and closeness centrality [39,40,41].
Betweenness centrality evaluates the number of shortest paths that pass through each node or edge in a network [17,42,43]. In a street network, it indicates potential traffic volume that a node or a link may attract. In other words, it presents how much control a node or an edge has for a network. Betweenness centrality is defined as
  B C i = 1 ( N 1 ) ( N 2 ) j = 1 ; k = 1 ; j i 1 N n j k ( i ) n j k
where n j k is the number of shortest paths between j and k, and n j k ( i ) is the number of shortest paths between j and k that contain node i. Betweenness centrality of a node scales with the number of pairs of nodes as implied by the summation indices. Therefore, the betweenness centrality values are rescaled by dividing the values using the number of nodes, not including itself. So, the term 1 ( N 1 ) ( N 2 ) is used to normalize the value of betweenness centrality to the range from 0 to 1 for directed networks [44], where N is the number of nodes in the street network.
Closeness centrality evaluates the degree of proximity of one node to all the other nodes in a network [17,42,45]. It is the reciprocal of the sum of the distance from one node to all others in the network. Since the sum of distances depends on the number of nodes in the graph, closeness is normalized by the sum of the minimum possible distances N − 1. A node will be considered more central if it is closer to other nodes on average. Closeness centrality is defined as
C C i = ( N 1 ) j = 1 ; j i N d i j  
where N is the total number of nodes in the network, and d i j is the shortest distance between node i and j.

3.3. Hierarchical Clustering Analysis

To classify the cities by street network structure characteristics, we adopted the Gini coefficient to indicate the feature of the network structure. The Gini coefficient is widely used in economics to measure the inequality of economic quantities such as income [38,46]. It is defined as
g = i = 1 n j = 1 n | x i x j   | 2 n i = 1 n x i
where x i   is the centrality value of node i and n is the number of nodes in the street network.
Hierarchical clustering (also called hierarchical cluster analysis or HCA) is a cluster analysis method that seeks to build a hierarchy of clusters [47]. There are generally several types of hierarchical clustering approaches. The first is a “bottom-up” approach: each observation starts with its own cluster, and clusters are paired up and merged as one moves up the hierarchy. The second is a “top-down” approach: all of the observations start in one cluster, and the cluster is split recursively as one moves down the hierarchy. In this study, we employed the complete linkage method, a “bottom-up” approach, to measure the distance between pairs of observations. The steps of the process are as follows.
  • Step 1: Have each city start in its own cluster; calculate the Euclidean distance between each pair of cities in the feature space.
  • Step 2: Merge the pairs of clusters into a new cluster based on the minimum distance between pairs.
  • Step 3: Calculate the distance between the new cluster and others again.
  • Step 4: Repeat Steps 2 and 3 until all cities merge into one cluster.

4. Case Study

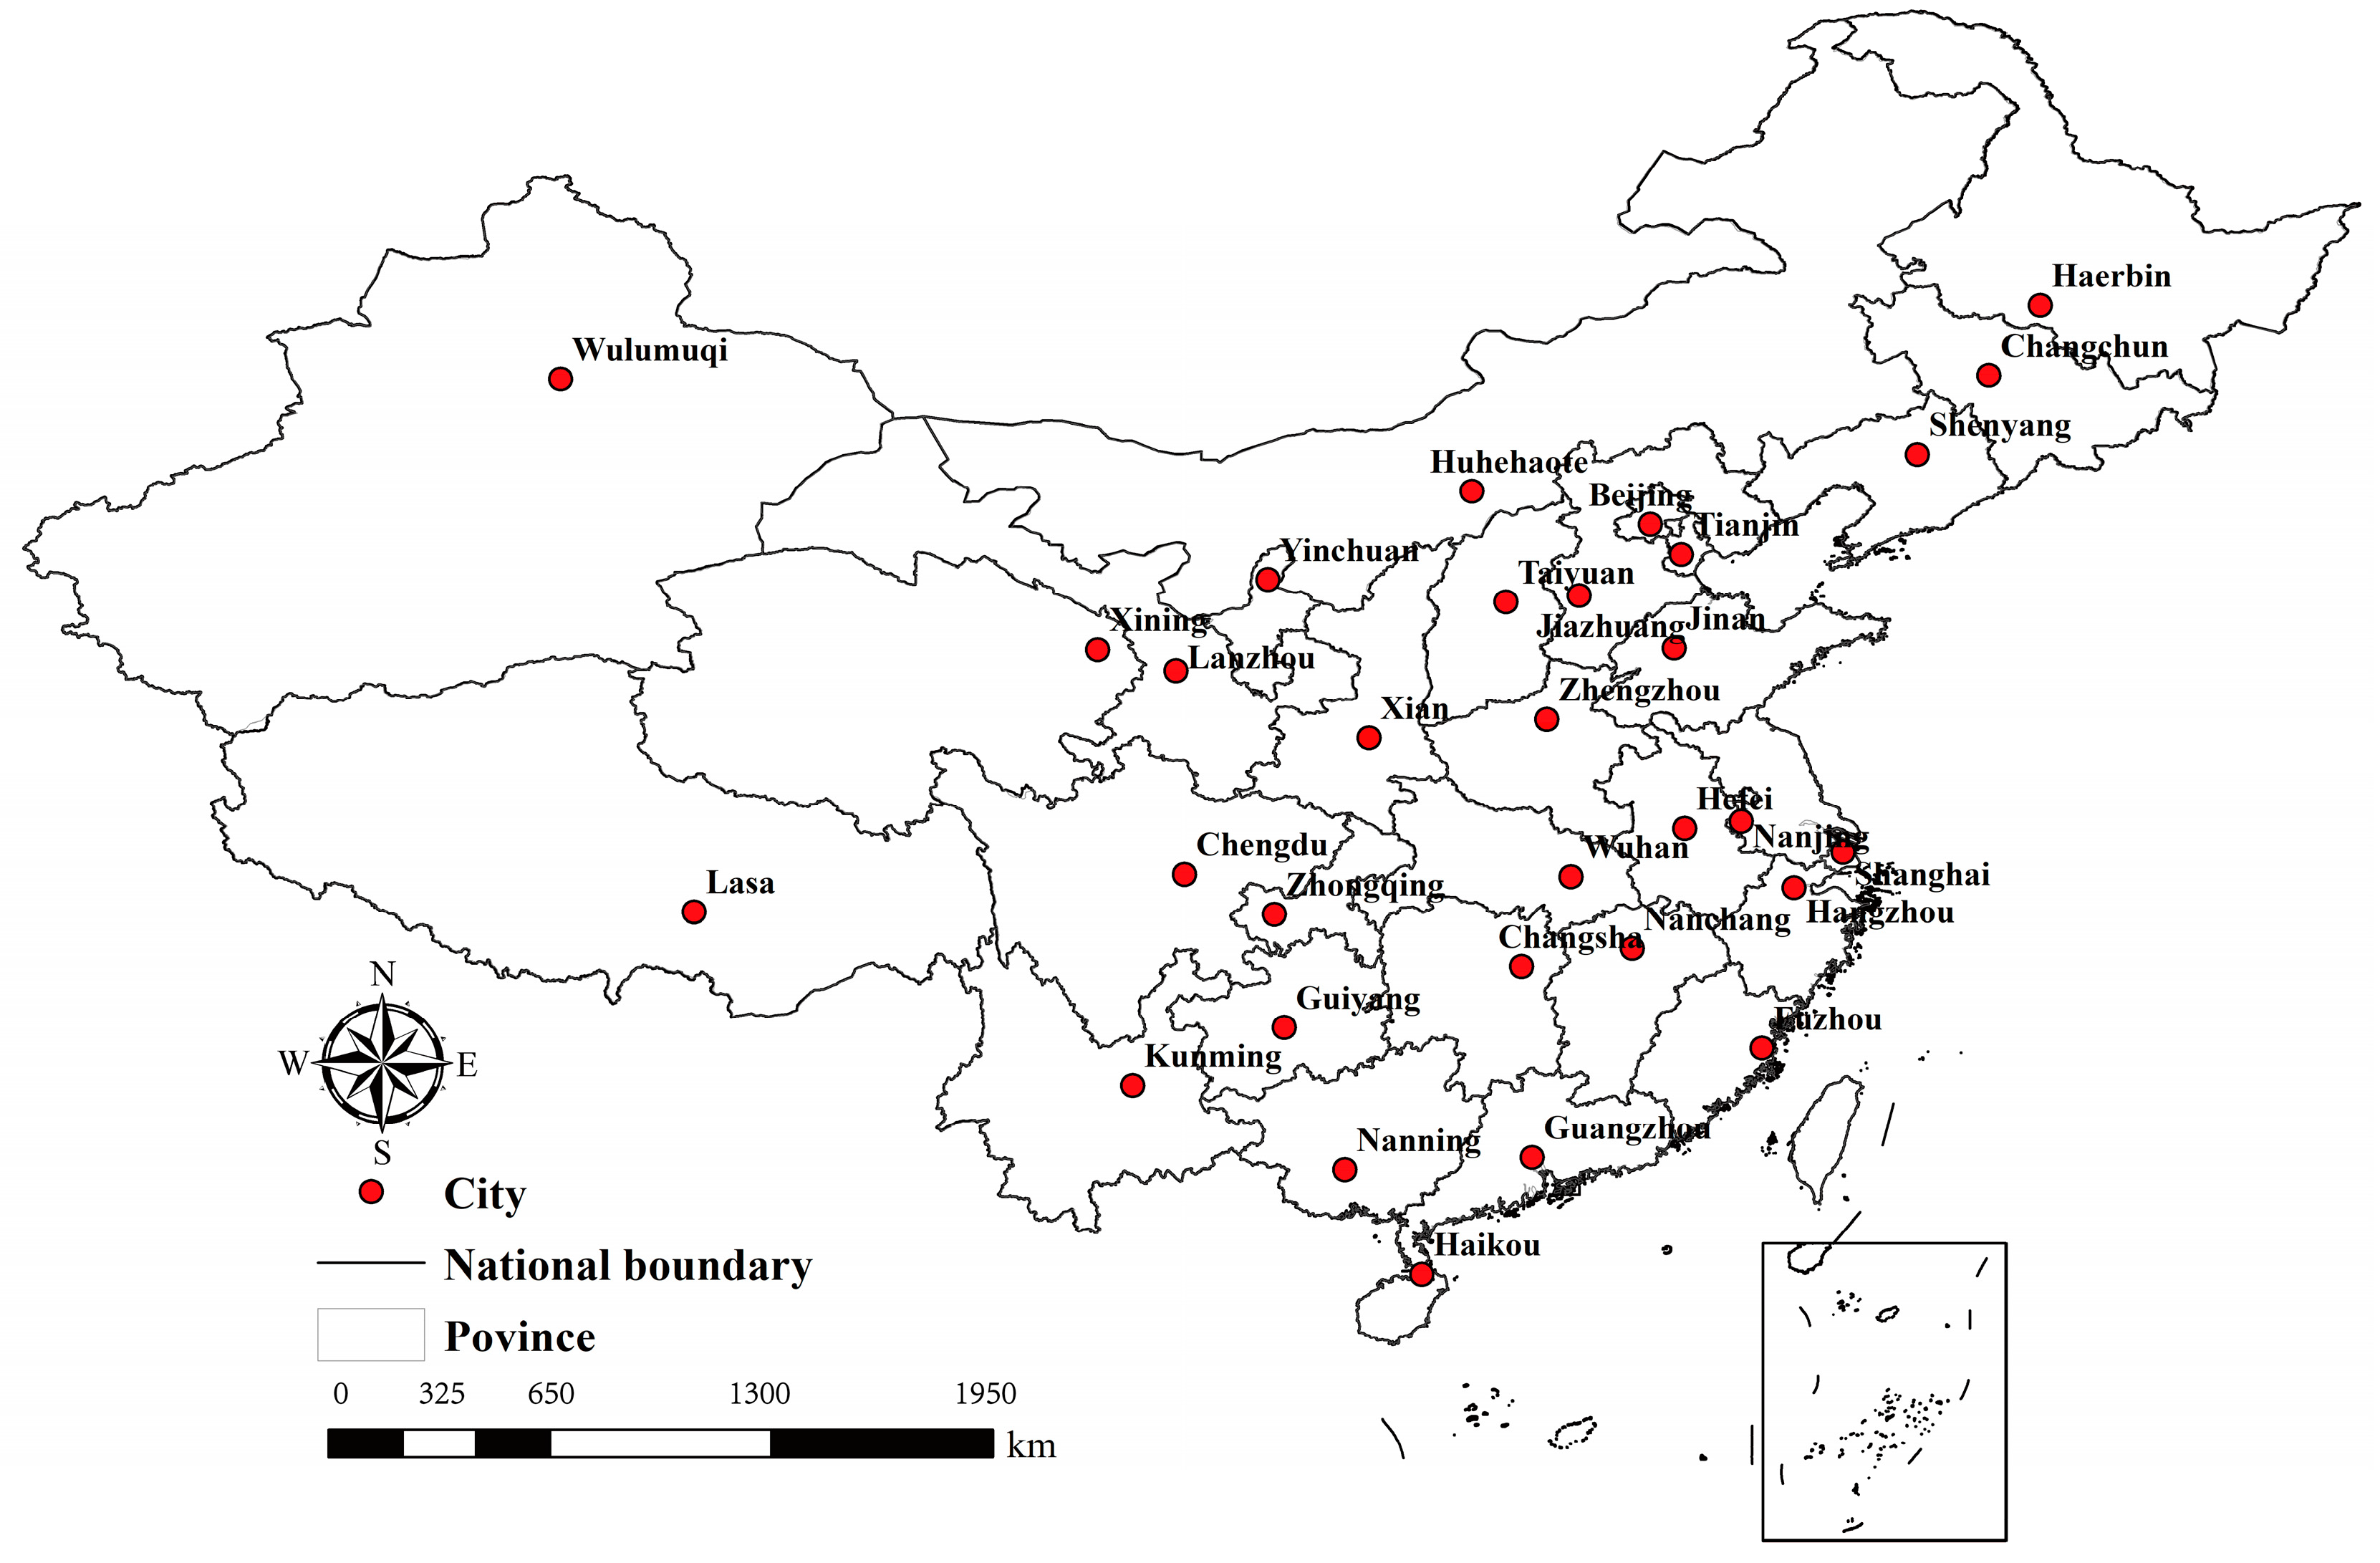
4.1. Study Area and Data Source

We selected 31 provincial capital cities in mainland China as the study area (see Appendix A Figure A2). These provincial capital cities have the fastest urbanization speed and play major roles in the political, economic, and cultural development of the region. Moreover, they are often the hub cities that connect other cities in the region and are therefore critical for implementing major regional development strategies such as the “Belt and Road,” “Yangtze River Economic Belt,” and “National Center City” strategies enacted in China. As such, the empirical studies of these cities will not only prove the validity of the proposed framework but also shed light on regional developments in China.
Two datasets of the provincial cities were used in this study, including (1) economic and demographic statistical data, which were downloaded from the CEInet statistics database [48] and, (2) city street network data extracted from OSM. The acquisition of OSM data consisted of the following steps. Firstly, we obtained a name list of the administrative districts for all cities from BaiduBaike [49] a web community similar to Wikipedia. Secondly, we used GaoDe map API [50] to collect the data of every city’s administrative geo-boundaries in a shapefile format. Finally, we used OSMnx, a python package created by Geoff Boeing [31], to retrieve the street network’s dataset.
Despite early concerns regarding the incompleteness of OSM data in China, recent studies have suggested that the quality of OSM street data in China has improved and is valuable for studying Chinese cities [51]. The continuous improvement of the quality of OSM data can also be examined using OSM analytics [52], a tool for tracking the history of OSM. Particularly, provincial capital cities, developed eastern cities, and cities with higher population movement and higher education are more likely to have more complete OSM street data [51]. To further examine the validity of the derived dataset for our study, we measured the correlation between the OSM data and official data [53] (i.e., the annual report on road network statistics in major Chinese cities published by the China Academy of Urban Planning and Design) based on the total lengths of city streets. The results suggest that the two datasets are significantly correlated with an R-square of 0.66 (Appendix A, Figure A3).

4.2. The Characteristics of Street Networks

We first applied descriptive statistical analysis to provide an overview of the street networks of the 31 cities. Four parameters were used, including the number of nodes in a city’s street network, the number of edges in a street network, the average street segment length in a city, and the density of street intersections. Appendix A Table A1 presents analysis results: the average number of street nodes in cities is 14,252.48, and the average number of edges is 32,858.15. Among all the studied cities, Beijing has the largest number of nodes and edges, and Yinchuan has the smallest number of each.
The average street segment length (i.e., the edge length of a street network) of 31 cities is 446.57 meters. Among the cities we studied, Lanzhou has the longest average street segment length of 1017.41 meters, while Guangzhou has the shortest average length of 279.71 meters. The 31 cities have 20.59 intersections per km2 on average, with Shijiazhuang having the highest density of street intersections and Lanzhou the lowest.
We then applied centrality measurements, as presented in Section 3.2, to the street networks for the purpose of distinguishing different street network structures of cities. For each of the centrality measurements (i.e., betweenness centrality and closeness centrality), its cumulative distribution was plotted. Secondly, we selected linear fitting methods to fit the distribution curve of each city and computed the slope of the fitting line to measure the difference.

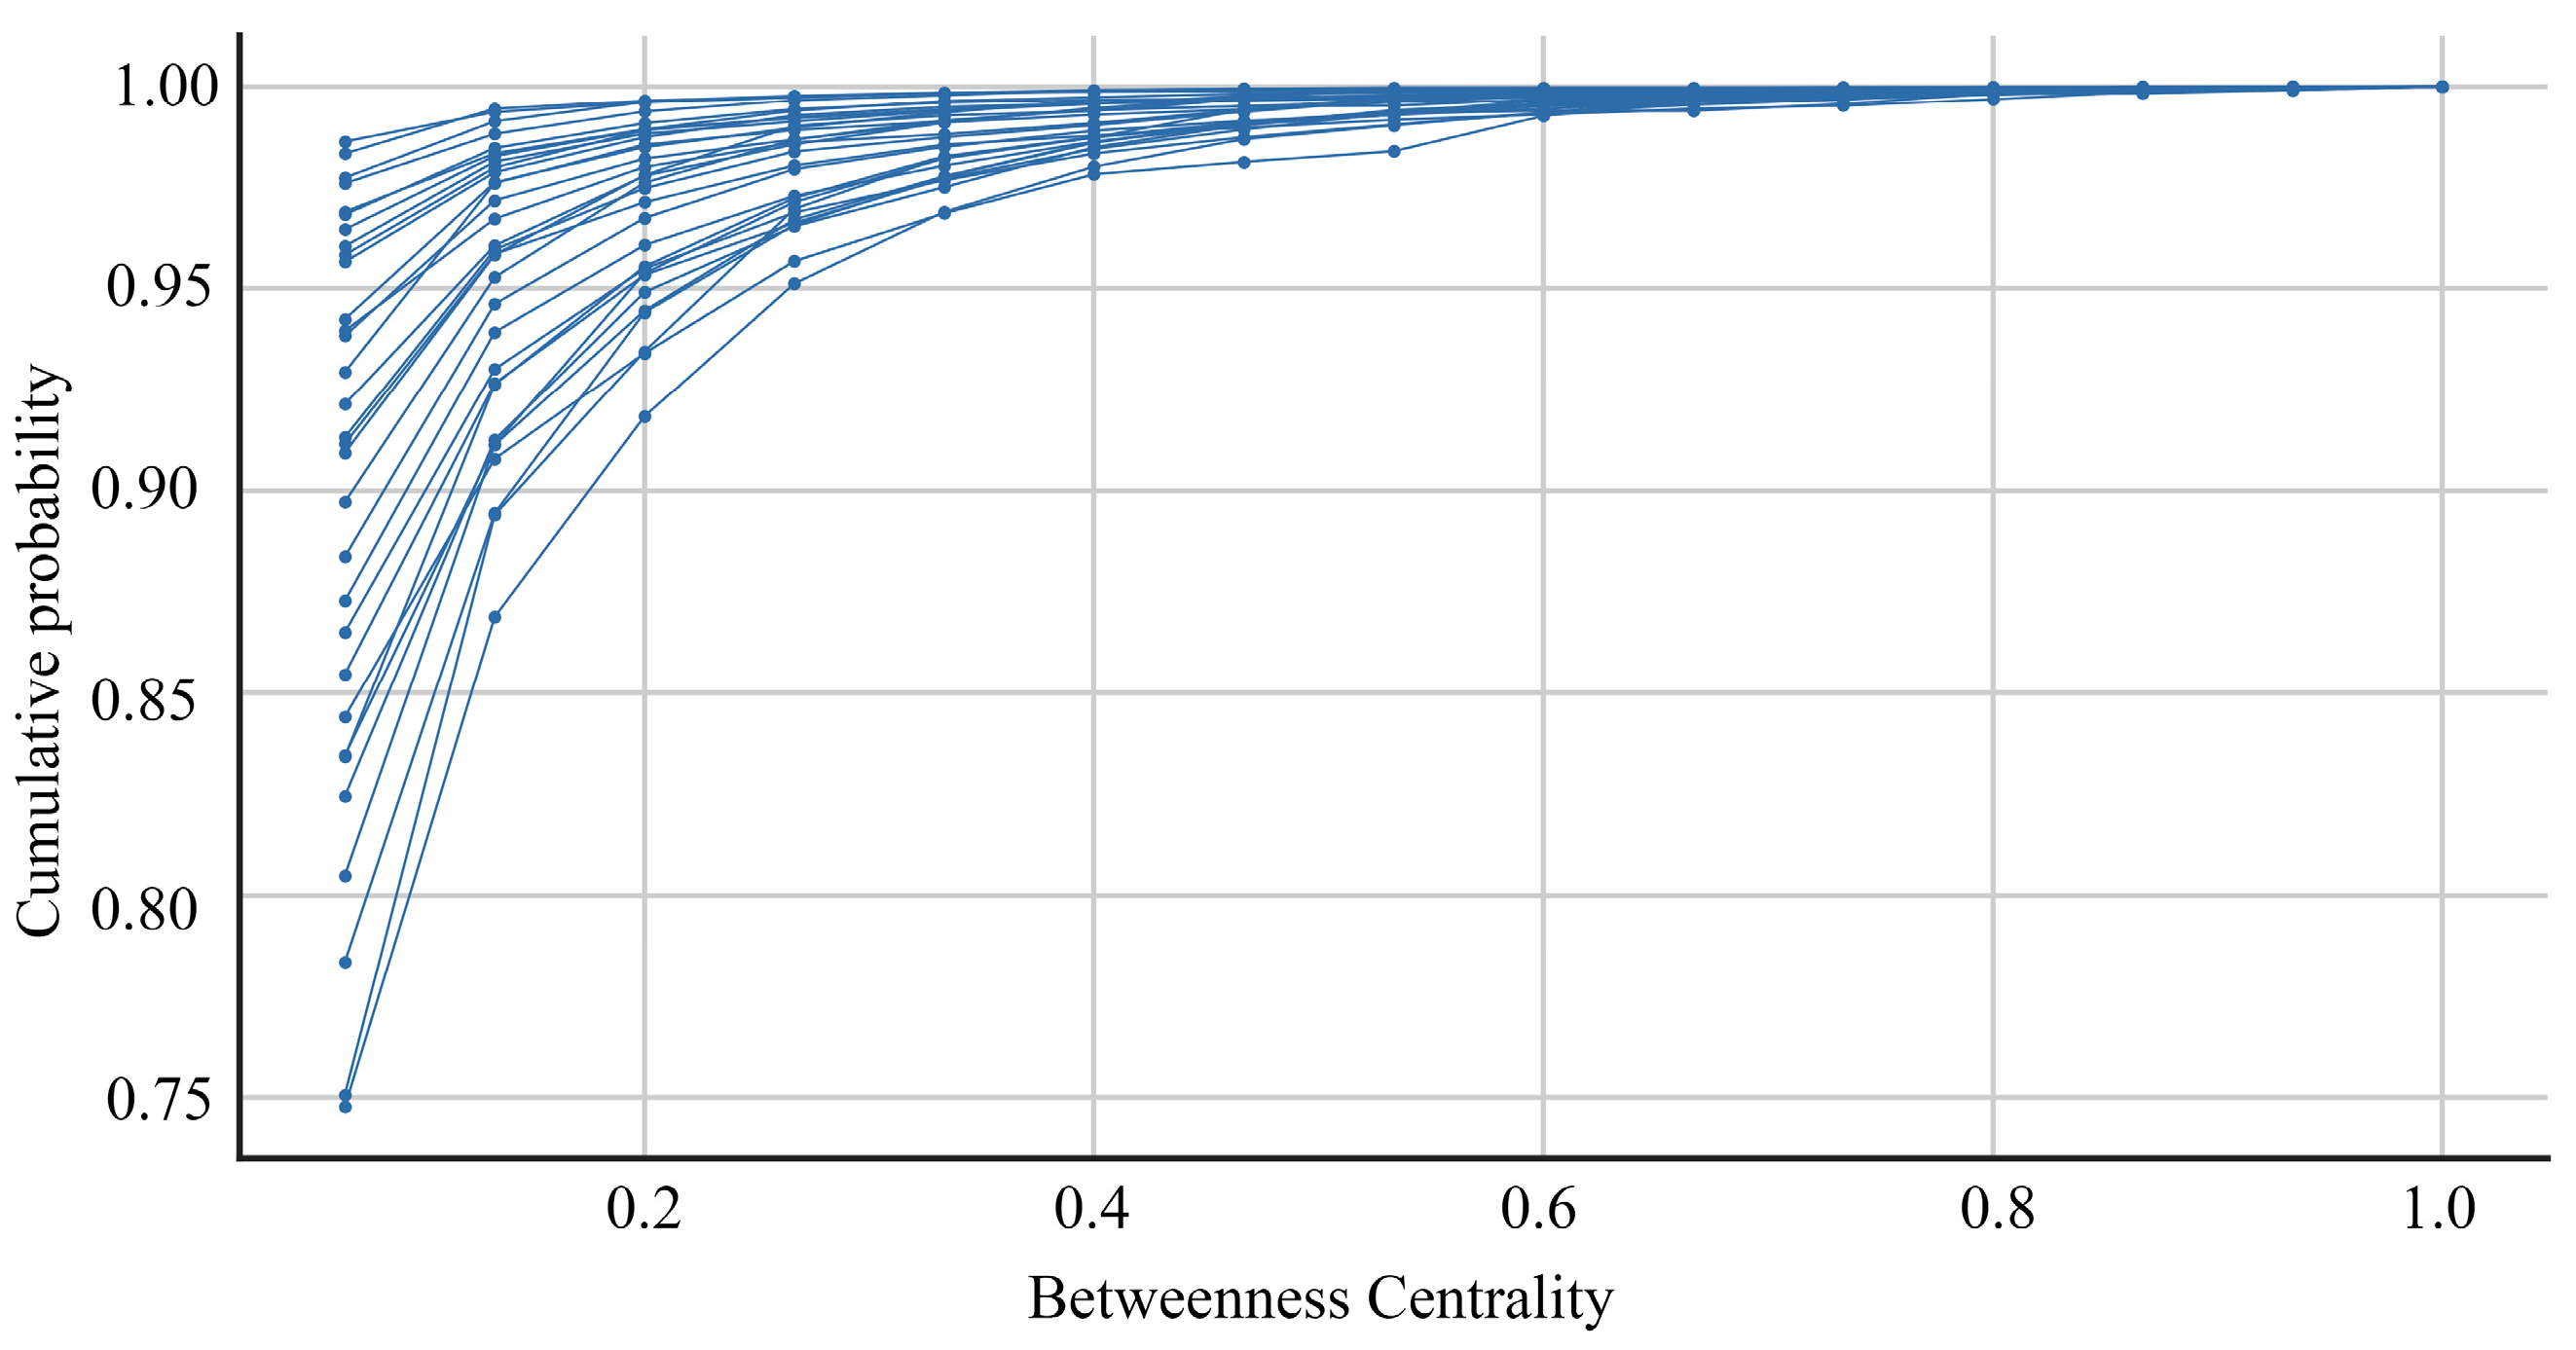
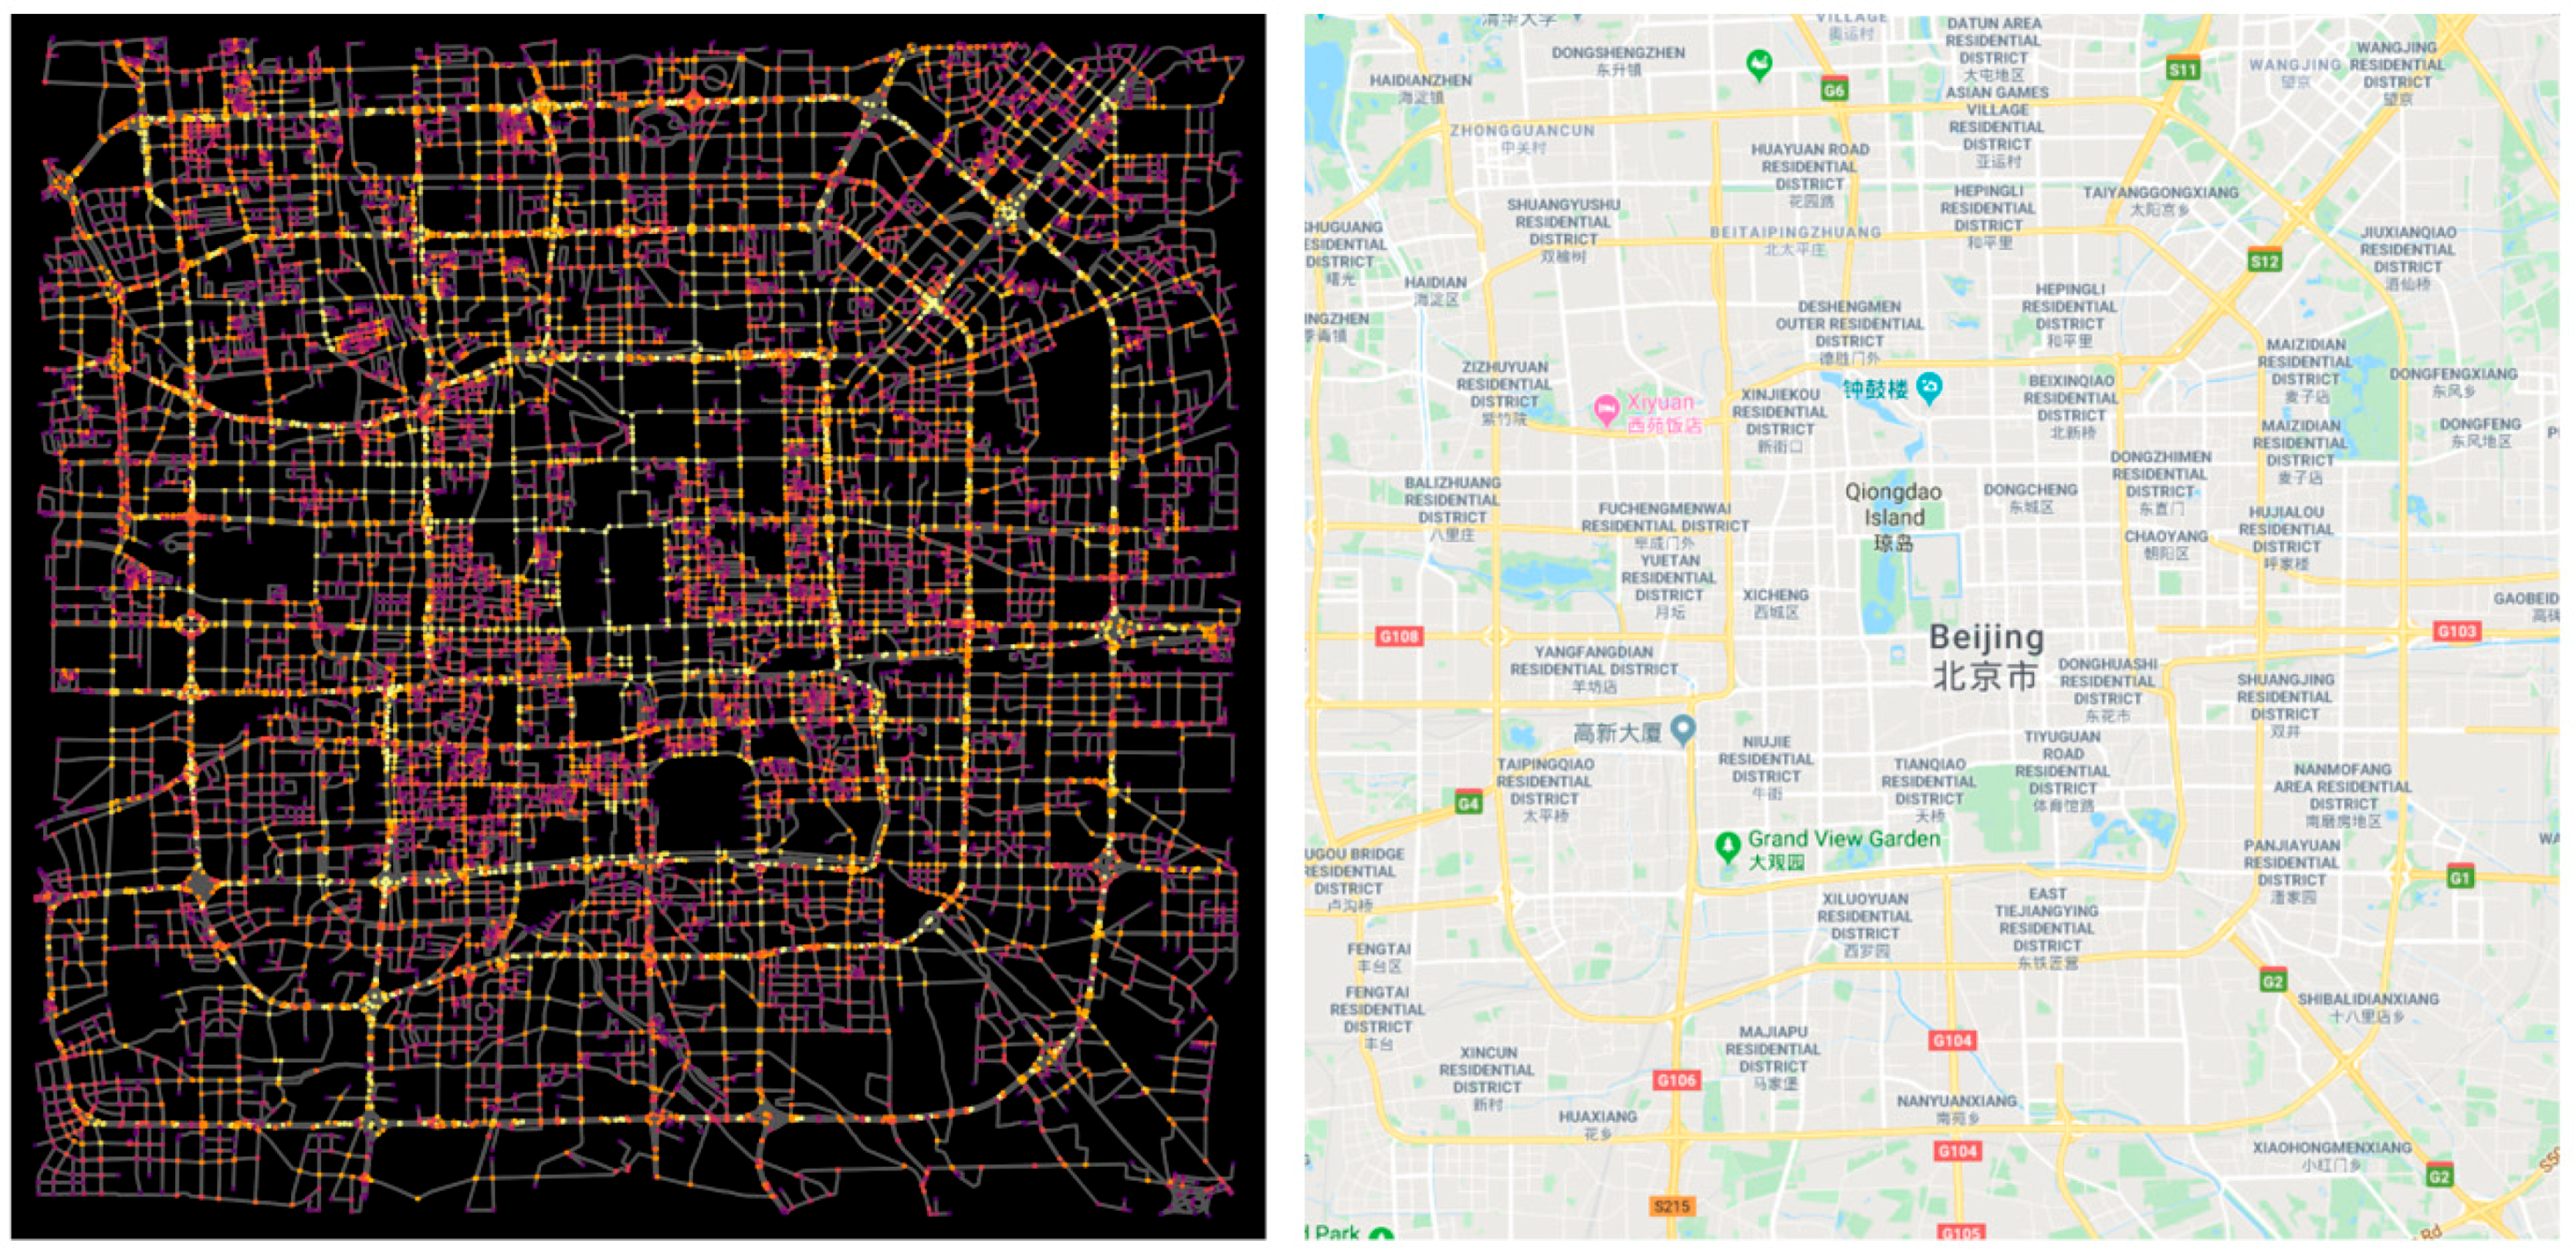
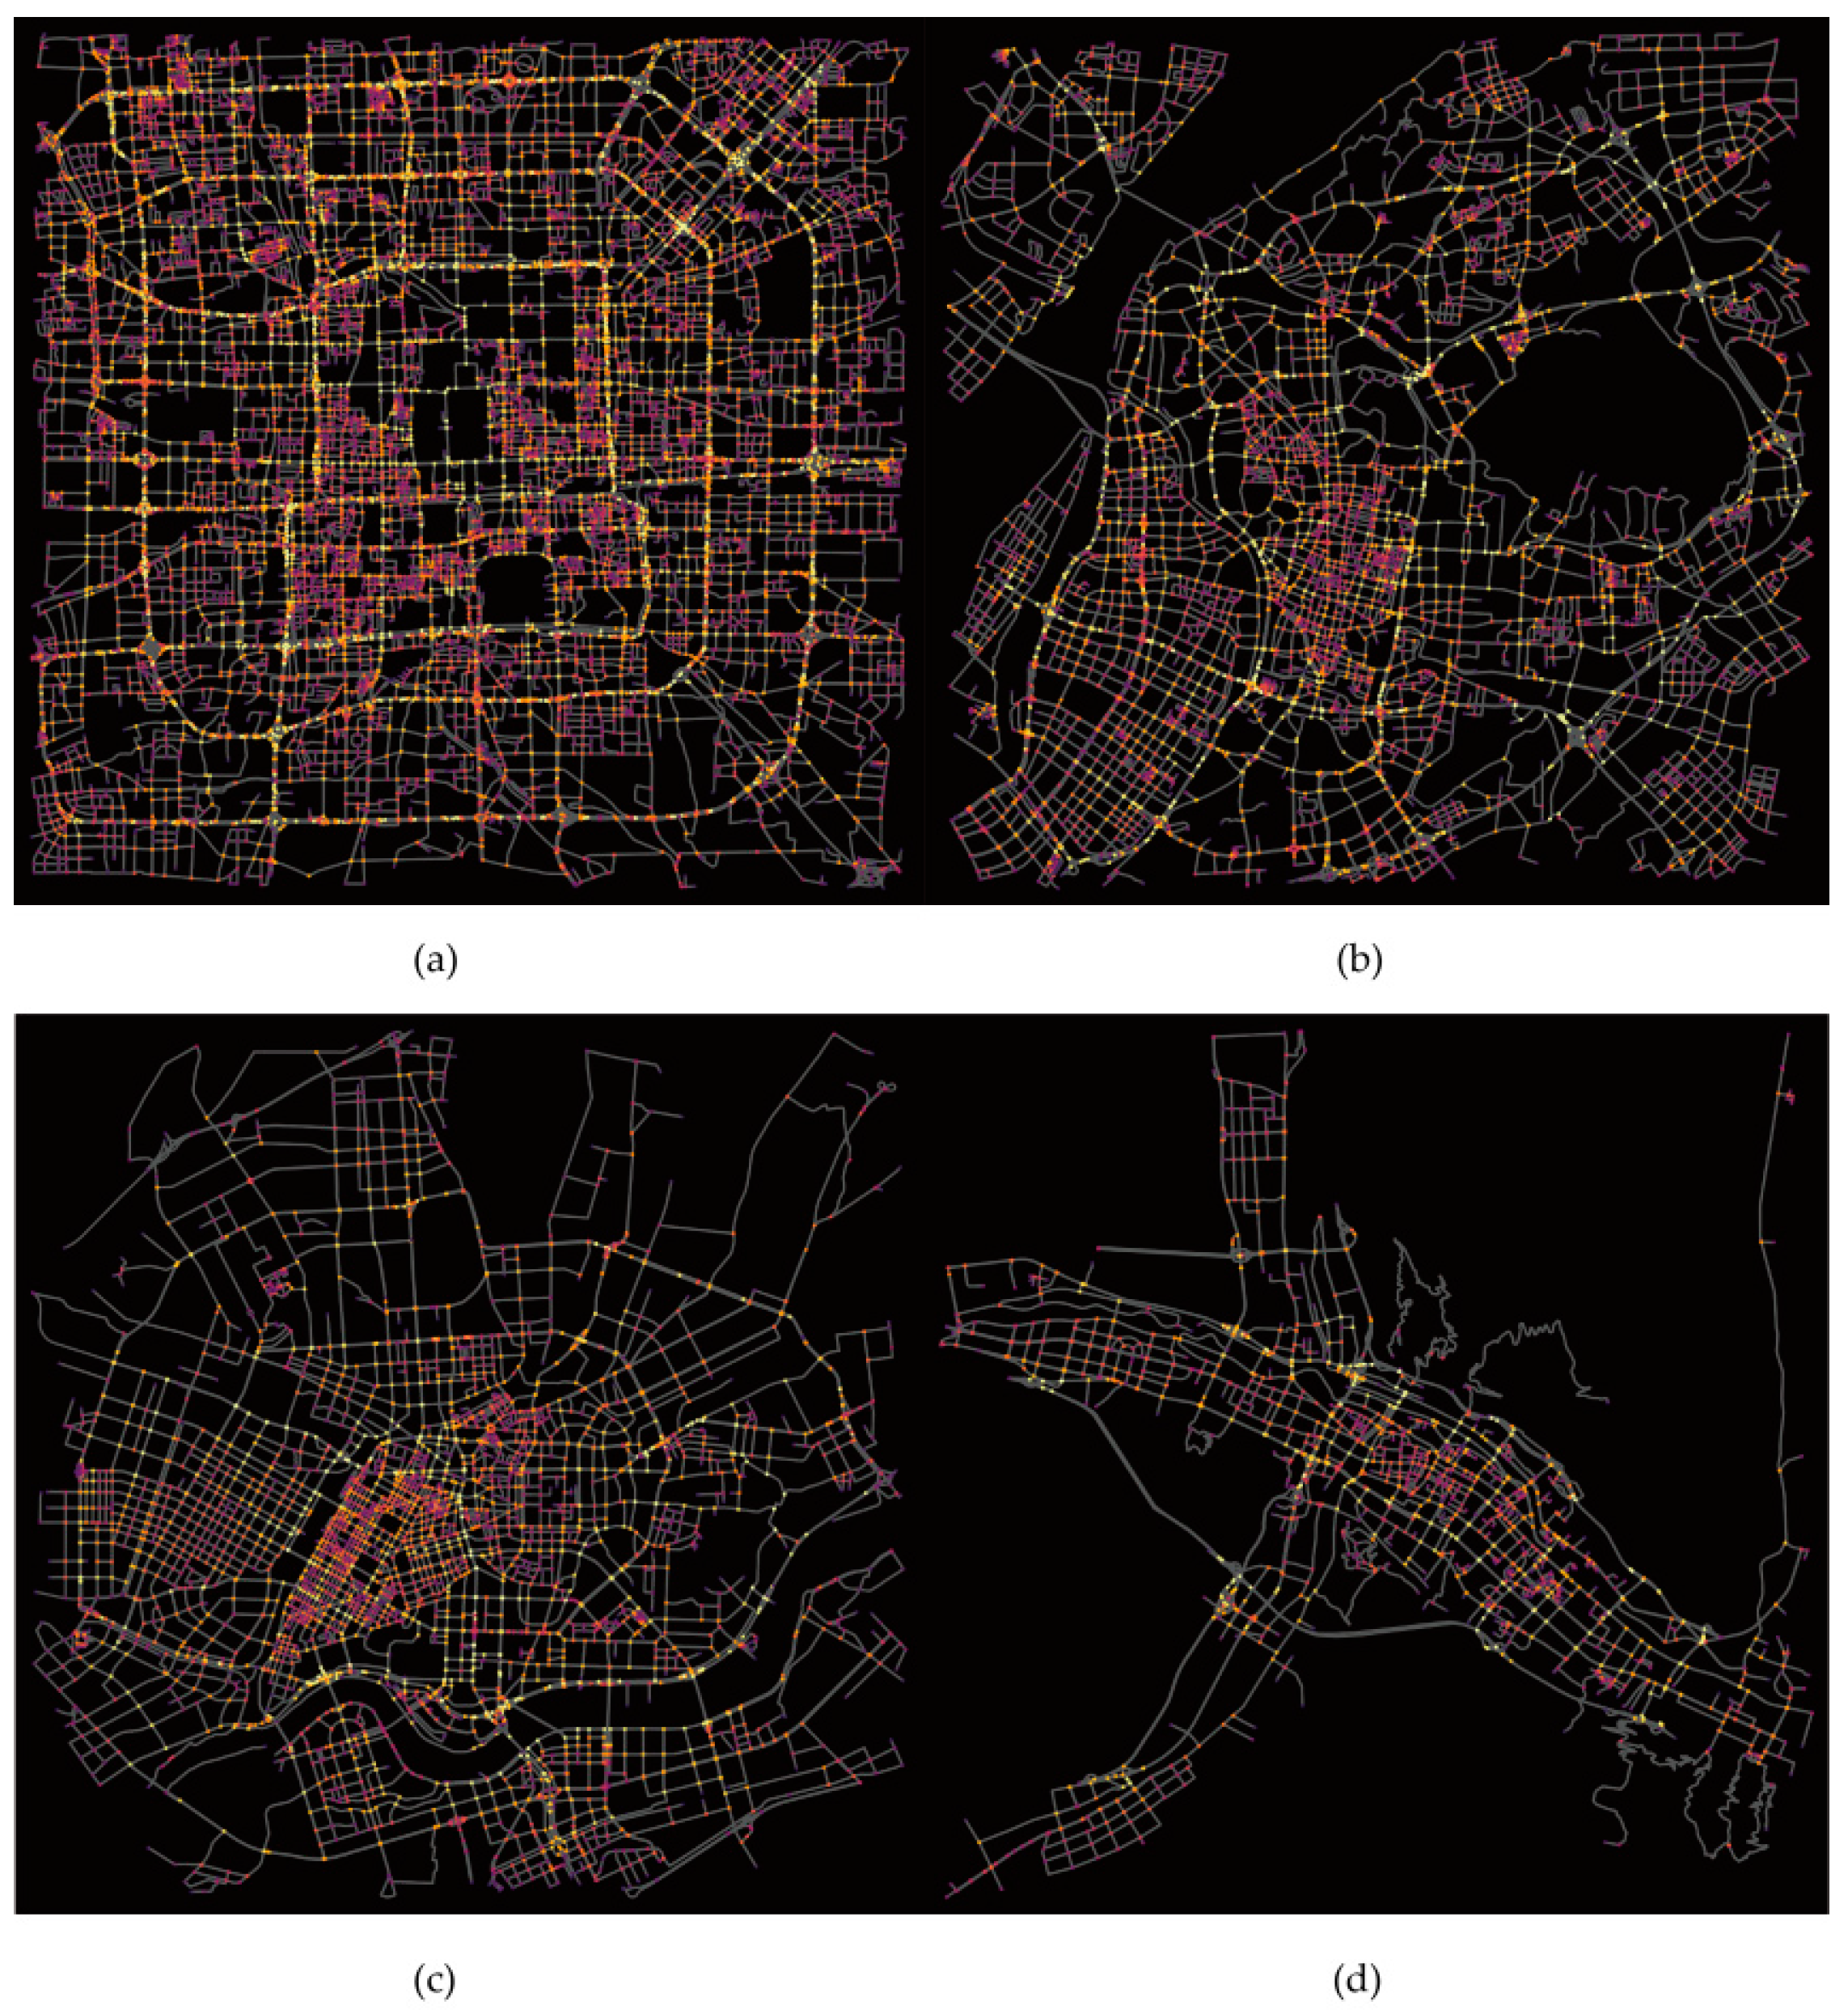
4.2.1. Betweenness Centrality of Street Networks

The distribution of the betweenness centrality of cities is shown in Figure 2. Obviously, there are significant differences in city structures. The curviness of a centrality cumulative distribution line indicates the extent to which the betweenness centrality of street network nodes is different in a city. The more curved a line is, the larger the difference in the street nodes’ betweenness centrality of a city. At the city scale, this difference could imply different morphological structures of cities. To measure the degree of difference in a city’s street nodes’ betweenness centrality, we applied the simple linear fitting method and calculated the slope of each distribution curve. We then employed the Natural Breaks (Jenks) classification method to the slope set and classified the cities into different types based on the morphological structures of their street network (Appendix A Table A2). Four main morphological structure types were identified. Typical city street structure types, as follows, are shown in Appendix A Figure A4.
  • Rectangular grid: Eight cities including Beijing and Chengdu fall into this type. The typical characteristics of these cities are that the distribution curve is gentle and the slope value is more than 0.95, the street network is a rectangular grid, the density of road nodes is high, and the average street length is relatively long.
  • Multiple group rectangular grid: Seven cities including Nanjing, Chongqing, and Wuhan are in this group. The common characteristics of these cities are that the range of slope value is equal to or less than 0.95 while more than 0.9, the spatial distribution of the street networks presents multiple rectangular grid groups, and the density of street intersections is high.
  • Circle shape grid: Shenyang and six other cities are classified into this group. The typical characteristics of these cities are that the range of slope value is equal to or less than 0.9 while more than 0.85, the morphological structure of the city presents a circle shape grid, and the average street length is short.
  • Strips grid: Cities including Xining, Yinchuan, and Lanzhou are classified into this type. The common characteristics of cities of this type are that the range of slope values is equal to or less than 0.85, the form of street network presents a strip shape, and the average street length is relatively long compared with cities classified in the other types.

4.2.2. Closeness Centrality of Street Networks

In a street network, the areas where nodes are more concentrated will have higher values of closeness centrality. The spatial distribution of street nodes’ closeness centrality values can, therefore, shed light on the patterns of city centers. We use the cumulative probability distribution of closeness centrality to examine whether a city has city centers or not. That is, if closeness centrality values are uniformly distributed, the number of nodes in any range of closeness values will be equal. As such, the cumulative probability distribution should be a straight line where x-axis values are always equal to y-axis values. As shown in Figure 3, all of the studied cities are polycentric. However, how multiple city centers are distributed within the cities differs. We also use the slope value of 1 to divide studied cities into two types (Appendix A Table A3). The first type includes 11 cities with slope values that are more than 1. The spatial distributions of these cities’ street network centers are continuously homogeneous and typical city streets are shown in Appendix A Figure A5. Xi’an is a typical representative of this city type. The second type includes 20 cities, such as Nanjing and Wuhan, which have slope values less than 1. The spatial distributions of these cities’ street network centers are discrete heterogeneous.

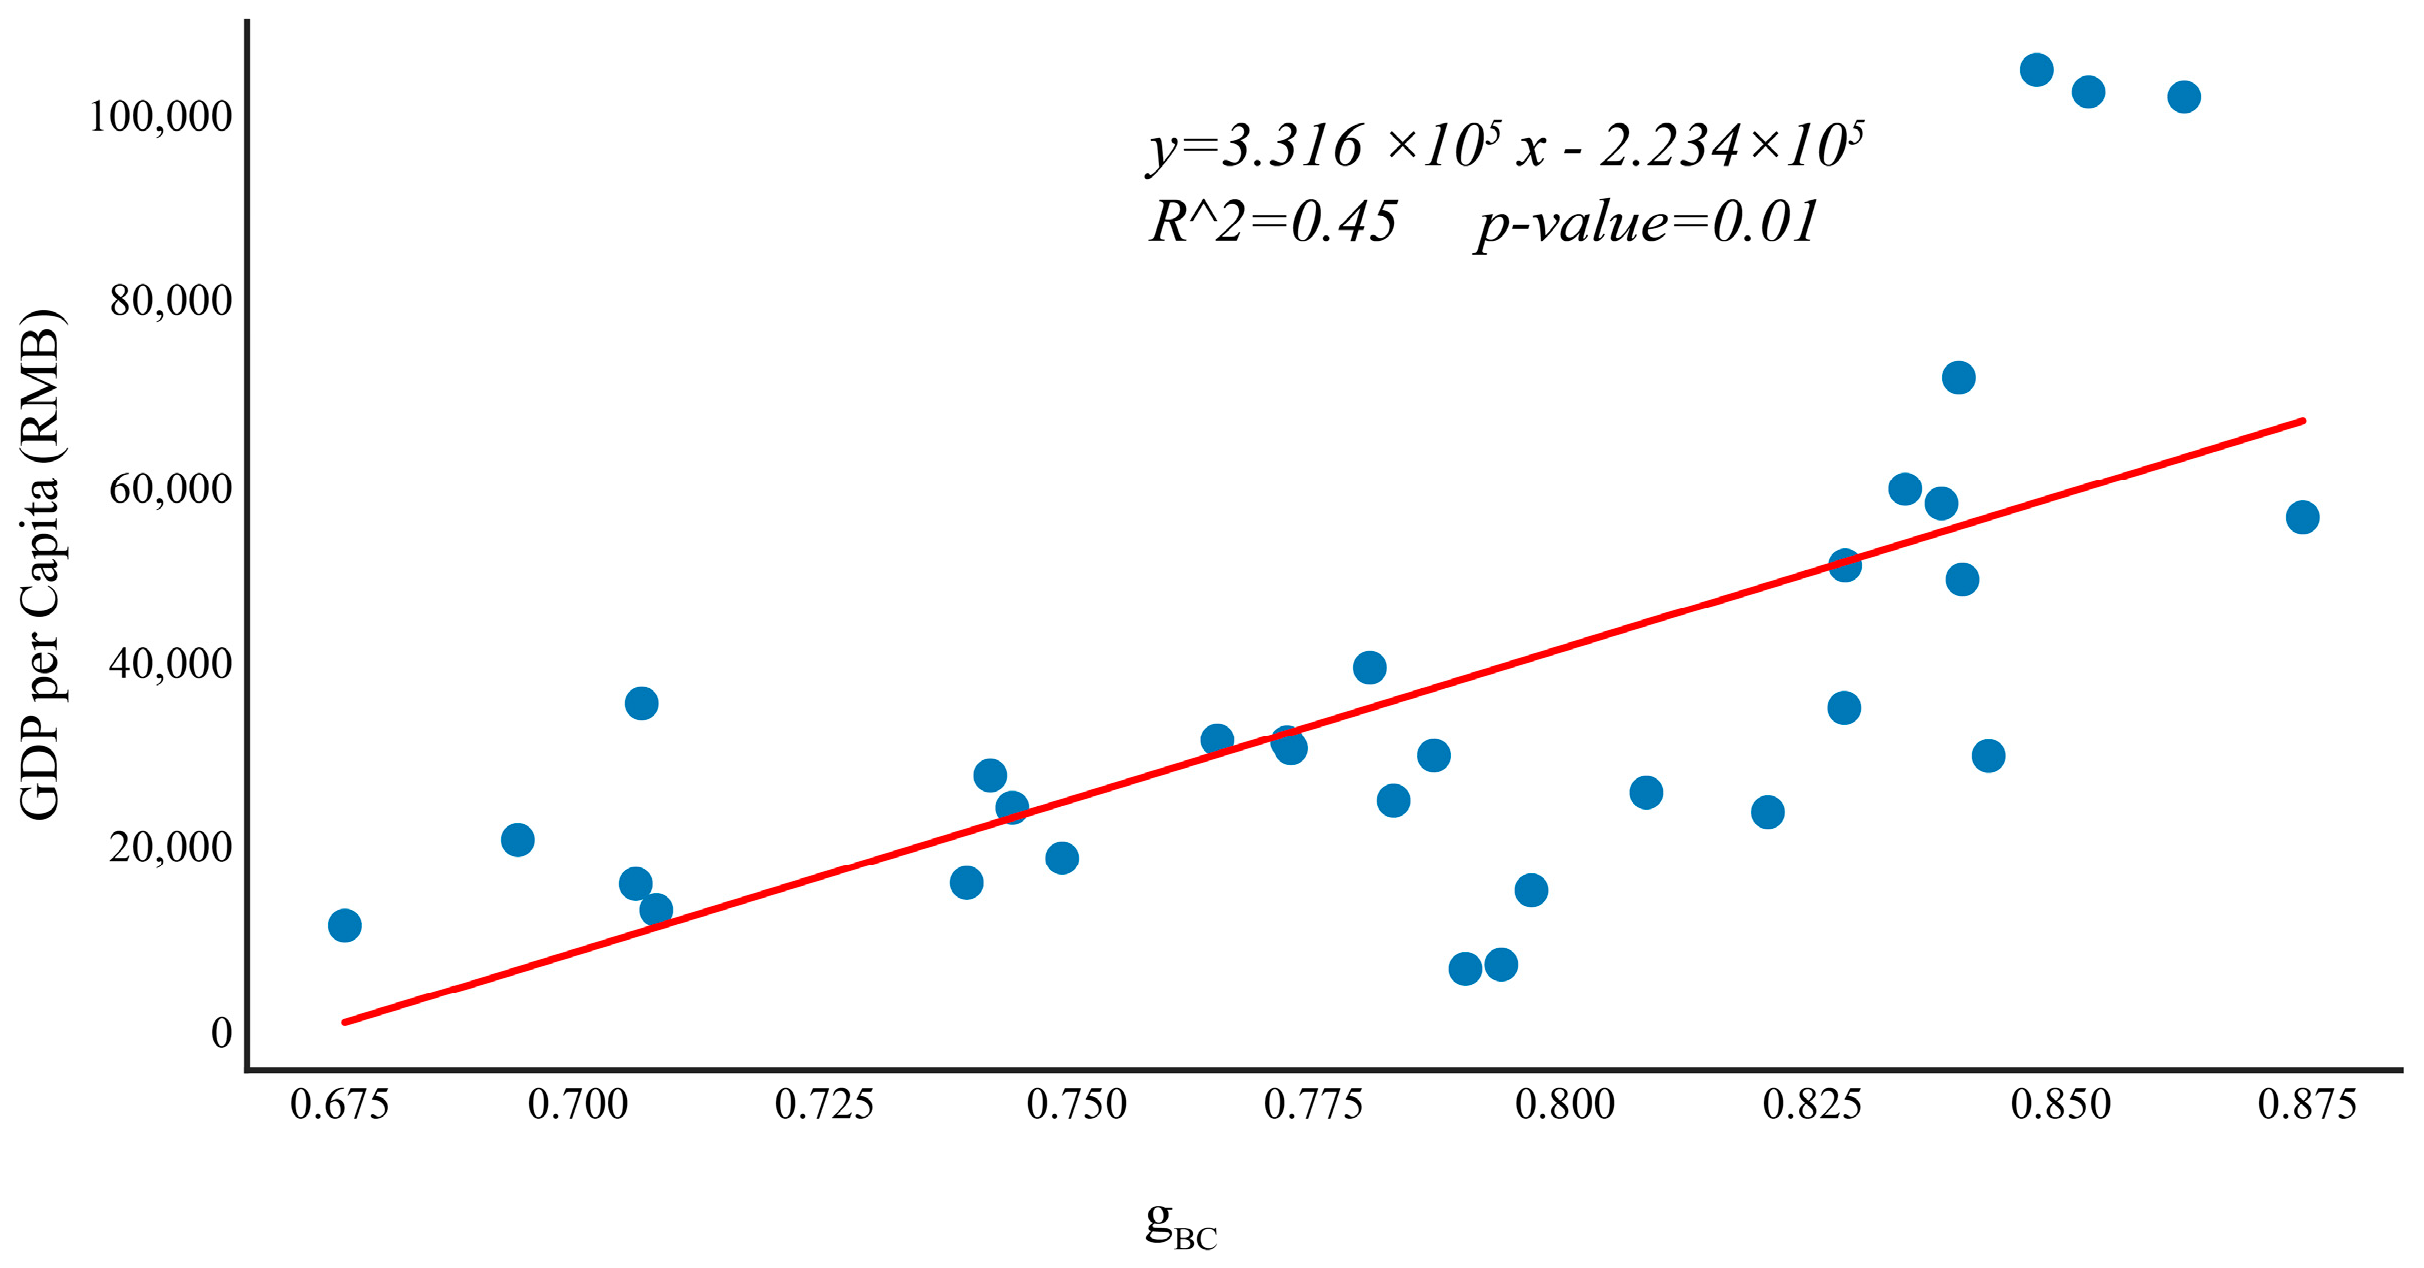
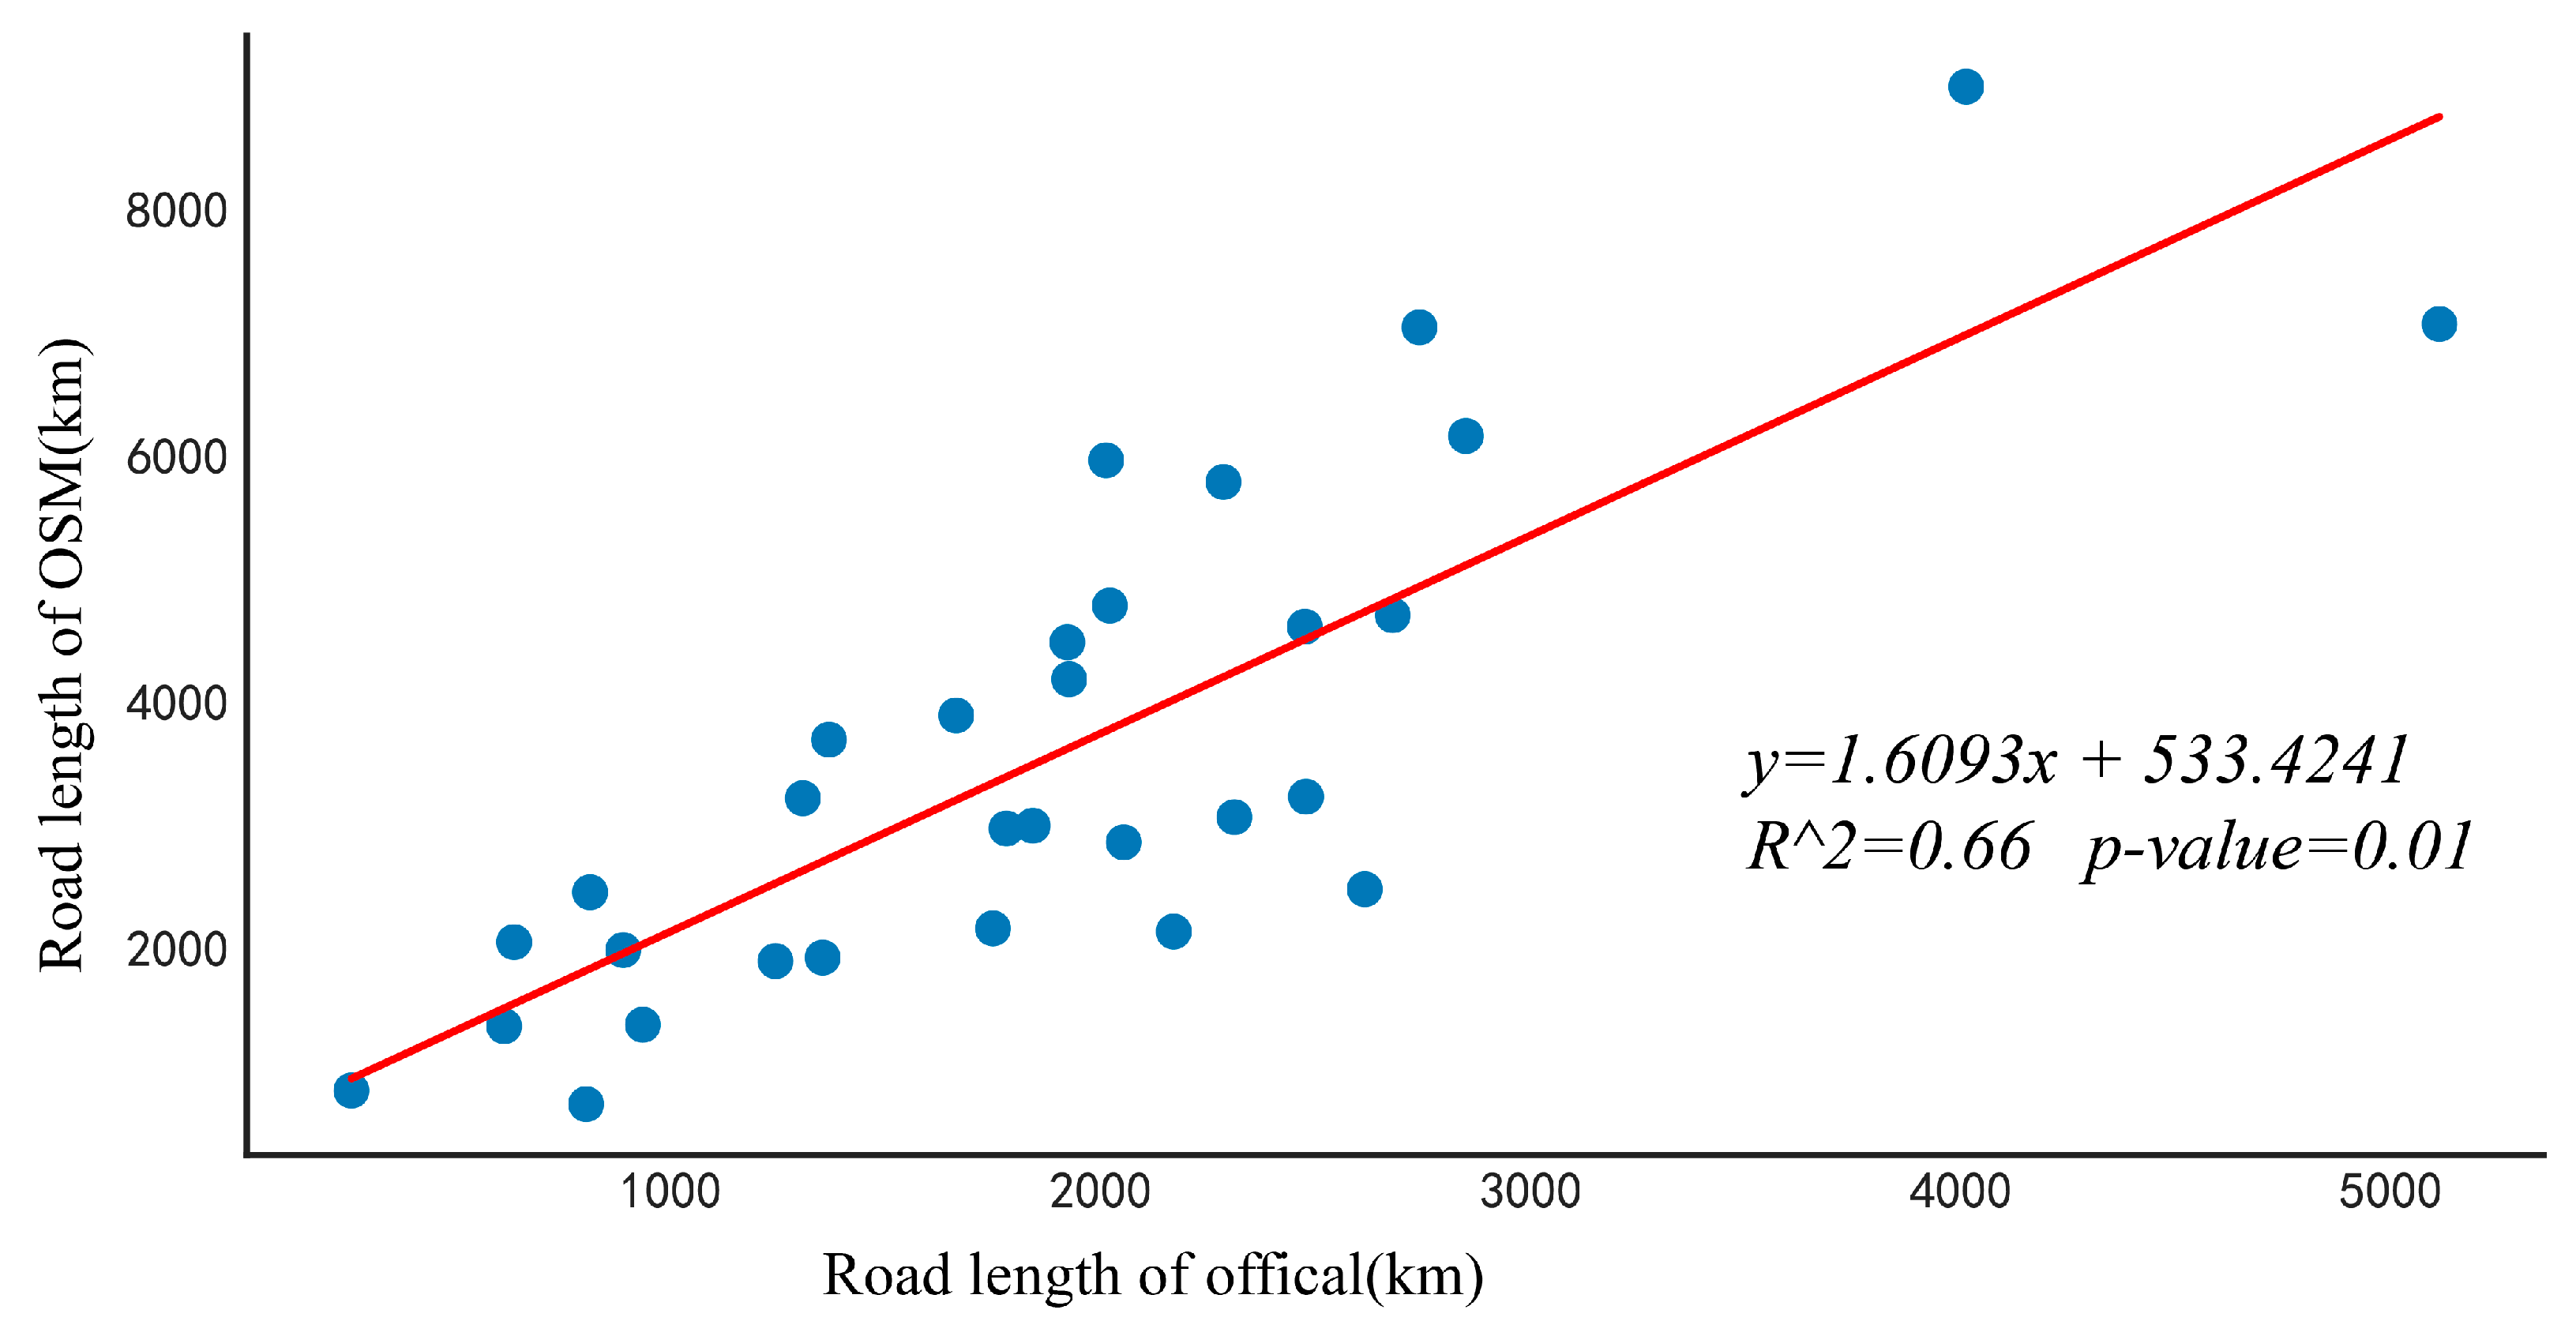
4.3. Relationship between a Street Network and Economic Development

We then investigated the relationship between the morphology and structure of a city’s street networks and the city’s economic development by comparing the HCA clustering results with GDP and population of the cities in the study with the division of Chinese major economic regions. Studied cities were clustered based on the characteristics of their street network’s morphology and structure using Gini coefficient analysis and HCA. The Gini coefficient is a commonly used measurement in the fields of economics and ecology for describing inequalities in the distributions of the given resource among the individuals of a population [54]. In this study, we calculated the Gini coefficient of a street network’s betweenness and closeness centrality to present the heterogeneity of the distribution of centrality among street nodes in a city. We then employed HCA based on the Gini coefficient of a street network’s centrality. The complete linkage method, based on the largest distance between cities in the different clusters, was applied in the HCA. By choosing a maximum distance equal to 0.6 for two cities to belong to the same cluster, we identified five clusters of cities (Figure 4).
We then used the 2016 GDP and population figures for each city to preliminarily analyze whether cities with similar street forms also have similar economic development levels. The cities were plotted by projecting GDP and population into the two-dimensional space, with x- and y-axes representing GDP and population, respectively (Figure 5). Each point in the figure represents a city, with its color representing the cluster the city belongs to, and its radius representing the area of the city. As shown in Figure 5, points with the same color are concentrated, indicating that these cities are similar in economic and population development.
We also compared the cluster results with China’s four major economic regions, which are divided by the China State Council based on the socio-economic development of the different regions [55,56]. These four regions are the eastern, central, western, and northeastern economic regions, respectively. Table 1 represents the results of the comparisons. In the table, cities that belong to each of the clusters are listed, with the economic region a city belongs to labeled as a superscript. The comparison results were as follows.
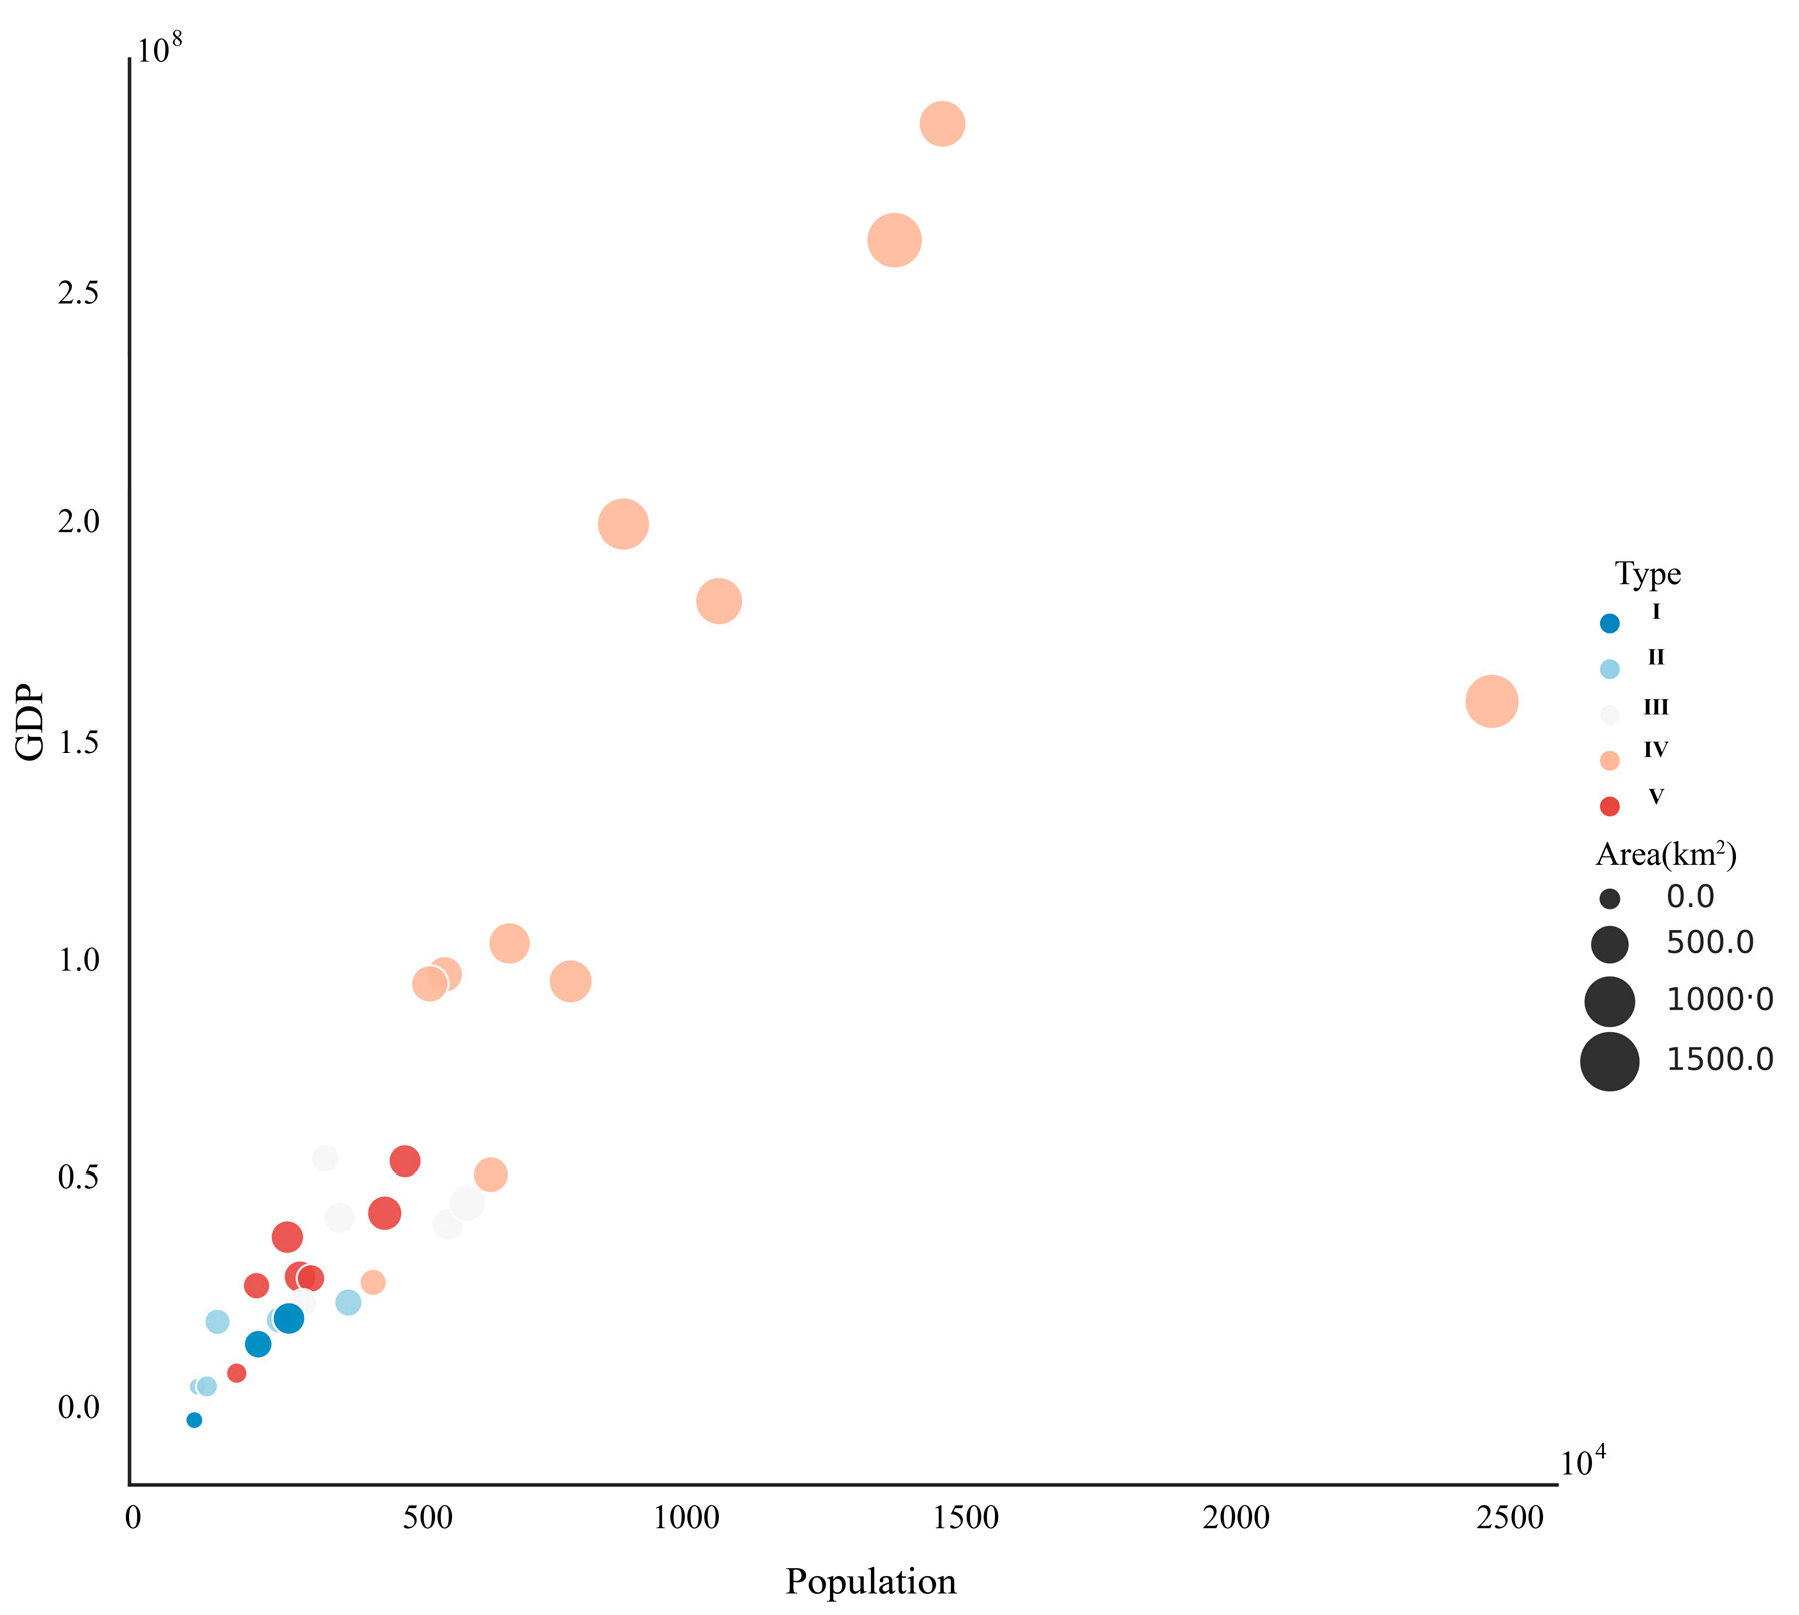
  • The first cluster includes three cities: Lhasa, Lanzhou, and Urumchi. All cities in this cluster are located in western China and belong to the western economic region. In general, cities in the western economic region have lower economic development levels than cities in the other three regions. However, the region is a major energy industry development area in China and has formed a good economic growth pole. In this cluster, the street networks of cities are either strip-shaped or have multiple discrete heterogeneous centers. Moreover, the density of street nodes is generally low, and the length of the average street segment is relatively long in all three cities.
  • The second cluster includes five cities from Hohhot to Yichuan. Cities in this cluster also belong to the western economic region. In this cluster, the street networks of Guiyang and Hohhot present the shape of a multiple group rectangular grid, while the street networks of the rest of the cities are strip-shaped.
  • The third cluster includes five cities from Taiyuan to Shenyang. Three of the five cities, other than Shenyang and Harbin, belong to the central economic region. Among the four regions, cities in the central economic region have the fastest economic growth rate. In this cluster, the street networks of most cities either have a shape with multiple group rectangular grids or have multiple discrete heterogeneous centers. Additionally, the density of nodes is high, and the length of the average street segment is long in these cities.
  • The fourth cluster consists of nine cities, including Beijing and Wuhan. Most of these cities are located in eastern China and belong to the eastern economic region, where economic development is more advanced than cities in other parts of China. The street networks of these cities either present the shape of a rectangular grid or have multiple discrete heterogeneous centers.
  • The fifth cluster consists of seven cities, including Hefei and Ji’nan. Among them, three cities belong to the eastern economic region, two cities belong to the central economic region, and the other two belong to the western and northeastern economic regions, respectively. Although cities in this cluster belong to different economic regions, the street network of most cities in this cluster either present the shape of a multiple group rectangular grid or have a multi-centered network structure with a continuous homogeneous distribution.
The above analysis suggests that cities’ street network structure can, to some extent, indicate economic development levels. To further validate the statistical significance of the observed relationship, a correlation analysis is applied to the GDP per capita and the Gini coefficient of street network centrality (Figure 6). Here we use GDP per capita index to eliminate the impact of city size on economic development. The results further confirm the relationship between street network structures and economic development level in that the Gini coefficient of street networks’ betweenness centrality is statistically significant for city economic development levels.

5. Discussion and Conclusions

This paper proposes a methodological framework that aims to quantitatively analyze city street network structure characteristics from a network perspective and to explore the relationship between cities’ economic development levels and the structural characteristics of their street networks. It makes two contributions to the existing body of literature. Methodologically, we have developed a framework for quantitatively analyzing the form and structure of the urban street network and for understanding its relationship to economic development based on complex network theory. The framework encompasses three steps of open data acquisition, modeling, and computation. The feasibility of the framework was validated by a case study of 31 provincial capital cities of China. The results show that the topological centrality index of street networks is effective for differentiating urban street morphological structures. In particular, the network shape and structure of a street network can be effectively depicted by the distribution of betweenness and closeness centrality values in the network and be quantified by the slope of the distribution curves of those values. Moreover, street morphological structures of a city can be used as indicators of the city’s economic development levels, as the case study suggests that cities with similar street network structures also have similar levels of economic development. The correlation analysis further confirms that the relationship between the characteristics of the urban street network and the economic development level is statistically significant. As such, this research provides a new perspective for understanding the association between street network structures and economic development and enriches the existing methods of studying urban street network and social-economic development in the big data era.
Empirically, we analyzed the shape and characteristics of the street networks in 31 cities and then explored the relationship between the morphological characteristics of these cities and their economic development levels. Based on the results from 31 cities, we can draw the following three conclusions: (1) In terms of street network morphology, the differences among the 31 provincial capital cities are significant. The cities can be divided into four main types, namely rectangular grid, multi-group grid, circular grid, and linear strip. The typical cities for the four types are Beijing, Nanjing, Shenyang, and Xining, respectively. (2) All urban street network structures are polycentric. According to the slope values and spatial distributions of the street networks’ topological measurements, the cities are classified into two main groups: continuous and discrete. The typical cities of the two groups are Xi’an and Wuhan, respectively. (3) The clustering results of 31 cities based on the shape and structural characteristics of their streets are close to the existing urban economic divisions in China, indicating that the urban street network shape and structure are related to the economic development level of a city.
It is well known that the development of the urban economy is affected by many factors. Understanding the causal relationship between city street network morphological structure and economic development is an important topic but is beyond the scope of this study. In this paper, we focused on whether the morphological structure of a city’s street network could indicate the level of urban economic development of that city, and whether we could utilize open data such as OSM for the timely monitoring of a city’s economic development level. With rapid urbanization, particularly in developing countries such as China, urban streets have been fast-changing and have become increasingly complex. Taking advantage of open data, which are often timelier in representing the dynamic urban environment than the traditional, less frequently updated statistical yearbook, could potentially provide a new avenue for evaluating and comparing cities’ economic development levels and could, therefore, support the development of cities’ master plans and regional development plans. The differences in the classification results based on city street network structure and the partition of economic regions also have implications that street networks derived from OSM data may, to a certain extent, better represent the current economic development levels of studied provincial cities, as the clustering results align better with the more recent GDP and population statistics published in 2016. The traditional partition of the economic region is according to geographical proximity and the demarcated level of economic development. After nearly a decade of development, significant changes have taken place and the economic development levels of cities within the same region may vary widely. For instance, in recent years, the economic development levels of cities such as Xi’an and Chengdu have been higher than those of other cities belonging to the western economic region and have almost reached the level of cities in the eastern economic region. As such, we believe that understanding cities’ economic development levels based on their current street network morphologies could, to a certain extent, shed light on the adjustment and revision of the partitions of Chinese economic regions.
Despite its contributions, this study has two limitations that could be addressed in future studies. First, the presented empirical study is limited by the study sample and by the economic data which are derived from the statistic yearbook. While the 31 provincial capital cities are represented in terms of their geographical diversity, they are limited in representing prefectural-level cities whose street structures may be different. In addition, the spatial units used for population and economic statistics in the statistical yearbook are relatively coarse, which may, to some extent, introduce uncertainties to the study results. Second, this study only accounts for the planar street network, while non-planar streets, such as overpasses, tunnels, and grade-separated expressways, are not considered. The lack of non-planar street attributes in OSM data does present limitations for this study. Incorporating non-planar attributes in building a street network has not been fully studied in the field of complex network science and is worthy of further exploration. Moreover, while this study focuses on street networks, they are only one type of basic transportation network. It is worthwhile to further explore if and how other urban infrastructure networks, such as public transportation networks and service infrastructure networks, and the combination of different networks may relate to economic development. A longitudinal analysis using the methods presented in this study may also provide further insight into the mechanisms underlying the association between transportation networks and economic development. Based on a better understanding of how urban infrastructure networks relate to economic development, we may further simulate and predict urban economic levels using machine-learning methods. Studies such as these would shed light on improving the efficiency of urban operations through rational decision-making for urban transportation and infrastructure planning.

Author Contributions

Conceptualization, Tashi LOBsang and Feng Zhen; data curation, Tashi LOBsang; funding acquisition, Feng Zhen; methodology, Tashi LOBsang and Shanqi Zhang; writing—original draft, Tashi LOBsang; writing—review and editing, Shanqi Zhang. All authors have read and agreed to the published version of the manuscript.

Funding

This research was supported by the National Natural Science Foundation of China (Grant No. 41571146).

Acknowledgments

The authors wish to acknowledge the anonymous reviewers for their insightful comments.

Conflicts of Interest

The authors declare no conflicts of interest.

Appendix A

Figure A1. The spatial distribution of Beijing street networks’ node betweenness centrality. The brighter the color, the higher the value. From the comparison of the map, it can be seen that the high-value points are mainly distributed at the intersections of major ring roads and intersections in Beijing.
Ijgi 09 00003 g0a1
Figure A2. The spatial distribution of the studies cities.
Ijgi 09 00003 g0a2
Figure A3. The cities road length relationship between OSM data and official data.
Ijgi 09 00003 g0a3
Table A1. Basic properties of the street spatial graphs of different China cities.
CityNodes <N>Edge <L>Avg_length (m)Inter_Density (km2)
Beijing54,264130,192336.0533.10
Guangzhou41,32290,250279.7128.47
Shanghai39,39296,957346.4733.95
Tianjin37,50389,817394.8631.12
Chengdu27,10667,326310.4428.18
Chongqing25,12356,480629.5515.26
Hangzhou23,39756,169375.1435.67
Wuhan23,25153,693378.5433.33
Xi’an21,33054,695361.3833.54
Nanjing18,68346,329420.6220.99
Shijiazhuang13,77437,988308.6941.42
Changchun12,10529,327387.3320.22
Ji’nan985723,026445.7219.21
Changsha948821,079330.8125.24
Shenyang898522,102504.0913.66
Kunming898120,213413.3017.47
Hefei883919,371296.0917.69
Nanchang821718,182365.8723.05
Zhengzhou791618,349347.3816.52
Harbin712517,847519.0014.47
Fuzhou557912,120375.0316.85
Taiyuan545211,273369.0714.59
Guiyang50189942541.3514.45
Hohhot467610953364.4514.59
Nanning44079586674.4612.12
Haikou28425778294.5018.10
Lhasa22895288440.4718.87
Xining16393523439.4117.34
Urumchi152538751005.192.93
Lanzhou97922801017.412.36
Yinchuan7631926571.263.72
Table A2. The results of city morphological types classified by the street network betweenness distribution.
TypeCitySlopeCharacteristic
ABeijing, Chengdu, Shijiazhuang, Guangzhou, Hangzhou, Shanghai, Tianjin, Xi’an>0.95Traffic network form presents a rectangular grid, high density of road node, and longer street average
BNanjing, Chongqing, Wuhan, Changsha, Changchun, Fuzhou, Haikou, Jinan, Kunming, Hefei(0.9, 0.95)Traffic network form presents multiple group rectangular grid, high density of road node, and longer street average
CShenyang, Guiyang, Harbin, Hohhot, Nanchang, Zhengzhou(0.85, 0.9)Traffic network form presents multiple group rectangular grid, high density of road node, and longer street average
DXining, Yinchuan, Urumqi, Lanzhou, Lhasa, Nanning, Taiyuan<=0.85Traffic network form presents strips, low density of road node, and longer street average
Table A3. The result of city structure types classified by the street network closeness distribution.
TypeCitySlopeCharacteristic
AXi’an, Shijiazhuang, Jinan, Tianjin, Guangzhou, Shanghai, Haikou, Fuzhou, Zhengzhou, Kunming, Xining>=1Multi-center network structure, continuous homogeneous distribution
BChongqing, Yinchuan, Chengdu, Nanjing, Hefei, Changsha, Hohhot, Nanchang, Nanning, Urumqi, Hangzhou, Lhasa, Guiyang, Shenyang, Changchun, Beijing, Harbin, Lanzhou, Taiyuan, Wuhan<1Multi-center network structure, discrete heterogeneous distribution
Figure A4. Road network betweenness centrality map: (a) Beijing, (b) Nanjing, (c) Shenyang, and (d) Xining.
Ijgi 09 00003 g0a4
Figure A5. Road network closeness centrality distribution: (a) Xi’an and (b) Wuhan.
Ijgi 09 00003 g0a5

References

  1. Tian, Z.; Jia, L.; Dong, H.; Su, F.; Zhang, Z. Analysis of Urban Road Traffic Network Based on Complex Network. Procedia Eng. 2016, 137, 537–546. [Google Scholar] [CrossRef] [Green Version]
  2. Jin, F.; Wang, C.; Cao, Y.; Cao, X.; Wang, J.; Dai, T.; Jiao, J. Progress of research on transportation geography in China. J. Geogr. Sci. 2016, 26, 1067–1080. [Google Scholar] [CrossRef]
  3. Hodgson, C. The effect of transport infrastructure on the location of economic activity: Railroads and post offices in the American West. J. Urban Econ. 2018, 104, 59–76. [Google Scholar] [CrossRef]
  4. Lakshmanan, T.R. The broader economic consequences of transport infrastructure investments. J. Transp. Geogr. 2011, 19, 1–12. [Google Scholar] [CrossRef]
  5. Hallett, G. Urban Spatial Structure. In Urban Land Economics; Palgrave Macmillan: London, UK, 2015; Volume 21501, pp. 97–124. [Google Scholar]
  6. Linneker, B.; Spence, N. Road transport infrastructure and regional economic development: The regional development effects of the M25 London orbital motorway. J. Transp. Geogr. 1996, 4, 77–92. [Google Scholar] [CrossRef]
  7. Javier, G. Location, economic potential and daily accessibility: An analysis of the accessibility impact of the high-speed line Madrid–Barcelona–French border. J. Transp. Geogr. 2001, 9, 229–242. [Google Scholar]
  8. Pradhan, R.P.; Bagchi, T.P. Effect of transportation infrastructure on economic growth in India: The VECM approach. Res. Transp. Econ. 2013, 38, 139–148. [Google Scholar] [CrossRef]
  9. Rokicki, B.; Stępniak, M. Major transport infrastructure investment and regional economic development—An accessibility-based approach. J. Transp. Geogr. 2018, 72, 36–49. [Google Scholar] [CrossRef]
  10. Shi, Y.; Guo, S.; Sun, P. The role of infrastructure in China’s regional economic growth. J. Asian Econ. 2017, 49, 26–41. [Google Scholar] [CrossRef]
  11. Melo, P.C.; Graham, D.J.; Brage-Ardao, R. The productivity of transport infrastructure investment: A meta-analysis of empirical evidence. Reg. Sci. Urban Econ. 2013, 43, 695–706. [Google Scholar] [CrossRef] [Green Version]
  12. Meersman, H.; Nazemzadeh, M. The contribution of transport infrastructure to economic activity: The case of Belgium. Case Stud. Transp. Policy 2017, 5, 316–324. [Google Scholar] [CrossRef]
  13. Yu, N.; de Jong, M.; Storm, S.; Mi, J. Spatial spillover effects of transport infrastructure: Evidence from Chinese regions. J. Transp. Geogr. 2013, 28, 56–66. [Google Scholar] [CrossRef]
  14. Rosik, P.; Stepniak, M.; Komornicki, T. The decade of the big push to roads in Poland: Impact on improvement in accessibility and territorial cohesion from a policy perspective. Transp. Policy 2015, 37, 134–146. [Google Scholar] [CrossRef]
  15. Xie, F.; Levinson, D. Modeling the growth of transportation networks: A comprehensive review. Networks Spat. Econ. 2009, 9, 291–307. [Google Scholar] [CrossRef] [Green Version]
  16. Tsiotas, D.; Polyzos, S. The topology of urban road networks and its role to urban mobility. Transp. Res. Procedia 2017, 24, 482–490. [Google Scholar] [CrossRef]
  17. Wang, F.; Chen, C.; Xiu, C.; Zhang, P. Location analysis of retail stores in Changchun, China: A street centrality perspective. Cities 2014, 41, 54–63. [Google Scholar] [CrossRef]
  18. Zhen, F.; Cao, Y.; Qin, X.; Wang, B. Delineation of an urban agglomeration boundary based on Sina Weibo microblog ‘check-in’ data: A case study of the Yangtze River Delta. Cities 2017, 60, 180–191. [Google Scholar] [CrossRef]
  19. Qin, X.; Zhen, F.; Zhu, S.J. Centralisation or decentralisation? Impacts of information channels on residential mobility in the information era. Habitat Int. 2016, 53, 360–368. [Google Scholar] [CrossRef]
  20. Batty, M. Big data, smart cities and city planning. Dialogues Hum. Geogr. 2013, 3, 274–279. [Google Scholar] [CrossRef]
  21. Newman, M.E.J. The Structure and Function of Complex Networks. SIAM Rev. 2005, 45, 167–256. [Google Scholar] [CrossRef] [Green Version]
  22. Barthélemy, M. Spatial Networks; Phys. Rep.; Springer: New York, NY, USA, 2014; Volume 499, pp. 1967–1976. [Google Scholar]
  23. Cardillo, A.; Scellato, S.; Latora, V.; Porta, S. Structural properties of planar graphs of urban street patterns. Phys. Rev. E 2006, 73, 066107. [Google Scholar] [CrossRef] [PubMed] [Green Version]
  24. Asami, Y.; Istek, C. Characterization of the street networks in the traditional Turkish urban form. Environ. Plan. B Plan. Des. 2001, 28, 777–795. [Google Scholar] [CrossRef]
  25. Duan, Y.; Lu, F. Structural robustness of city road networks based on community. Comput. Environ. Urban Syst. 2013, 41, 75–87. [Google Scholar] [CrossRef]
  26. Security, E.I. Office IT Standard: Secure System Development Life Cycle. Environ. Plan. B Urban Anal. City Sci. 2017, 369, 1–5. [Google Scholar]
  27. Crucitti, P.; Latora, V.; Porta, S. Centrality measures in spatial networks of urban streets. Phys. Rev. E 2006, 73, 036125. [Google Scholar] [CrossRef] [PubMed] [Green Version]
  28. Jiang, B. A topological pattern of urban street networks: Universality and peculiarity. Phys. A Stat. Mech. Its Appl. 2007, 384, 647–655. [Google Scholar] [CrossRef] [Green Version]
  29. Liu, X.; Long, Y. Automated Identification and Characterization of Parcels (AICP) with OpenStreetMap and Points of Interest. Environ. Plan. B Plan. Des. 2006, 43, 341–360. [Google Scholar] [CrossRef]
  30. Jokar Arsanjani, J.; Helbich, M.; Bakillah, M.; Loos, L. The emergence and evolution of OpenStreetMap: A cellular automata approach. Int. J. Digit. Earth 2015, 8, 74–88. [Google Scholar] [CrossRef]
  31. Boeing, G. OSMnx: New methods for acquiring, constructing, analyzing, and visualizing complex street networks. Comput. Environ. Urban Syst. 2017, 65, 126–139. [Google Scholar] [CrossRef] [Green Version]
  32. Domingues, G.S.; Silva, F.N.; Comin, C.H.; Da Costa, L.F. Topological characterization of world cities. J. Stat. Mech. Theory Exp. 2018, 2018, 083212. [Google Scholar] [CrossRef] [Green Version]
  33. Porta, S.; Strano, E.; Iacoviello, V.; Messora, R.; Latora, V.; Cardillo, A.; Wang, F.; Scellato, S. Street centrality and densities of retail and services in Bologna, Italy. Environ. Plan. B Plan. Des. 2009, 36, 450–465. [Google Scholar] [CrossRef] [Green Version]
  34. Cardillo, A.; Wang, F.; Latora, L.; Rueda, S.; Scellato, S.; Càrdenas, F.; Belli, E.; Porta, S.; Latora, V.; Strano, E.; et al. Street Centrality and the Location of Economic Activities in Barcelona. Urban Stud. 2011, 49, 1471–1488. [Google Scholar]
  35. Lin, G.; Chen, X.; Liang, Y. The location of retail stores and street centrality in Guangzhou, China. Appl. Geogr. 2018, 100, 12–20. [Google Scholar] [CrossRef]
  36. Liu, Y.; Wei, X.; Jiao, L.; Wang, H. Relationships between street centrality and land use intensity in Wuhan, China. J. Urban Plan. Dev. 2016, 142, 05015001. [Google Scholar] [CrossRef]
  37. Spadon, G.; Gimenes, G.; Rodrigues, J.F. Topological street-network characterization through feature-vector and cluster analysis. In International Conference on Computational Science; Springer: Cham, Switzerland, 2018; pp. 274–287. [Google Scholar]
  38. Lee, B.; Jung, W. Analysis on the urban street network of Korea: Connections between topology and meta-information. Physica A 2018, 497, 15–25. [Google Scholar] [CrossRef] [Green Version]
  39. Ducruet, C.; Beauguitte, L. Spatial Science and Network Science: Review and Outcomes of a Complex Relationship. Networks Spat. Econ. 2014, 14, 297–316. [Google Scholar] [CrossRef] [Green Version]
  40. Agryzkov, T.; Oliver, J.L.; Tortosa, L.; Vicent, J.F. Analyzing the commercial activities of a street network by ranking their nodes: A case study in Murcia, Spain. Int. J. Geogr. Inf. Sci. 2014, 28, 479–495. [Google Scholar] [CrossRef]
  41. Zhang, W.; Wang, S.; Tian, X.; Yu, D.; Yang, Z. The backbone of urban street networks: Degree distribution and connectivity characteristics. Adv. Mech. Eng. 2017, 9. [Google Scholar] [CrossRef]
  42. Tan, R.; Zhou, K.; Xu, H. Effects of Urban Road Centrality on Property Values: Spatial Hedonic Analysis of the Housing Market in Wuhan, China. J. Urban Plan. Dev. 2019, 145, 05019005. [Google Scholar] [CrossRef]
  43. Freeman, L.C. A Set of Measures of Centrality Based on Betweenness. Sociometry 1977, 40, 35–41. [Google Scholar] [CrossRef]
  44. Betweenness Centrality. Available online: https://en.wikipedia.org/wiki/Betweenness_centrality (accessed on 25 November 2019).
  45. Sabidussi, G. The centrality index of a graph. Psychometrika 1966, 31, 581–603. [Google Scholar] [CrossRef] [PubMed]
  46. Rosenthal, S.S.; Strange, W.C. The determinants of agglomeration. J. Urban Econ. 2001, 50, 191–229. [Google Scholar] [CrossRef] [Green Version]
  47. Rokach, L.; Maimon, O. Chapter 15—Clustering methods. In The Data Mining and Knowledge Discovery Handbook; Maimon, O., Rokach, L., Eds.; Springer: Boston, MA, USA, 2010; p. 32. ISBN 0-387-25465-X. [Google Scholar]
  48. CEInet Statistics Database. Available online: http://db.cei.cn/page/Default.aspx (accessed on 25 November 2019).
  49. BaiduBaike. Available online: https://baike.baidu.com (accessed on 25 November 2019).
  50. GaoDe Map API. Available online: https://lbs.amap.com/api/webservice/guide/api/district (accessed on 25 November 2019).
  51. Yilmaz, A.; Kemec, S.; Sebnemduzgun, H.; Cakir, M.P. Thematic Cartography for the Society; Springer: Cham, Switzerland, 2014; pp. 157–170. [Google Scholar]
  52. OSM Analytics. Available online: http://osm-analytics.org/#/ (accessed on 25 November 2019).
  53. The Annual Report on Road Network Statistics in Major Chinese Cities. Available online: http://www.chinautc.com/templates/H_groupsecond/people.aspx?nodeid=33&page=ContentPage&contentid=92331 (accessed on 25 November 2019).
  54. Pyatt, G. On the Interpretation and Disaggregation of Gini Coefficients. Econ. J. 2006, 86, 243. [Google Scholar] [CrossRef]
  55. Li, M.; He, B.; Guo, R.; Li, Y.; Chen, Y.; Fan, Y. Study on population distribution pattern at the county level of China. Sustain. 2018, 10, 3598. [Google Scholar] [CrossRef] [Green Version]
  56. National Bureau of Statistics of China. Available online: http://www.stats.gov.cn/ztjc/zthd/sjtjr/dejtjkfr/tjkp/201106/t20110613_71947.htm (accessed on 25 November 2019). (In Chinese)
Figure 1. The analytical framework for street network and economic development level.
Ijgi 09 00003 g001
Figure 2. The cumulative probability distribution of street network betweenness centrality.
Ijgi 09 00003 g002
Figure 3. Cumulative probability distribution of street network closeness centrality.
Ijgi 09 00003 g003
Figure 4. Hierarchical tree (dendrogram) based on the Gini coefficients of the distributions of two centrality measurements.
Ijgi 09 00003 g004
Figure 5. Plotting city clusters based on gross domestic product (GDP) and population of the cities.
Ijgi 09 00003 g005
Figure 6. Correlation between GDP per capita and the Gini coefficients of street network betweenness centrality.
Ijgi 09 00003 g006
Table 1. The results of city groups classified by street network characteristics and China’s traditional geographical and economic regions.
TypeCity List
IUrumchiW, LhasaW, LanzhouW
IIYinchuanW, XiningW, NanningW, HohhotW, GuiyangW
IIIZhengzhouC, TaiyuanC, ShenyangN, HarbinN, ChangshaC
IVChongqingW, WuhanC, Xi’anW, TianjinE, ShijiazhuangE, ShanghaiE, NanjingE, HangzhouE, GuangzhouE, ChengduW, BeijingE
VNanchangC, Kunmingw, Ji’nanE, HefeiC, HaikouE, FuzhouE, ChangchunN
Notes: N: northeast zone; W: western zone; C: central zone; E: eastern zone.

