Abstract
As a product of the development of the Internet and the sharing economy, shared bicycles are beneficial in solving the last mile problem of public transportation for urban residents and expanding the service area of urban public transportation to a certain extent. This paper analyses the spatial-temporal characteristics of shared bicycles in the city of Beijing by using kernel density estimation and statistical analysis methods. The maximum coverage location problem model is used to quantify the effects of shared bicycles on the subway and bus urban public transportation systems. The analysis results are of great importance to identify the effects of shared bicycle usage on an urban bus public transportation system from the view of space-time. The results show that (1) shared bicycles are largely located within 1.5 km from the subway station and 500 m from the bus stations; (2) the number of the shared bicycle usage changes along with the distance from the subway and bus stations; (3) subway and bus stations are divided into six types based on the sink-source characteristics of shared bicycles; (4) the service areas of subway and bus stations are expanded by approximately 2.34 and 1.33 times, respectively, after the implementation of shared bicycles.
1. Introduction
Bike sharing systems originated in Amsterdam in 1965 [1], and they can be described as short-term inner-city bicycle rental services that provide bicycles at unattended stations [2,3]. In recent years, free-floating bike sharing, which allows cyclists to park bicycles in any nonmotorized parking area, has become a significant travel mode for urban residents and has expanded the coverage of public transportation [4,5]. Research on the spatial-temporal characteristics of free-floating bike sharing and its influence on public transportation is of great significance to guide the management of bike sharing systems [6].
The free-floating shared bicycle is a type of new public transportation, and the research on free-floating shared bicycles is limited. Some research on station-based shared bicycles is referred to in this study [7,8,9,10,11]. Some scholars have tried to analyze the usage of shared bicycles from the perspective of a time series [9,10,12,13,14]. The daily and weekly patterns of shared bicycle trips are described. On weekdays, the characteristics of shared bicycle trips during the morning and evening rush hours were analyzed [12,13]. From a spatial perspective, some researchers have attempted to analyze the spatial distribution of shared bicycles [9,10,14]. Based on the analysis of the spatial-temporal characteristics of shared bicycles, some studies have identified different purposes of cyclists, such as commuting and recreational usage [7,11,15]. Some studies have proposed the spatial-temporal clustering of bicycles to explore the collective behavior of bike sharing users [8,16,17]. It has been demonstrated that the analyses of the characteristics of shared bicycle trips are helpful for making decisions on the allocation and dispatching of shared bicycles [18,19,20].
However, shared bicycles, as an alternative mode of public transportation [21], are embedded in the space where the original public transportation is located. The accessibility of the traffic network and the service level of public transportation have a significant correlation with shared bicycle usage [22]. Therefore, studying the effects of shared bicycles on urban public transportation is an important research topic. The existing research qualitatively analyzed the great contribution of shared bicycles in relieving the pressure on public transportation systems [23,24,25]. Some scholars have analyzed the effects of public bicycle systems on the travel time of public transportation, and the results showed that public bicycle systems improved the efficiency of urban public transport trips [26,27,28]. Some scholars quantitatively analyzed the effects of a dockless bike-sharing system on the public bike system [29]. However, few studies have quantitatively analyzed the influence of shared bicycles on the urban public transportation system from a spatial perspective.
The objective of this paper is to analyze the spatial-temporal characteristics of dockless shared bicycle trips to quantitatively explore its influence on public transportation. The remainder of this paper is organized into the following sections. Section 2 takes the city of Beijing as an example and analyzes the spatial-temporal characteristics of shared bicycle usage. Section 3 quantitatively analyzes the effects of shared bicycles on urban public transportation. This section examines the shared bicycle usage associated with subway and bus stations, explores the sink-source characteristics of shared bicycles around subway and bus stations, and discusses the expansion of the service areas of subway and bus stations. Section 4 presents the conclusions.
2. Case Study and Spatial-Temporal Analysis
2.1. Study Area and Data Processing
Bicycle sharing is widely used in the city of Beijing, China. The number of shared bicycles in Beijing reached 2.2 million by the end of 2017. Beijing has very well-developed traffic and transportation facilities. This paper takes the area within the Fifth Ring Road of Beijing as the study area (see Figure 1). The circumference of the Fifth Ring Road is approximately 98.6 km, and the study area is approximately 667 km2. The original shared bicycle dataset covers the use of 407,820 Mobike bicycles and 312,494 Mobike users in the study area. There is a total of 2,233,170 travel records from May 10 to May 24, 2017. The records of the bicycle dataset include the order ID, user ID, bicycle ID, bicycle type, bicycle use time, and geographic positions of the origin and destination (OD) points.
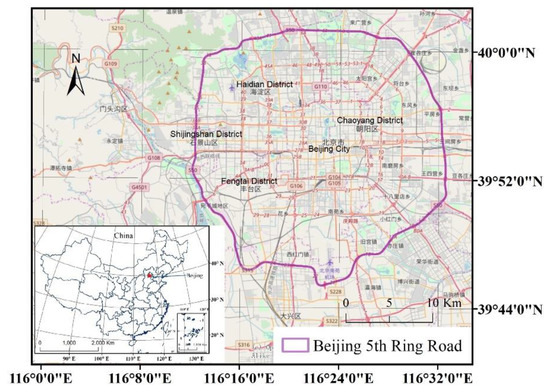
Figure 1.
Study area.
The road network data were obtained from OpenStreetMap (OSM). The points of interest (POIs) for bus and subway stations were obtained by mining the application programming interface (API) of Amap. The original shared bicycle dataset was checked to eliminate abnormal trip records. The acquired geographic positions of the OD points were processed by using the decoding function in the Python GeoHash library.
2.2. Spatial-Temporal Characteristics of Shared Bicycle Trips
2.2.1. Time Series Analysis and Statistics of Riding Distance
In this study, considering the weather conditions, shared bicycle trip datasets were selected from Wednesday, May 10, 2017, to Tuesday, May 16, 2017, for weekly feature analysis in the datasets we obtained. There was a total of 1,272,035 travel records from May 10 to May 16, 2017. The records covered the use of 313,246 Mobike bicycles and 251,441 Mobike users. The number of shared bicycle trips, including the OD points, was counted per hour during a week, as shown in Figure 2. There was a clear difference between the number of shared bicycle trips on weekdays and weekends.
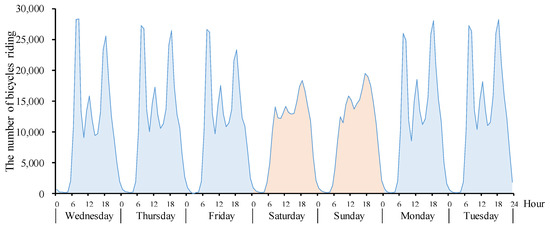
Figure 2.
The number of bicycle trips in a week.
The number of shared bicycle trips was counted per hour, and the average number of daily trips on the weekdays and weekends for 24 hours was obtained, as shown in Figure 3. The results showed that users of shared bicycles were very active from 6:00 to 23:00. On weekdays, shared bicycle trips present two peak periods: the morning rush hours (7:00–10:00) and evening rush hours (17:00–20:00). The number of shared bicycle trips increased sharply in the short periods of the morning and evening rush hours. On weekends, the rush hours are in the evening and shared bicycles are mostly used for entertainment and leisure activities.
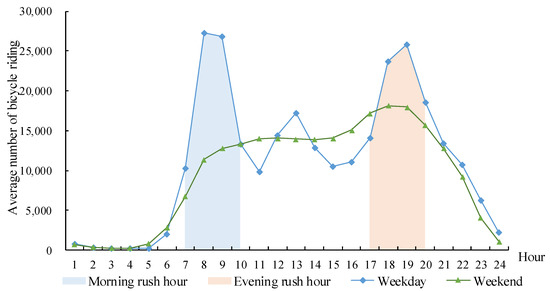
Figure 3.
The number of bicycle trips per hour.
The riding distance of each bicycle trip record was calculated by using the riding path planning service provided by the API of Amap, as shown in Figure 4. Compared with the Euclidian or Manhattan distance, the riding distance from Amap could more accurately reflect the actual riding distance of the shared bicycles. The average riding distances of the weekday and weekend trips were 1.4 km and 1.3 km, respectively. Figure 4a shows that the number of shared bicycle trips that were less than 1 km increased rapidly and then decreased slowly as the riding distance increased. As shown in Figure 4b, the number of shared bicycle trips of less than 2 km for weekdays and weekends accounted for 90% and 87% of the total trips, respectively, reflecting the significance of bike sharing in addressing the last few kilom of urban public transportation.
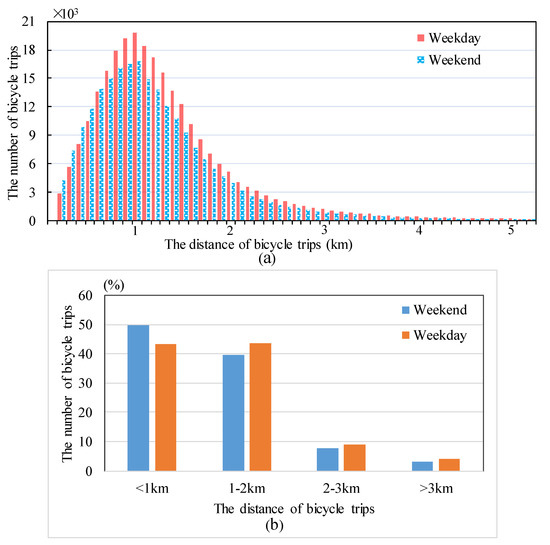
Figure 4.
The riding distance of the shared bicycles.
2.2.2. Hotspot Analysis
The urban hotspots reflect the intensity of shared bicycle usage. In this study, the kernel density estimate was applied to estimate the distribution of shared bicycles. Kernel density estimation was widely used for the nonparametric estimation of the potential probability density function of a random variable by using a kernel function to estimate the distribution of the points [30,31,32,33,34]. The hotspots of the OD points for shared bicycles on the weekdays and weekends are as shown in Figure 5 and Figure 6. The results showed that the distribution of the shared bicycle hotspots had a spatial-temporal variation in Beijing.
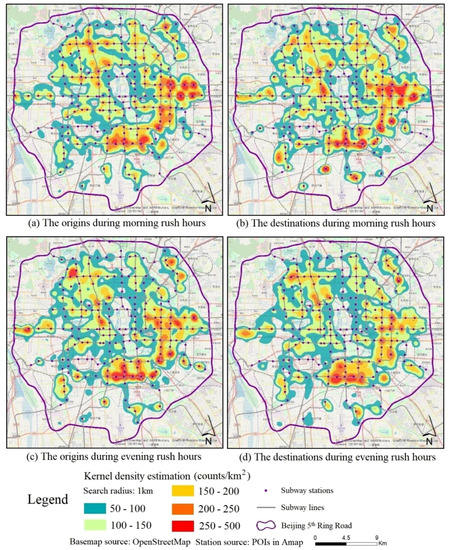
Figure 5.
The shared bicycle hotspots on the weekdays.
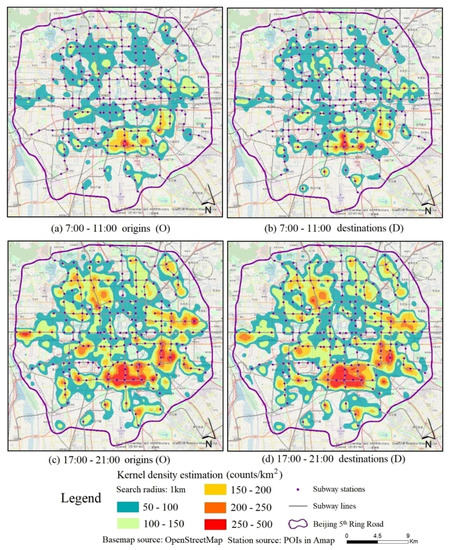
Figure 6.
The shared bicycle hotspots on the weekends.
Figure 5 showed the shared bicycle hotspots for the origin and destination points during the morning and evening weekday rush hours. The shared bicycle usage hotspot areas were basically distributed around the popular subway stations, which reflects the connection between the shared bicycles and subway stations. In fact, the distribution characteristics of the shared bicycle hotspots were different at different times and in different regions. During the morning rush hours, the origins were distributed around the corresponding subway stations, as shown in Figure 5a, and the center of the destination hotspots coincided with the subway stations in the southern part of the study area, as seen in Figure 5b. This result indicated that the shared bicycles were attracted from the surrounding areas of the subway stations during the morning rush hours in the southern part of the study area. In contrast, the origins of the morning rush hours in the eastern part of the study area coincided with the subway stations, as shown in Figure 5a, and the destinations were around the corresponding subway stations, as shown in Figure 5b. The results showed that the shared bicycles were spread around the subway station during the morning rush hours in the eastern part of the study area. During the evening rush hours, the overall distribution of the hotspots was similar to the morning rush hour distribution. It is noteworthy that the distribution of the origin and destination points in the bicycle trips is reversed for the morning rush hours in the southern part of the study area. Thus, the popular origins during the morning rush hours, as shown in Figure 5a, were the destinations during the evening rush hours, as shown in Figure 5d, and the popular destinations during the morning rush hours, as shown in Figure 5b, were the popular origins during the evening rush hours, as shown in Figure 5c. There are indications that this characteristic may be generated by the commuting of similar users.
Figure 6 shows the origin and destination hotspots of the shared bicycle trips during the morning (7:00–11:00) and evening (17:00–21:00) hours of weekends. Most of the study areas were less active in the morning hours, as shown in Figure 6a,b. The hotspots were located near residential areas, markets and parks on the weekends, which shows that the shared bicycles near the residential areas are used for routine activities and that the bicycles near the parks are used for leisure activities. The hotspots in the southern part of the study area on weekends, as shown in Figure 6c,d, were also the hotspots on weekdays. The results showed that the difference in the purpose of trips resulted in the difference in the distribution of the hotspots. The trips on weekdays were affected by commuting activities, and the attraction of association with the subway stations was obvious. On weekends, the bicycle usage was for leisure activities, and these trips followed a uniform distribution. This result corroborates the difference between the commuting and non-commuting shared bicycle trips on weekdays and weekends.
3. Effects of Shared Bicycles on Urban Public Transportation
3.1. OD Points Associated with the Subway and Bus Stations
Shared bicycles play an important role in connecting bicycles to urban public transportation systems, such as subways and buses. Model is important tool for geographic analysis [35,36,37,38,39,40], as well as urban dynamic analysis. The maximum coverage location problem (MCLP) model was used to calculate the number of shared bicycle OD points that could be covered as much as possible by subway and bus stations within a given road network distance. The MCLP model was widely employed to obtain as many spatial points as possible within the specified road network distance of the facility by setting the maximum coverage as the objective function. The formula for the MCLP model is as follows [41]:
such that
where is the index of the demand points (shared bicycles); is the index of the facility points (subway or bus stations); is the road network distance between and ; is the maximum road network distance that the shared bicycle usage is associated with the subway or bus stations; is the number of shared bicycles in the i-th demand area; is a set of facility points within a distance from demand location ; and is a set of indexes of the facility points. If the demand location is satisfied, ; otherwise, . is subway or bus station.
The total number of OD points within different distances from the subway and bus stations during the morning and evening rush hours of weekdays was counted by using the MCLP model of the network analysis tool in ArcGIS to maximize the coverage as the objective function, as shown in Figure 7. The distance used in the model was the road network distance, which more accurately describes the effects of the trips along the roads that are connected with the subways and buses. The results showed that the number of trips within 1.5 km of the subway stations accounted for 83.21% of the total, and the number of trips within 500 m of the bus stops accounted for 77.21%. It can be seen that the shared bicycles are largely used as connectors for public transportation in Beijing.
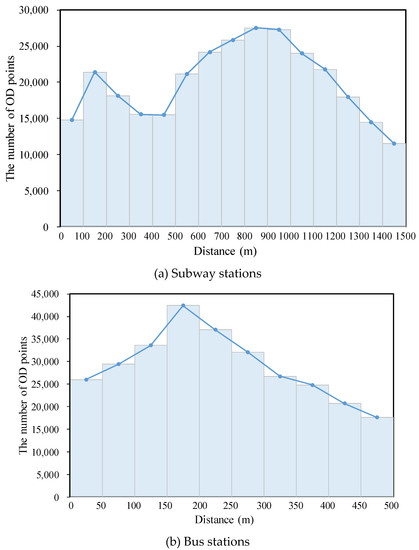
Figure 7.
The number of origin and destination (OD) points around the subway and bus stations.
In Figure 7a, there are two gathering areas of OD points within 1.5 km from the subway stations. The first one appears from 100 to 200 m around the subway stations, where the shared bicycles can be considered as the connectors to the subway stations. Another one appears within the range of 800 to 900 m. In this area, there may be bus stations around the subway stations, and the shared bikes can reduce the time needed to transfer between subways and buses. In Figure 7b, the number of OD points near the bus stops increased first and then decreased apparently as the distance increased within 500 m from the bus stations. A shared bicycle usage gathering area appeared within the range of 150 to 200 m around the bus stops, where the shared bicycles could be considered as connectors to bus stations.
There is an obvious difference in the number of shared bicycles within and outside the range of 1.5 km from subway stations or 500 m from bus stations. A two-sample t-test [42] is used to quantitatively investigate variations of the number of bicycle OD points within and outside the range of 1.5 km from each subway stations or 500 m from each bus stations. In Table 1, the values of p, obtained by the two group of two-sample t-tests, are both much less than 0.05, which shows that there are significant differences between the two samples [43]. The mean of two samples and the p-value of the two-sample t-test indicated that bike share activity around stations is higher than those not around the stations.

Table 1.
Two-sample t-test.
Figure 8 shows the spatial distribution of the OD points around the subway and bus stations. The number of OD points within a road network distance of 1.5 km that were associated with each subway station is shown in Figure 8a. This shows that most of the subway stations associated with a large number of bicycle trips were interchange subway stations within the Beijing Fourth Ring Road. Figure 8b represents the number of OD points associated with each bus station within a road network distance of 500 m. The distribution of the popular bus stations with a larger number of bicycle trips was mainly between Beijing Second Ring Road and Beijing Fourth Ring Road, which is consistent with the distribution of the subway stations.
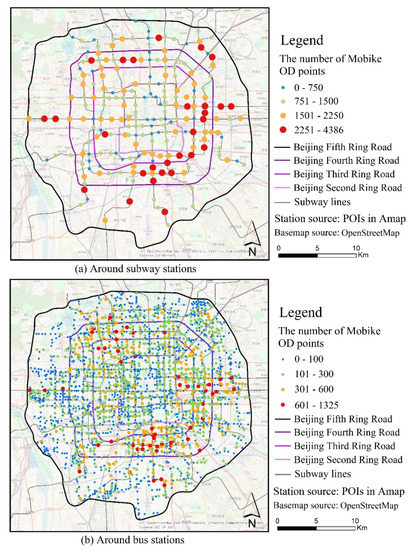
Figure 8.
Spatial distribution of the number of OD points around the subway and bus stations.
3.2. Sink-Source Characteristics of Shared Bicycles
The sink-source characteristics of shared bicycles around subway and bus stations were analyzed to explore the extent to which shared bicycles connect to different subway and bus stations. The sink-source attributes of the shared bicycles were defined by comparing the number of origins and destinations during the morning and evening rush hours. The definitions of the sink-source characteristics of the shared bicycles are shown in Table 2.
Table 2.
Sink-source characteristics of the shared bicycles around the subway and bus stations.
where and are the percentage of origins and destinations during the morning rush hours, respectively. and represent the percentage of origins and destinations during the evening rush hours, respectively. is a tolerance close to zero, which makes and approximately equal.
The subway and bus stations were classified according to the sink-source characteristics of the shared bicycles around the stations, as shown in Figure 9. The subway and bus stations with the characteristics of sinks in the morning and sources in the evening were mainly distributed in areas around residential areas, such as the Beijing subway line 10 stations between the South Third Ring Road and the South Fourth Ring Road. The residents near this type of subway or bus station may ride the shared bicycles from the surrounding residential areas during the morning rush hours and return home by riding the shared bicycles from the subway or bus stations during the evening rush hours. The shared bicycles around these subway stations were mainly used for commuting activities by residents. The subway and bus stations with the characteristics of sources in the morning and sinks in the evening were mostly distributed in areas around companies and universities, such as universities in the Haidian District and work areas on Wangjing Street. The users rode the shared bicycles from the subway stations to various workplaces to engage in study or work activities during the morning rush hours, while during the evening rush hours, they traveled from the workplace to the subway stations. The sink-type stations were mostly distributed in areas around financial institutions, government agencies and other places where daily affairs are handled. Source-type stations were mostly distributed around residential areas, and shared bicycles were used more for life activities. Equalization-type stations were mostly distributed in leisure areas such as scenic spots and parks, and the bicycles were used for leisure.
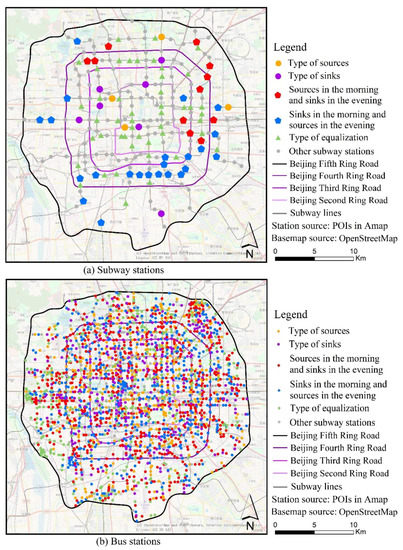
Figure 9.
Classification of the subway and bus stations according to the sink-source characteristics of the shared bicycles.
3.3. Expanding the Subway and Bus Station Service Areas
The above analysis shows that the shared bicycles have different characteristics in connecting to the subway and bus stations in different areas due to the actual road conditions and locations. The service area expansion of the subway and bus stations by shared bicycles was calculated quantitatively by using the network analysis model of ArcGIS. The service area of the subway and bus stations for walking and riding within 10 min and 20 min was calculated separately as shown in Figure 10.
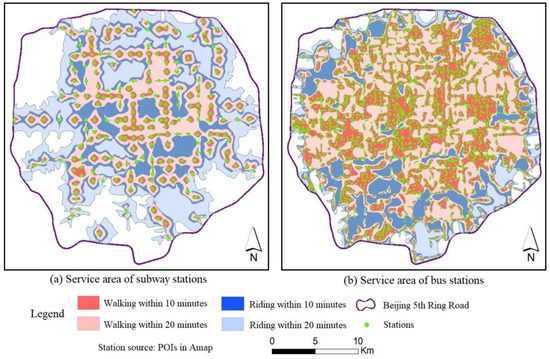
Figure 10.
Service areas of subway and bus stations.
Figure 10a shows the service area expansion of the subway station with the implementation of shared bicycles; the service area expanded from 208 km2 (walking time within 20 min) to 487 km2 (riding time within 20 min), which was 2.34 times larger than without the implementation of shared bicycles. The connection effect of the shared bicycles was different in different areas. The density of the subway stations within the Beijing Third Ring Road was relatively high, where most locations were within 20 min of a subway station. It is demonstrated that the shared bicycles are beneficial in shortening the travel time to the subway stations instead of expanding the service area of the subway stations within the Third Ring Road. In the area outside of the Beijing Third Ring Road, there were fewer subway stations and more residential areas, shopping malls and entertainment venues. The implementation of shared bicycles can greatly increase the service radius of subway stations. Taking a 20-minute ride as an example, the service range of the subway station was up to 2.6 km.
Figure 10b shows the expansion of the service area of a bus station after the shared bicycles were implemented. Similar to the method of calculating the subway service areas, the service area was expanded from 459 km2 (walking time within 20 min) to 610 km2 (riding time within 20 min), which was approximately 1.33 times larger than without the implementation of shared bicycles. Compared with the range of the pink area (walking time within 20 min) and the range of the dark blue area (riding time within 10 min), the results show that the dark blue area completely covered most of the pink area. Therefore, the shared bicycles can greatly shorten the time for travelling to the bus station. To a certain extent, the results can reflect the convenience of shared bicycles as connectors to public transportation.
4. Conclusions
In this study, the spatial-temporal characteristics of free-floating bike sharing and its effects on urban public transportation were analyzed in the city of Beijing, China. The results showed that there were two popular bike riding time periods during the morning and evening rush hours. The shared bicycles were mainly used to serve the cycling needs of residents within 2 km, which is conducive to solving the last mile problem of public transportation in the city. The shared bicycles were mainly used for commuting on the weekdays and leisure and entertainment activities on the weekends. The subways and buses had a great association with the shared bicycles, and a certain range of connection gathering areas were formed around the subway and bus stations. According to the sink-source characteristics of the shared bicycles around the subway and bus stations, the subway and bus stations were divided into six types. The subway and bus stations characterized by “sinks in the morning and sources in the evening” and “sources in the morning and sinks in the evening” mainly served commuting activities, and stations characterized by sources, sinks and equalization served daily affairs and leisure activities. After the implementation of the shared bicycles, the service areas of the subway stations expanded approximately 2.34-fold, and the service areas of the bus stations expanded approximately 1.33-fold. The quantitative effects analysis of free-floating shared bicycles on the urban public transportation system is conductive to the allocation and dispatching of shared bicycles, which is helpful to guide the public transport planning from a spatial-temporal perspective.
In future research, the calculation analysis about the relation of POI types to the bicycle trips is a valuable study [44]. The research on the relationship between riding modes of cyclists and POI types is conducive to further analysis of the characteristics of the spatial-temporal bicycle trips and the analysis of driving factors. In addition, a quantitative connection analysis of shared bicycles and public transportation may help to guide the planning of shared bicycle parking sites, such as the optimized selection of electronic fences. By analyzing the sink-source characteristics of shared bicycles around subway and bus stations, it is possible to provide advice on the capacity of electronic fences and the dispatching of shared bicycles to promote the proper management of urban shared bicycles.
Author Contributions
M.C. (Min Cao) conceived and designed the research; S.M. and M.H. contributed to data preprocessing, the experiment. M.C. (Min Cao), S.M. and M.H. contributed to writing the manuscript. G.L. gave advice on the experimental discussion. M.C. (Min Chen) contributed to the idea draft and manuscript revision.
Funding
This research was supported by National Science Foundation of China, grant number 41671385, 41622108 and 41871178, Surveying mapping and geoinformation research project of Jiangsu Province, grant number JSCHKY201814, the Priority Academic Program Development of Jiangsu Higher Education Institutions, grant number 164320H116, and the Qing-Lan Project of Nanjing Normal University.
Acknowledgments
We thank the editor and anonymous referees who read the paper and made helpful suggestion on ways to improve it.
Conflicts of Interest
The authors declare no conflict of interest.
References
- Shaheen, S.A.; Guzman, S.; Zhang, H. Bikesharing in Europe, the Americas, and Asia: Past, present, and future. Transp. Res. Record. 2010, 2143, 159–167. [Google Scholar] [CrossRef]
- Vogel, P.; Greiser, T.; Mattfeld, D.C. Understanding bike-sharing systems using data mining: Exploring activity patterns. Procedia Soc. Behav. Sci. 2011, 20, 514–523. [Google Scholar] [CrossRef]
- Pal, A.; Zhang, Y. Free-floating bike sharing: Solving real-life large-scale static rebalancing problems. Transp. Res. Pt. C Emerg. Technol. 2017, 80, 92–116. [Google Scholar] [CrossRef]
- Du, M.; Cheng, L. Better understanding the characteristics and influential factors of different travel patterns in free-floating bike sharing: Evidence from Nanjing, China. Sustainability 2018, 10, 1244. [Google Scholar] [CrossRef]
- Xin, F.; Chen, Y.; Wang, X.; Chen, X. Cyclist satisfaction evaluation model for free-floating bike-sharing system: A case study of Shanghai. Transp. Res. Record. 2018, 2672, 21–32. [Google Scholar] [CrossRef]
- Ma, Y.; Lan, J.; Thornton, T.; Mangalagiu, D.; Zhu, D. Challenges of collaborative governance in the sharing economy: The case of free-floating bike sharing in Shanghai. J. Clean Prod. 2018, 197, 356–365. [Google Scholar] [CrossRef]
- O’ brien, O.; Cheshire, J.; Batty, M. Mining bicycle sharing data for generating insights into sustainable transport systems. J. Transp. Geogr. 2014, 34, 262–273. [Google Scholar] [CrossRef]
- Munoz-Mendez, F.; Klemmer, K.; Han, K.; Jarvis, S. Community structures, interactions and dynamics in London’s bicycle sharing network. In Proceedings of the 7th International Workshop on Pervasive Urban Applications, New York, NY, USA, 8–12 October 2018. [Google Scholar]
- Boss, D.; Nelson, T.; Winters, M.; Ferster, C.J. Using crowdsourced data to monitor change in spatial patterns of bicycle ridership. J. Transp. Health. 2018, 9, 226–233. [Google Scholar] [CrossRef]
- Come, E.; Randriamanamihaga, N.A.; Oukhellou, L.; Aknin, P. Spatio-temporal analysis of dynamic origin-destination data using latent dirichlet allocation: Application to Vélib’ Bike sharing system of Paris. In Proceedings of the TRB 93rd Annual meeting, Washington, DC, USA, 12–16 January 2014. [Google Scholar]
- Faghih-Imani, A.; Eluru, N. Incorporating the impact of spatio-temporal interactions on bicycle sharing system demand: A case study of New York CitiBike system. J. Transp. Geogr. 2016, 54, 218–227. [Google Scholar] [CrossRef]
- Borgnat, P.; Abry, P.; Flandrin, P.; Rouquier, J.B. Studying Lyon’s Vélo’V: A statistical cyclic model. In Proceedings of the European Conference on Complex Systems, Coventry, UK, 21–25 September 2009. [Google Scholar]
- Froehlich, J.E.; Neumann, J.; Oliver, N. Sensing and predicting the pulse of the city through shared bicycling. In Proceedings of the 21st International Joint Conference on Artificial Intelligence, Pasadena, CA, USA, 11–17 July 2009. [Google Scholar]
- Zhang, X.; Li, W.; Zhang, F.; Liu, R.; Du, Z. Identifying Urban Functional Zones Using Public Bicycle Rental Records and Point-of-Interest Data. ISPRS Int. Geo Inf. 2018, 7, 459. [Google Scholar] [CrossRef]
- Zhang, Y.; Brussel, M.J.; Thomas, T.; van Maarseveen, M.F. Mining bike-sharing travel behavior data: An investigation into trip chains and transition activities. Comput. Environ. Urban Syst. 2018, 69, 39–50. [Google Scholar] [CrossRef]
- Caggiani, L.; Ottomanelli, M.; Camporeale, R.; Binetti, M. Spatio-temporal clustering and forecasting method for free-floating bike sharing systems. In Proceedings of the International Conference on Systems Science, Wrocław, Poland, 7–9 September 2016. [Google Scholar]
- Shi, X.; Yu, Z.; Fang, Q.; Zhou, Q. A Visual Analysis Approach for Inferring Personal Job and Housing Locations Based on Public Bicycle Data. ISPRS Int. Geo Inf. 2017, 6, 205. [Google Scholar] [CrossRef]
- Deng, L.; Xie, Y.; Huang, D. Bicycle-sharing facility planning base on riding spatio-temporal data. Planners. 2017, 33, 82–88. [Google Scholar]
- Gao, Y.; Song, C.; Shu, H.; Pei, T. Spatial-temporal Characteristics of Source and Sink Points of Mobikes in Beijing and Its Scheduling Strategy. J. Geo Inf. Sci. 2018, 20, 1123–1138. [Google Scholar]
- Gu, Z.; Zhu, Y.; Zhang, Y.; Zhou, W.; Chen, Y. Heuristic Bike Optimization Algorithm to Improve Usage Efficiency of the Station-Free Bike Sharing System in Shenzhen, China. ISPRS Int. Geo Inf. 2019, 8, 239. [Google Scholar] [CrossRef]
- Labadi, K.; Benarbia, T.; Barbot, J.P.; Hamaci, S.; Omari, A. Stochastic petri net modeling, simulation and analysis of public bicycle sharing systems. IEEE Trans. Autom. Sci. Eng. 2015, 12, 1380–1395. [Google Scholar]
- Liu, Z.; Chen, Y. Analysis on distribution characteristics and influence factors of Mobike travel space in Changsha City. In Proceedings of the 2018 China Urban Planning Annual Meeting, Hangzhou, China, 23–26 November 2018. [Google Scholar]
- Zhang, J.; Pan, X.; Li, M.; Philip, S.Y. Bicycle-sharing system analysis and trip prediction. In Proceedings of the 2016 17th IEEE International Conference on Mobile Data Management (MDM), Porto, Portugal, 13–16 June 2016; pp. 174–179. [Google Scholar]
- Sun, L.; Wang, S.; Liu, S.; Yao, L.; Luo, W.; Shukla, A. A completive research on the feasibility and adaptation of shared transportation in mega-cities–A case study in Beijing. Appl. Energy. 2018, 230, 101–1033. [Google Scholar] [CrossRef]
- Cerutti, P.S.; Martins, R.D.; Macke, J.; Sarate, J.A.R. Green, but not as green as that: An analysis of a Brazilian bike-sharing system. J. Clean. Prod. 2019, 217, 185–193. [Google Scholar] [CrossRef]
- Lin, F.; Jiang, J.; Fan, J.; Wang, S. A stacking model for variation prediction of public bicycle traffic flow. Intell. Data Anal. 2018, 22, 911–933. [Google Scholar] [CrossRef]
- Yang, X.H.; Cheng, Z.; Chen, G.; Wang, L.; Ruan, Z.Y.; Zheng, Y.J. The impact of a public bicycle-sharing system on urban public transport networks. Transp. Res. Pt. A-Policy Prac. 2018, 107, 246–256. [Google Scholar] [CrossRef]
- Jäppinen, S.; Toivonen, T.; Salonen, M. Modelling the potential effect of shared bicycles on public transport travel times in Greater Helsinki: An open data approach. Appl. Geogr. 2013, 43, 13–24. [Google Scholar] [CrossRef]
- Li, W.; Tian, L.; Gao, X.; Batool, H. Effects of dockless bike-sharing system on public bike system: Case study in Nanjing, China. Energy Procedia. 2019, 158, 3754–3759. [Google Scholar] [CrossRef]
- Anderson, T.K. Kernel density estimation and K-means clustering to profile road accident hotspots. Accid. Anal. Prev. 2009, 41, 359–364. [Google Scholar] [CrossRef] [PubMed]
- Heidenreich, N.B.; Schindler, A.; Sperlich, S. Bandwidth selection for kernel density estimation: A review of fully automatic selectors. AStA Adv. Stat. Anal. 2013, 97, 403–433. [Google Scholar] [CrossRef]
- Kang, Y.; Cho, N.; Son, S. Spatiotemporal characteristics of elderly population’s traffic accidents in Seoul using space-time cube and space-time kernel density estimation. PLoS ONE 2018, 13, e0196845. [Google Scholar] [CrossRef] [PubMed]
- Wang, Y.; Feng, C.; Liu, Y.; Zhao, Y.; Li, H.; Zhao, T.; Guo, W. Comparative study of species sensitivity distributions based on non-parametric kernel density estimation for some transition metals. Environ. Pollut. 2017, 221, 343–350. [Google Scholar] [CrossRef]
- Xie, Z.; Yan, J. Kernel density estimation of traffic accidents in a network space. Comput. Environ. Urban Syst. 2008, 32, 396–406. [Google Scholar] [CrossRef]
- Lin, H.; Chen, M.; Lu, G.N.; Zhu, Q.; Gong, J.H.; You, X.; Wen, Y.N.; Xu, B.L.; Hu, M.Y. Virtual Geographic Environments (VGEs): A New Generation of Geographic Analysis Tool. Earth Sci. Rev. 2013, 112, 74–84. [Google Scholar] [CrossRef]
- Lin, H.; Chen, M.; Lu, G.N. Virtual Geographic Environment: A Workspace for Computer-Aided Geographic Experiments. Ann. Am. Assoc. Geogr. 2013, 103, 456–482. [Google Scholar] [CrossRef]
- Wen, Y.N.; Chen, M.; Lu, G.N.; Lin, H. Prototyping an open environment for sharing geographical analysis models on cloud computing platform. Int. J. Digit. Earth. 2013, 6, 356–382. [Google Scholar] [CrossRef]
- Chen, M.; Yue, S.S.; Lu, G.N.; Lin, H.; Yang, C.W.; Wen, Y.N.; Tao, H.; Xiao, D.W.; Jiang, H. Teamwork-oriented integrated modeling method for geo-problem solving. Environ. Model. Softw. 2019, 119, 111–123. [Google Scholar] [CrossRef]
- Zhang, F.Y.; Chen, M.; Ames, D.P.; Shen, C.R.; Yue, S.S.; Wen, Y.N.; Lu, G.N. Design and Development of a Service-oriented Wrapper System for Sharing and Reusing Distributed Geoanalysis Models on the Web. Environ. Model. Softw. 2019, 111, 498–509. [Google Scholar] [CrossRef]
- Wang, J.; Chen, M.; Lu, G.N.; Yue, S.S.; Chen, K.; Wen, Y.N. A Study on Data Processing Services for the Operation of Geo-Analysis Models in the Open Web Environment. Earth Space Sci. 2018, 5, 844–862. [Google Scholar] [CrossRef]
- Park, C.; Sohn, S.Y. An optimization approach for the placement of bicycle-sharing stations to reduce short car trips: An application to the city of Seoul. Transp. Res. Pt. A Policy Pract. 2017, 105, 154–166. [Google Scholar] [CrossRef]
- Cressie, N.A.C.; Whitford, H.J. How to use the two sample t-test. Biometrical. J. 1986, 28, 131–148. [Google Scholar] [CrossRef]
- Gavriilaki, E.; Yuan, X.; Ye, Z.; Ambinder, A.J.; Shanbhag, S.P.; Streiff, M.B.; Kickler, T.S.; Moliterno, A.R.; Sperati, C.J.; Brodsky, R.A. Modified ham test for atypical hemolytic uremic syndrome. Blood 2015, 125, 3637–3646. [Google Scholar] [CrossRef]
- Weliwitiya, H.; Rose, G.; Johnson, M. Bicycle train intermodality: Effects of demography, station characteristics and the built environment. J. Transp. Geogr. 2019, 74, 395–404. [Google Scholar] [CrossRef]
© 2019 by the authors. Licensee MDPI, Basel, Switzerland. This article is an open access article distributed under the terms and conditions of the Creative Commons Attribution (CC BY) license (http://creativecommons.org/licenses/by/4.0/).