1. Introduction
Accurate information on population distribution is essential for myriad applications such as transportation analysis, healthcare planning, and environmental management. In the United States, the decennial census and American Community Survey (ACS) conducted by the U.S. Census Bureau are the primary source of such information. While the Census Bureau collects data at household level, it aggregates individual responses into estimates at a set of geographic summary levels before releasing them to the public in order to protect confidentiality and privacy. Several challenges arise when using these aggregated data [
1,
2,
3,
4], one of which, addressed in this research, is spatial data integration [
2]. Census geographical boundaries rarely coincide with those of other spatial units such as school districts, watersheds, or neighborhoods, thus creating difficulty when population data need to be combined with other data at these spatial units.
Two methods have been studied extensively to address this challenge, areal interpolation [
5] and dasymetric mapping [
6]. Areal interpolation is the process of transforming data from source zones to target zones where the two sets of zones do not lie completely within one another. Dasymetric mapping, on the other hand, divides mapped area into zones of relative homogeneity [
7]. Areal interpolation and dasymetric mapping are closely related in that one way to conduct areal interpolation is to use dasymetric mapping to disaggregate data from source zones to homogenous zones, then aggregate data from homogenous zones to target zones. The research in this paper falls in areal interpolation, though dasymetric mapping is also discussed.
Many areal interpolation methods have been developed. Some do not use any ancillary information and rely on statistical methods, e.g., areal weighting [
2], pycnophlactic interpolation [
8], kernel-based disaggregation [
9], and geostatistics [
10]. Most methods, however, make use of the fact that human population distribution is correlated with other information, e.g., land use/land cover [
6,
7,
11,
12,
13,
14,
15,
16,
17,
18,
19,
20,
21,
22], road lengths or counts of address points [
23,
24,
25,
26], impervious surface [
27,
28,
29,
30], schools [
31], parcel and zoning data [
22,
32], and the spectral reflectance of remote sensing images [
15,
33,
34]; thus, these data have been used to assist interpolation. In general, areal interpolation is most challenging in very rural areas and highly developed urban cores; further research targeting these areas is thus needed. Many research endeavors were also concerned predominately with total population count; subpopulations such as people in ethnic groups or poverty received little attention. Further research on subpopulation estimation is thus also necessary.
Our research in this paper addresses both issues. Geographically, we focus on the highly developed urban cores where the lack of uniformity across land use and wide variation in housing density and subpopulation distribution pose a great challenge to areal interpolation. In the literature, few methods have been developed specifically for and tested in such areas, probably due to the lack of fine-grained land use data able to differentiate various settlement patterns. The U.S. National Land Cover Dataset (NLCD), used by many studies (e.g., [
35]), has a 30-meter spatial resolution and differentiates developed area into only three classes of high, medium, and low density. This dataset is adequate for national-level research, but too aggregated for urban cores where it is not uncommon to find multiple land uses in a single street block or even building unit. Sophisticated statistical methods such as cokriging [
15], regression [
36], and maximum entropy allocation [
18] can remedy the limitation in land use data to some extent, but high quality land use data that accurately reflect the variation in population and housing density are essential for population estimation in highly developed urban environments. In the literature, many studies resort to remote sensing to obtain land use data, but remote sensing is not particularly well suited to analyze urban environments yet despite the recent advancement in LiDAR(Light Detection And Ranging) and very high-resolution satellite sensors. Liu et al. [
33] examined the utility of 4-meter IKONOS image for population dispersal in medium-developed metropolitan area, and did not find the correlation was strong enough for accurate interpolation. Dong et al. [
37] experimented on small-area population estimation using LiDAR, Landsat, and parcel data, only to obtain relative low accuracies. Mennis [
12] also tried to increase land use classes for more developed areas, but found the strategy was not well suited to the task. Even if physical structures can be identified through very high-resolution imageries, functional information associated with the physical structures, e.g., residential or mixed use, can rarely be extracted reliability by any known algorithms [
38].
An alternative source of land use and housing data is cadastral data. Cadastral data, often parcel-based, are a comprehensive record of the real estate properties in an area, containing details on property boundaries, ownership, zoning code, and tax records. In the United States, cadastral data are often organized by counties or townships. In recent years, many counties in the U.S. have converted their cadastral data to GIS format and made them publicly accessible through the Internet. According to a survey in 2002–2003 [
39] (p. 240), “most communities with populations over 150,000 have some type of GIS for their parcel data and it could be expected that they would have an active conversion effort underway, if not complete.” In 2010, the U.S. Department of Housing and Urban Development launched an effort to develop a national database of standardized parcel-level data, collected directly from local counties, the most authoritative sources [
40]. The burgeoning industry of online real estate property search engines is also propelling easy public access of digital cadastral data. All these suggest that a national database of parcel data in the U.S. is on the horizon; it is the time to explore how to use parcel data to improve areal interpolation.
In this research, we examine the utility of parcel data to estimate population and subpopulations in highly developed urban environments. Like previous research using parcel data [
32,
41], we assume population and subpopulations are correlated with housing accommodations and use parcel data to extract information on land use and residential units in each parcel. Unlike previous research, however, we use decennial census data as another ancillary information and use parcel map only when necessary. In what follows, we explain the details of our method using a case study to estimate population and subpopulations in San Francisco.
2. Study Area and Data
San Francisco is a dense urban jurisdiction that is roughly seven by seven miles. As the urban core of the San Francisco-Oakland-Hayward metropolitan area in California, U.S.A., the city is characterized by complex land uses. The Mayor’s Office of Neighborhood Services divides the city into 117 neighborhoods. Our research stems out of the need to build a database of the socioeconomic characteristics of each neighborhood, such as race/ethnicity, sex, education, employment, poverty, and insurance status, so that the impact of neighborhood resources on HIV/AIDS treatment outcomes can be assessed. To protect the confidentiality of HIV-positive population, neighborhoods with less than 500 residents or less than 10 alive HIV-positive cases in 2013 were merged with adjoining neighborhoods during data processing, resulting in 102 neighborhoods.
Our task is to estimate the demographic and socioeconomic characteristics of these 102 neighborhoods. The American Community Survey (ACS) has such data, but the data are not available at neighborhood level; thus, areal interpolation is necessary by using the 102 neighborhoods as the target zones. Three datasets were obtained to assist interpolation: the 2013 ACS data, the 2010 decennial census data, and the zoning and parcel data. The 2013 ACS data is our source data, the others ancillary data. The 2013 ACS data are publicly available by block groups and census tracts, but since block groups are more spatially detailed than census tracts, they are used as the source zones. Among the 579 block groups, only 15.7% fall completely in a single neighborhood. Nearly every neighborhood intersects several block groups, ranging from 4 to 25. The 2010 census data are also available by block groups and census tracts, but unlike the 2013 ACS data, they also have some data at census block level. The 2010 census blocks are used as intermediate zones.
Table 1 summarizes the spatial units used and their roles in the proposed areal interpolation method.
The zoning and parcel maps were obtained from SF OpenData [
42]. The zoning data consist of zoning use districts in the city; each district has a zoning code that governs how land should be used. There are 13 residential land use classes in the zoning data, including one-family, two-family, three-family houses, mixed (apartments and houses) of low, medium, and high density, and residential and commercial combined of medium and high density. The parcel data are more detailed with information on each of the 216,269 parcels in the city, e.g., street address and zoning code. As in any highly developed urban cores, multiple-level lots such as condominium and live/work units are common in San Francisco. A condominium is a building or complex of buildings containing a number of individually owned apartments or houses. A live/work unit, e.g., studio or loft, is a space that consists of both a commercial/office and a residential component occupied by the same resident. Multi-level lots are described well in the parcel data with each property having its own record. This made the parcel data especially valuable for highly developed urban cores because they enable easy inference of the number of dwelling units in a building complex.
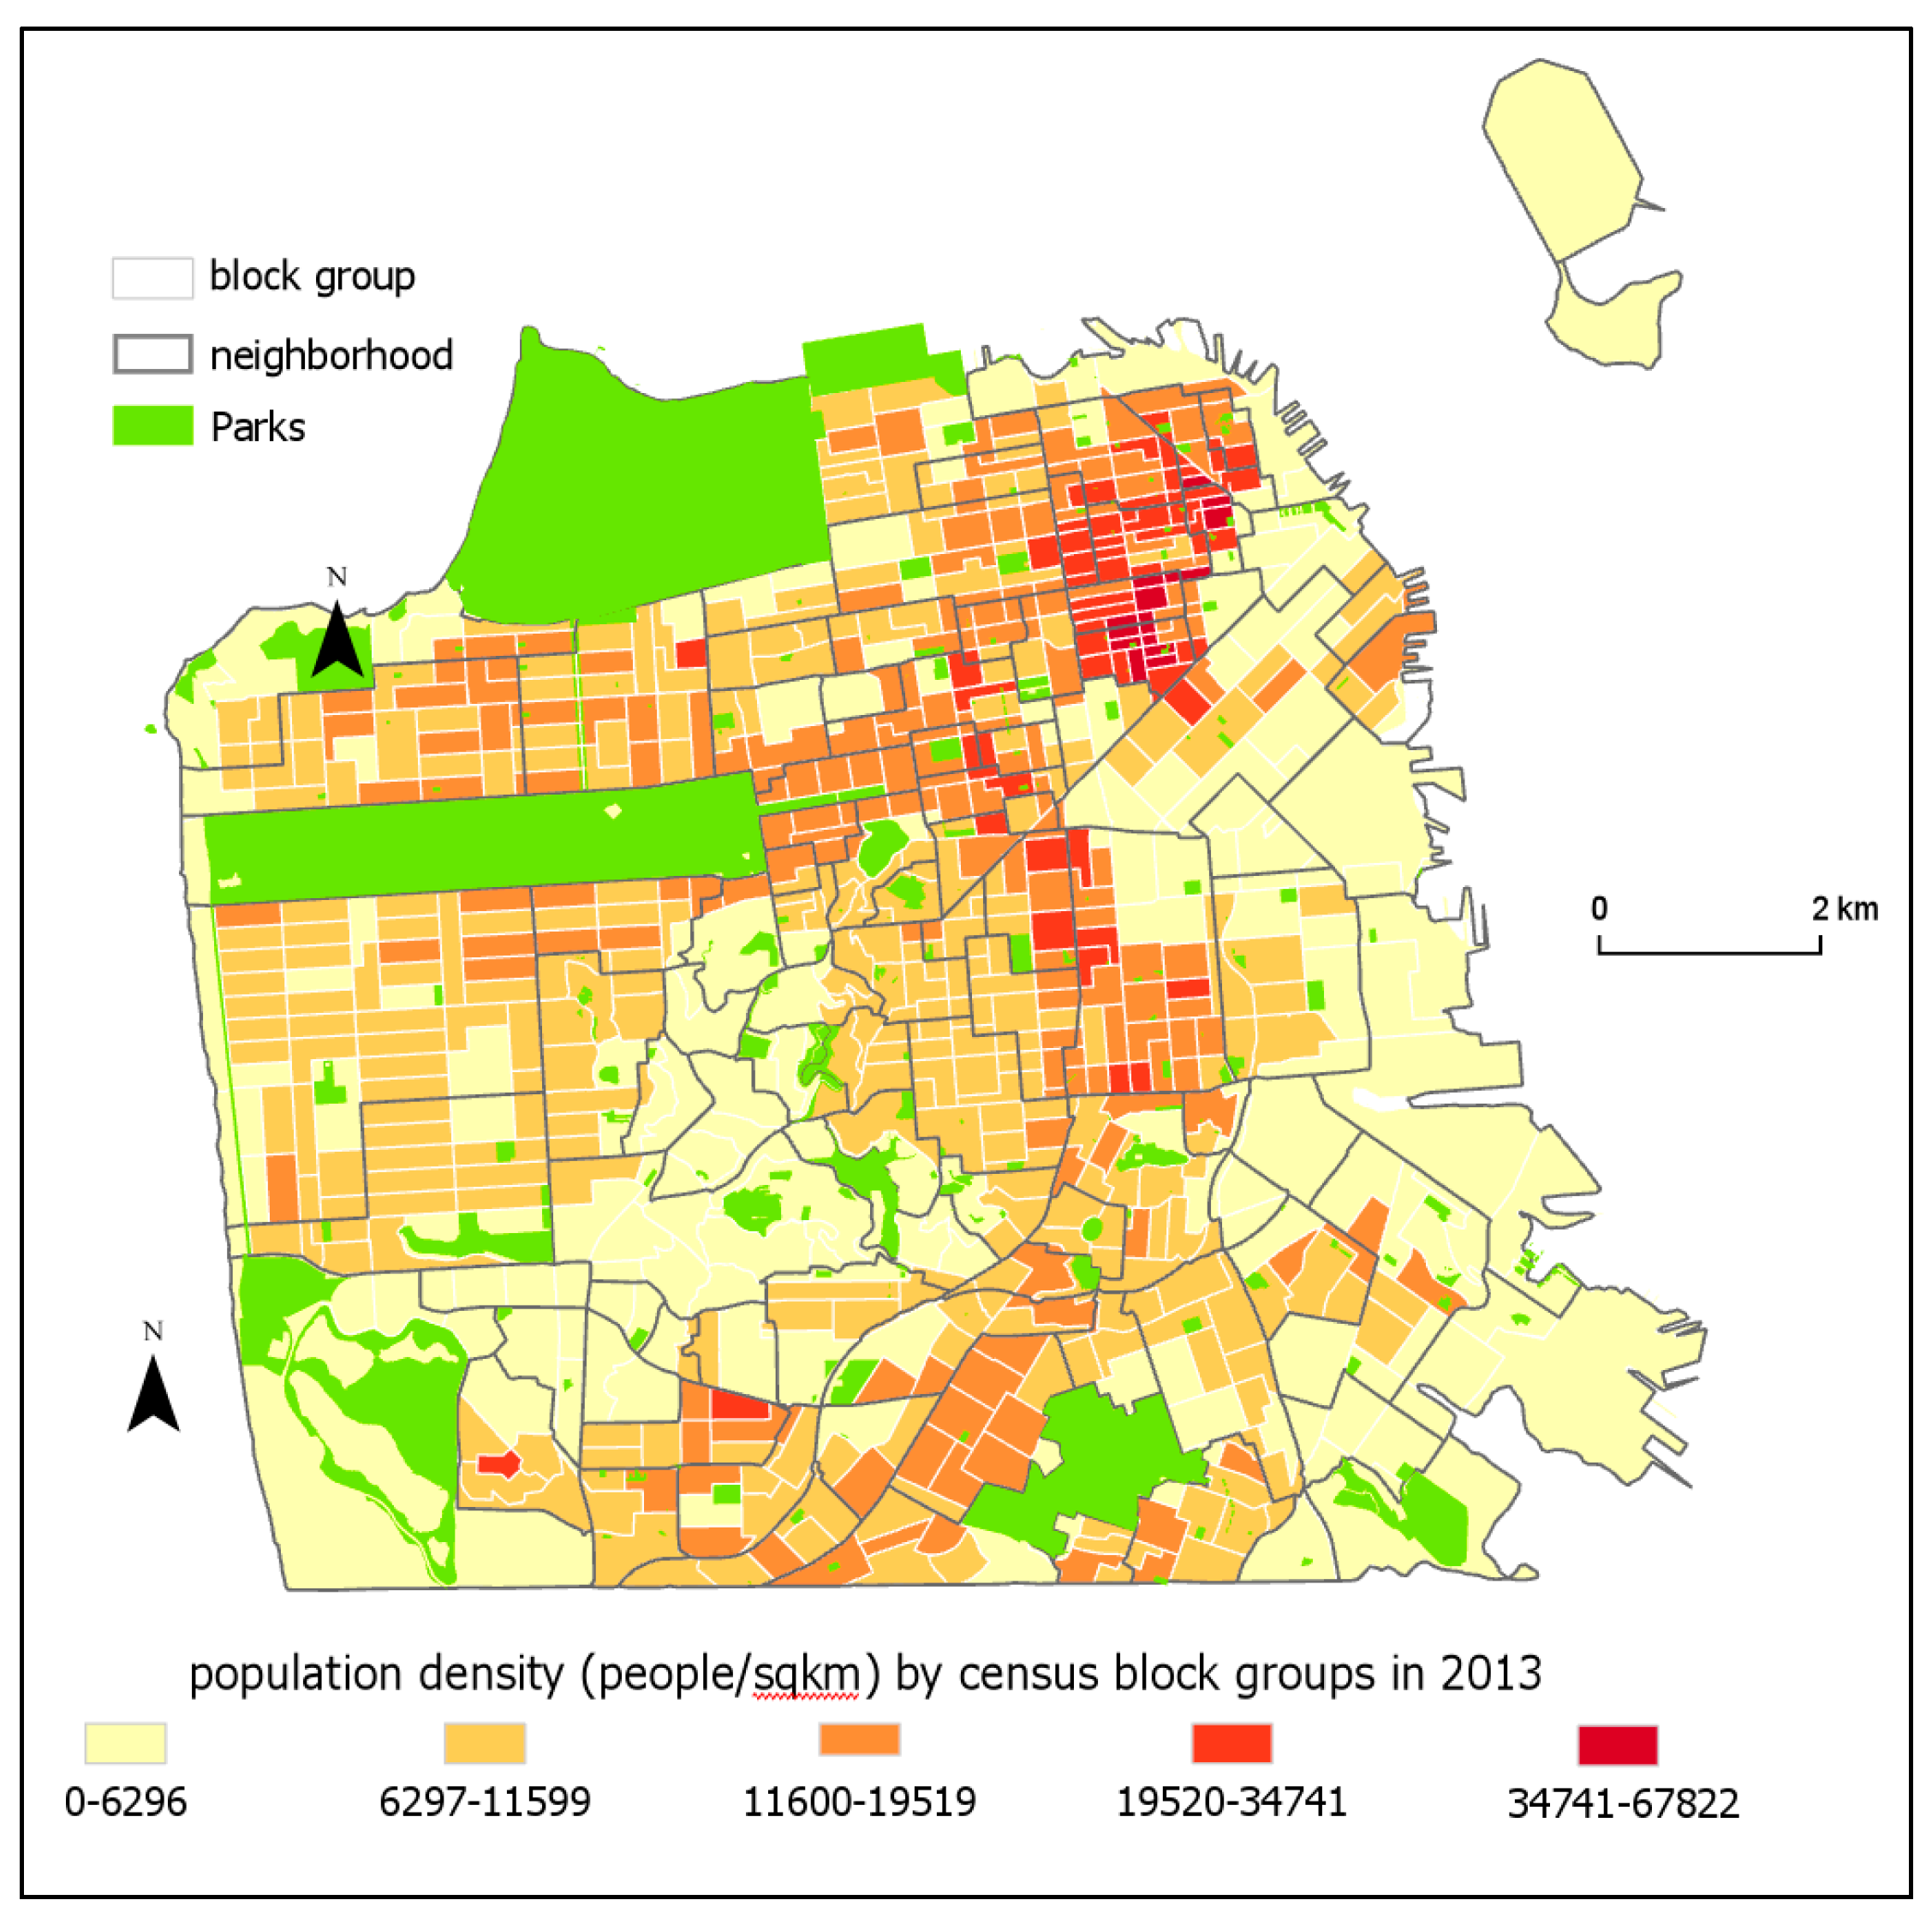
Figure 1 shows the source and target zones in our research. As it can be seen, the city’s population density varies between 0 and 67,822 people/km
2 per block group, with a median of 9895 people/ km
2. It is one of the most dense cities in the United States of America.
3. Areal Interpolation
To estimate population and subpopulations at neighborhood level, we developed a new method using parcel data and the 2010 decennial census data as ancillary information, and compared it with two other methods, areal weighting and residential proportion. Details of each method are explained below.
3.1. Areal Weighting
In this method, the population of each source zone is re-distributed according to the areal proportion of the source zone in each target zone. For a target zone
made up by
parts
,
,
where each part falls in source zone
,
, …
, respectively, its value, denoted as
, is estimated as:
where
and
are the area of
and
, respectively, and
is the value of source zone
. Areal weighting does not require any ancillary data, and its implementation is straightforward. It is often used as a benchmark to evaluate other methods. Areal weighting, however, assumes that population in a source zone is uniformly distributed, which is hardly true.
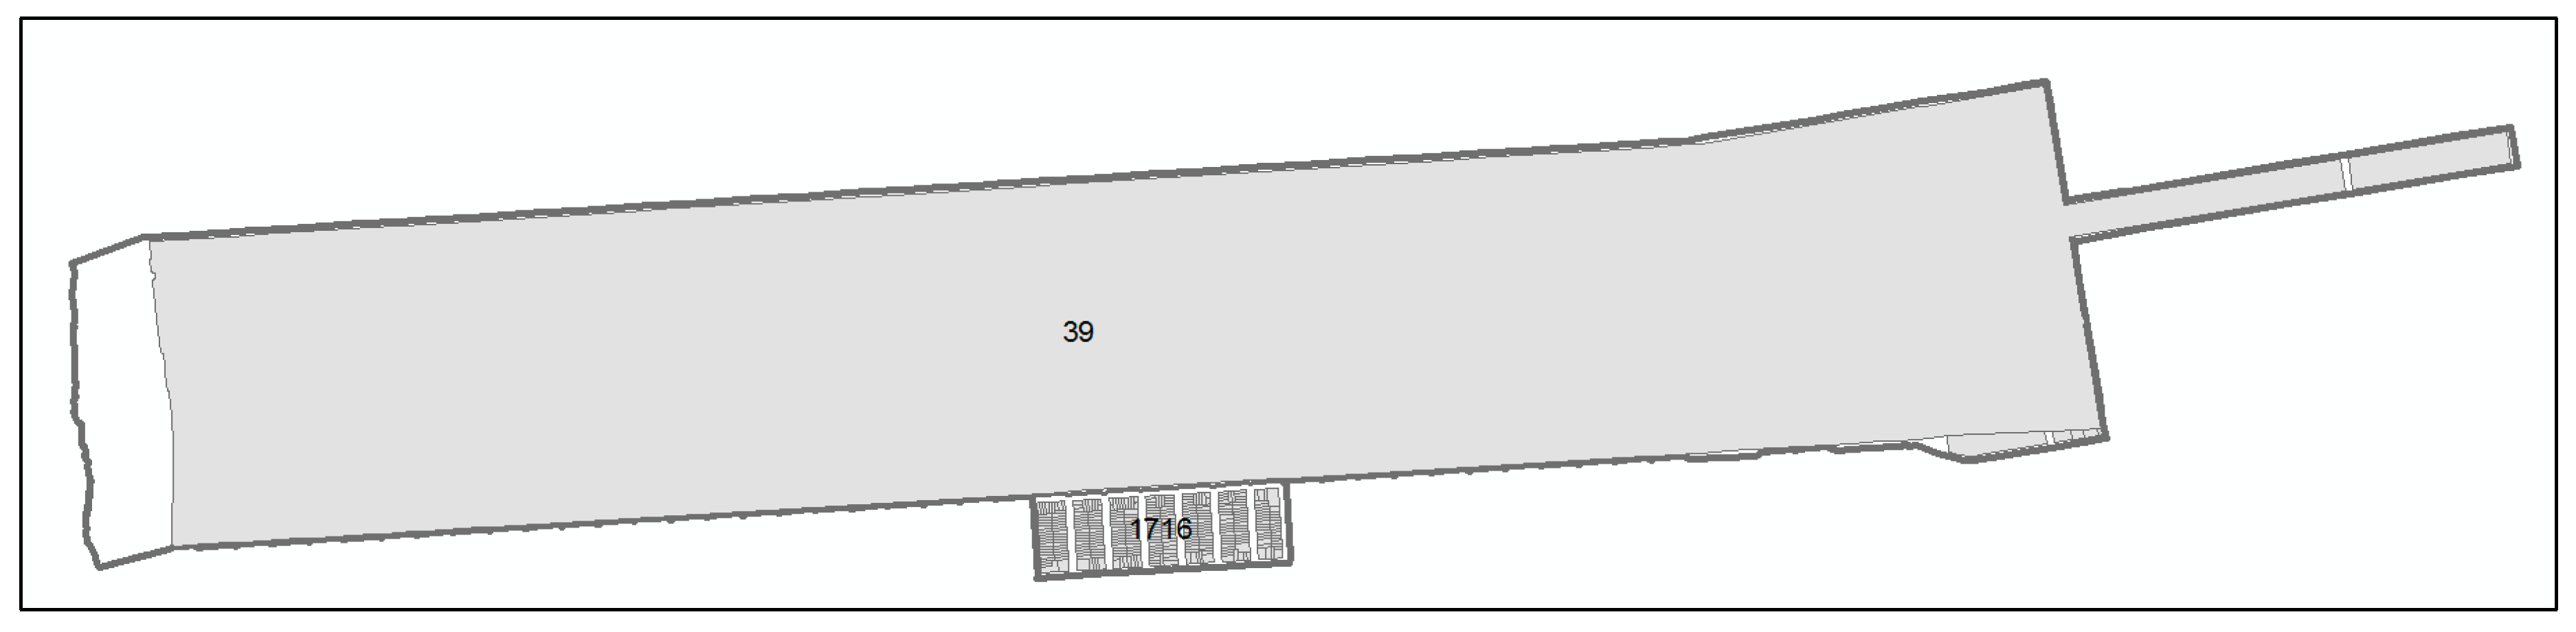
Figure 2 is an example where areal weighting will result in poor estimates by allocating majority of the population, 1755 in total in the two block groups, to the larger block group. In reality, the larger block group is Golden Gate Park with 39 residents only.
3.2. Residential Proportion
An improvement to areal weighting is to first differentiate residential versus non-residential areas, then assume that people live in residential areas only. This method is called binary dasymetric or residential proportion. During interpolation, the value of each source zone is allocated to its residential areas. The estimate for a target zone is then obtained by aggregating the population of each source zone falling in this target zone, i.e.,
where
is the residential area in target zone
that falls in source zone
,
is the total residential area in source zone
,
is the proportion of the residential area in target zone
falling in source zone
. Residential proportion is an improvement to areal weighting, but its assumption that people only live in residential areas is still not reasonable in urban cores. For example, the Golden Gate Park in
Figure 1 does not have a population of 0. Moreover, multi-level condominiums and single-family detached housing both appear as residential land use, but their population densities are markedly different.
3.3. Parcel and Census based Method
We developed a new method to estimate population and subpopulation counts using parcel data and decennial census data as ancillary information. There are three steps in the new method. The first is to disaggregate 2013 ACS data from block groups to census blocks. ACS 2013 does not have data at block level, but the 2010 decennial census has. Since block group boundaries did not change between 2010 and 2013, each 2010 census block is nested in a 2013 block group. To estimate block-level population in 2013, we make the assumption that population change occurred uniformly within each block group between 2010 and 2013. The 2013 ACS block-group population is allocated to 2010 census blocks using the growth rate of the corresponding block group. For example, if a block group has a population growth of 50% from 2010 to 2013, all blocks within it are assumed to experience that growth rate. A block with 50 people in 2010 is thus estimated as 75 in 2013.
Subpopulation variables fall in two categories depending on whether their data are available at block level in 2010. Race, ethnicity, age, and sex data are available; poverty, education, and unemployment data are not. When a variable’s 2010 census data are unavailable at block level, its 2013 census value is allocated pro rata to blocks. For example, if a block accounts for 10% of the population of a block group in 2010, then 10% of the people in poverty in that block group in 2013 is allocated to the block, i.e.,
where
and
are the variable’s value in 2013 at block and block group level, respectively,
and
are the population count in 2010 at block and block group level, respectively. For variables with values available in 2010 at block level, e.g., black/African American population count, there are two options to estimate their values in 2013 at block level. One is to apply the method in Equation (3) by assuming that black/African American population is distributed evenly among the population within a block group. The other is to use Equation (4) which assumes that blocks in the same block group experienced the same growth rate from 2000 to 2013. For example, if black population in a block group grew 20% from 2010 to 2013, a block with 5 black people in 2010 in this block group is estimated to have 6 black people in 2013. Intuitively, the method in Equation (4) should be more accurate since it recognizes the heterogeneity of subpopulation within a block group. We experimented both methods in order to identify the better one.
Once data are disaggregated from block groups to blocks, the next step is to identify the blocks intersected by neighborhoods. Such blocks, which account for only 3% of all blocks, are disaggregated using the parcel map. The number of housing units in each parcel is determined and aggregated to block level so that the average number of people or subpopulation in each unit can be calculated. A crosswalk file is then created to allocate blocks to neighborhoods. Using this crosswalk file, the final step is to aggregate block-level estimates to neighborhood level - astraightforward step using GIS.
4. Accuracy Assessment
To evaluate the new areal interpolation method, accuracy assessment must be conducted. Ideally, ground truth at neighborhood level is available and the output from each method in
Section 3 is compared with it. However, this is not feasible in our research. Were the neighborhood data available, areal interpolation would not be needed in the first place. In fact, the lack of ground truth is the primary reason why accuracy assessment has not been discussed in the literature as extensively as the technical implementation of areal interpolation methods. Instead, we evaluated the three methods using simulated data. The proposed method uses three sets of zones where intermediate zones nest in source zones but not necessarily in target zones. To conduct accuracy assessment, simulated source, intermediate, and target zones resembling the same relationship were created. The simulated target zones were ACS 2013 census tracts whose population and subpopulation values are available. Simulated source zones, 465 in total, were created by first identifying block groups whose nearest neighbor falls in a different census tract. Each such block group was merged with its nearest neighbor; the others remained intact. The same method was used to create 7258 simulated intermediate zones, each of which was either an original block or one created by merging a block with its nearest block. When identifying the blocks to merge, we required that a block’s nearest neighbor must be in the same simulated source zone but a different simulated target zone. In this way, the simulated intermediate zones are guaranteed to nest in simulated source zones, but simulated source and intermediate zones do not always nest in simulated target zones, thus the need of areal interpolation.
The three interpolation methods were assessed using the simulated data. Their estimates were compared with census-reported values. Root Mean Squared Error (RMSE) was calculated to summarize the accuracy:
where
is the number of simulated target zones,
and
are the census-reported value and the estimated value for simulated target zone
. RMSE is equivalent to the standard error of a regression between the estimates and census data. Median absolute error was also calculated to supplement RMSE. Standard error percent, which is RMSE divided by the mean of the source zone values, was calculated to understand the overall error percentage. Standard error percent is not impacted by data unit and therefore appropriate to compare the accuracies between geographical areas. The absolute error percent of each target zone was also calculated whenever possible. Because several target zones had a
, the denominator when calculating an error percentage, of 0, median was used to summarize the result.
5. Results and Discussion
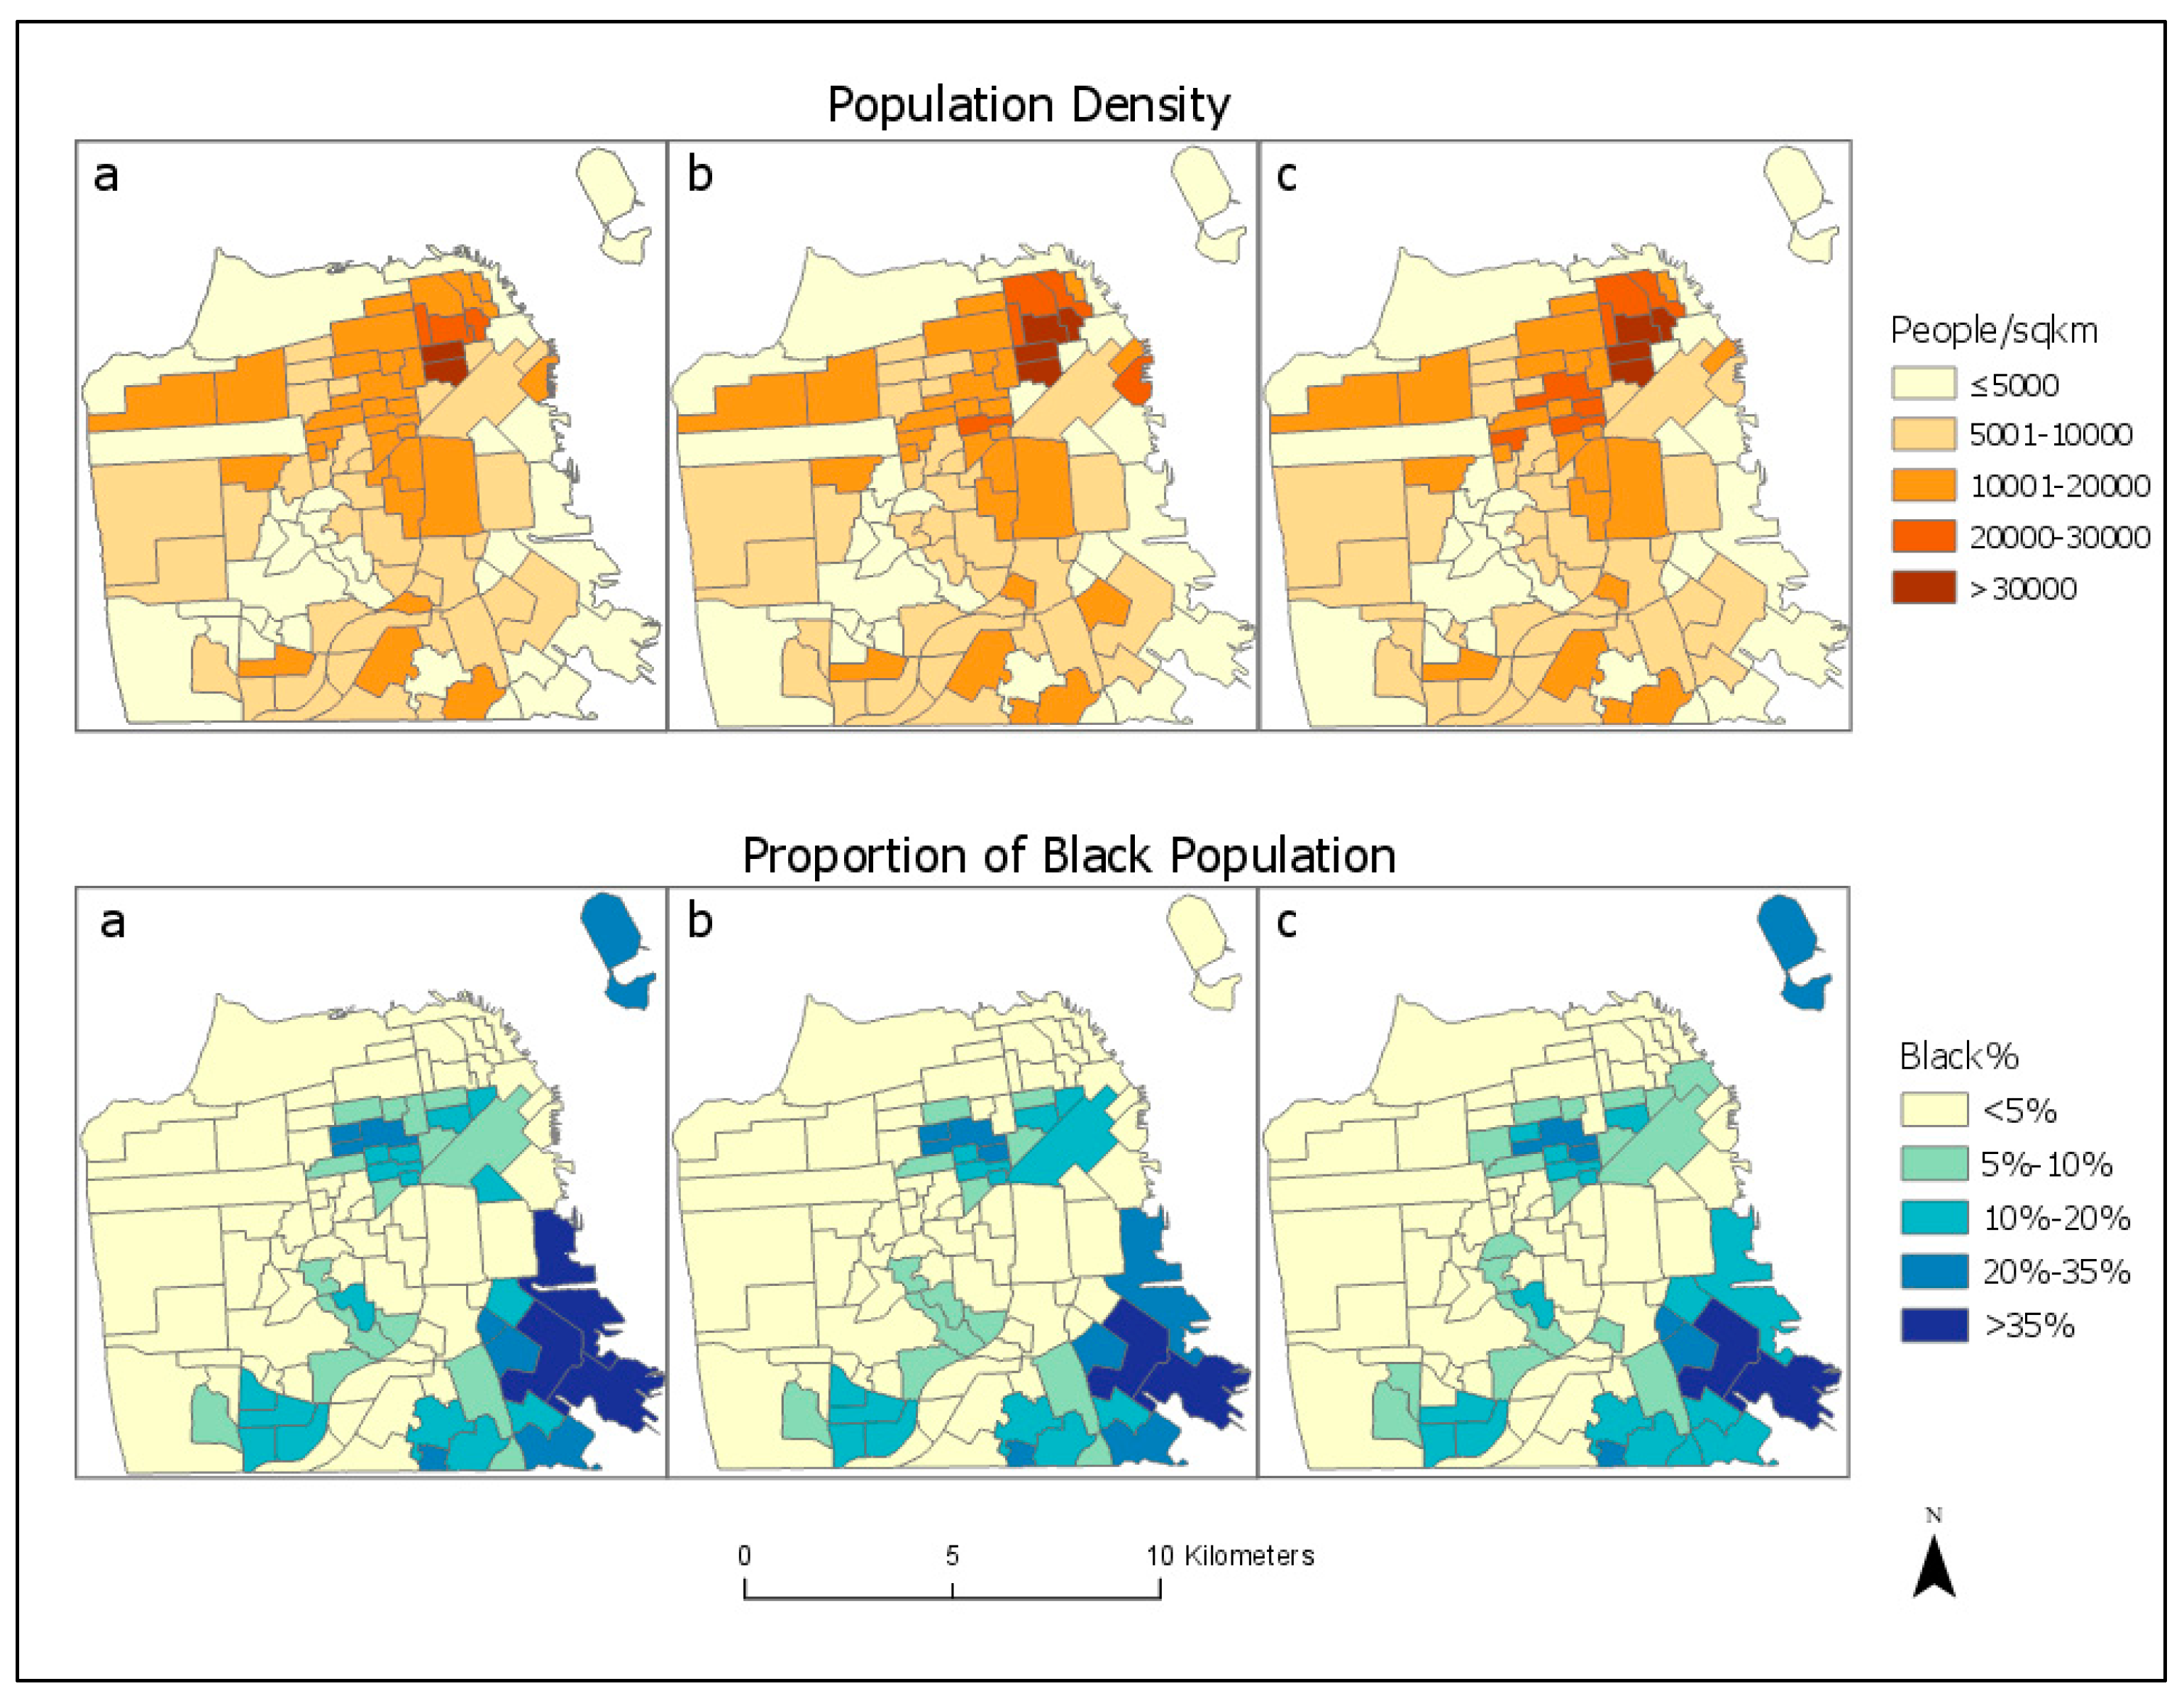
We implemented the three methods: areal weighting, residential proportion, and parcel-and-census-based interpolation, and applied them to estimate population and subpopulations in San Francisco. Count variables, such as total population and black/African American population, can be estimated directly by each method. Quotient variables which are the ratio of two counts, e.g., the proportion of black/African population or the proportion of people in poverty, can also be estimated by dividing the estimated counts. Other non-count variables such as median household income cannot be estimated yet using any areal interpolation methods as far as we know. For illustration purpose, results on population and black/African American are reported in
Figure 3 in the form of population density and proportion of black/African American population. Population count is the standard variable in areal interpolation. Black/African American is a subpopulation variable whose data in 2010 is available at intermediate zone level (i.e., census block). As explained previously, when data at intermediate zone level exists, there is the option of using it (Equation (4)) or not (Equation (3)). We examined both options to assess the utility of block-level decennial census data.
Table 2 summarizes the accuracy of each method on each variable.
The results in
Table 2 suggest that the estimation errors are positively skewed in all three methods. Overall, our method of using parcel and census data excels in all variables especially population count. The RMSE of our method is 50% less than those of the other two methods, the median absolute error is 16 in contrast to 273 in residential proportion and 302 in areal weighting, and the standard error percent is about 4% compared to 10–11% in the others. For the black/African American count, which is much more spatially clustered (Moran’s I = 0.29), our method also performs better than the other two, with a smaller RMSE and a median absolute error of nearly 0. In particular, the median percent absolute error is less than 1% compared to 12–13% in the other two methods. Between the options of using block-level 2010 decennial census data or not, using decennial census data (Equation (4)) results in slightly smaller RMSE and standard error percent, and a much smaller median percent absolute error. This suggests that, if block-level decennial census data are available, they should be used as ancillary information as in Equation (4).
In estimating quotients such as the proportion of blacks/African Americans, our method remains more accurate. The RMSEs and standard error percent of all three methods are similar, but the median percent absolute error of our method is much smaller. Despite this, the standard error percent is 31% though the median percent absolute error is 0.4%. That quotient variables are estimated less accurately is not surprising. The proportion of blacks/African Americans is obtained by dividing the estimated black/African American population count by the estimated total population count. If the two counts are estimated with similar accuracy, errors may cancel out each other during normalization, making the quotient estimated with a similar accuracy. As shown in
Table 2, however, population count is estimated much more accurately than the black/African American count. The standard error percent is about 5% for the population count when parcel and decennial census data are used, but 27–31% for black/African American count. Normalization cannot cancel out the errors but results in even poorer accuracy.
Summarizing the results, we have several observations. First, while we have hypothesized that residential proportion is more accurate than areal weighting, the improvement gained by using residential land use information is rather minor. This is probably because San Francisco is so highly developed, nearly all of it has been developed with some residential uses except the east side which is characterized by commercial, and industrial land use therefore accounts for only a smaller portion of the city’s total population. Overall, while residential proportion is an improvement over areal weighting, it is not much more effective in densely populated urban cores.
Our second observation is that, in all variables, areal interpolation using parcel and decennial census data result in higher accuracy. In particular, the use of decennial census data at block level, as in the case of black/African American count, results in significantly higher accuracy. However, the more spatially clustered a variable is, the more challenging it is to areal interpolation. In our study, the Moran’s I of population count, black/African American count, and proportion of black/African American are 0.07, 0.29, 0.31, respectively. The black/African American count shows a much stronger spatial clustering than the population count. As a result, its areal interpolation is much less accurate. Similarly, the proportion of Black/African American is even more spatially clustered; its disaggregation is therefore most challenging. In the literature, most areal interpolation methods concern population count only. Our study suggests that methods effective for population count may not be equally effective for subpopulation count. An expansion of research to subpopulations, especially those that are spatially clustered, is necessary.
The new interpolation method presented in this study uses two pieces of ancillary information that are not used by areal weighting and residential proportion: parcel data and the 2010 decennial census data. We attribute the higher accuracy of this method on total population to parcel data, because parcel data provide accurate information on not only the land use but also the number of dwelling units in each parcel. In a highly urbanized city like San Francisco, traditional residential developments of low-density single-family housing can no longer sustain its rapid growth. In addition to an increasing number of two- or three-unit housing, the current trend is to develop vertically by building high-density condominiums where multiple residential units coexist with commercial units. As a result, a single map of the spatial distribution of residential land is no longer adequate for areal interpolation. In the literature, several studies used sampling to estimate the varying population density or housing density (e.g., [
14]), but the lack of training data makes this approach not very accurate. A parcel map, in contrast, provides the actual number of properties in each parcel and their corresponding zoning codes, enabling more accurate estimate in each source zone and target zone.
While a parcel map is very effective in areal interpolation of total population, our research did not find it particularly useful in disaggregating spatially clustered variables such as the proportion of blacks/African Americans. This is probably due to the lack of strong association between subpopulation and living accommodations. Instead, the other piece of ancillary information, the block-level 2010 decennial census data, is proven more useful. This is demonstrated by the comparison between using Equation (3) and Equation (4) to interpolate the black/African American count and proportion in
Table 2.
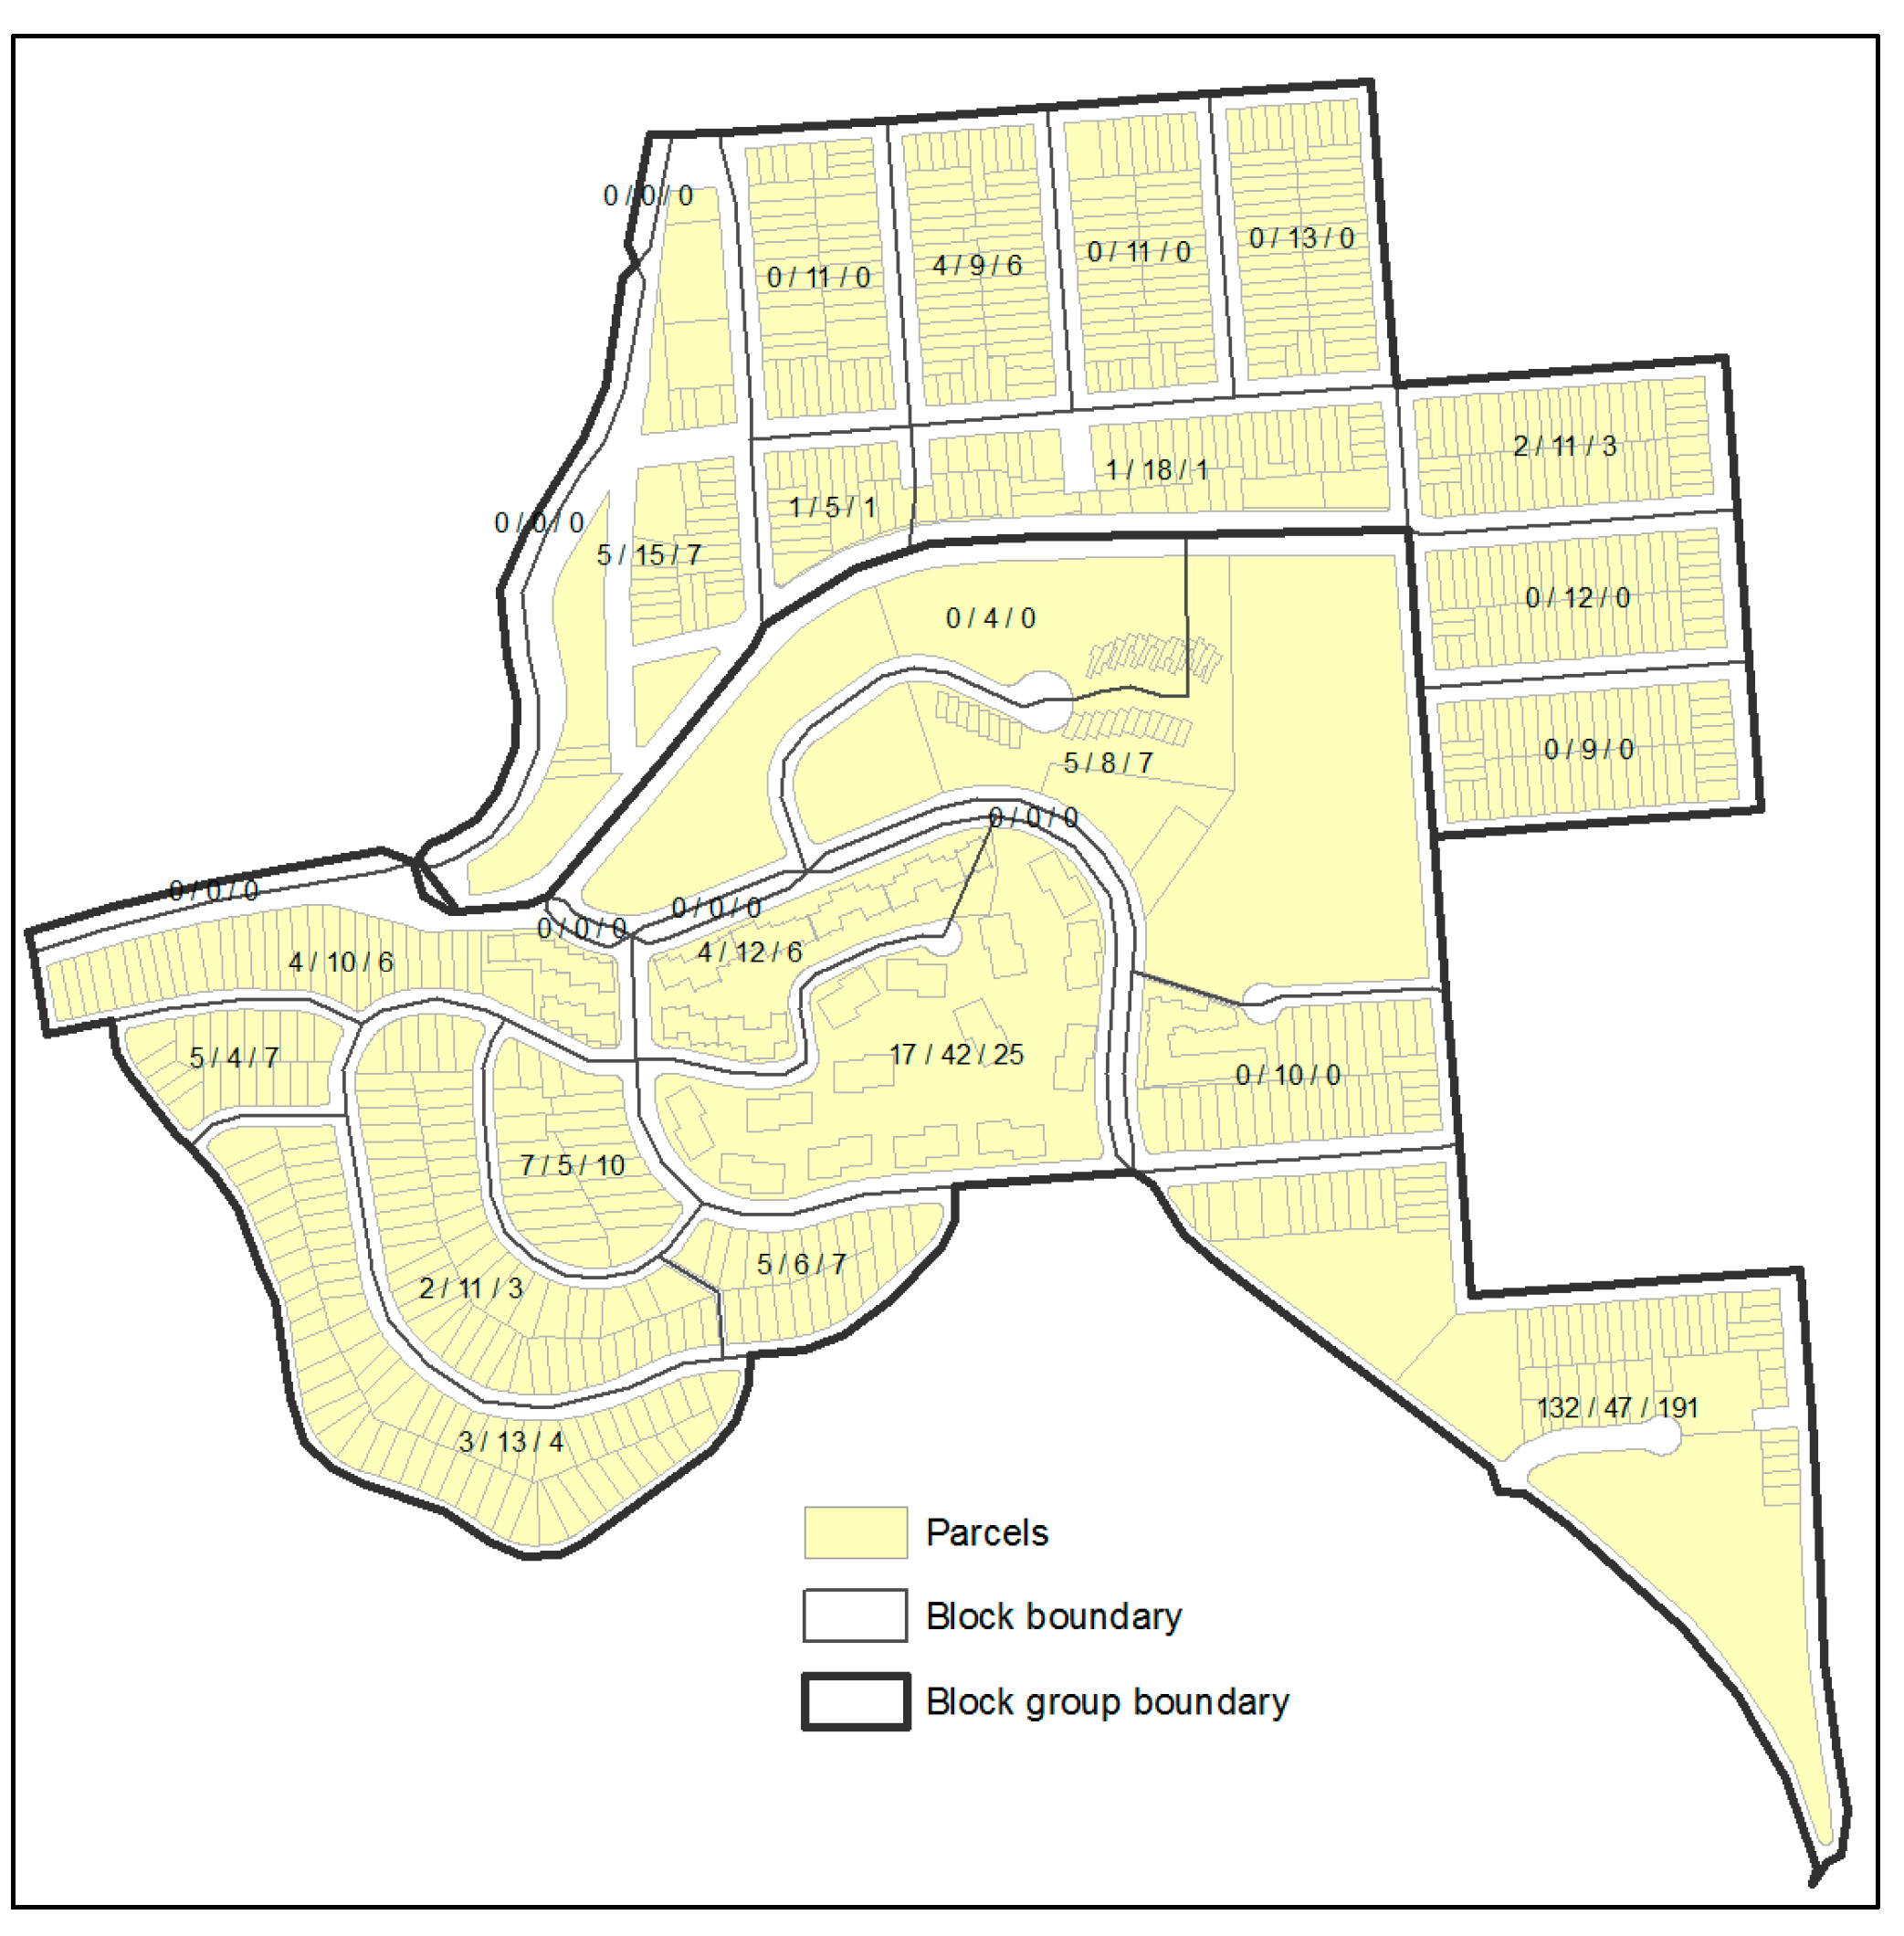
Figure 4 is another example where the two block groups together have 285 black/African American people in 2013. The smaller block group has a population of 1422; the larger 2214. The Black/African American population clustered in the southeast corner in 2010. Each block is labelled with its black/African American count in 2010, the estimated black/African American count in 2013 according to Equation (3), and the estimate according to Equation (4). When Equation (3) is used, the smaller block group is estimated to have 114 black/African American people and the larger block group to have 172. When Equation (4) is applied, the smaller block group is estimated to have 18 black/African American people and the larger block group to have 267. In reality, the smaller block group has 0 blacks/African Americans and the larger block group has 285. Equation (4) produces clearly better accuracy. Admittedly, even with the 2010 census data, areal interpolation in such scenarios remains difficult. Identification of effective ancillary data for subpopulation estimation, especially those that are spatially clustered, deserves more attention in future research.
6. Conclusions
Areal interpolation is a classic research problem in Geographical Information Sciences. Given the reality that most socioeconomic data can only be obtained at certain geographical scales or units but research has to be conducted at other scales or units, effective areal interpolation is necessary. While many studies have been conducted on it, very few focused on highly developed urban environments characterized by complex land uses and high-rise developments. Even fewer explored interpolation of subpopulations. In this study, we developed a new areal interpolation method using parcel and decennial census data as ancillary information, and compared it with two other areal interpolation methods. By using two pieces of ancillary information, the proposed method produces significantly better accuracy than areal weighting and residential proportion, especially in subpopulation estimation. While parcel and census data are not universally available, they are available in many developing countries. In the U.S., with the Department of Housing and Urban Development’s plan to build a standardized national database of parcels, it can be expected that parcel data like that used in this research will be available for the entire country in the future. The proposed areal interpolation method thus has the potential to be generalized to other metropolitan areas.
The proposed areal interpolation method has several notable advantages. The primary one is that it obtains residential data directly from the most authoritative source of county parcel maps, obviating the need of extracting physical structure information through urban remote sensing. Its relatively straightforward implementation also makes it accessible to analysts from demography, urban planning, epidemiology and public health who are familiar with vector GIS but have limited exposure to remote sensing. The proposed method is also pcychnolatic, meaning that source-zone values are preserved. Finally, there are some studies on using parcels and zoning data in areal interpolation, but decennial census data have been rarely explored as ancillary information. Furthermore, population is often assumed to reside in residential or commercial areas only. This is reasonable but not always accurate. As illustrated in
Figure 2, even parks may have some residents. Decennial census data help correct such situations as shown in
Figure 4. On the other hand, like all other methods using parcel data, our method also has to make certain assumptions. While other methods assume that population/subpopulation are equally distributed within parcels in a block group or census tract, our method assumes that the growth rate since a decennial census is the same for all blocks within the same block group. It also assumes that the proportion of a block’s subpopulation in the corresponding block group remains the same since the latest decennial census. These assumptions certainly do not hold well for areas undergoing rapid changes. Further research is needed to compare the impact of different assumptions on areal interpolation accuracy.
Another contribution of our research is accuracy assessment. In the literature, an areal interpolation method is often described in sufficient details of its technical implementation, but its accuracy is not always assessed. There are two aspects in accuracy assessment: comparison between different areal interpolation methods so as to identify the most effective one; and testing an areal interpolation method in different study sites so as to evaluate its accuracy consistency. Like many other research on areal interpolation and dasymetric mapping, our study is only able to use San Francisco as a case study. However, it provides a method to systematically create simulated source, intermediate, and target zones so that the new method can be evaluated in other areas. In the future, perhaps benchmark datasets of varying degrees of settlement pattern complexity can be designed to compare the performance of different methods, as has been done in remote sensing [
43].
While the proposed method is found more accurate than areal weighting and residential proportion, its effectiveness on interpolating spatially clustered variables needs further improvement. In our research, all three methods work the best on population count, which has the least spatial clustering. Parcel data are useful in disaggregating the population count and housing units, but decennial census data are more useful for subpopulation variables like the black/African American count. Identification of effective ancillary data to improve subpopulation estimation is a direction for future research. Another direction is to compare our proposed method with methods which also used parcel data but did not use decennial census data (e.g., [
32,
44]). In those methods, residential units of each block group are determined first based on the parcel map; block-group level data are then disaggregated to parcels within. This effectively creates a parcel-level dasymetric map. Our proposed method can also create such a parcel-level dasymetric map by disaggregating block-level estimates to the parcels within. A comparison between the two dasymetric maps should be conducted to identify the better one. The better dasymetric map will not only be useful for large target zones like neighborhoods, school districts, watersheds, and flood plains, but also small ones like buffers around highways or transportation oriented developments. There are many directions for future research on areal interpolation; developments of methods for highly developed urban cores and subpopulation are two among them.


