A Methodology for Heterogeneous Sensor Data Organization and Near Real-Time Data Sharing by Adopting OGC SWE Standards

Abstract
:
1. Introduction
2. Related Work
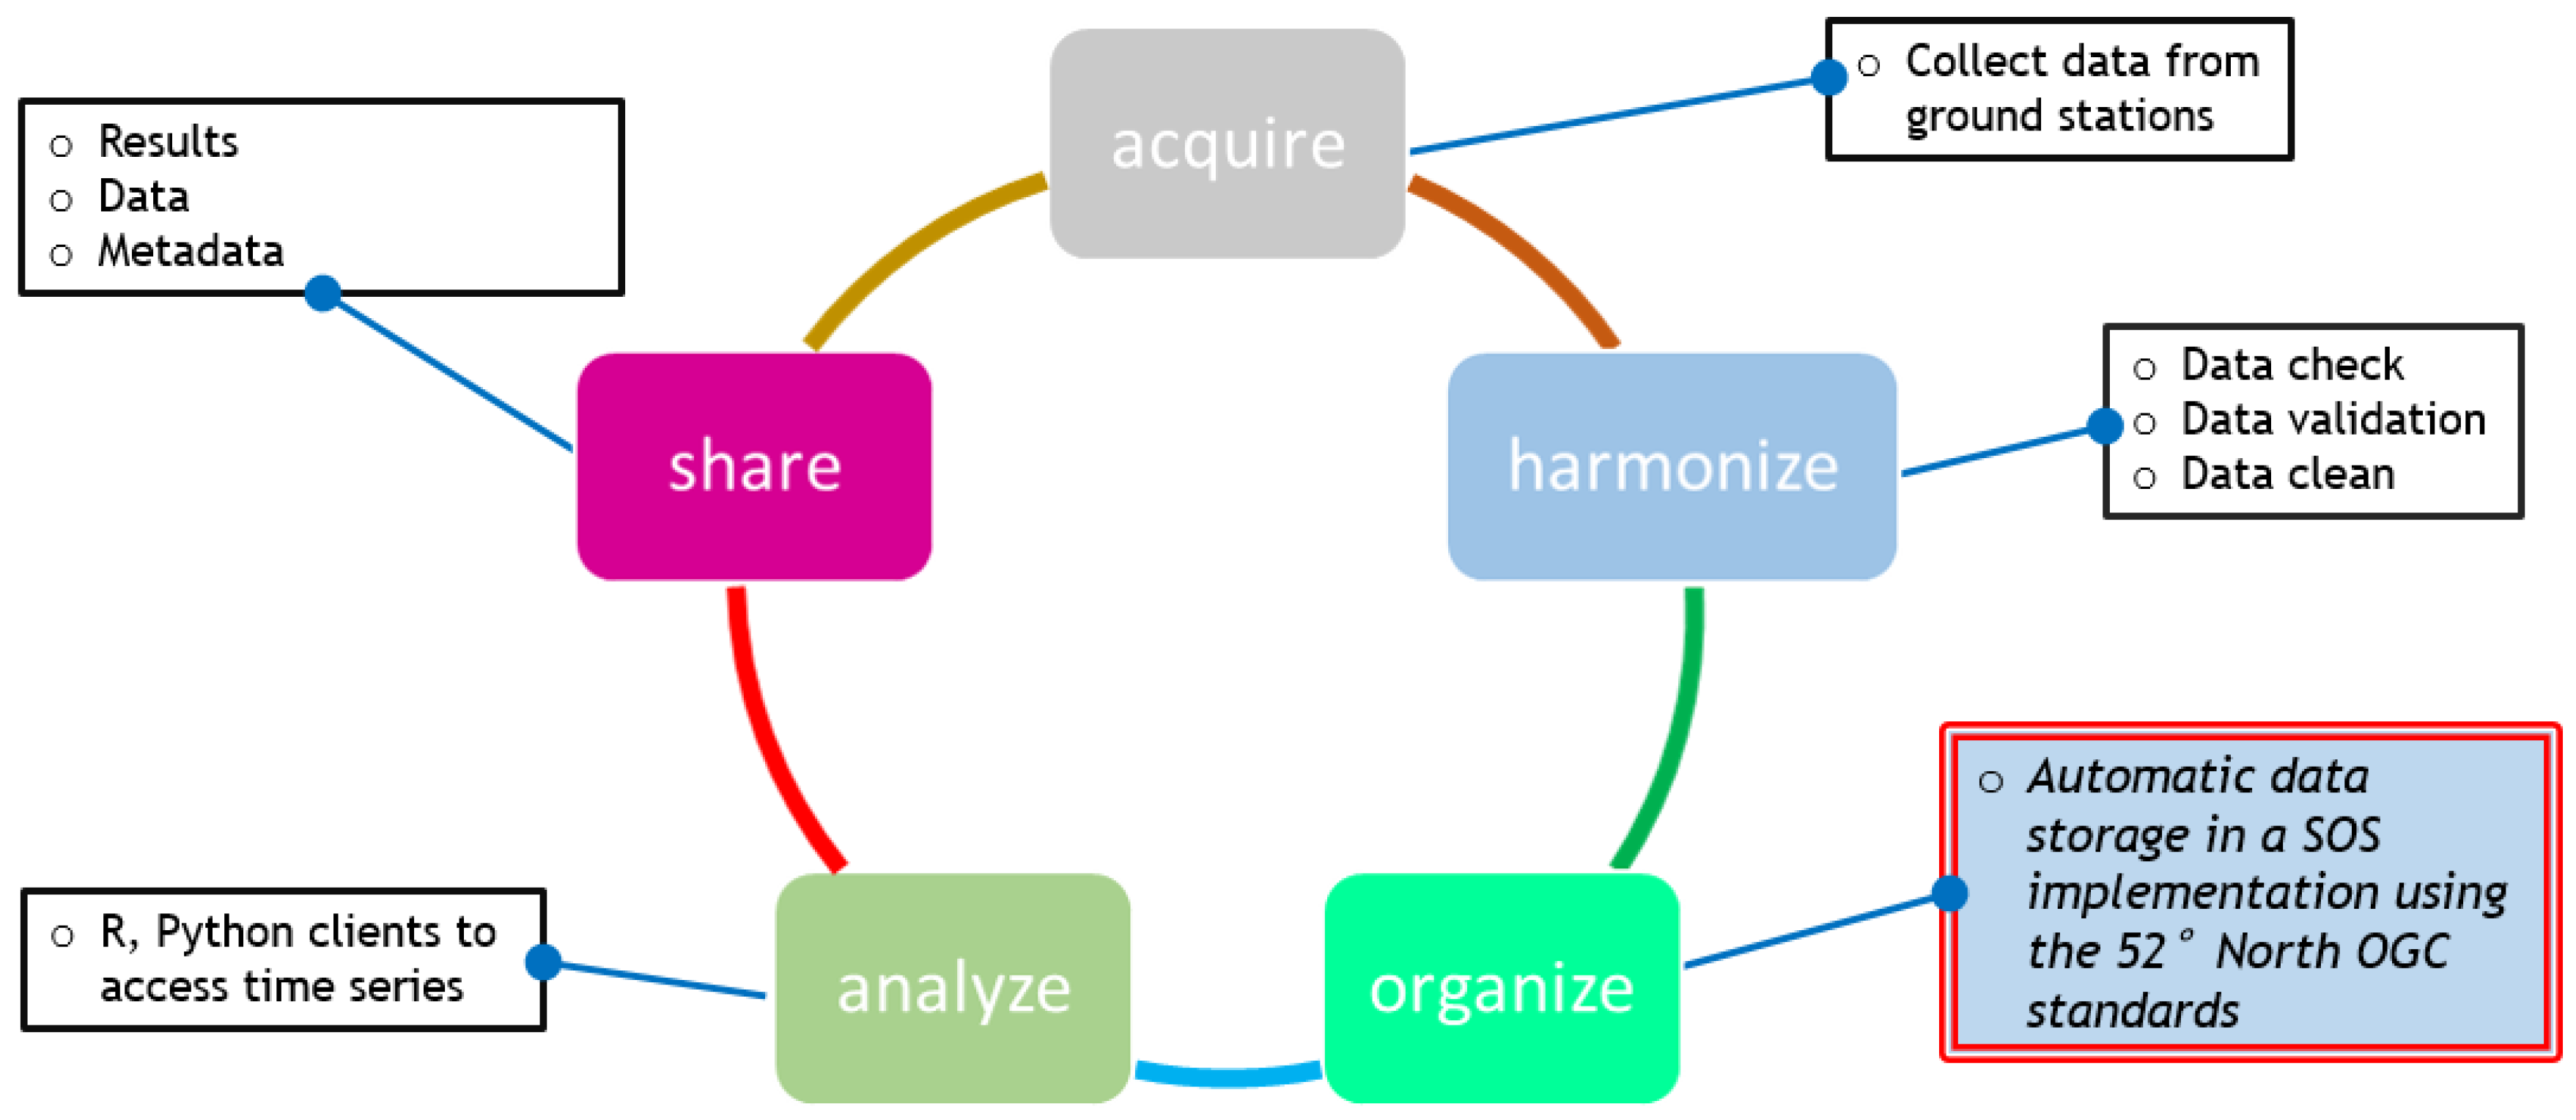
3. Data Life Cycle
4. Implementation Design
- The User—motivation, enjoyment, satisfaction, personality, and experience level;
- Task Factors—easy, complex, novel, task allocation, repetitive, monitoring, skills, and components;
- Productivity factors—increase output, increase quality, decrease cost, decrease errors, decrease labor requirements, decrease production time, and increase creative and innovative ideas leading to new products.
4.1. Acquisition
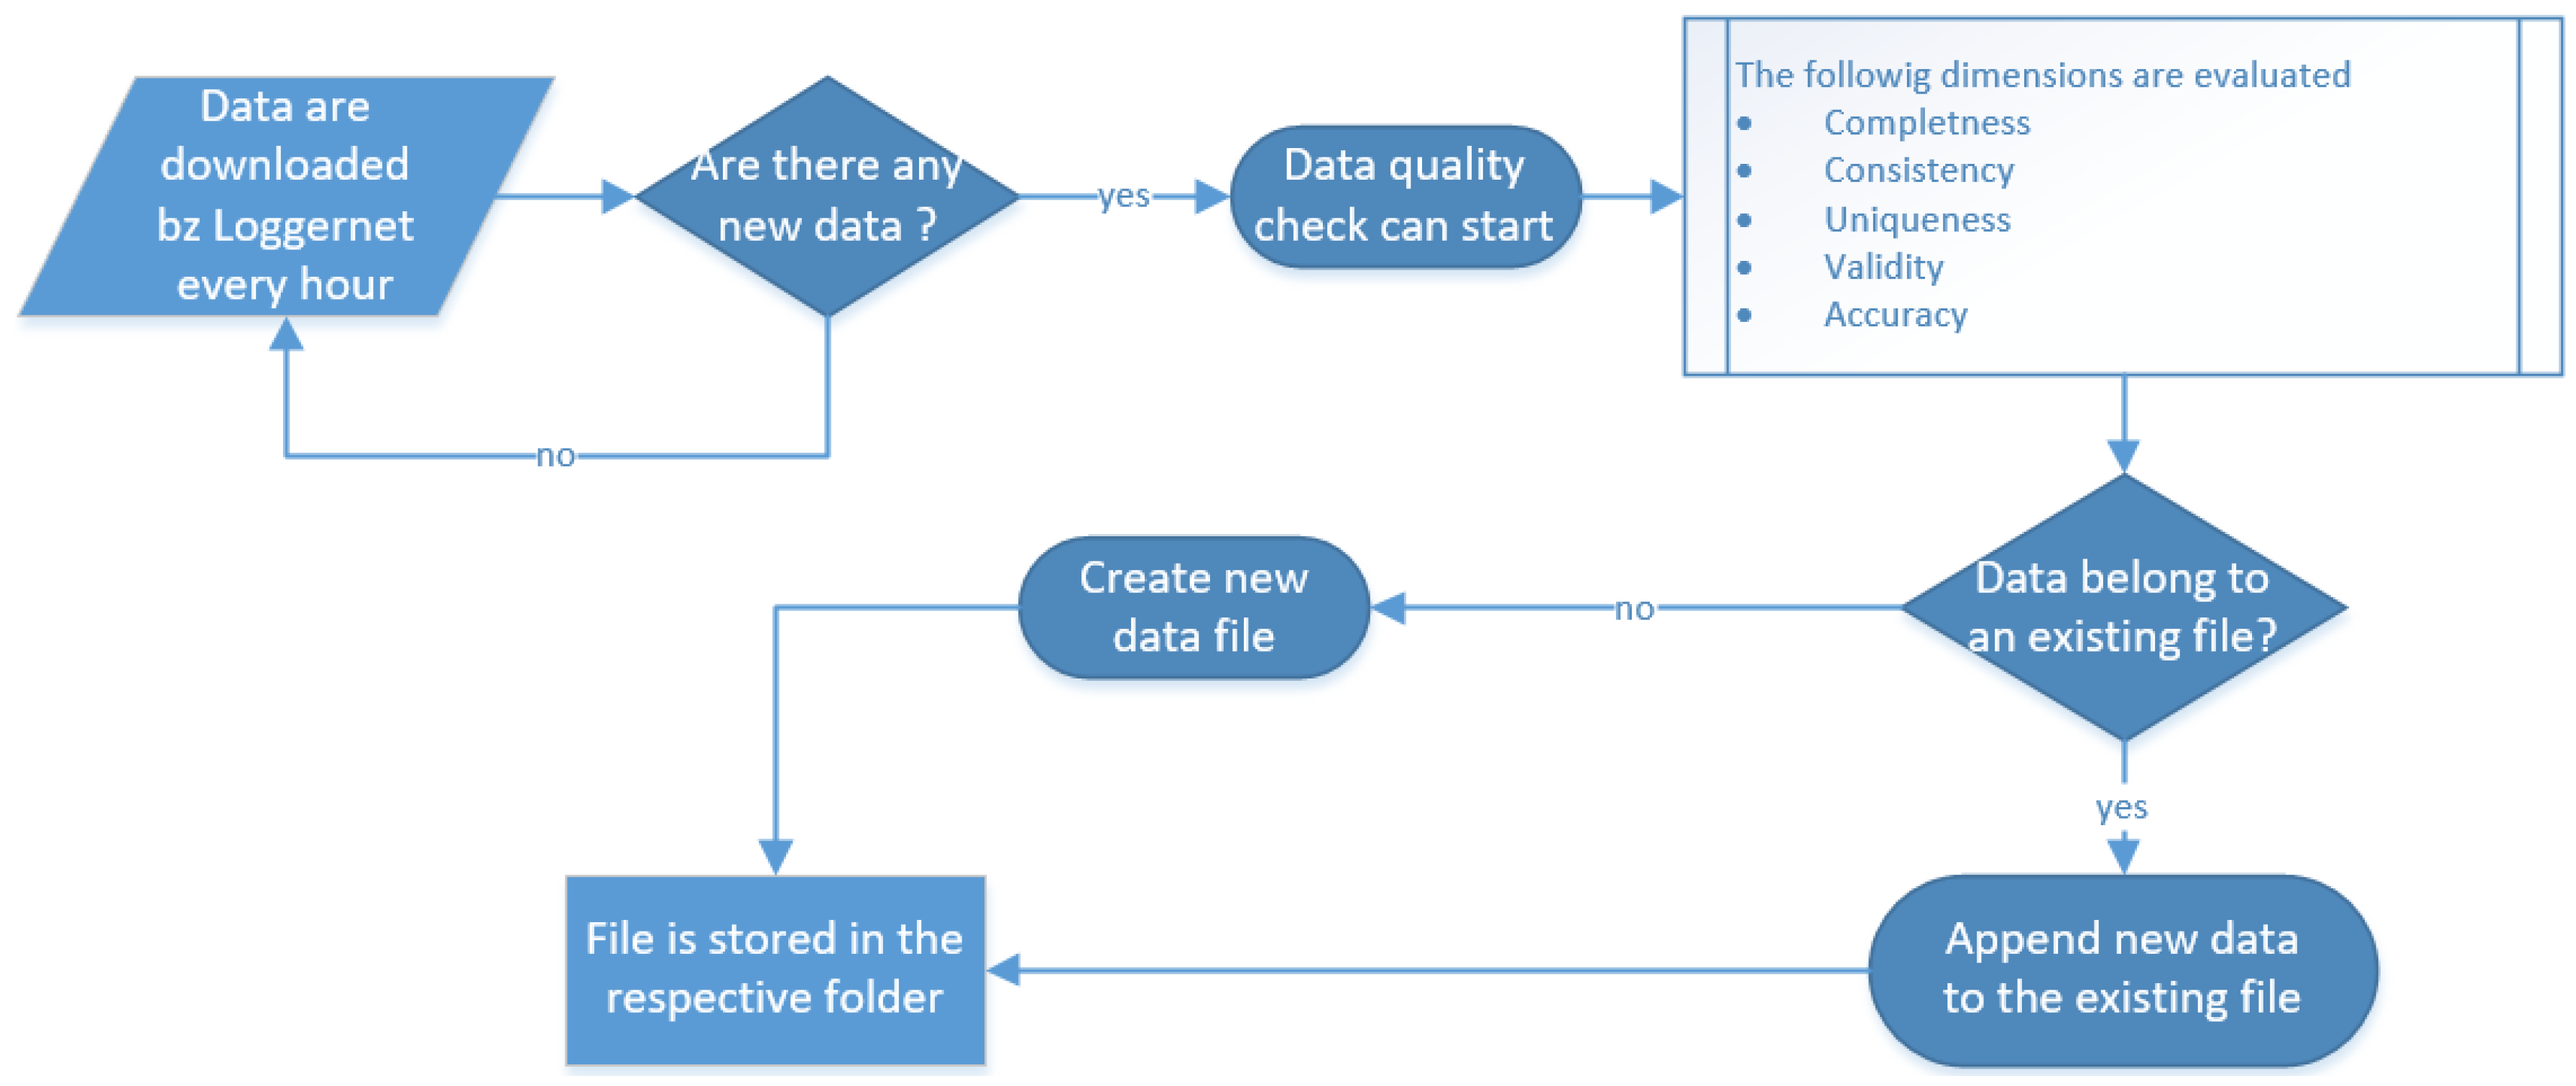
4.2. Harmonization
- Data completeness refers to whether there are any gaps in the data, between what was expected to be collected and what was actually collected.
- Data consistency refers to whether the types of data align with the expected versions of the data that should be coming in.
- Data uniqueness ensures that each record should be unique.
- Validity of data is determined by whether the data measures that which it was intended to measure.
- Data accuracy refers to whether the collected data is correct, and accurately represents what it should.
4.3. Organization
- InsertSensor: Register sensors in the DataBase (DB) following the SensorML standard.
- InsertObservation: Upload measurements into the DB following the O&M standard.
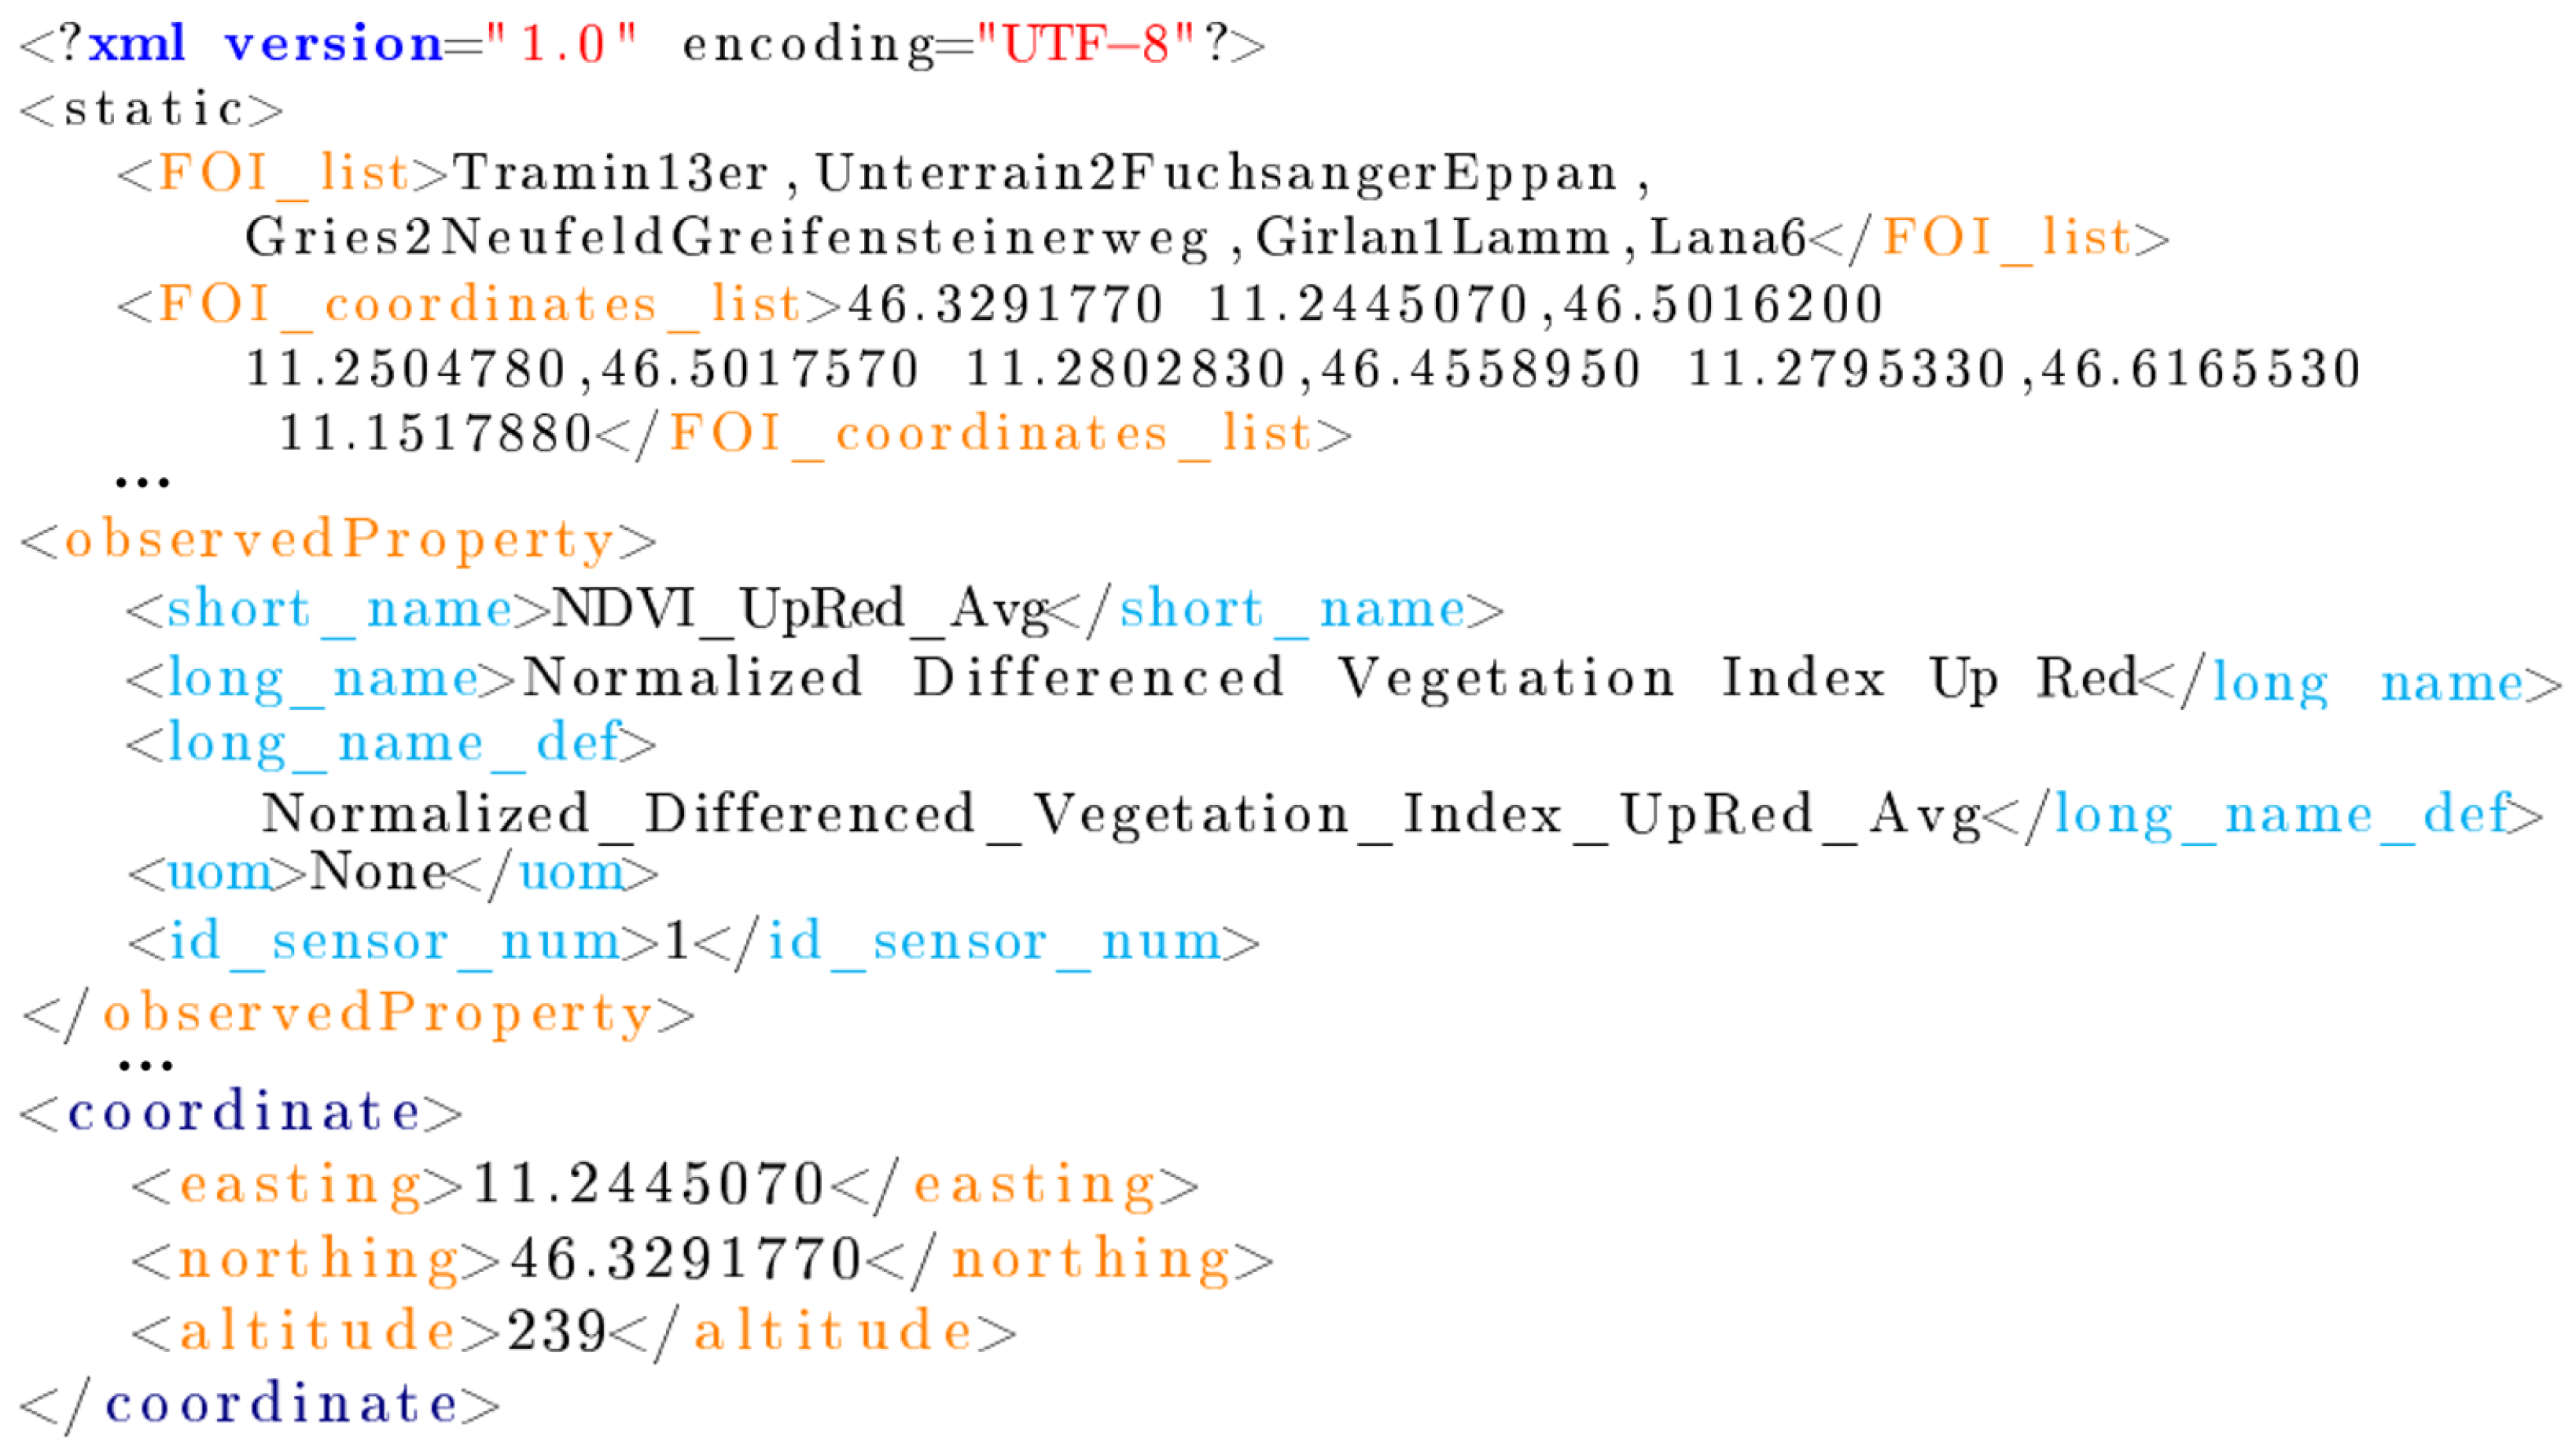
- PhysicalSystem: Identifier for the physical instrument in one of the platforms (stations).
- Offering: A group of parameters measured by one sensor. It is worth noting that one procedure (PhysicalSystem) can have multiple offerings, but the same offering cannot be applied to multiple procedures.
- Observable property: The output parameters of the sensors.
- Feature Of Interest (FOI): The coordinates and altitude of the station or platform where the sensor is installed.
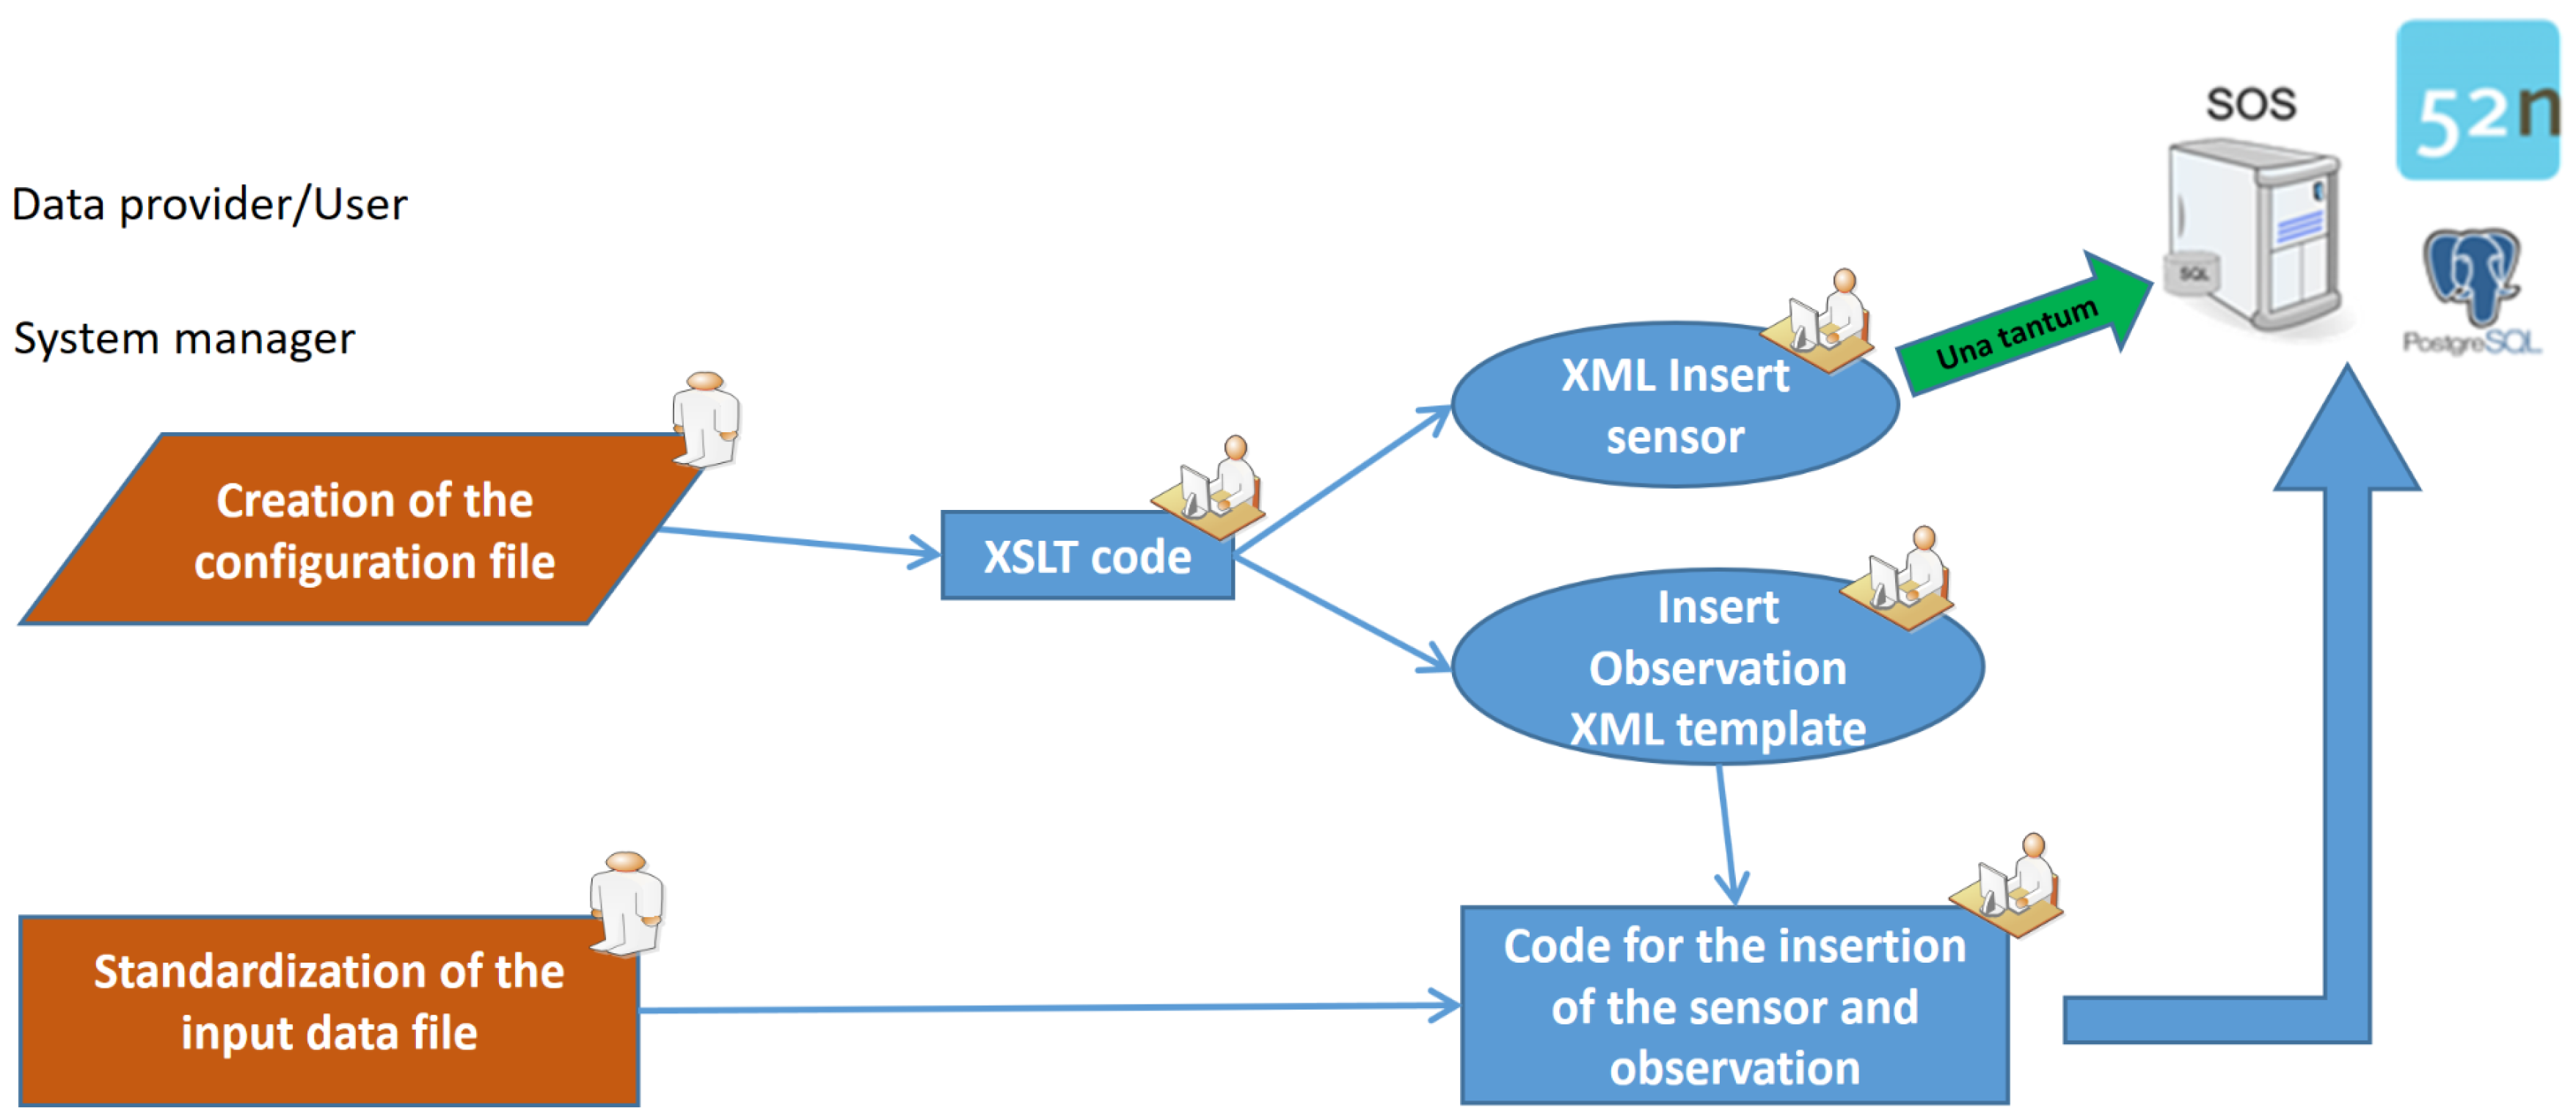
4.3.1. Methodology
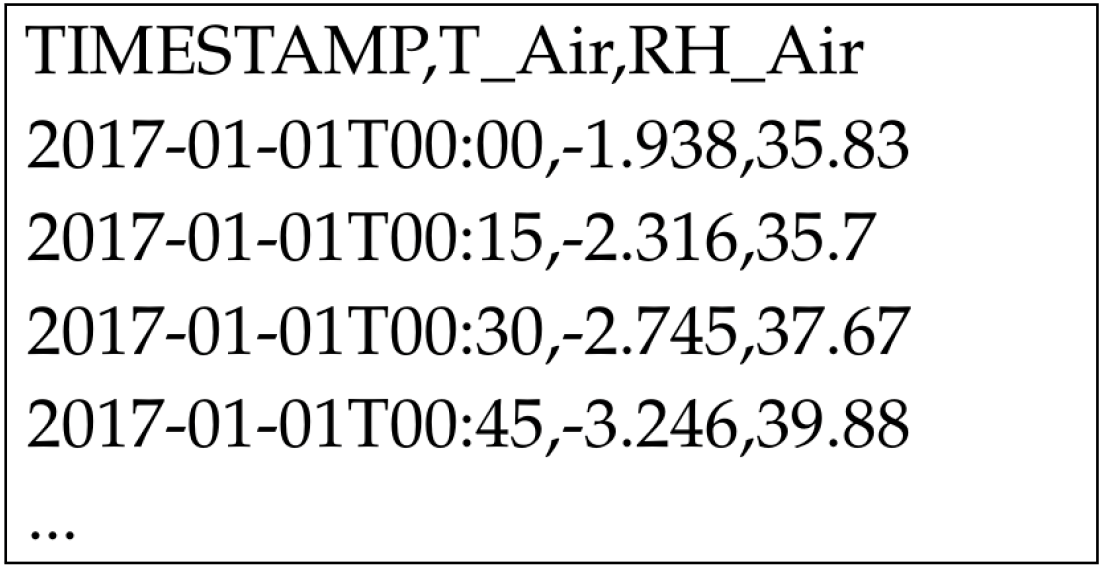
- A header describing the data column;
- an established date and time format, (i.e., YYYY-MM-DDThh:mm);
- the time-stamp is always stored in the first column; and
- a predetermined naming convention (i.e., XXX_FOI_XXX.csv).
- Run the environment_generator.sh script. This code creates the data folder structure and all the auxiliary files and folders for the insertion process.
- Save the the .csv input data files in the Data folder.
- Run the SOS_Insert_Sensor.py script once to register the sensors in the SOS service.
- Run the SOS_Insert_Observation.py script to upload the observation into the SOS service, every time new data are available.
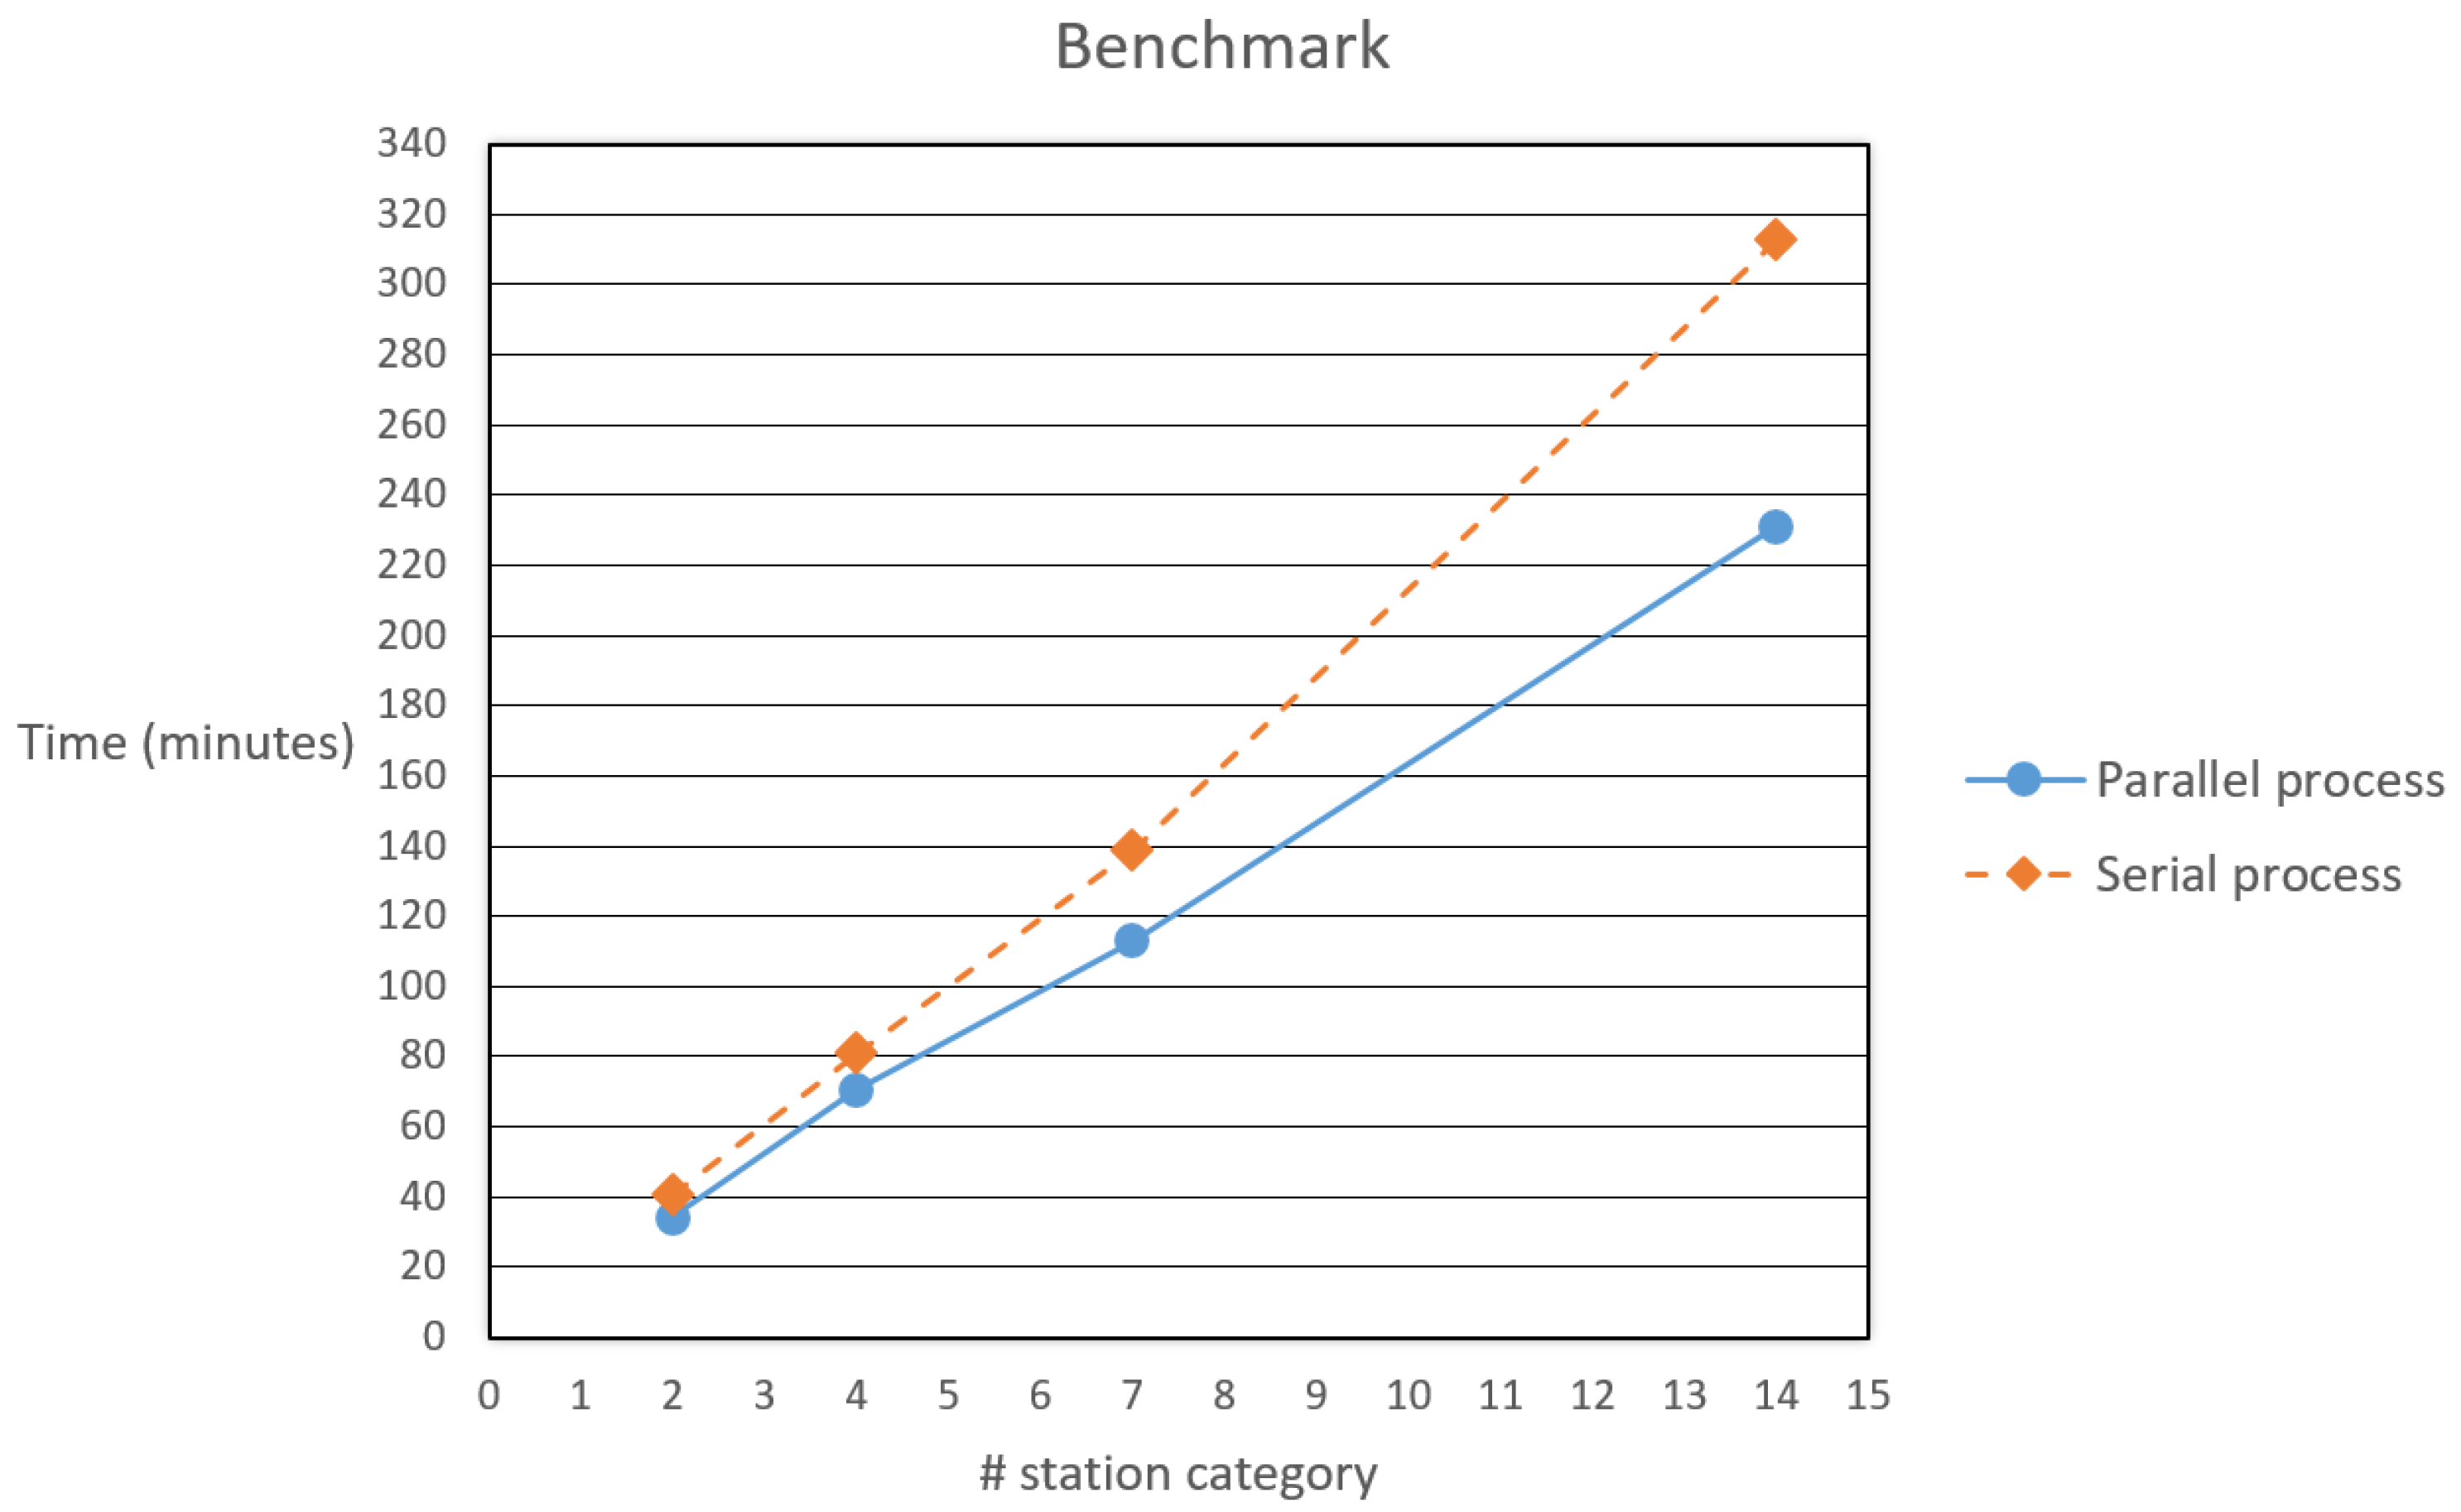
- Serial approach: The process reads every folder and .csv file of the sensor consequently, one after the other; and
- Parallel approach: The process analyzes multiple folders simultaneously and inserts multiple observations at the same time, assigning to each of the available computer’s cores the first available station category folder.
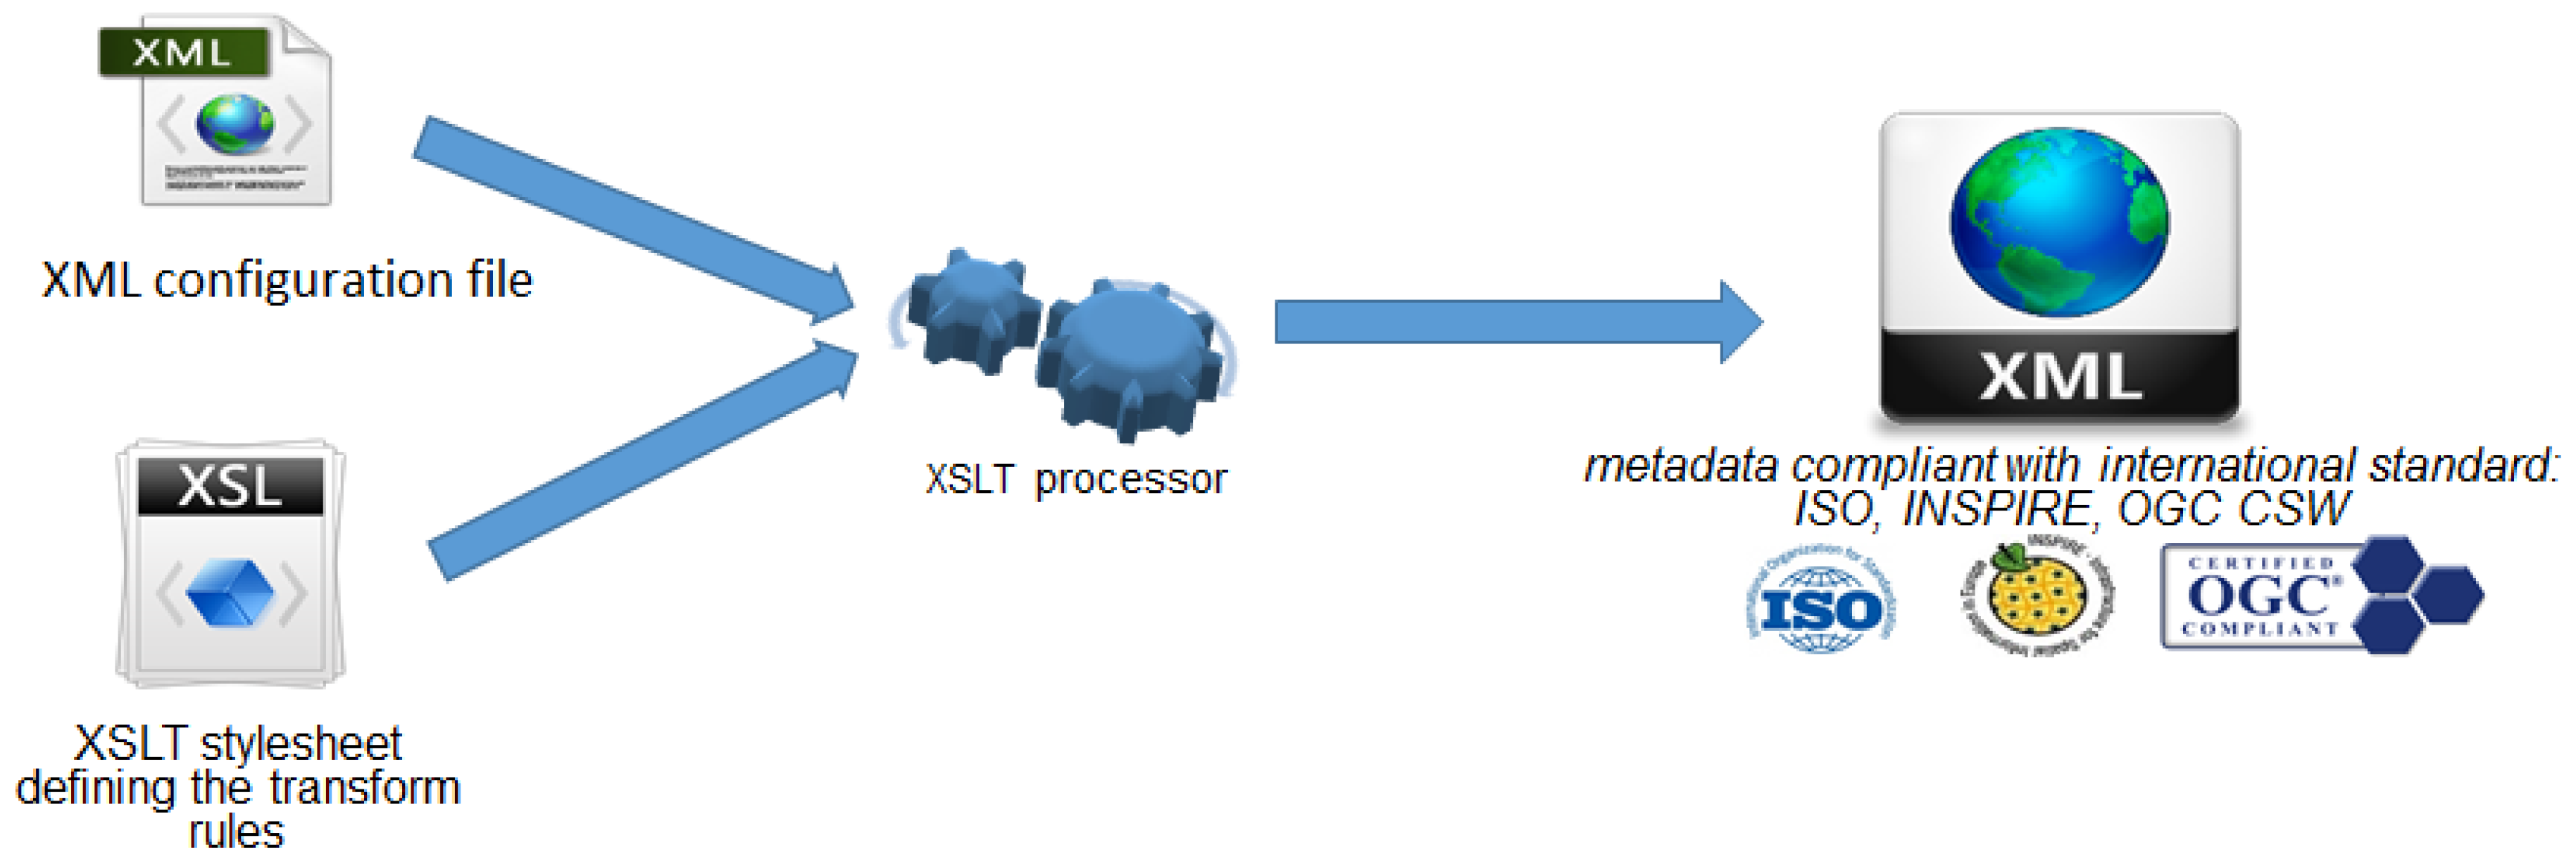
4.3.2. Metadata
4.4. Analysis
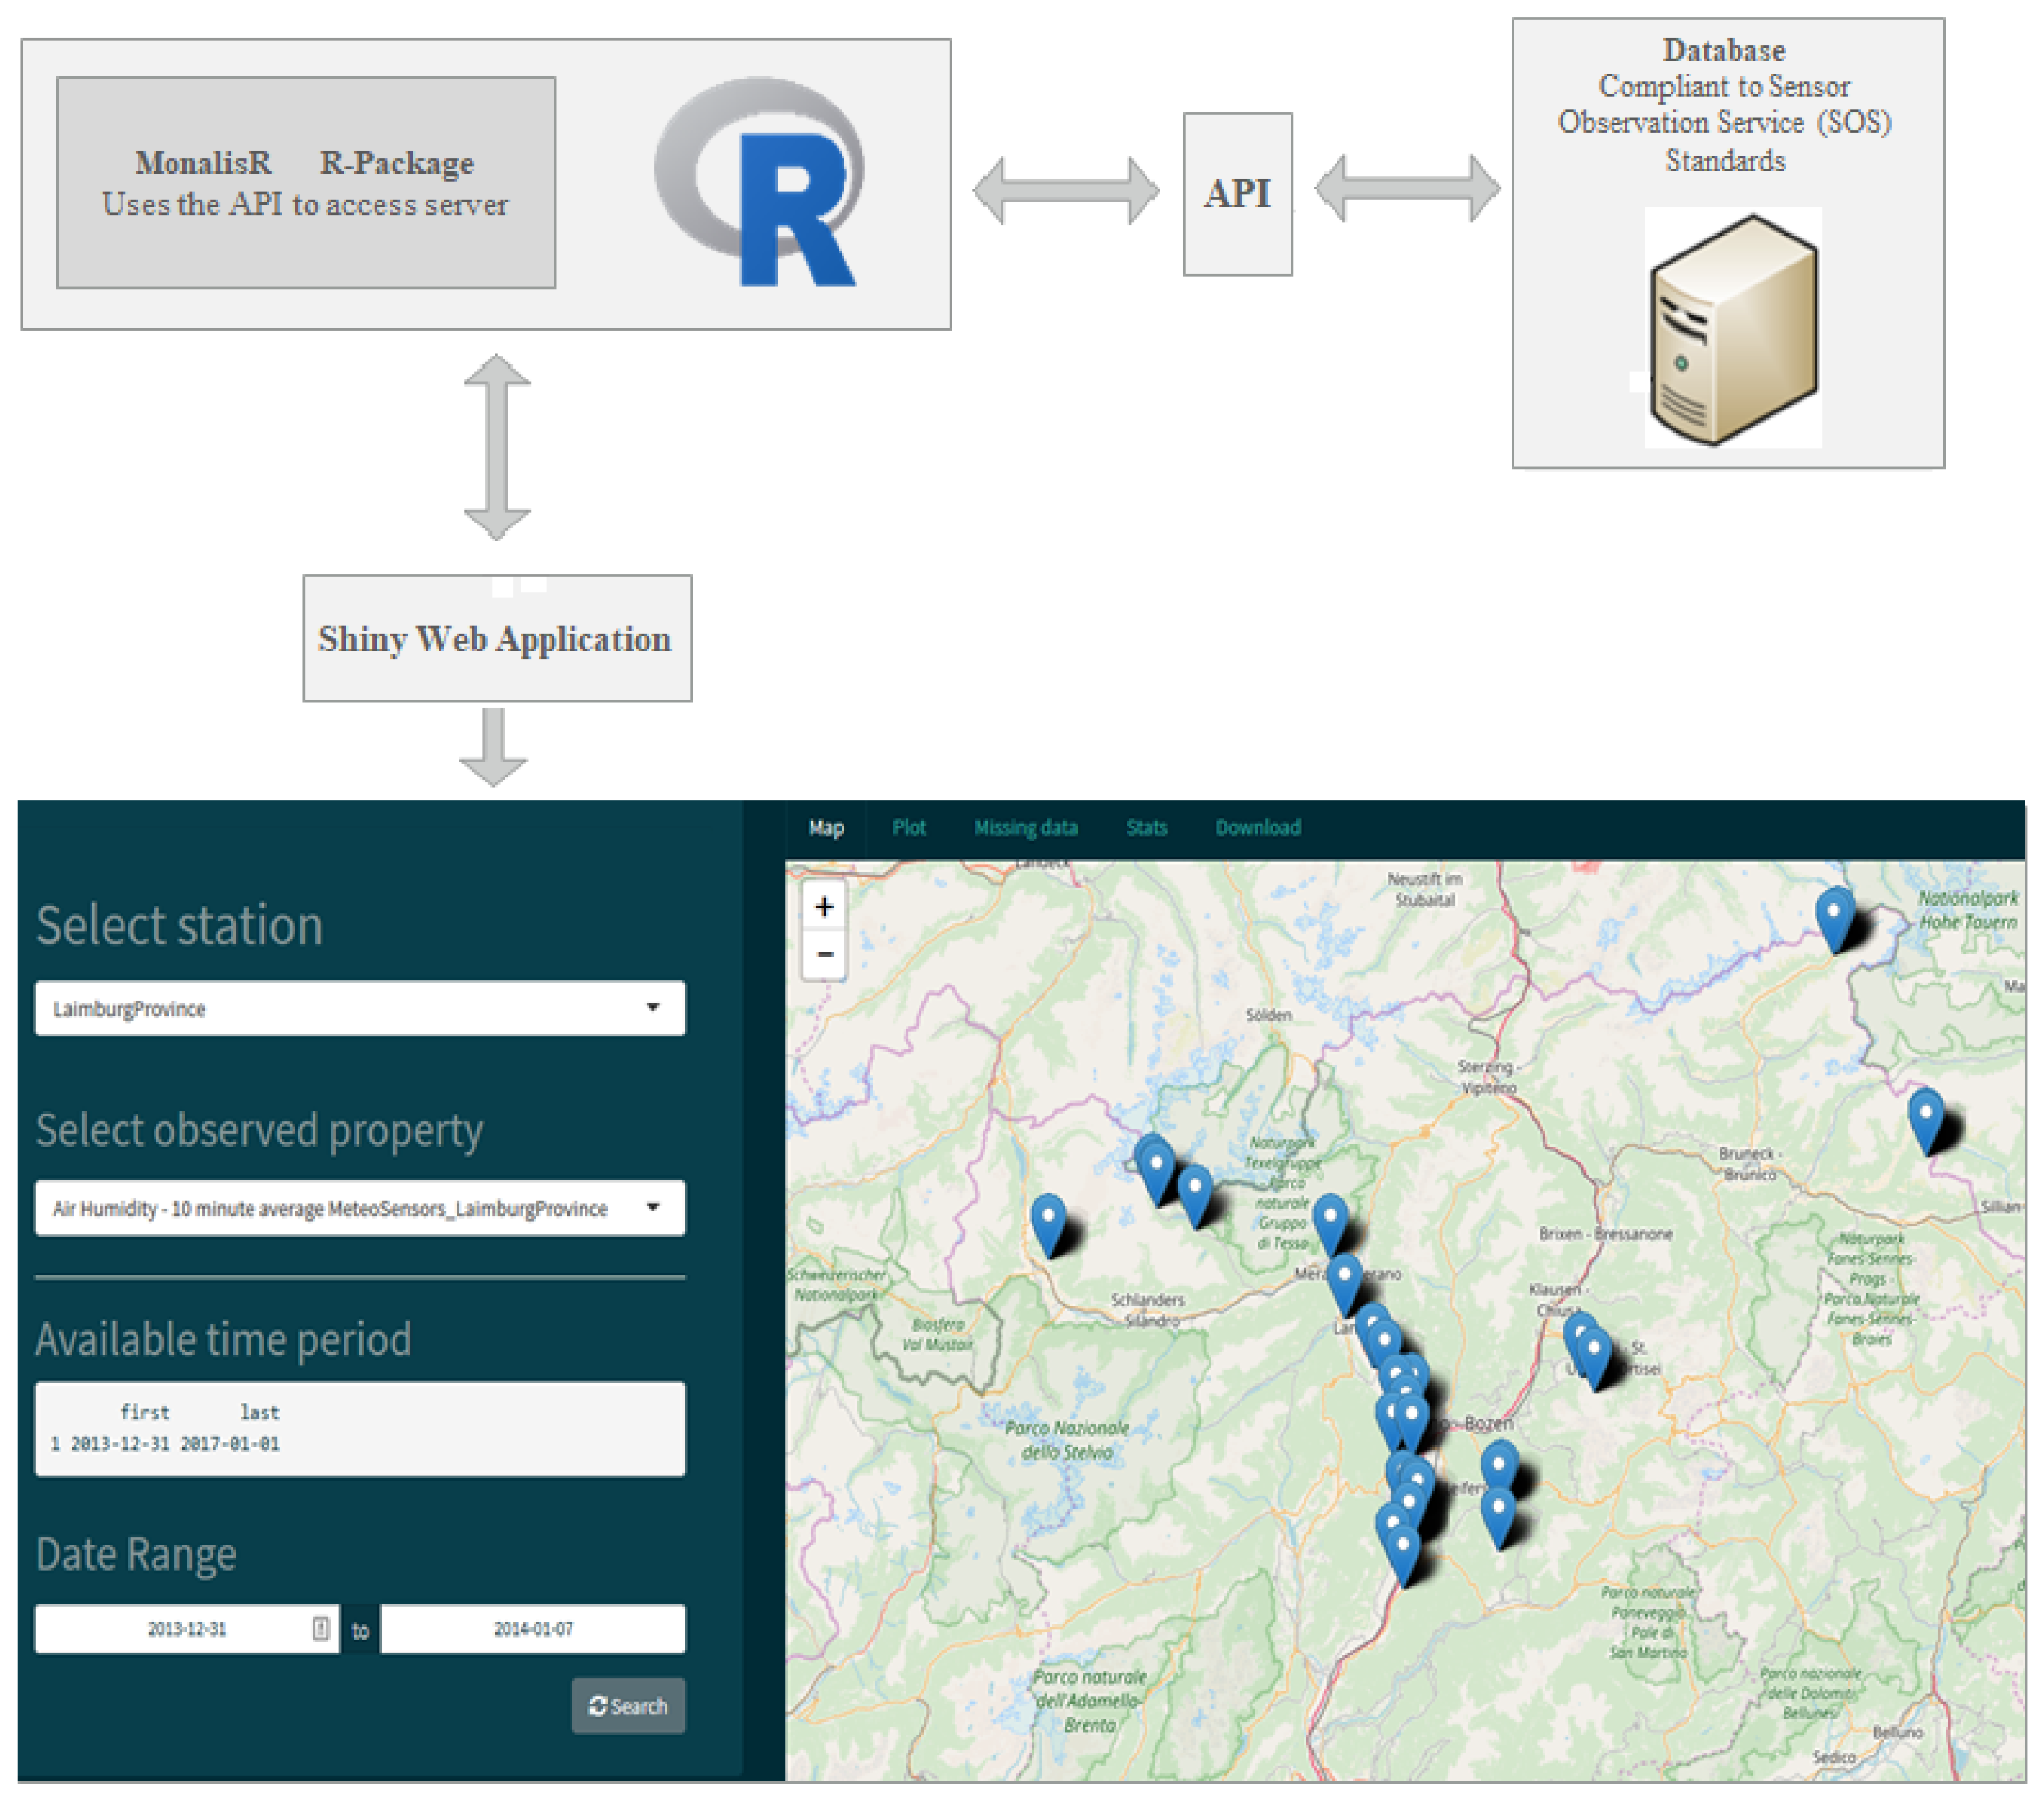
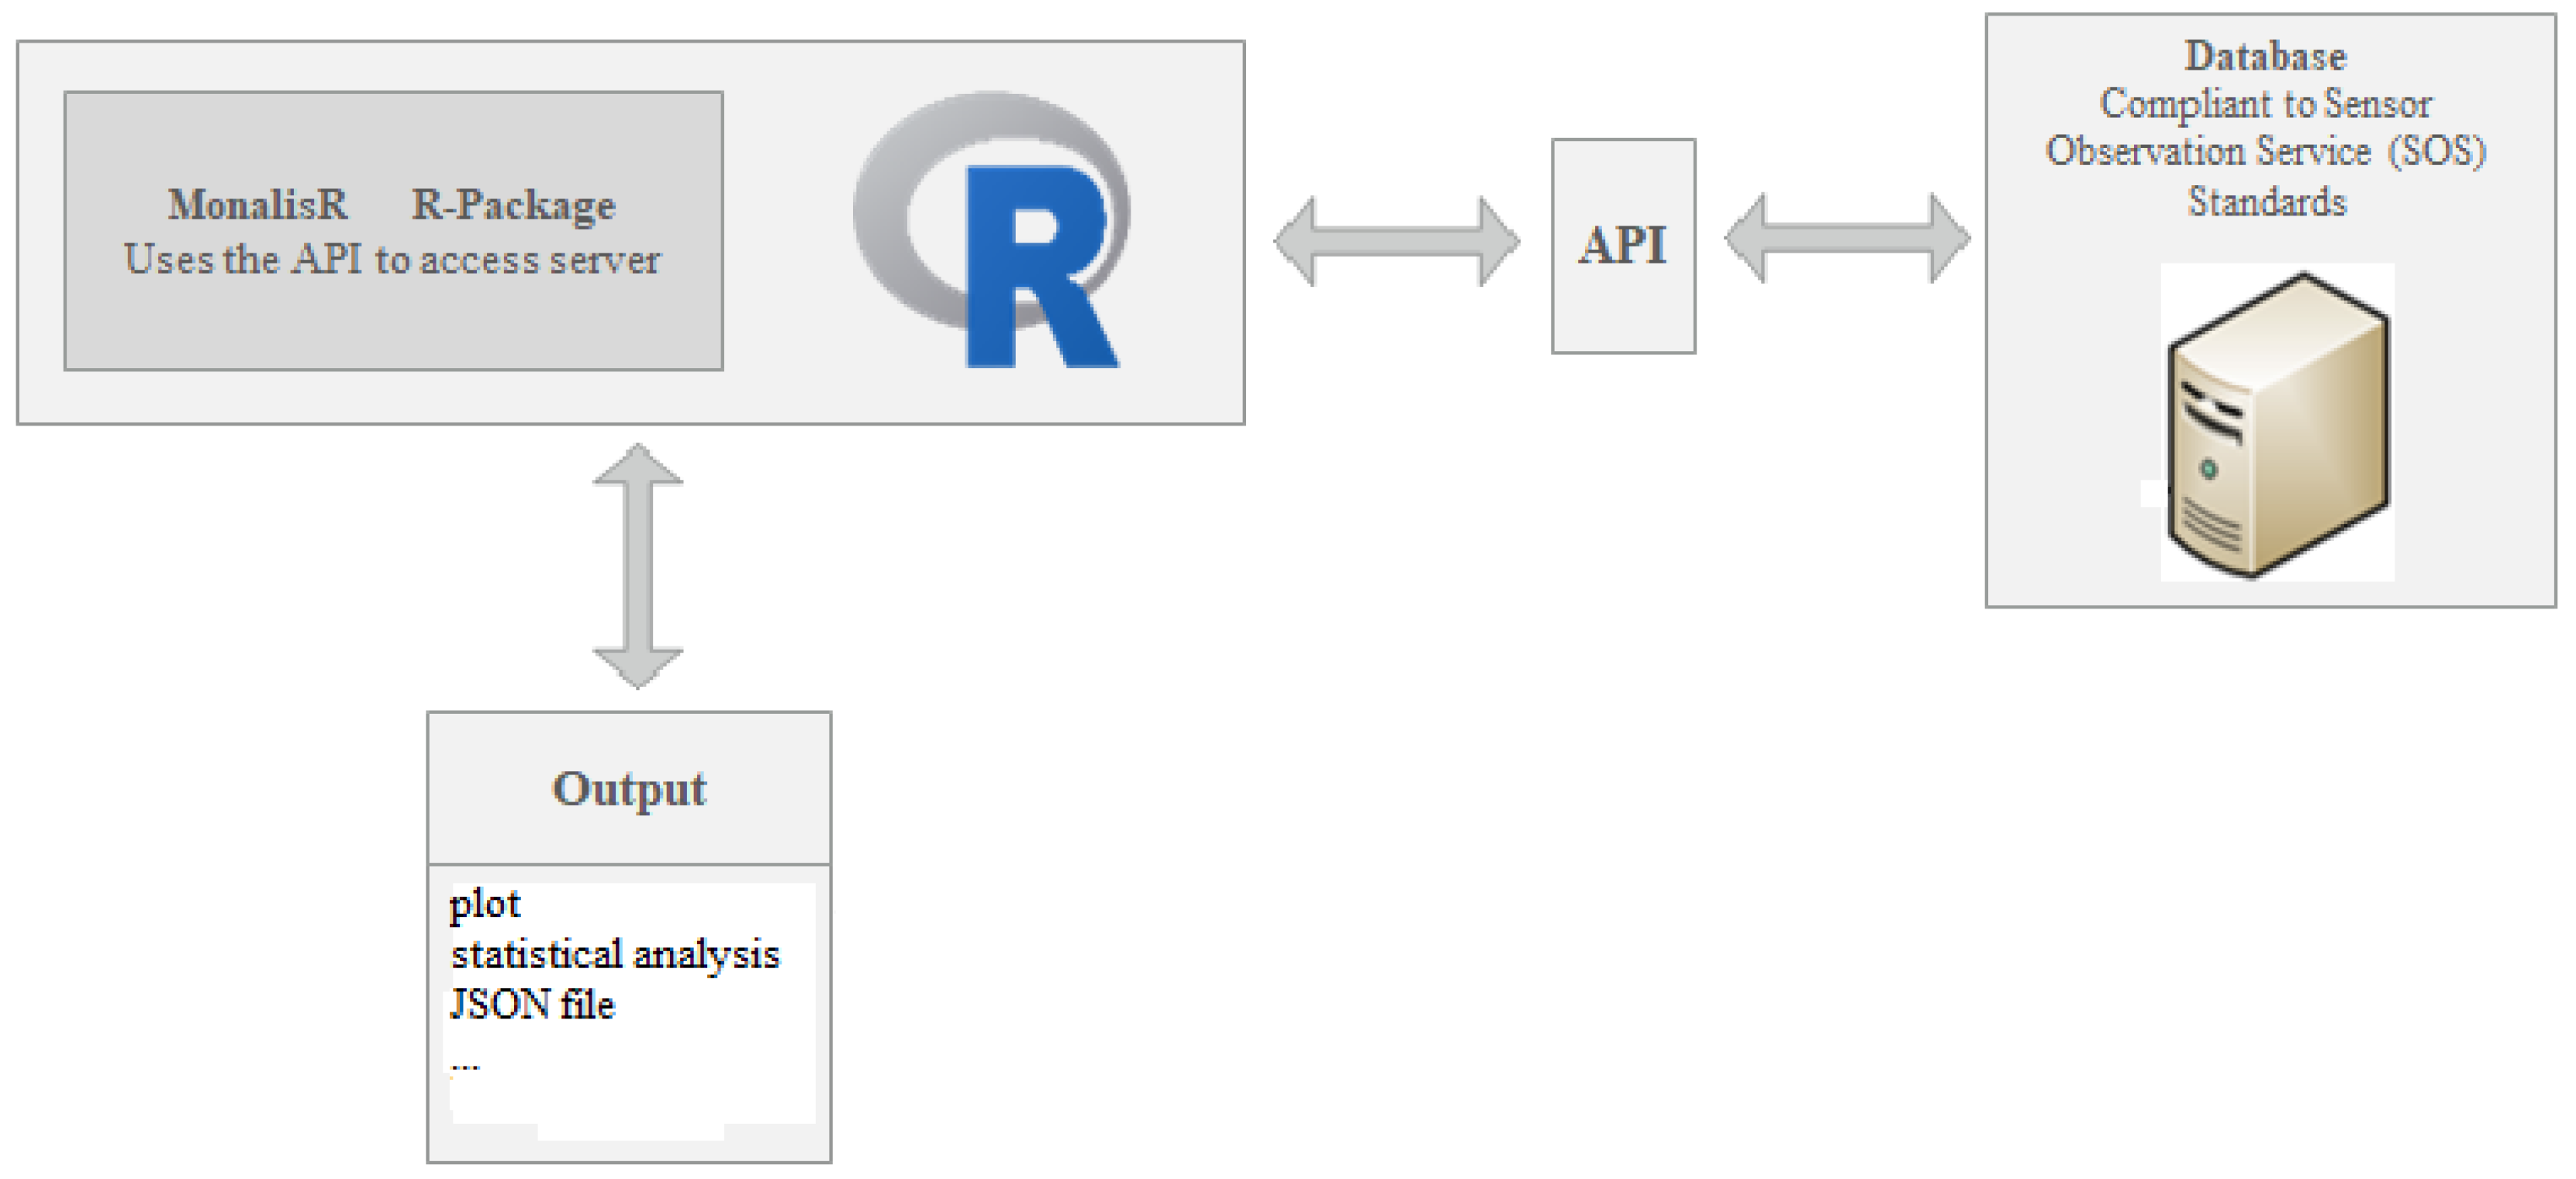
4.5. Share
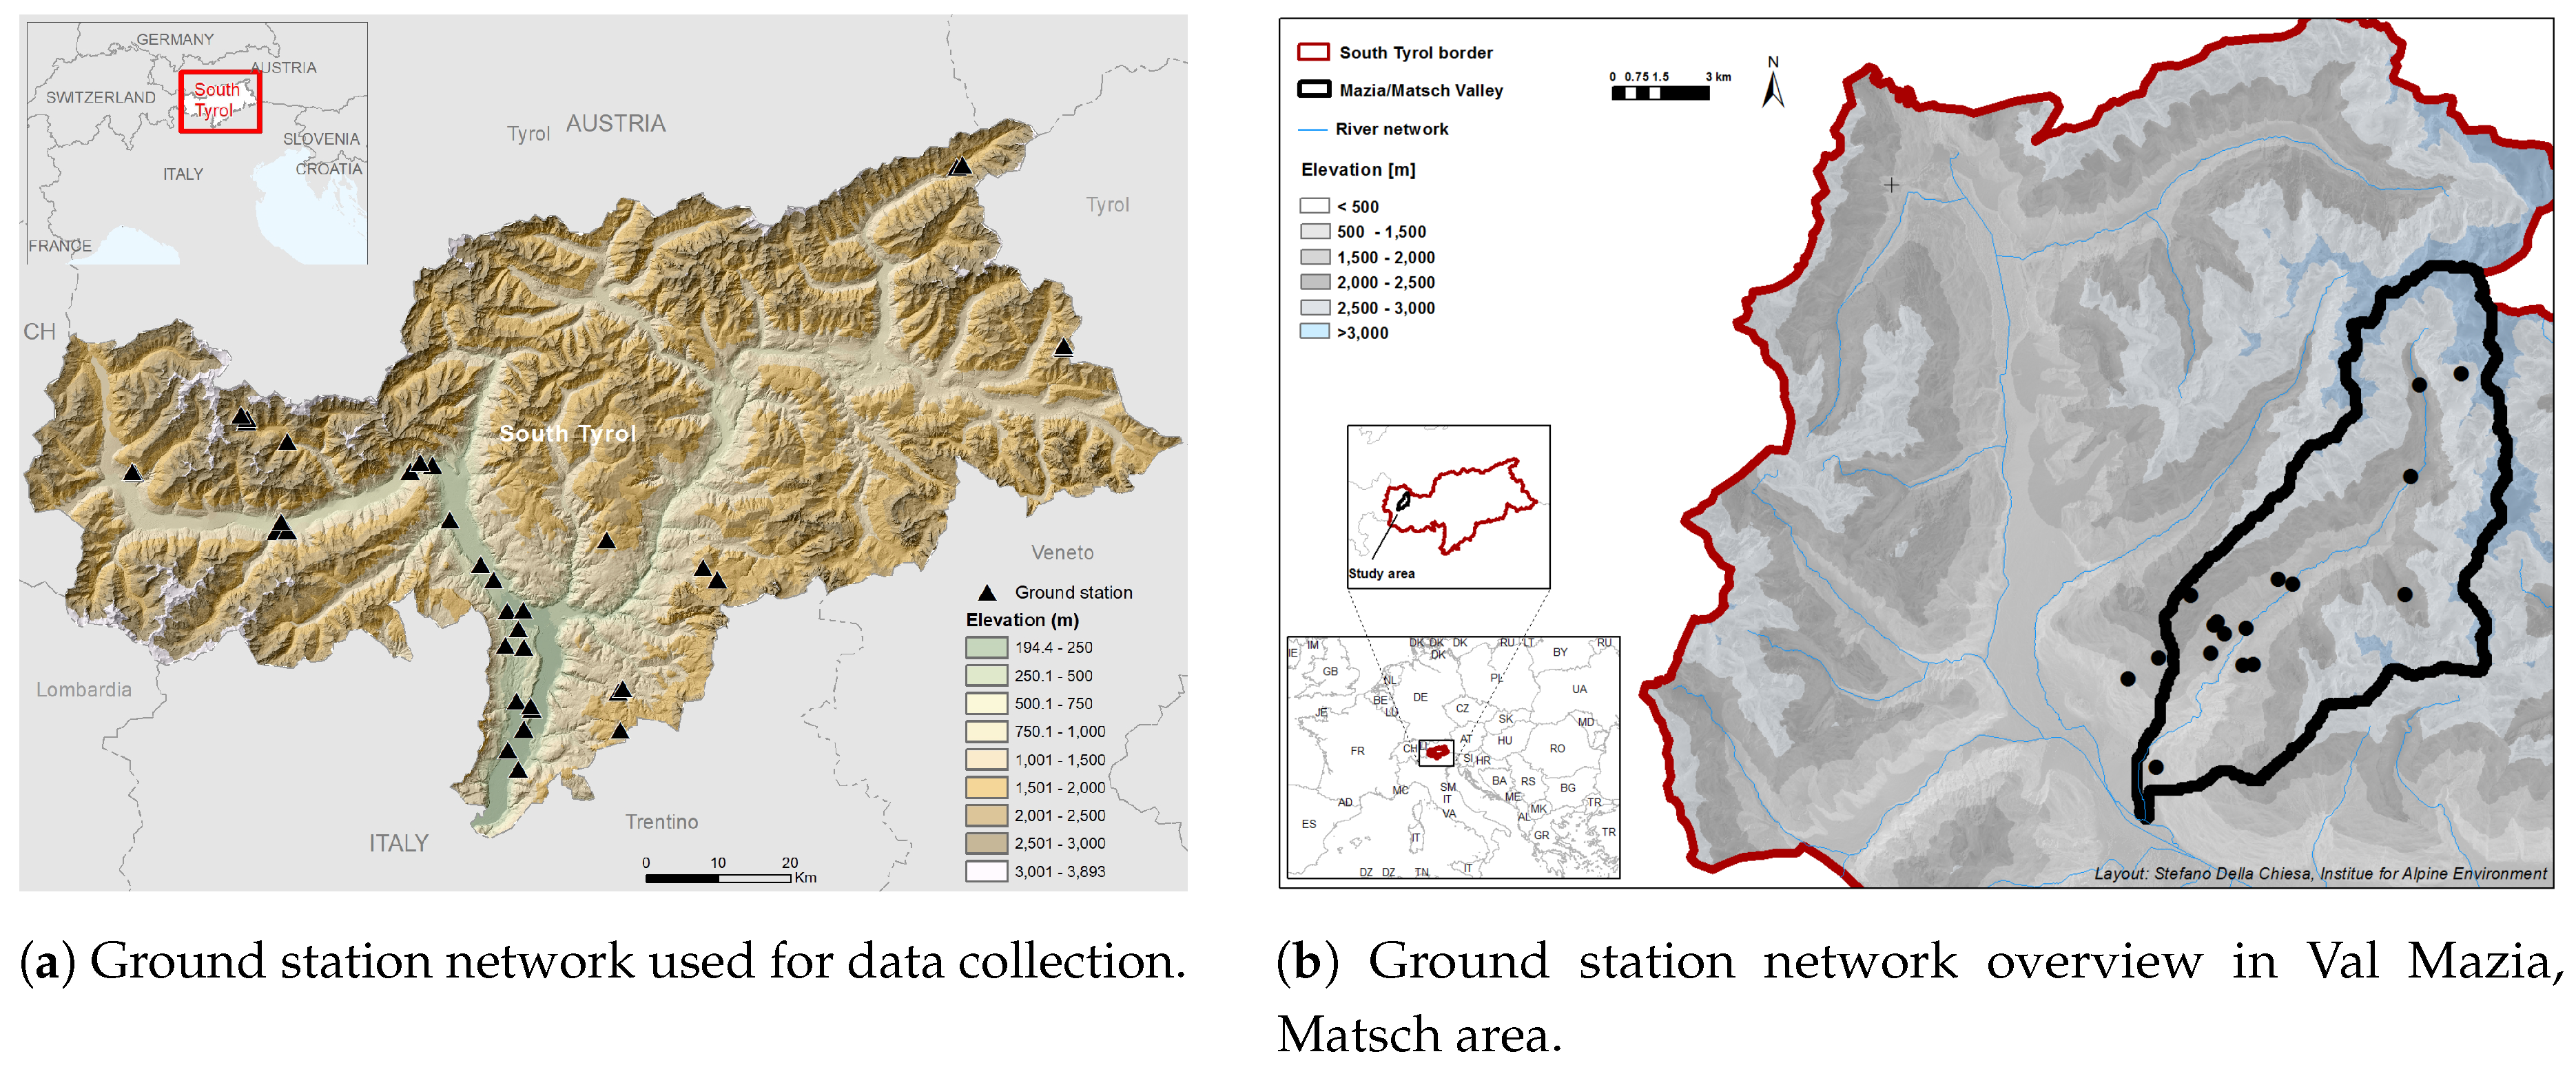
5. A Case Study: LT(S)ER Matsch-Mazia
5.1. Study Area
5.2. Sensors
5.3. Results
6. Conclusions
- High performance, thanks to the availability of a parallelized process which reduces the time for inserting new measurements in a SOS implementation when the number of station categories is greater than ten.
- An OGC standard-compliant methodology, allowing the reuse of data outside the research context and, thus, avoiding duplication.
- A flexible methodology, which can be applied to upload data into any SOS implementation.
- Open source and custom software: Our python scripts can be improved, with respect to a more dynamic way to handle the parallelization processes.
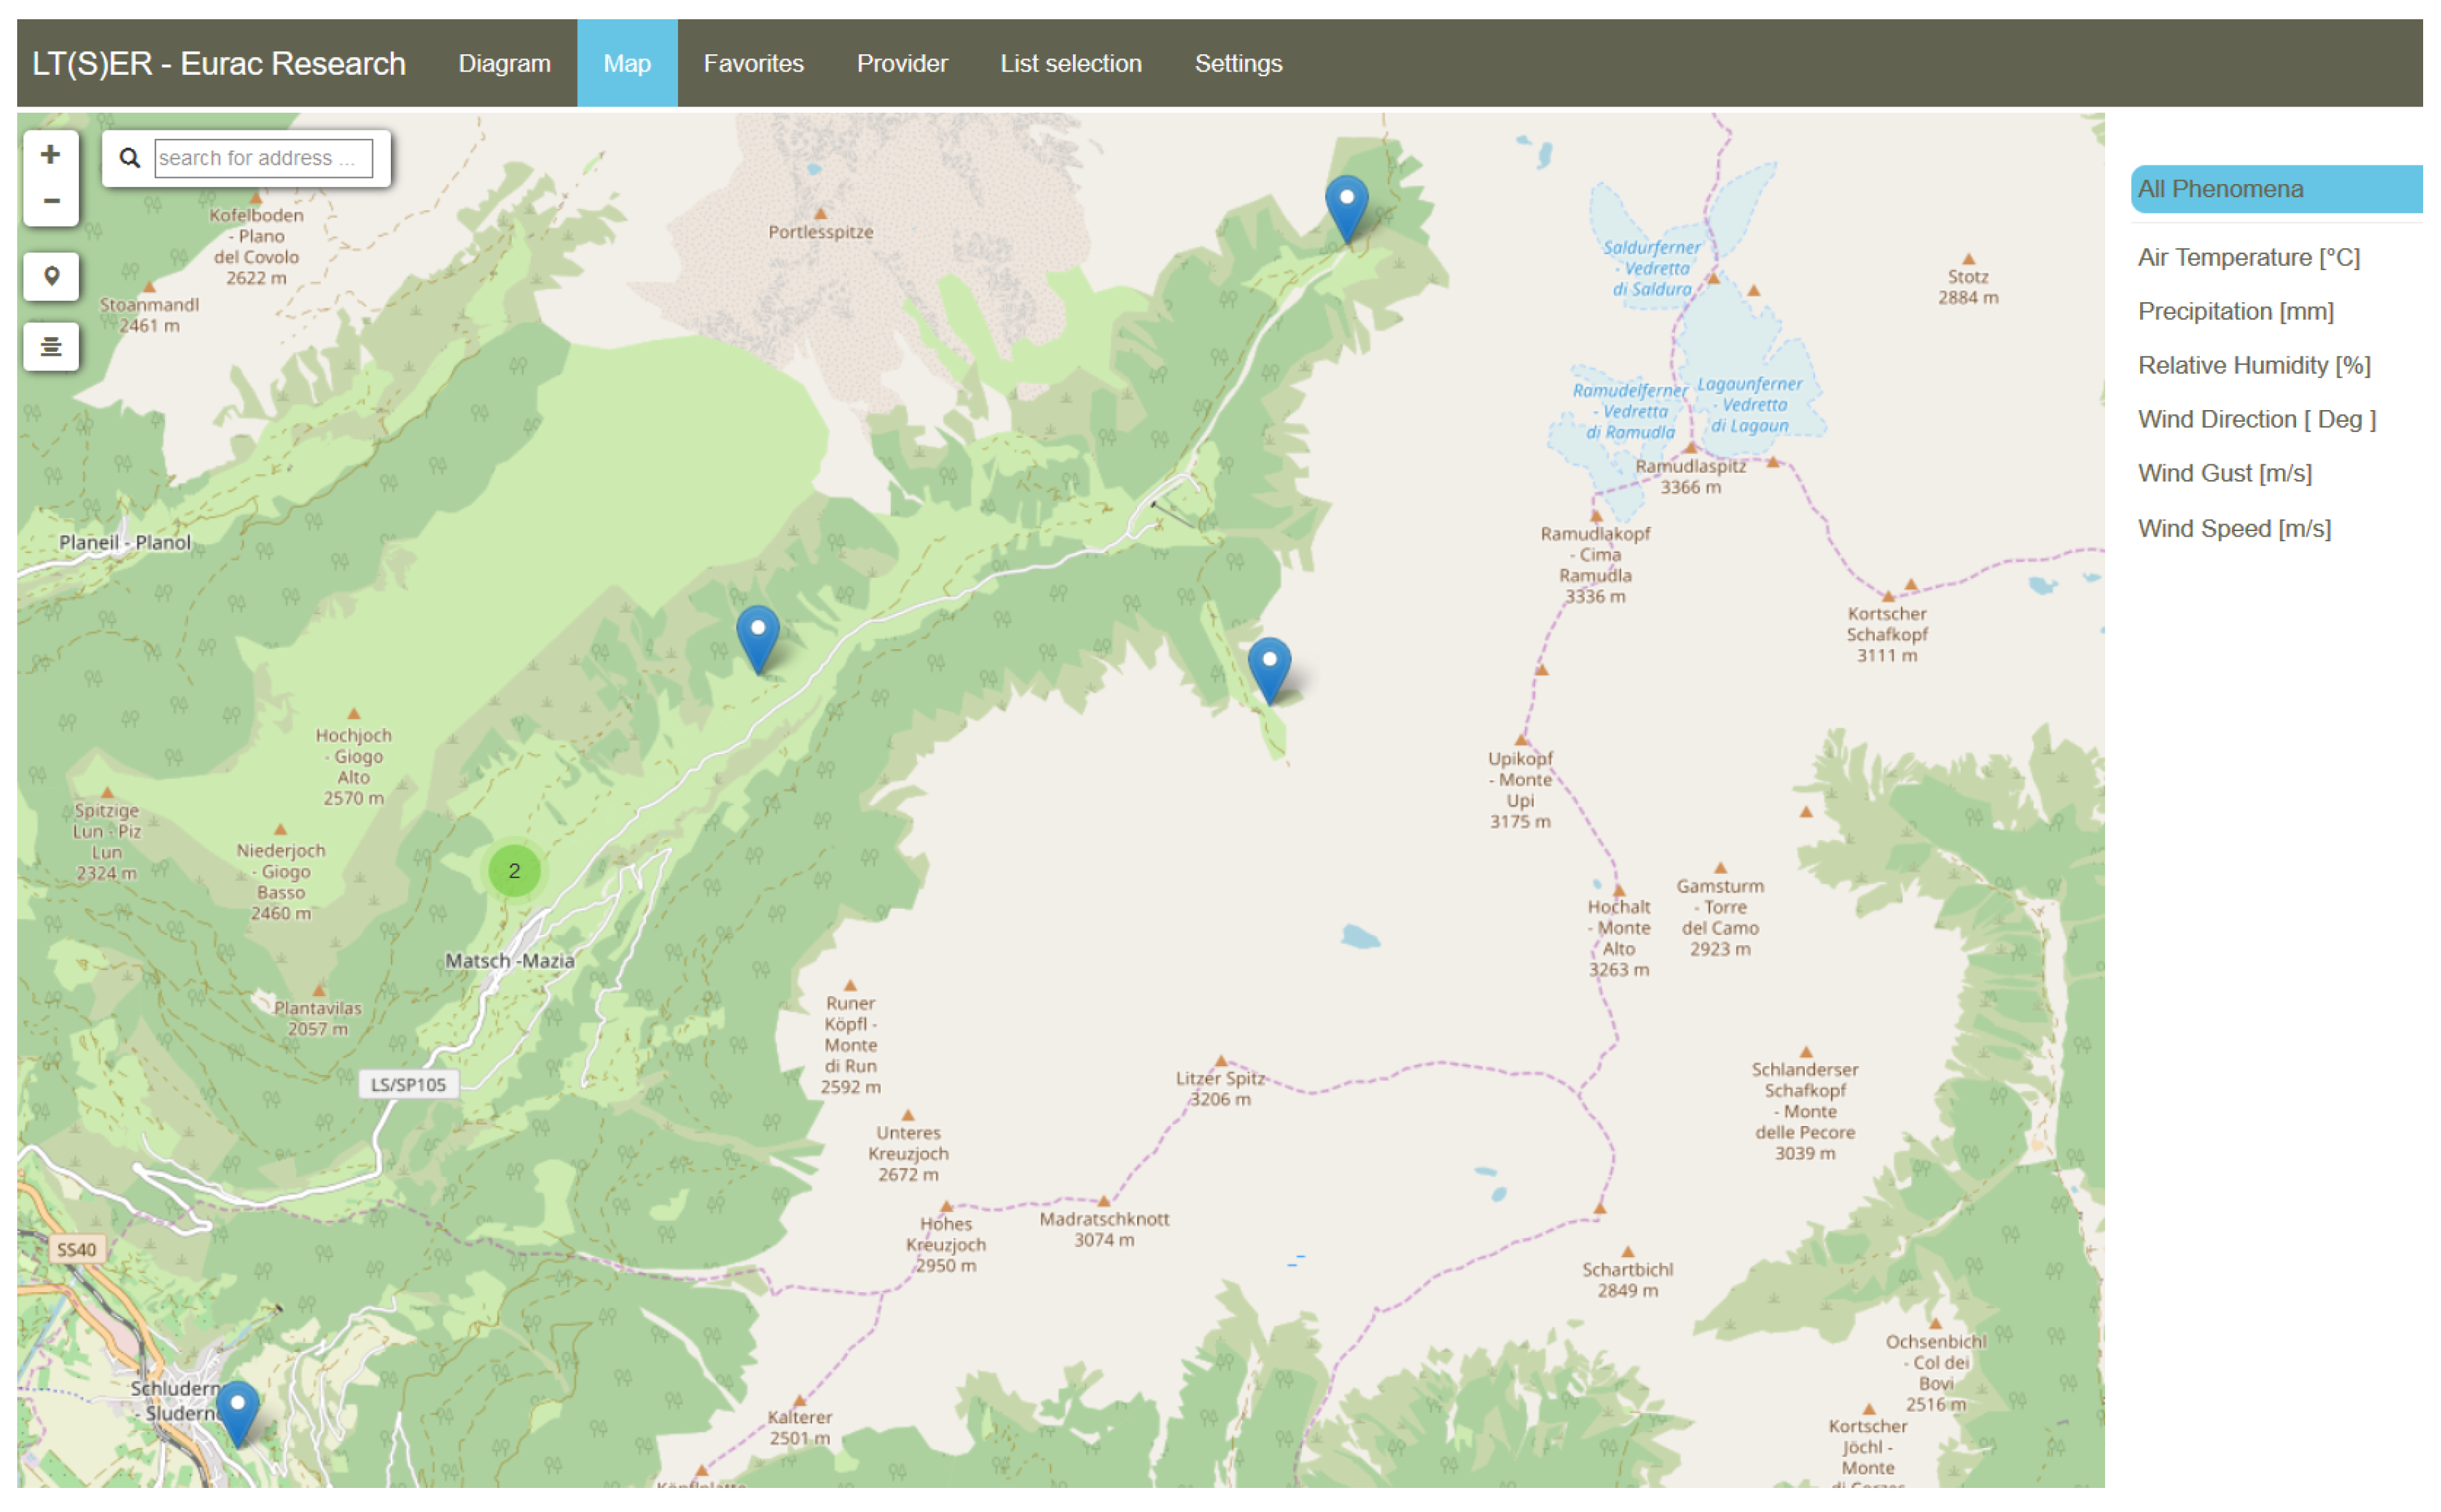
- Collected data are available in near real-time and accessible through a web application, offering a faster way to search through and visualize data by creating ad-hoc queries using GUI without writing codes.
- Source code available in a dedicated GIT repository.
Author Contributions
Funding
Acknowledgments
Conflicts of Interest
Abbreviations
| OGC | Open Geospatial Consortium |
| SWE | Sensor Web Enablement |
| API | Application Programming Interface |
| HCI | Human-Computer Interaction |
| CC BY | Creative Commons Attribution only |
| O&M | Observations&Measurements |
| SensorML | Sensor Model Language |
| SOS | Sensor Observation Service |
| FOI | Feature Of Interest |
| DRP | Digital Repeat Photography |
| NDVI | Normalized Differenced Vegetation Index |
| DB | Database |
| XML | eXtensible Markup Language |
| XSLT | Extensible Stylesheet Language |
| CSW | Catalogue Service for the Web |
| JSON | JavaScript Object Notation |
| RDBMS | Relational DataBase Management System |
| GUI | Graphical User Interface |
| LTER | Long Term Ecological Research |
| LT(S)ER | Long Term Socio-Ecological Research |
References
- Zhang, Z.; Glaser, S.D.; Bales, R.C.; Conklin, M.; Rice, R.; Marks, D.G. Technical report: The design and evaluation of a basin-scale wireless sensor network for mountain hydrology. Water Resour. Res. 2017, 53, 4487–4498. [Google Scholar] [CrossRef]
- Partescano, E.; Brosich, A.; Lipizer, M.; Cardin, V.; Giorgetti, A. Open geospatial data, softw. stand. Open Geospatial Data Softw. Stand. 2017, 2, 22. [Google Scholar] [CrossRef]
- Jirka, S.; Bröring, A.; Stasch, C. Applying OGC Sensor Web Enablement to Risk Monitoring and Disaster Management. In Proceedings of the GSDI 11 World Conference, Workshop on Sensorweb Enablement: Strengthening the SDI, Rotterdam, The Netherlands, June 2009; Available online: http://www.gsdi.org/gsdiconf/gsdi11/papers/pdf/96.pdf (accessed on 25 February 2011).
- Kamel Boulos, M.N.; Resch, B.; Crowley, D.N.; Breslin, J.G.; Sohn, G.; Burtner, R.; Pike, W.A.; Jezierski, E.; Chuang, K.-Y.S. Crowdsourcing, citizen sensing and sensor web technologies for public and environmental health surveillance and crisis management: Trends, OGC standards and application examples. Int. J. Health Geogr. 2011, 10, 67. [Google Scholar] [CrossRef] [PubMed]
- Bojinski, S.; Verstraete, M.; Peterson, T.; Richter, C.; Simmons, A.; Zemp, M. The concept of essential climate variables in support of climate research, applications, and policy. Bull. Am. Meteorol. Soc. 2014, 95, 1431–1443. [Google Scholar] [CrossRef]
- Delin, K.; Jackson, S.; Some, R. Sensor Webs. NASA Tech. Briefs 1999, 23, 90. [Google Scholar]
- Delin, K. The Sensor Web: A Macro—Instrument for Coordinated Sensing. Sensors 2001, 2, 270–285. [Google Scholar] [CrossRef]
- Cox, S. Observations and Measurements—Part 1—Observation Schema, version 1.0; Open Geospatial Consortium: Wayland, MA, USA, 2007; p. 07-022r1. [Google Scholar]
- Cox, S. Observations and Measurements—Part 2—Observation Schema, version 1.0; Open Geospatial Consortium: Wayland, MA, USA, 2007; p. 07-022r3. [Google Scholar]
- Cox, S. OGC Implementation Specification: Observations and Measurements (O&M)—XML Implementation 2.0; Open Geospatial Consortium: Wayland, MA, USA, 2011; p. 10-025r1. [Google Scholar]
- Open Geospatial Consortium 2011. Observations and Measurements—XML Implementation. Available online: http://portal.opengeospatial.org/files/?artifact_id=41510 (accessed on 1 January 2019).
- Open Geospatial Consortium 2011. OpenGIS Sensor Model Language (SensorML) Implementation Specification. Available online: http://portal.opengeospatial.org/files/?artifact_id=21273 (accessed on 1 January 2019).
- Open Geospatial Consortium 2011. OGC Sensor Observation Service Interface Standard. Available online: https://portal.opengeospatial.org/files/?artifact_id=47599 (accessed on 1 January 2019).
- Cannata, M.; Antonovic, M.; Molinari, M.; Pozzoni, M. istSOS, a new sensor observation management system: Software architecture and a real-case application for flood protection. Geomat. Nat. Hazards Risk 2015, 6, 635–650. [Google Scholar] [CrossRef]
- Lanucara, S.; Zilioli, M.; Oggioni, A.; Carrara, P. GET-IT, a software suite for easy, interoperable sharing of ecological data in the Long Term Ecological Research Network. In Proceedings of the Conference: EnviroInfo, Luxembourg, 13–15 September 2017. [Google Scholar]
- Lanucara, S.; Carrara, P.; Oggioni, A.; Rogora, M.; Kamburska, L.; Rossetti, G. Exploiting observations and measurement data standard for distributed LTER-Italy freshwater sites. Water quality issues. PeerJ Prepr. 2016, 4, e2233v2. [Google Scholar]
- Martínez, E.; Toma, D.M.; Jirka, S.; Del Río, J. Middleware for Plug and Play Integration of Heterogeneous Sensor Resources into the Sensor Web. Sensors 2017, 17, 2923. [Google Scholar] [CrossRef] [PubMed]
- Jirka, S.; Bröring, A.; Kjeld, P.; Maidens, J.; Wytzisk, A. A Lightweight Ap-proach for the Sensor Observation Service to Share Environmental Data across Europe. Trans. GIS 2012, 16, 293–312. [Google Scholar] [CrossRef]
- Bychkov, I.V.; Ruzhnikov, G.M.; Paramonov, V.V.; Shumilov, A.S.; Fedorov, R.K.; Levi, K.G.; Demberel, S. Infrastructural approach and geospatial data processing services in the tasks of territorial development management. Earth Environ. Sci. 2018, 190, 012048. [Google Scholar] [CrossRef]
- Bishop, W.; Grubesic, T.H. Data Lifecycle. In Geographic Information: Organization, Access, and Use; Springer: Berlin, Germany, 2016; pp. 169–186. [Google Scholar]
- Hook, L.A.; Vannan, S.K.S.; Beaty, T.W.; Cook, R.B.; Wilson, B.E. Best Practices for Preparing Environmental Data Sets to Share and Archive. In Oak Ridge National Laboratory Distributed Active Archive Center; Environmental Sciences Division, Oak Ridge National Laboratory: Oak Ridge, TN, USA, 2010. [Google Scholar]
- Jones, A.S.; Horsburgh, J.S.; Reeder, S.L.; Ramírez, M.; Caraballo, J. A data management and publication workflow for a large-scale, heterogeneous sensor network. Environ. Monit. Assess. 2015, 187, 348–367. [Google Scholar] [CrossRef]
- Benyon, D.; Turner, P.; Turner, S. Designing Interactive Systems: People, Activities, Contexts, Technologies; Pearson Education Limited: Essex, UK, 2005; p. 52. [Google Scholar]
- Nielsen, J. Usability101: IntroductiontoUsability. Jakob Nielsen’sAlertbox. 21 May 2011. Available online: http://www.useit.com/alertbox/20030825.html (accessed on 1 January 2019).
- Preece, J.; Rogers, Y.; Benyon, D.; Holland, S.; Carey, T. Human Computer Interaction; Addison-Wesley: Wokingham, UK, 1994; p. 31. [Google Scholar]
- Toda, M.; Richardson, A.D. Estimation of plant area index and phenological transition dates from digital repeat photography and radiometric approaches in a hardwood forest in the Northeastern United States. Agric. For. Meteorol. 2018, 249, 457–466. [Google Scholar] [CrossRef]
- Sidi, F.; Shariat Panahy, P.H.; Affendey, L.S.; Jabar, M.A.; Ibrahim, H.; Mustapha, A. Data quality: A survey of data quality dimensions. In Proceedings of theInternational Conference on Information Retrieval and Knowledge Management, Kuala Lumpur, Malaysia, 13–15 March 2012; pp. 300–304. [Google Scholar]
- Wand, Y.; Wang, R.Y. Anchoring data quality dimensions in ontological foundations. Commun. ACM 1996, 39, 86–96. [Google Scholar] [CrossRef]
- Pfeiffer, T.; Wenk, A. PostgreSQL: Das Praxisbuch; Galileo-Press: Bonn, Germany, 2010. [Google Scholar]
- Open Geospatial Consortium. SensorML: Model and XML Encoding Standard. 2014. Available online: http://www.opengis.net/doc/IS/SensorML/2.0 (accessed on 1 January 2019).
- Clark, J. (Ed.) XSL Transformations (XSLT) Version 1.0; World Wide Web Consortium: Cambridge, MA, USA, 1999. [Google Scholar]
- Niedrist, G.; Tasser, E.; Bertoldi, G.; Della Chiesa, S.; Obojes, N.; Egarter-Vigl, L.; Tappeiner, U. Down to future: Transplanted mountain meadows react with increasing phytomass or shifting species composition. Flora 2016, 224, 172–182. [Google Scholar] [CrossRef]
- Fontana, V.; Kohler, M.; Niedrist, G.; Bahn, M.; Tappeiner, U.; Frenck, G. Decomposing the land-use specific response of plant functional traits along environmental gradients. Sci. Total Environ. 2017, 599–600, 750–759. [Google Scholar] [CrossRef] [PubMed]
- Rossi, M.; Niedrist, G.; Asam, S.; Tonon, G.; Tomelleri, E.; Zebisch, M. A Comparison of the Signal from Diverse Optical Sensors for Monitoring Alpine Grassland Dynamics. Remote Sens. 2019, 11, 296. [Google Scholar] [CrossRef]


| LT(S)ER Sensors | ||
|---|---|---|
| Manufacturer | Type | Model Factsheet |
| Apogee | Infrared Radiometer | SI111 |
| Apogee | Pyranometer | SP110 |
| Apogee | Quantum Sensor (PAR) | SQ110 |
| Campbell Scientific | Temperature Sensor | 107 |
| Campbell Scientific | Data Logger | CR1000 |
| Campbell Scientific | Soil Moisture | CS655 |
| Campbell Scientific | Temperature and Relative Humidity | HC2S3 |
| Campbell Scientific | Temperature and Relative Humidity | HMP45C-L |
| Campbell Scientific | Acoustic Distance Sensor | SR50AT-L |
| Campbell Scientific | Average Soil Thermocouple Probe, 6–8 cm | TCAV-L |
| Decagon | Large Volume Soil Moisture Sensor | 10HS |
| Decagon | Leaf Moisture Sensor | LWS |
| Decagon | Soil Water Potential Sensor | MP6S |
| Decagon | Spectral Reflectance Sensors (NDVI and PRI measurements) | NDVIPRI |
| Decagon | Spectral Reflectance Sensors (NDVI and PRI measurements) | 10HS |
| Decagon | Spectral Reflectance Sensors (NDVI and PRI measurements) | NiHemispherical |
| Decagon | Spectral Reflectance Sensors (NDVI and PRI measurements) | NrFIeldStop |
| Decagon | Spectral Reflectance Sensors (NDVI and PRI measurements) | PiHemispherical |
| Gill | Wind Sensor | Windsonic |
| Huskeflux | Heat Flux Sensors | HFP01 |
| Huskeflux | Surface Fluxes | NR01 |
| Onset | Solar Radiation Sensor Pyranometer | SLIBM003 |
| Onset | Rainfall Smart Sensor (Bucket) | SRGBM002 |
| Ott | Precipitation Detector | Pluvio2 |
© 2019 by the authors. Licensee MDPI, Basel, Switzerland. This article is an open access article distributed under the terms and conditions of the Creative Commons Attribution (CC BY) license (http://creativecommons.org/licenses/by/4.0/).
Share and Cite
Ventura, B.; Vianello, A.; Frisinghelli, D.; Rossi, M.; Monsorno, R.; Costa, A. A Methodology for Heterogeneous Sensor Data Organization and Near Real-Time Data Sharing by Adopting OGC SWE Standards. ISPRS Int. J. Geo-Inf. 2019, 8, 167. https://doi.org/10.3390/ijgi8040167
Ventura B, Vianello A, Frisinghelli D, Rossi M, Monsorno R, Costa A. A Methodology for Heterogeneous Sensor Data Organization and Near Real-Time Data Sharing by Adopting OGC SWE Standards. ISPRS International Journal of Geo-Information. 2019; 8(4):167. https://doi.org/10.3390/ijgi8040167
Chicago/Turabian StyleVentura, Bartolomeo, Andrea Vianello, Daniel Frisinghelli, Mattia Rossi, Roberto Monsorno, and Armin Costa. 2019. "A Methodology for Heterogeneous Sensor Data Organization and Near Real-Time Data Sharing by Adopting OGC SWE Standards" ISPRS International Journal of Geo-Information 8, no. 4: 167. https://doi.org/10.3390/ijgi8040167
APA StyleVentura, B., Vianello, A., Frisinghelli, D., Rossi, M., Monsorno, R., & Costa, A. (2019). A Methodology for Heterogeneous Sensor Data Organization and Near Real-Time Data Sharing by Adopting OGC SWE Standards. ISPRS International Journal of Geo-Information, 8(4), 167. https://doi.org/10.3390/ijgi8040167