You are currently viewing a new version of our website. To view the old version click .
ISPRS International Journal of Geo-Information
  • Article
  • Open Access

2 April 2019

Exploring the Associations Between Urban Form and Neighborhood Vibrancy: A Case Study of Chengdu, China

,
,
and
1
School of Architecture and Urban Planning, Huazhong University of Science and Technology, Wuhan 430074, China
2
Key Laboratory of urban land resources monitoring and simulation, Ministry of Land and Resources of China, Shenzhen 518034, China
3
Beijing Key Laboratory of Urban Spatial Information Engineering, Beijing 100038, China
4
Hubei Engineering and Technology Research Center of Urbanization, Wuhan 430074, China

Abstract

The design and optimization of urban form has always been a hot topic in urban planning and development research. Besides, the creation of continuous vitality in urban areas is of critical importance in the development of urbanization. However, due to the lack of data, it is difficult to measure the effects of urban form on neighborhood vibrancy. Additionally, no uniform conclusion has been drawn regarding to what degree urban form can contribute to neighborhood vibrancy. Taking advantage of emerging new data sources, the depth and breadth of related research can now be improved. Therefore, this paper uses high-precision positioning social media check-in data to approximate the vibrancy of 658 neighborhoods, and uses a geographical information system (GIS) to quantitatively measure the urban form indicators in the central area of Chengdu City, China. A quantitative exploration and analysis of the relationships between neighborhood vibrancy and urban form is conducted. The results of three regression models considering different explanatory variables show that socio-economic factors account for approximately 23% of neighborhood vibrancy. In addition, the correlation between the shape characteristics of a neighborhood and the vibrancy is weak. However, when the inner urban form indicators of neighborhoods are introduced into the regression model, the goodness of fit (R2) is nearly doubled. This finding indicates that strong associations exist between urban form and neighborhood vibrancy. Specifically, building density and functional diversity are positively correlated with neighborhood vibrancy. Unlike existing studies, this study finds that the road network within the neighborhood plays a positive role in the creation of neighborhood vibrancy. However, the impact of a road density indicator is not as powerful as the impacts of building density and functional diversity. This research can help urban designers to better design urban environments.

1. Introduction

The design and optimization of urban form has received considerable attention regarding urban planning and development. The continuing vitality of urban space is a significantly important topic in the development of urbanization [1]. New Urbanism advocates the reintegration of spatial form and built-up environments to generate a perfect neighborhood, thus enhancing the vitality and sustainability of urban space [2]. Therefore, there is a qualitative connection between urban spatial form and spatial vitality [3]. The relevant theories are gradually enriched, while the creation of urban vitality is still regarded as a difficult process that is hard to define clearly, and relies heavily on the experience and intuition of urban designers [4,5]. Therefore, how to quantitatively analyze the associations between urban vitality and urban form, and how to assess the impact of urban form on neighborhood vibrancy, is particularly important for urban planners and managers.
First of all, a quantitative evaluation of neighborhood vibrancy is needed. It is known that neighborhood vibrancy affects residents’ health [6], and is positively associated with urban public safety [6,7], socio-economic development, and spatial connections [8]. Lynch takes urban vitality as the primary indicator for assessing the quality of urban form [9]. He defines vitality as an urban form dimension that supports the needs and social functions of human life. Lynch also illustrates that urban vitality, good urban form, completed urban function, and rich urban activities are closely related [9]. Most researches characterize and portray urban vitality from the perspectives of economic levels, activity intensity, and cultural contacts [10,11,12,13]. From the perspective of intraurban human mobility, urban vitality is reflected by human convergences and activities [14,15]. The collection of human activity data in existing research is commonly achieved through surveys or questionnaires [16]. However, these methods are time-consuming and laborious, and the representativeness of data is also questionable [17,18,19].
Secondly, questions still remain regarding how to quantify urban form measurements. The non-physical environmental factors of urban space (such as social order, living standards, psychological emotions and other factors) also affect urban vitality [20]. These factors are not examined in this study. The spatial analysis unit at the appropriate scale needed to be selected prior to the study; the modifiable areal unit problem (MAUP) was not discussed [21]. Neighborhoods or blocks are the basic unit of urban planning and management, the design of which has received a lot of attention in recent years [22]. With the rapid urbanization in China, the spatial and social attributes of China’s neighborhoods are quite different from those of Western countries, and the comprehensive measurement of the urban forms has gradually attracted considerable attention [23,24]. Many indicators are used to qualitatively describe urban form, such as land use, accessibility, and building density [25,26]. Some scholars have begun to doubt the roles of density and accessibility in creating neighborhood vibrancy [27]. However, to what extent can urban form contribute to neighborhood vibrancy for China’s cities has not been revealed. Therefore, this paper takes the view that it is necessary to correlate urban form measurements with urban vitality at the fine scale level in China.
Traditional data environment lacks the support of quantitative methods for urban vitality assessment. This also leads to a lack of depth and breadth of quantitative research. With China’s rapid urbanization process, people’s lifestyles and the organization of urban areas have changed dramatically [28]. Many emerging sources of big data that record the activity information of massive populations are being collected, such as location-based service (LBS) check-in data, mobile phone location data, GPS location data, and so on [29,30,31]. Many map platforms provide free, basic urban space data include points of interest (POI), road networks, and building vectors. This information lays a sufficient data foundation for portraying urban form.
Therefore, the contributions of this research are two-fold. Firstly, we give quantitative measurements of neighborhood vibrancy and urban form by using new big data sources at fine scales. Secondly, the correlations between socio-economic indicators, urban form indicators, and neighborhood vibrancy are evaluated by introducing three sets of regression models. The impacts of different urban form factors on spatial vitality are also accessed, and this information could help guide future planning practices. Thus far, this research answers the important questions already proposed, namely, to what extent can urban form contribute to neighborhood vibrancy.
The rest of the paper is structured as follows: Section 2 gives a review of neighborhood vitality and urban form. Section 3 introduces the research area and data used in this paper. Section 4 introduces the method used to measure neighborhood vibrancy and urban form. Section 5 focuses on the analysis of regression results. Section 6 summarizes this paper, and discusses the shortcomings of the research and potential directions for future research.

3. Study Area and Data Sources
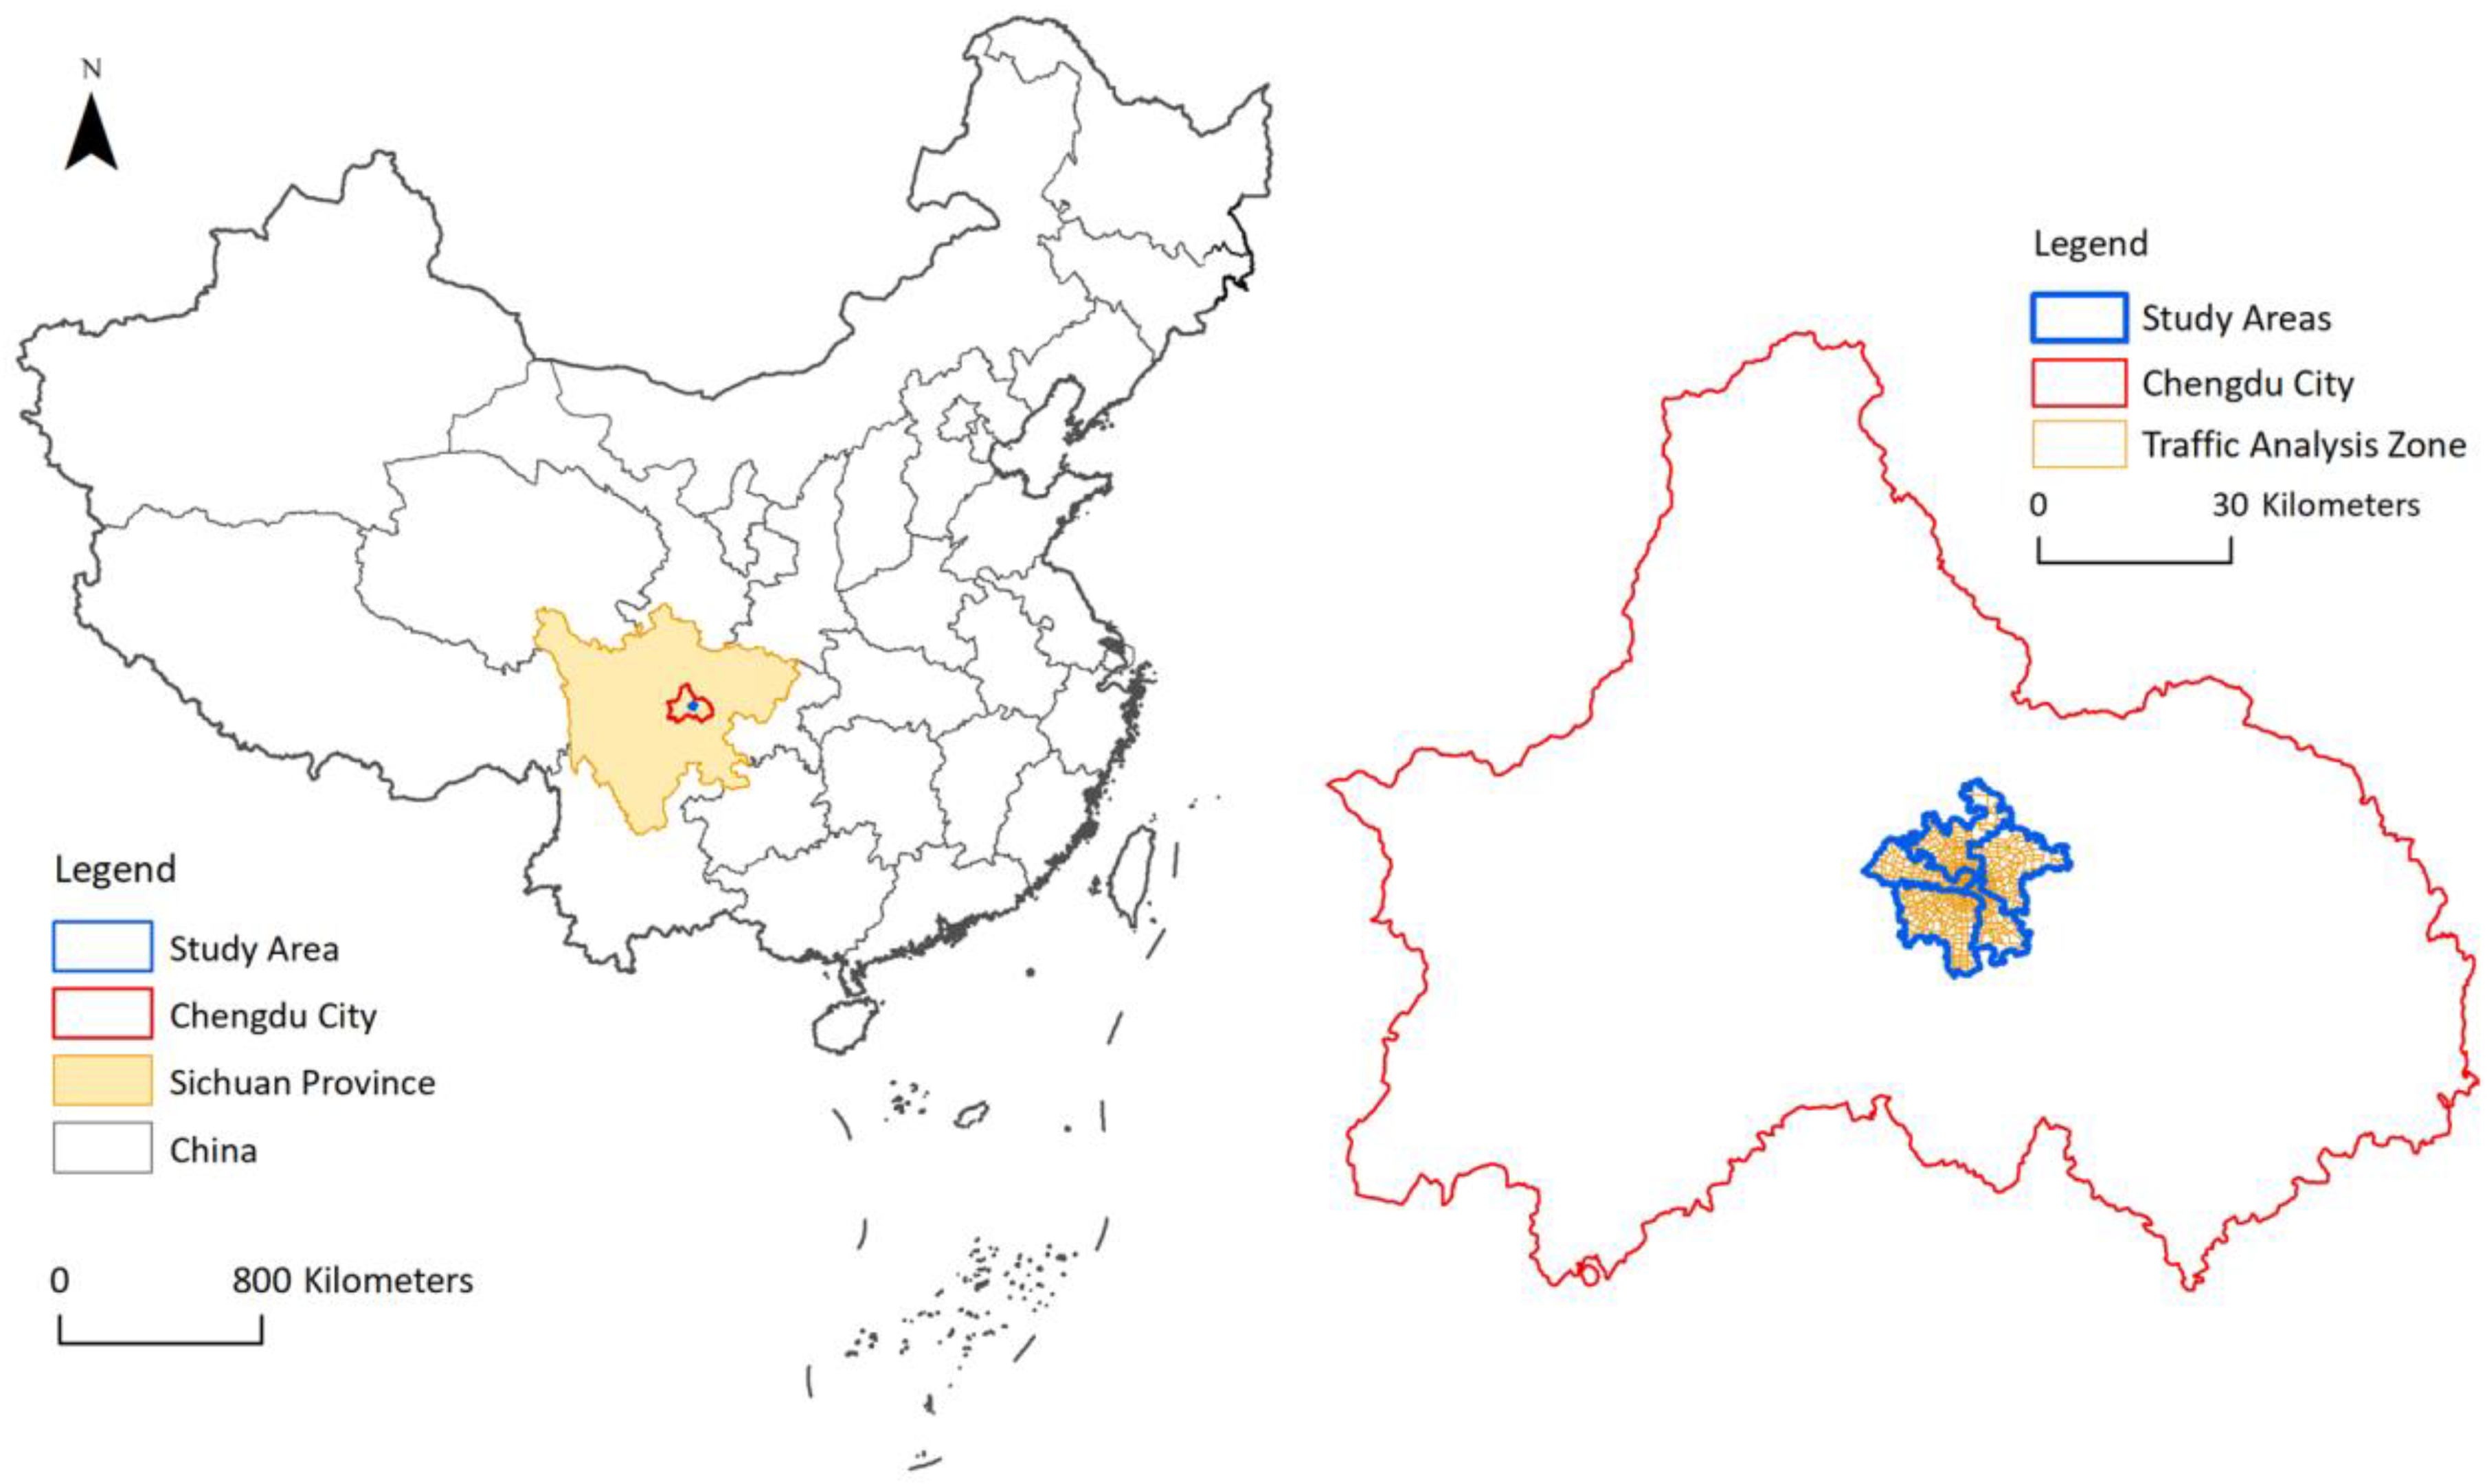
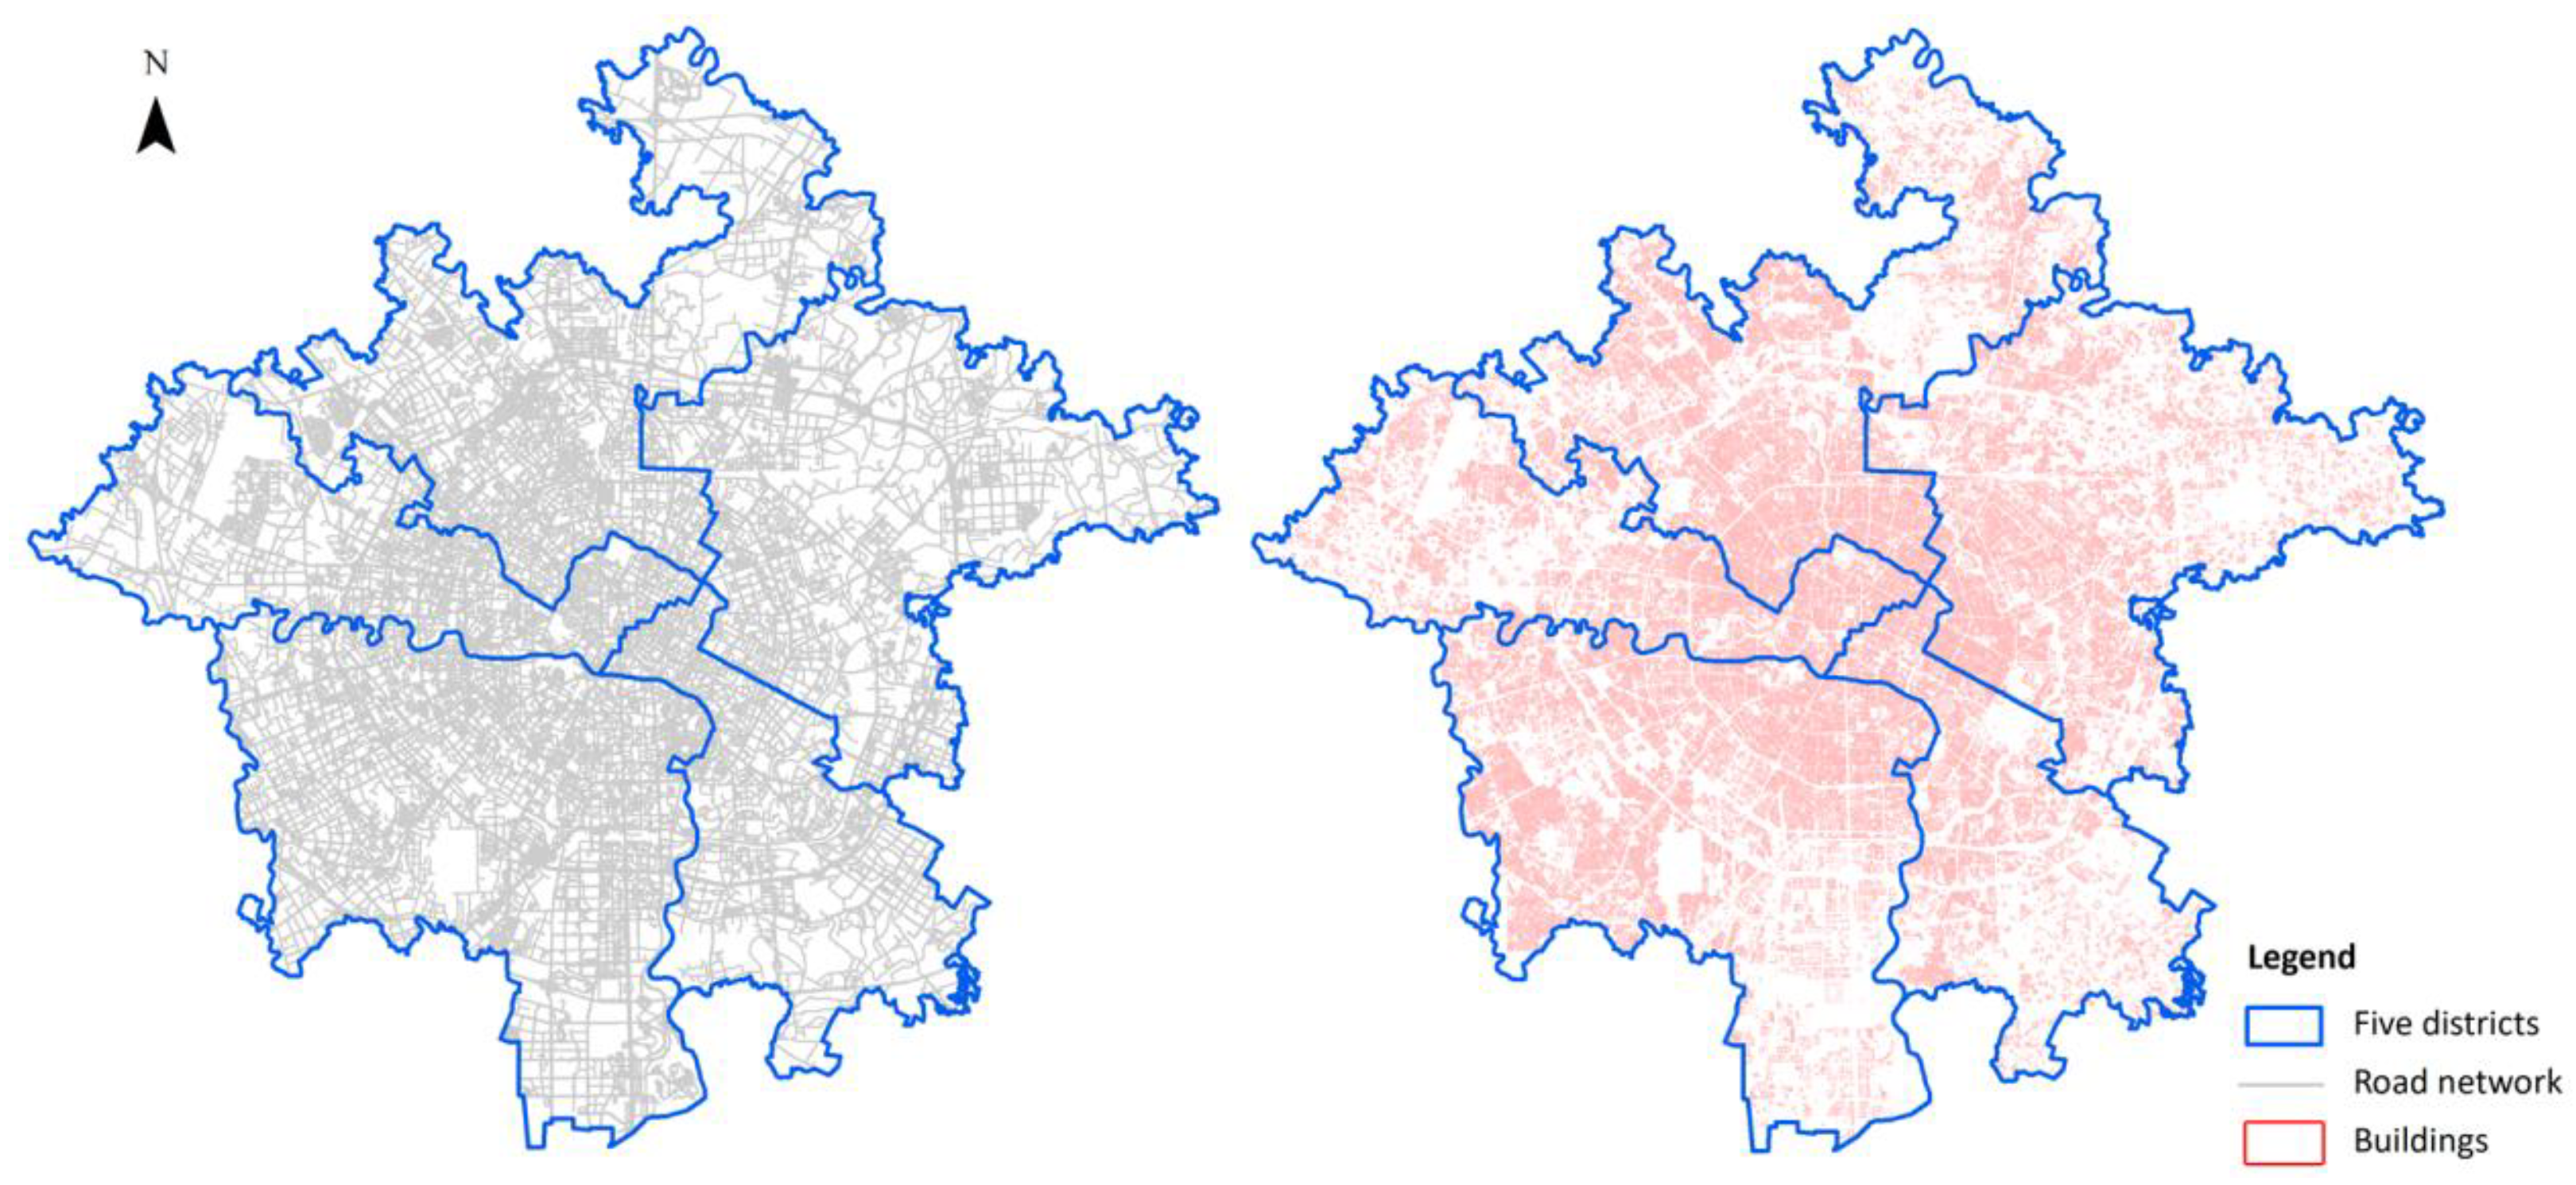
3.1. Study Area

The research area of this paper is the central urban area of Chengdu, the capital city of Sichuan Province, China. This city has a permanent population of more than 16 million. In 2017, the city’s GDP exceeded 1.3 trillion yuan, ranking eighth in China’s urban GDP table. Chengdu is the most important central city in western China, with an urbanization rate of 70.6%. The spatial location of Chengdu is shown in Figure 1. Chengdu has developed into an influential international city. The prosperous socioeconomic status of Chengdu makes it a good choice for neighborhood vibrancy and urban form analyses in China.
Figure 1. Study area of our research.
The central urban area of Chengdu includes the districts of Chenghua, Wuhou, Jinniu, Jinjiang, and Qingyang. These five districts are the most prosperous and oldest districts in Chengdu. The five districts have a total population of 4.6 million, and a total area of approximately 420 square kilometers. The five districts have 76 sub-district offices and a total of 658 traffic analysis zones. The basic spatial analysis units in this paper (the neighborhoods) are the traffic analysis zones.

3.2. Data Resources

(1) Sina micro-blog check-in data: The data used in this research to describe human activity intensity is Sina micro-blog social media check-in data. Sina micro-blog (similar to Facebook and Twitter) is China’s largest social media platform, with 165 million daily active users (DAUs) and high spatial positioning accuracy. The location check-in data obtained in this research covers the time period from 1 December 2014, to 31 December 2014. During this period, a total of 244,831 records were logged in the study area. Sina micro-blog users have many attributes, such as gender, place of registration, educational levels, and the number of Weibo fans. These check-in data are easy to obtain through corresponding application program interfaces (APIs) without encountering privacy issues [44], since it is the users’ own choices to hide this information or not.
(2) POI (point of interest) data: The POI data in this paper are obtained from Amap (http://www.amap.com/), one of China’s largest map search engines and suppliers. Amap provides free API interfaces to access map layers and features information. The POI data obtained in this research cover all types of facilities. The POI database has 223,595 POIs, covering 14 primary categories and 81 subcategories. The 14 primary categories include: Retail and wholesale, companies and enterprises, public facilities, scenic sites, restaurants, hotel and recreation facilities, government and organization locations, medical and health care, sports and cultural facilities, textile and food, residential, research and education buildings, financial and insurance offices, and transportation. Table 1 shows the numeric distribution of POIs in the various categories.
Table 1. Number of points of interest (POIs) at each category.
(3) Building vector data and road network data: In this paper, building vector data (including building height) are used to calculate the floor area ratio, which is the building density indicator in each neighborhood. In addition, road network data can be downloaded from Openstreetmap, which provides detailed road vector information that global users can download and use. The building vector data and road network data in the study area are shown in Figure 2.
Figure 2. Road network (left) and building vector data (right).

4. Definitions of Variables

As has been illustrated in Section 2.1, the relevant urban form elements that affect urban vitality are mainly concluded as follows: Mixed function, spatial accessibility, spatial intensity and density, shape index, and so on [1,33,34,43,44,56,58], according to the literature in China and abroad. Besides, these first three urban form elements are the cores of compact city concepts that have been widely accepted in the field of urban planning and design [43,44,47,48,49,50]. This research then computes different sets of urban form measurements that correspond to the concluded spatial elements to capture the characteristics of neighborhoods.

4.1. Neighborhood Vibrancy (Dependent Variable)

This paper uses the number of check-ins of each neighborhood to measure the degree of vibrancy. We know that neighborhood vibrancy cannot be fully expressed by the number of people attracted to that neighborhood [14]. However, compared to traditional questionnaire data, social media check-in data can provide a higher sampling rate and also have the ability to characterize community vitality [43]. In this paper, the number of check-ins will be normalized to a fixed interval. Larger number of check-ins indicates higher vibrancy of the neighborhood.

4.2. Socio-Economic Indicators (Independent Variables)

The socio-economic data used in this study mainly include the number of permanent residents in each neighborhood as the population indicator, along with the GDP (gross domestic product). This paper uses the amount of local tax income (instead of GDP), as tax income is also considered to be an indicator of the economic level of a country or region. Both the population indicator and local tax income data can be acquired from the statistical yearbook (http://www.chdstats.gov.cn/). Jacobs illustrated that good neighborhood vibrancy requires both dense population distribution and economic connectivity [34].

4.3. Shape Indicators (Independent Variables)

In this paper, Area (Si) and the Richardson compactness index (RCI) [60] are used to measure the shape indicators of each neighborhood. The compactness index takes the circular region as the standard unit measure of shape compactness, and its value is 1. The compactness of other regions is less than 1. The smaller the value of the compactness index, the less compact the urban space. The Richardson compactness index (RCI) is calculated as:
R C I i = π S i C i ,
where Ci is the perimeter of neighborhood i.

4.4. Accessibility Indicators (Independent Variables)

According to existing research, and based on the building environment and travel behavior, a convenient external transportation system (such as rail transit or public transportation, which is beneficial to residents travelling long distances) would lead to lower neighborhood vibrancy [61]. One of the accessibility measurements is the distance between each neighborhood and its nearest railway station, known as the rail-transit convenience index (RTI) [43].
R T I i = D 0 M i n ( D i r ) ,
where Dir is the distance between neighborhood i and its nearest railway station r; and D0 is the minimum constant distance, which is set as 12 km in our study. Thus, a smaller distance of Dir results in a higher value of RTIi, indicating a more convenient rail transit.
In addition, the accessibility of bus services needs to be measured. The accessibility of bus transport mainly refers to the distribution of bus stations within the neighborhood. This paper uses the number of bus stations (NBS) in the neighborhood to measure the degree of bus accessibility.

4.5. Mixed Function (Independent Variables)

The spatial function focuses on the types of land use and their mixing degree. This is a key indicator when measuring urban spatial functional diversity. A number of studies have indicated that the diversity of POIs can describe the degree of the mixed function of urban spaces [14]. Based on the information entropy calculation method, Shannon entropy is used to calculate the POI diversity index in each neighborhood. The index is calculated as follows:
E n t r o p y = j = 1 n p j l o g 2 p j ,
where n is the number of POI types, and the ith POI has a relative proportion of pj.

4.6. Density and Construction Strength (Independent Variables)

Many indicators are used to measure the construction strength and density of neighborhoods. However, construction strength and density are mainly based on the neighborhood’s own attribute characteristics, construction intensity, and degree of mixed function [27]. Studies have shown that higher spatial intensity and building density result in lower urban vitality. Thus, a good built-up environment requires suitable spatial construction strength and density.
Firstly, this research introduces the floor area ratio (FAR) to measure the level of spatial construction strength. In fact, FAR is an important economic and technical indicator reflecting the intensity of urban construction. The greater the FAR is, the greater the intensity of construction is, and the higher the degree of land use is. In this paper, FAR is calculated as:
F A R i = Q i / S i ,
where Qi is the total construction area of neighborhood i, including the ground and aerial construction area.
Secondly, this research introduces the building density index (BDI) to measure the level of ground construction strength. In this study, BDI is the ratio of the projected area of buildings to the total area of a neighborhood, thereby indicating the land occupation rate of that neighborhood, as well as the intensity of building coverage. BDI is calculated as:
B D I i = M i / S i ,
where Mi is the total base area of all buildings in neighborhood i.
Thirdly, the road density index (RDI) is introduced to measure the degree of road density in the neighborhood. The RDI further describes the construction strength and accessibility of transportation facilities and services. In this paper, RDI is calculated as:
R D I i = L i / S i ,
where Li is the total length of the center lines of the roads in neighborhood i.
Lastly, the POI density index (PDI) is used to measure the degree of function density in each neighborhood. In this case, PDI is the ratio of the total number of POIs to the area of the neighborhood. Table 2 lists the definitions of all the urban form variables.
Table 2. Definitions of urban form indicators.

4.7. Regression Model

In order to explore the relationship between urban form factors and neighborhood vibrancy, this paper implements three sets of linear regression models. The dependent variable is neighborhood vibrancy, as measured by social-media check-in data. Independent variables include socio-economic factors and neighborhood urban form indicators. Socio-economic factors (population and economic data) are control variables. These variables are introduced to explain any variation in neighborhood vibrancy that is not related to urban form.

5. Results and Analysis

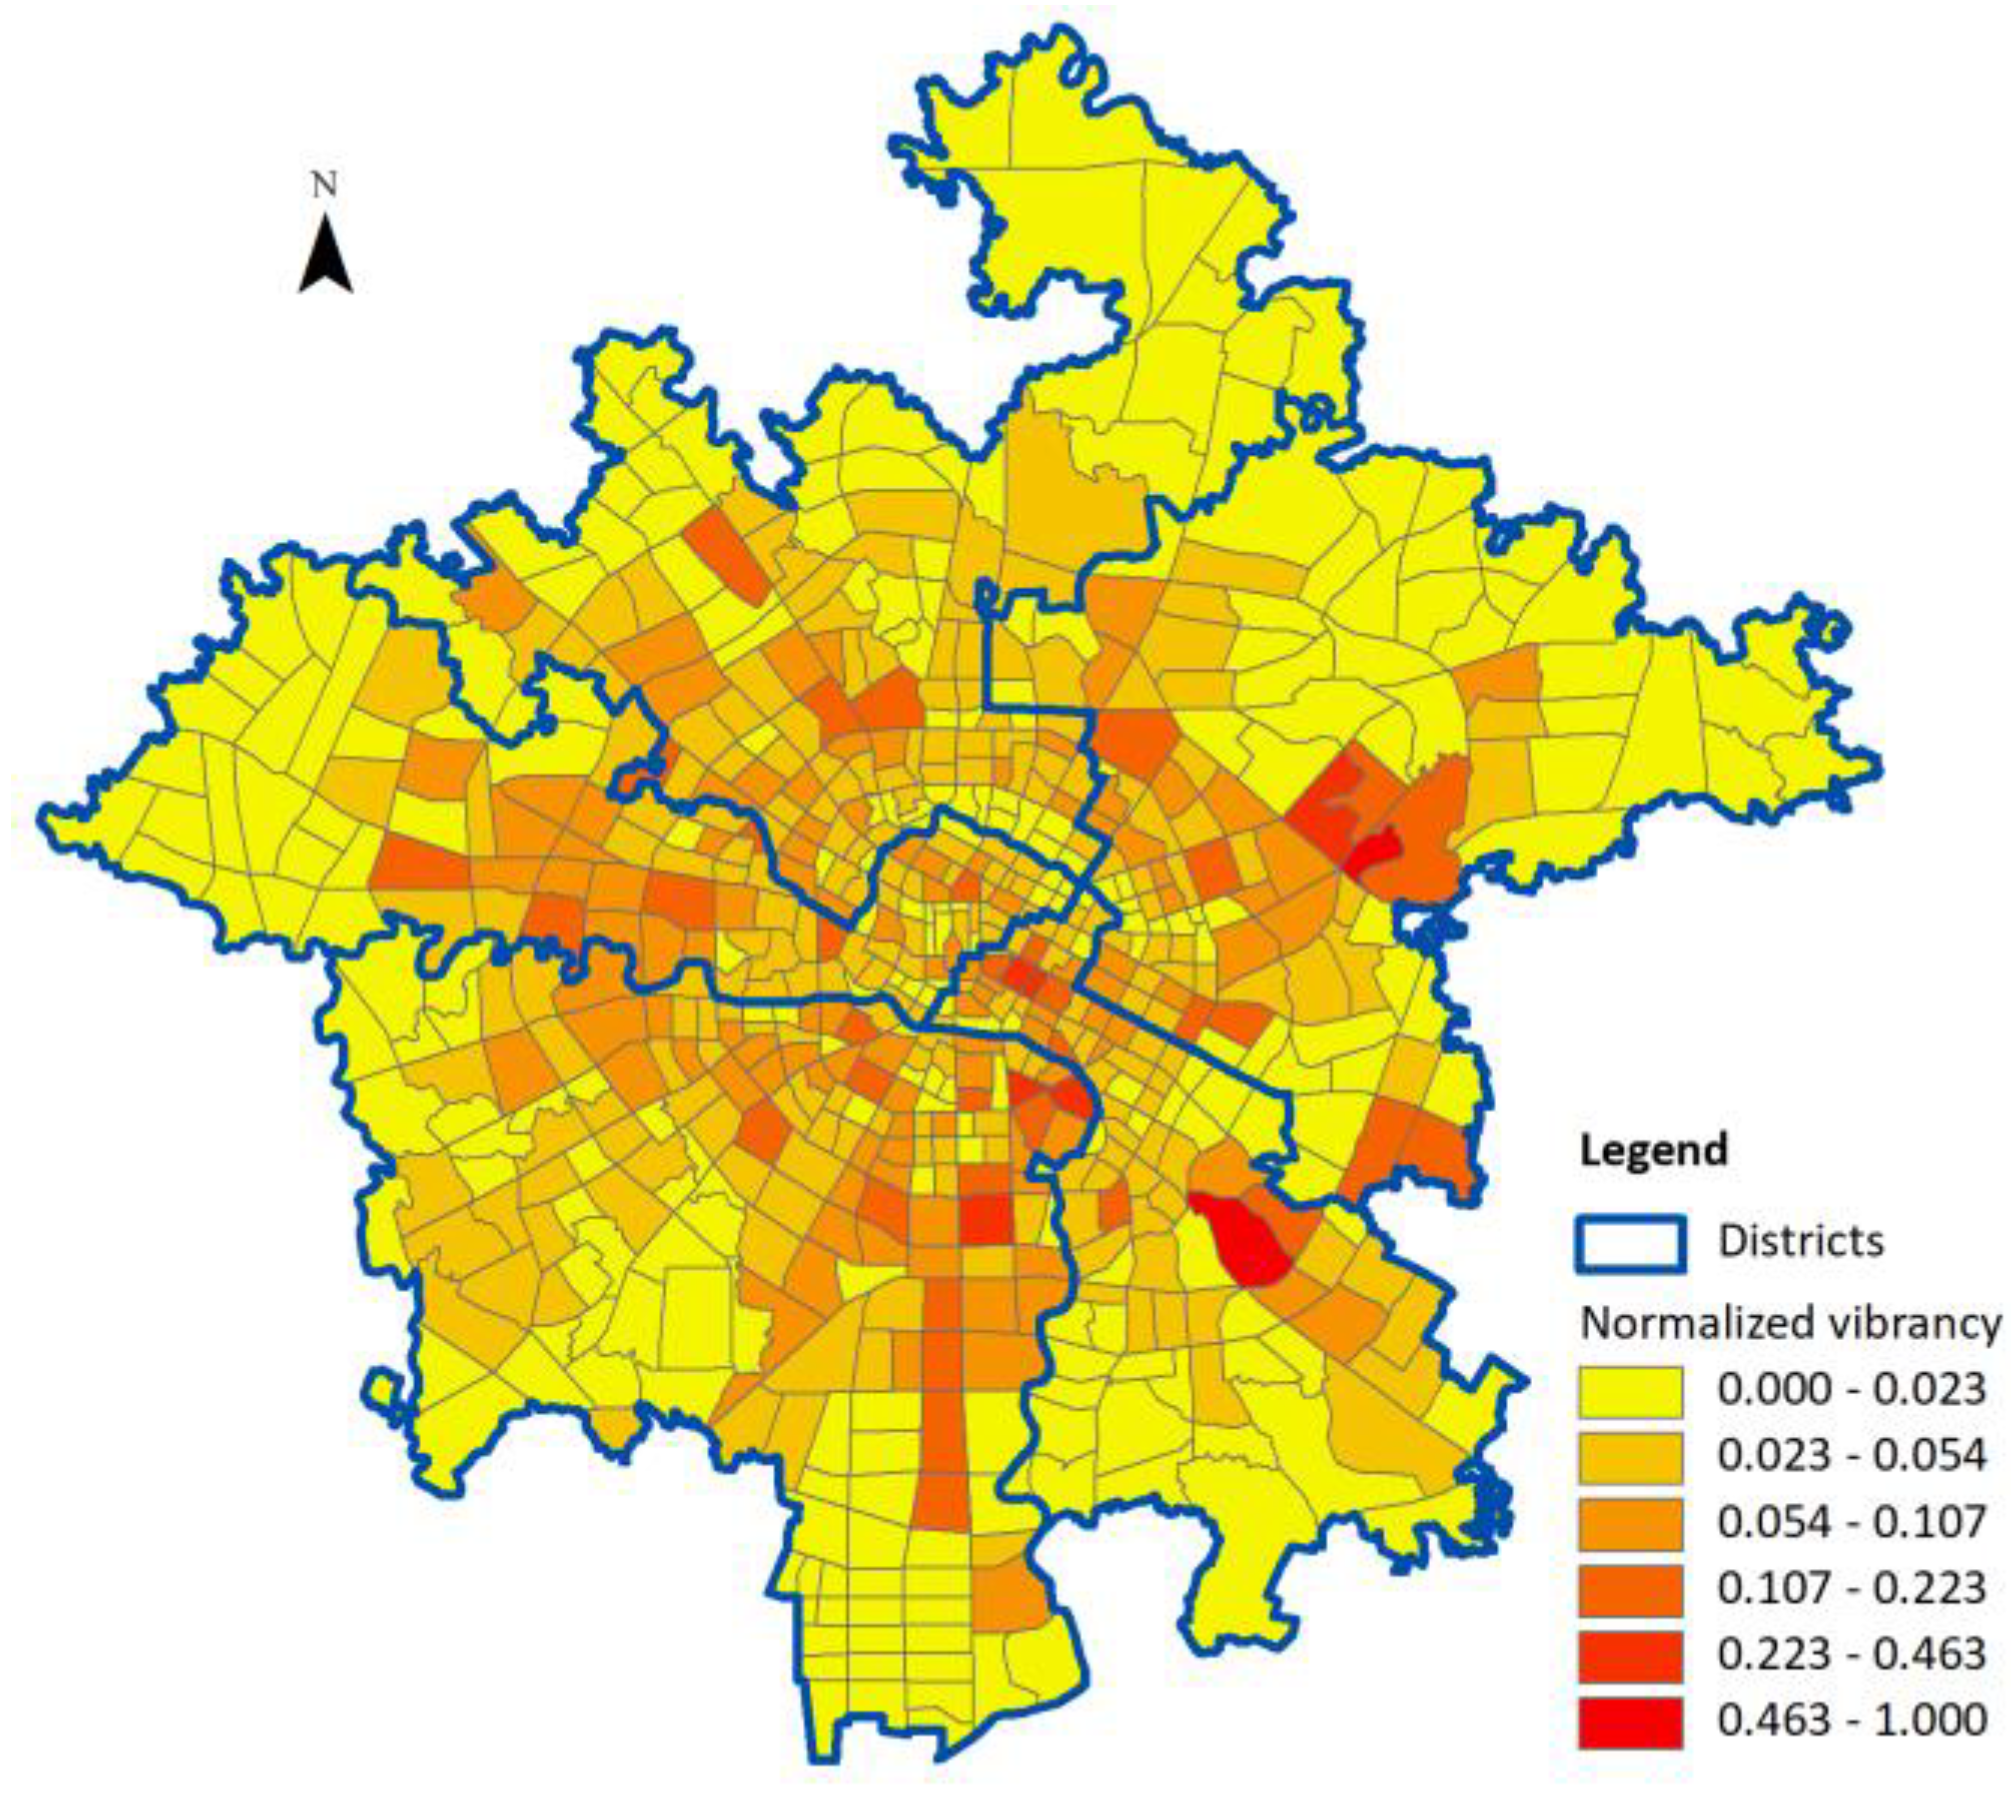
5.1. Analysis of Vibrancy and Selected Factors

The spatial distribution patterns of neighborhood vibrancy are shown in Figure 3. The value of neighborhood vibrancy is normalized into fixed intervals, and divided into six levels according to the nature breaks method. It can be seen that neighborhood vibrancy in our study area shows obvious spatial heterogeneous patterns.
Figure 3. Spatial distribution of neighborhood vibrancy.
Neighborhoods in the most central areas of Chengdu have strong vibrancy. However, the ring-shaped neighborhoods radiating out towards the central area are stronger, while the vibrancy of areas that reach the margins is weak. This paper further uses Global Moran’s I to measure the global spatial autocorrelation of neighborhood vibrancy. The Global Moran’s I coefficient of neighborhood vibrancy is 0.071 (p-value < 0.001), and the correlation is very weak. This finding indicates that the neighborhood vibrancy in the study area has strong spatial heterogeneous patterns, further confirming that neighborhood vibrancy is affected by various spatial factors. This finding provides the basis for the application of spatial regression analyses.
Table 3 shows the statistical values of the socio-economic indicators and urban form indicators in each neighborhood in this paper. The absolute values of the correlation coefficients of different urban form indicators are less than 0.62, indicating that no serious multicollinearity exists in the selected variables, so the results of the multiple linear regression are not affected. The average population of each neighborhood is approximately 6990. The indicators of each neighborhood change greatly, according to the standard deviation. The spatial heterogeneous distributions of each indicator suggest that different urban forms may lead to different levels of neighborhood vibrancy. Thus, the relationship is revealed in the next part.
Table 3. Characteristics of urban form in neighborhood variables.

5.2. Analysis of Linear Regression

Table 4 shows the detailed results of the three sets of linear regressions. The variance inflation factor (VIF) of the FAR variable is approximately 5.5, and the VIF of other variables are all less than 3. Therefore, the independent variables are not redundant, which indicates that the multicollinearity should have no impact on the results of the regression analyses.
Table 4. Regression models for the impact of urban form on neighborhood vitality.
Firstly, the adjusted R2 values for Model 1, Model 2, and Model 3 are 0.23, 0.26, and 0.45, respectively; the intercepts are 4.95, 4.32, and 1.90, respectively. These figures indicate that the accuracy of the regression model gradually improves. While the highest R2 is only approximately 0.45 in these three models, the p-value is less than 0.0001, indicating that the three linear regression models are statistically significant in terms of illustrating patterns of neighborhood vibrancy.
Model 1, as the base model, does not contain any urban form indicators. As expected, the regression results indicate that socio-economic factors have a significant impact on neighborhood vibrancy. These factors account for approximately 23% of the variance. The result of this positive association is consistent with the findings of Yue et al. [14]. The main difference is that the contribution of the socio-economic factors in this study is slightly lower than in Yue’s study. With this positive relationship, it is also easier to explain why neighborhoods with strong vibrancy often have dense population and economic contacts.
Model 2 introduces the neighborhood’s own area and compactness (RCI) indicators to measure the shape index of the neighborhood. The shape index is independent of the distribution of the various elements within each neighborhood. The regression results show that the introduction of these two indicators does not significantly improve the predictive ability of the linear regression model. In this study, R2 only increased from 0.23 to 0.26, which is not obvious. This finding indicates that, in this study, the relationship between neighborhood vibrancy and the neighborhood shape index is very weak. A neighborhood’s boundary jaggedness is not very important for creating or increasing the vibrancy of that neighborhood.
In Model 3, by introducing inner urban form indicators (including density, intensity, accessibility, and functional diversity), the accuracy of the regression model increases to 0.45, which is nearly double compared with Models 1 and 2. This shows that the urban form of the neighborhood has a strong correlation with the neighborhood vibrancy. In addition, as expected, various urban form measurements jointly promote the vitality of urban space. Different urban form indicators make different contributions. The functional diversity indicator (entropy) plays a positive role in creating neighborhood vibrancy. Additionally, BDI and FAR describe the construction intensity from different ground and spatial perspectives, but these factors play different roles in creating vibrancy. In reality, FAR plays a weak and negative role, indicating that excessive spatial construction leads to a decrease of neighborhood vibrancy. In addition, public transportation systems are also conducive to the creation of vibrancy. This finding is different to the findings of Miles and Song [61]. The higher the accessibility of the neighborhood, the higher the connectivity of the neighborhood with others in the city. The residents can more easily travel from the surrounding areas to the neighborhood to take part in activities and social interactions, thus inspiring greater neighborhood vibrancy.
Therefore, to a large extent, urban form indicators and socio-economic factors can explain the variation of neighborhood vibrancy. Different urban form factors have different influences, and urban form indicators with strong correlation, such as proper spatial construction density, high functional diversity, and so on, have greater impacts in terms of creating vibrancy.

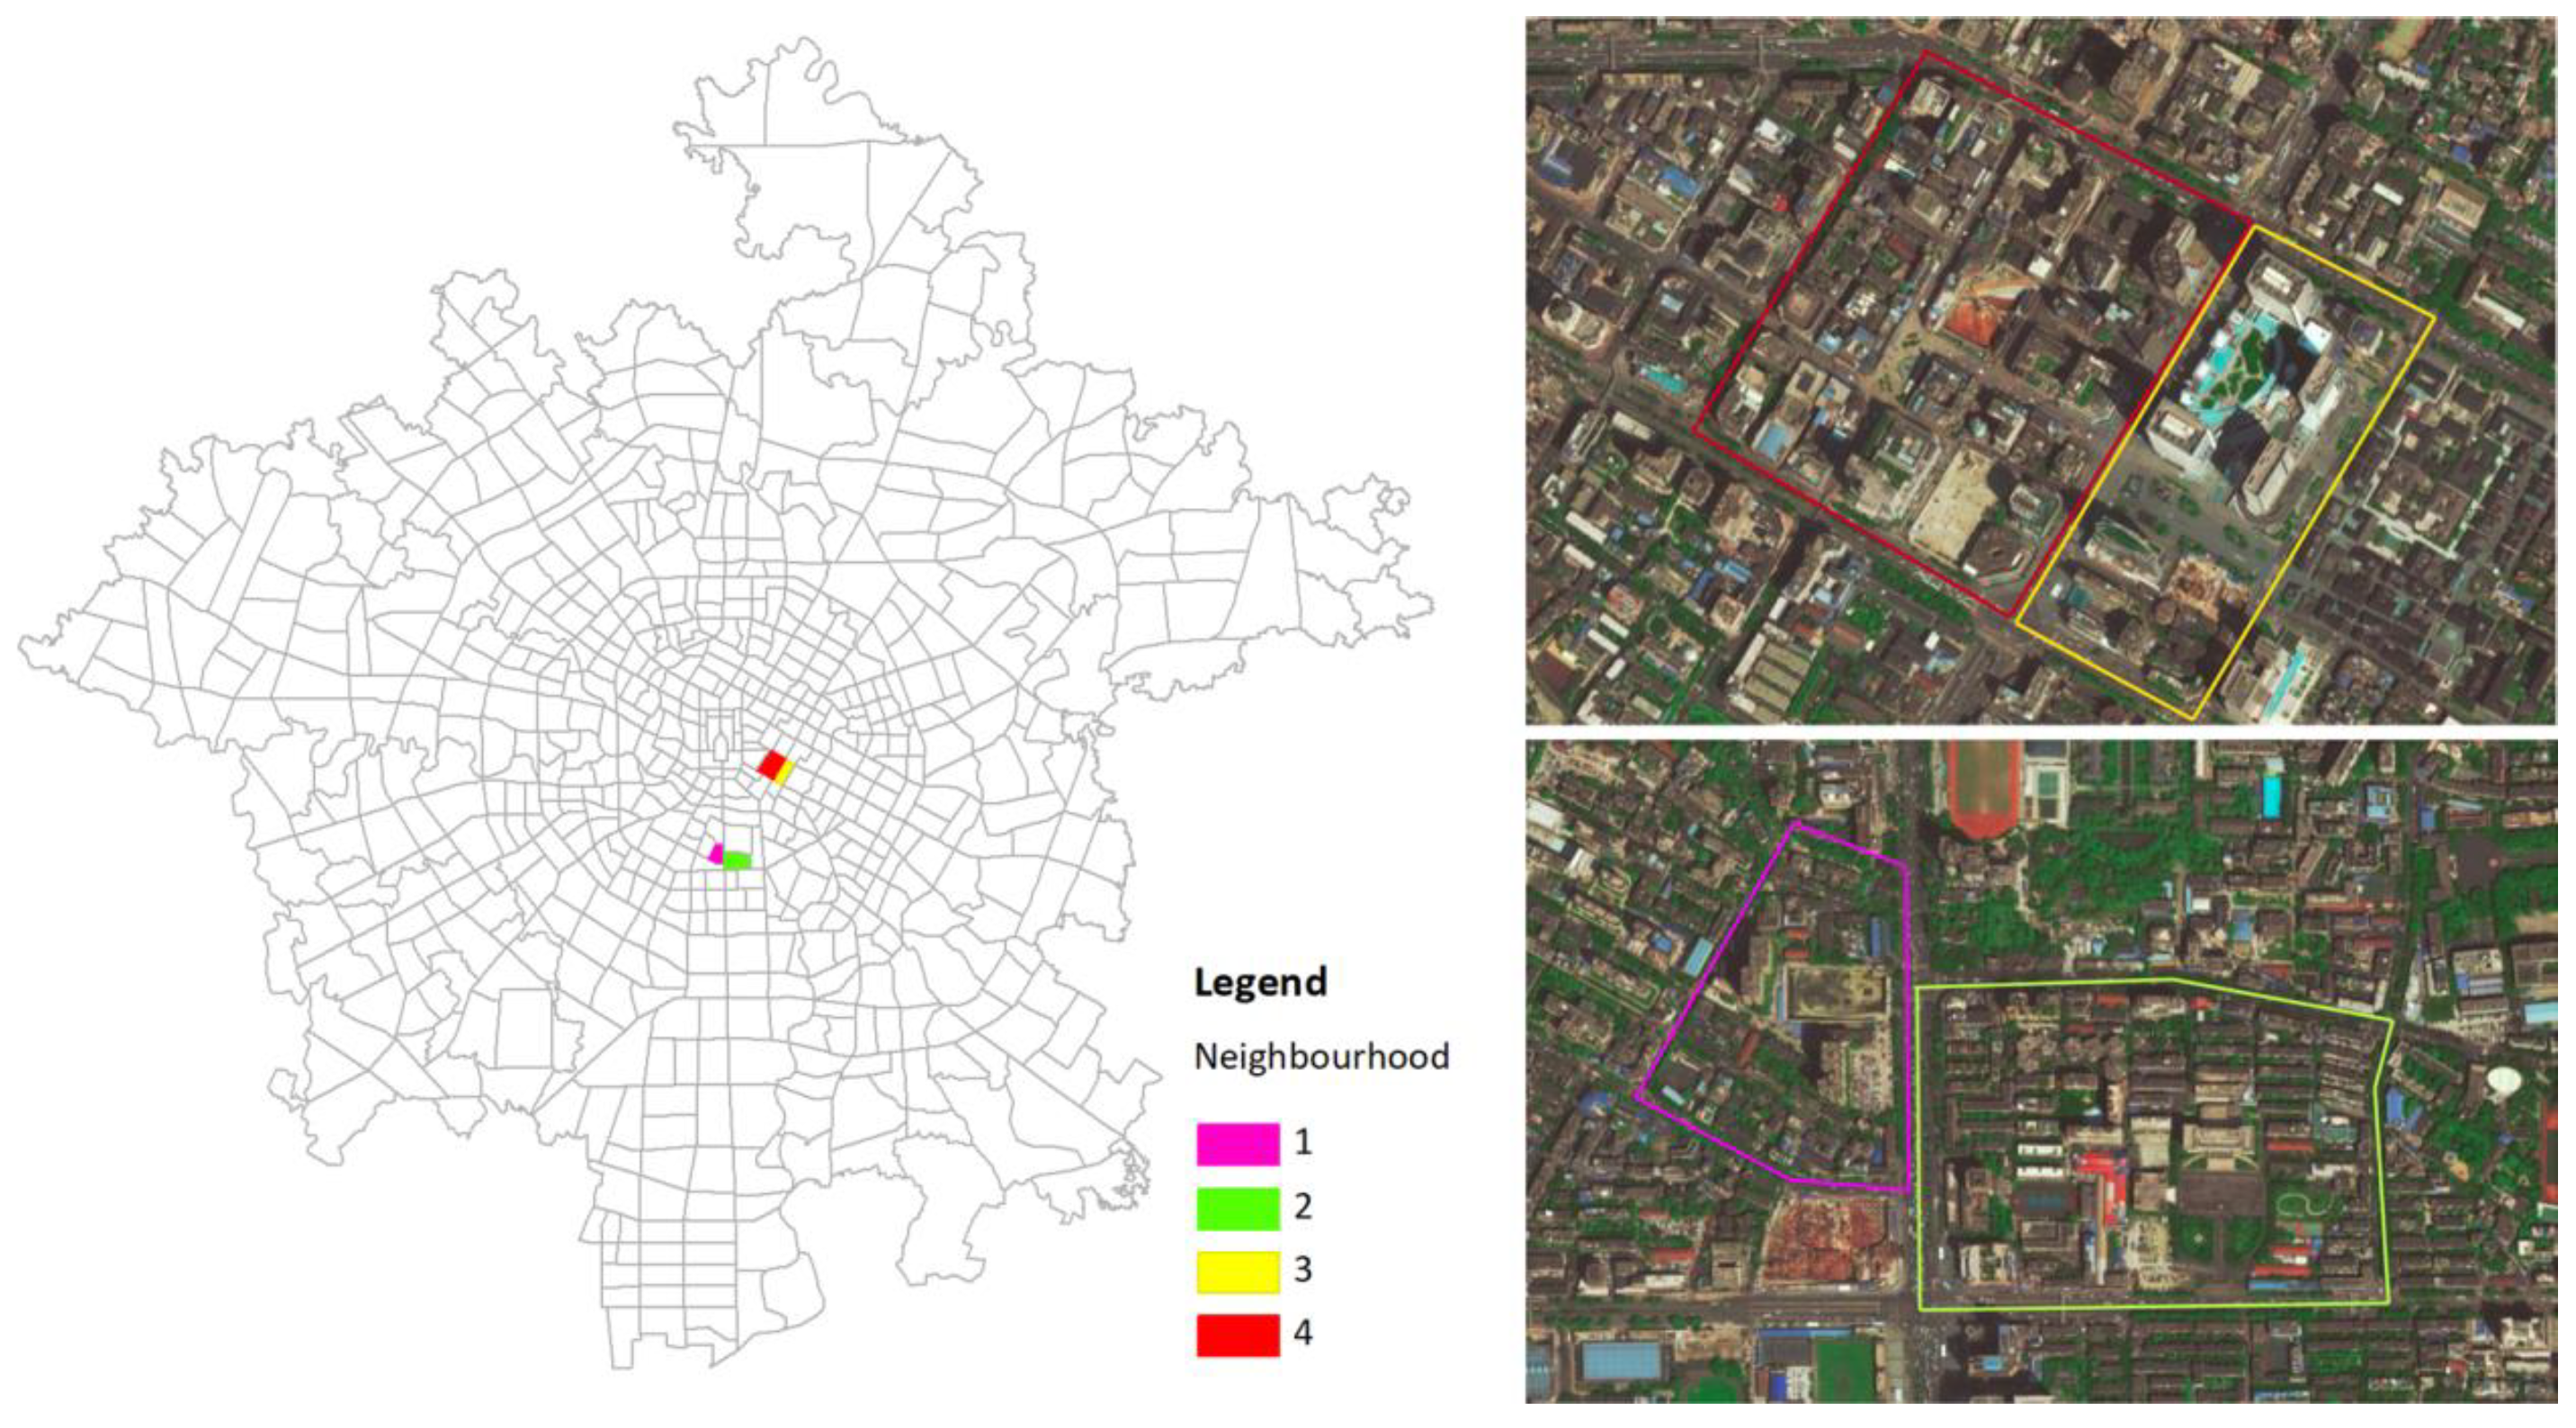
5.3. Comparisons of Inner Neighborhood Urban Forms

We selected four typical neighborhoods to explore the relationship between their internal urban form and vibrancy. Neighborhoods No. 1 and No. 2 are located near Nanhong Village. Chengdu Normal University is located in Neighborhood No. 1, and Xihua University is located in Neighborhood No. 2. Both of these two neighborhoods are close to Sichuan University. Neighborhoods No. 3 and No. 4 are located near Chunxi Road in Jinjiang District, which is famous for food, entertainment, and shopping. The spatial distributions and satellite images of the four neighborhoods are shown in Figure 4.
Figure 4. Four neighborhoods with different urban forms.
Table 5 shows the urban form indicators within four selected neighborhoods, where the values of Entropy, NBS, and RTI indictors are almost the same. Neighborhoods No. 1 and No. 2 are adjacent, but their degrees of vibrancy are very different. The main difference of urban form indicators is that the FAR of No. 1 is higher than that of No. 2, but the PDI and RDI are much lower. This indicates that FAR inhibits neighborhood vibrancy. Neighborhoods No. 3 and No. 4 are also adjacent, but their neighborhood vibrancy levels are almost the same. The BDI and PDI of No. 4 are higher than those of No. 3, which indicates that BDI and PDI can promote neighborhood vibrancy. The creation of urban vitality is the result of multiple urban form indicators. However, the relationship between neighborhood vibrancy and the spatial form of adjacent neighborhoods needs to be examined in future studies.
Table 5. Inner urban form indicators of the four selected neighborhoods.

6. Conclusions and Discussion

Urban morphogenesis has always been an important topic in urban form research, and the diversity and vibrancy of urban spaces has been receiving more and more attention. Many theories aim at explaining how urban vitality is created. However, the question of to what extent urban form contributes to neighborhood vibrancy has not been answered due to a lack of sufficient data. Based on the new urbanism theory, this paper uses various open data platforms to explore and analyze the relationship between urban form and vibrancy.
Firstly, this paper uses social media check-in big data to quantitatively evaluate the vibrancy of 658 neighborhoods in the central urban area of Chengdu, China. The results of spatial autocorrelation analysis show that neighborhood vibrancy in this study area shows strong spatial heterogeneous patterns, which in turn provides the basis for the application of spatial regression analysis. By analyzing the results of three regression models that consider different explanatory variables, this study finds that socio-economic factors can explain approximately 23% of neighborhood vibrancy. In addition, the correlation between the shape compactness index of a neighborhood and vibrancy is not strong. However, neighborhood area has a swinging effect on neighborhood vibrancy.
Based on various open data platforms, this paper proposes an urban form measurement system including three primary categories: (1) Construction intensity and density, (2) accessibility, and (3) functional diversity. When the inner urban form indicators are introduced into the regression model, the accuracy of the model increases from 0.23 to 0.45, indicating that urban form has a strong correlation with neighborhood vibrancy. Also, various urban form indicators jointly promote the vitality of urban space. Specifically, building density and functional diversity are strongly positively correlated with neighborhood vibrancy. In addition, the FAR has a weak negative correlation, indicating that large FAR will suppress the vibrancy of urban space. Therefore, it is necessary to balance and coordinate the level of ground building density and spatial construction intensity, which help strengthen the understanding of the “compact city” concept and the practice of urban planning and design [62,63]. In addition, mixed and diverse functions are also key elements of a compact city [62,64]. The problems and difficulties of mixed land use that emerged in the development of China’s rapid urbanization process still require systematic research and exploration [65]. In summary, the results of this paper show that urban form profoundly affects the creation of urban vitality. Creating neighborhood vibrancy is mainly about emphasizing the enhancement of public transport accessibility, diversity of urban functions, and appropriate construction intensity. The quantitative relationships can help urban planners and managers to better design urban form.
However we do note several limitations specific to the application of social-media check-in data and urban form measurement system, such as:
(1) In the application of big data for analyzing and evaluating neighborhood vibrancy, we should not only consider the spatial and temporal sampling representativeness problem of data [18,19], we must also consider the privacy issue and biases of group, age, gender, and occupation [66,67] in the data.
(2) In addition, real-time check-in data are needed to measure the dynamic and present neighborhood vibrancy. Besides, the distinction between working days and non-working days, as well as holidays, may be more helpful in explaining the regression results.
(3) Moreover, neighborhood vibrancy may also be related to the urban form of nearby neighborhoods and social attributes of residents. This possibility has not been considered in this or previous studies.
(4) Finally, indicators regarding different urban form elements may differ from city to city, thus using more open data platforms could help complete the urban form measurement system.

Author Contributions

The research was mainly conceived and designed by Shiwei Lu and Yaping Huang. Chaoyang Shi and Xiping Yang performed the experiments. Shiwei Lu and Chaoyang Shi wrote the manuscript. Yaping Huang reviewed the manuscript and provided comments.

Funding

This research was jointly supported by the Open Fund of Key Laboratory of Urban Land Resources Monitoring and Simulation, Ministry of Land and Resources (KF-2018-03-006), Open fund of Beijing Key Laboratory of Urban Spatial Information Engineering (No. 2019206), and China Postdoctoral Science Foundation (No. 2018M632860, 2017M623112).

Conflicts of Interest

The authors declare no conflict of interest.

References

  1. Montgomery, J. Making a city: Urbanity, vitality and urban design. J. Urban Des. 1998, 3, 93–116. [Google Scholar] [CrossRef]
  2. Grant, J.L. New Urbanism. International Encyclopedia of the Social and Behavioral Sciences; Elsevier: Amsterdam, The Netherlands, 2015; pp. 809–814. [Google Scholar]
  3. Ye, Y.; Nes, A.V. Measuring urban maturation processes in Dutch and Chinese new towns: Combining street network configuration with building density and degree of land use diversification through GIS. J. Space Syntax 2013, 4, 18–37. [Google Scholar]
  4. Rowley, A. Definitions of urban design: The nature and concerns of urban design. Plan. Pract. Res. 1994, 9, 179–197. [Google Scholar] [CrossRef]
  5. Carmona, M. Public Places, Urban Spaces: The Dimensions of Urban Design; Routledge: London, UK, 2010. [Google Scholar]
  6. Braun, L.M.; Malizia, E. Downtown vibrancy influences public health and safety outcomes in urban counties. J. Transp. Health 2015, 2, 540–548. [Google Scholar] [CrossRef]
  7. Hillier, B. Space Is the Machine: A Configurational Theory of Architecture; Cambridge University Press: Cambridge, UK, 1996. [Google Scholar]
  8. Malizia, E.; Motoyama, Y. The economic development—Vibrant center connection: Tracking high-growth firms in the DC region. Prof. Geogr. 2016, 68, 349–355. [Google Scholar] [CrossRef]
  9. Lynch, K. A Theory of Good City Form; MIT Press: Cambridge, MA, USA, 1981. [Google Scholar]
  10. Florida, R. The Rise of the Creative Class, 2nd ed.; Basic Books: New York, NY, USA, 2012. [Google Scholar]
  11. Markusen, A. Fuzzy concepts, proxy data: Why indicators would not track creative placemaking success. Int. J. Urban Sci. 2013, 17, 291–303. [Google Scholar] [CrossRef]
  12. Long, Y.; Huang, C. Does block size matter? The impact of urban design on economic vitality for Chinese cities. Environ. Plan. B Urban Anal. City Sci. 2017, 25, 353–359. [Google Scholar] [CrossRef]
  13. Kim, Y.-L. Seoul’s Wi-Fi hotspots: Wi-Fi access points as an indicator of urban vitality. Comput. Environ. Urban Syst. 2018, 72, 13–24. [Google Scholar] [CrossRef]
  14. Yue, Y.; Zhuang, Y.; Yeh, A.G.O.; Xie, J.; Ma, C.; Li, Q. Measurements of POI-based mixed use and their relationships with neighbourhood vibrancy. Int. J. Geogr. Inf. Syst. 2017, 31, 658–675. [Google Scholar] [CrossRef]
  15. Liu, Y.; Zhang, X.; Kong, X.; Wang, R.; Chen, L. Identifying the relationship between urban land expansion and human activities in the Yangtze River Economic Belt, China. Appl. Geogr. 2018, 94, 163–177. [Google Scholar] [CrossRef]
  16. Balram, S.; Dragićević, S. Attitudes toward urban green spaces: Integrating questionnaire survey and collaborative GIS techniques to improve attitude measurements. Landsc. Urban Plan. 2005, 71, 147–162. [Google Scholar] [CrossRef]
  17. Yue, Y.; Lan, T.; Yeh, A.G.O.; Li, Q. Zooming into individuals to understand the collective: A review of trajectory-based travel behaviour studies. Travel Behav. Soc. 2014, 1, 69–78. [Google Scholar] [CrossRef]
  18. Lu, S.; Fang, Z.; Zhang, X.; Shaw, S.; Yin, L.; Yang, X.; Zhao, Z. Understanding the representativeness of mobile phone location data in characterizing human mobility indicators. ISPRS Int. J. Geoinform. 2017, 6, 7. [Google Scholar] [CrossRef]
  19. Lu, S.; Shaw, S.-L.; Fang, Z.; Zhang, X.; Yin, L. Exploring the effects of sampling locations for calibrating the huff model using mobile phone location data. Sustainability 2017, 9, 159. [Google Scholar] [CrossRef]
  20. Khalili, A.; Fallah, N.S. Role of social indicators on vitality parameter to enhance the quality of women’s communal life within an urban public space (case: Isfahan’s traditional bazaar, Iran). Front. Archit. Res. 2018, 7, 440–454. [Google Scholar] [CrossRef]
  21. Openshaw, S. The Modifiable Areal Unit Problem; Geo Books: Norwick, UK, 1983. [Google Scholar]
  22. Hunter, A. The urban neighborhood: Its analytical and social contexts. Urban Aff. Quart. 1979, 14, 267–288. [Google Scholar] [CrossRef]
  23. Montgomery, M.R. The urban transformation of the developing world. Science 2008, 319, 761–764. [Google Scholar] [CrossRef]
  24. Liu, Z.; He, C.; Zhang, Q.; Huang, Q.; Yang, Y. Extracting the dynamics of urban expansion in China using DMSP-OLS nighttime light data from 1992 to 2008. Landsc. Urban Plan. 2012, 106, 62–72. [Google Scholar] [CrossRef]
  25. Song, Y.; Popkin, B.; Gordon-Larsen, P. A national-level analysis of neighborhood form metrics. Landsc. Urban Plan. 2013, 116, 73–85. [Google Scholar] [CrossRef] [PubMed]
  26. Lowry, J.H.; Lowry, M.B. Comparing spatial metrics that quantify urban form. Comput. Environ. Urban Syst. 2014, 44, 59–67. [Google Scholar] [CrossRef]
  27. Song, Y.; Quercia, R.G. How are neighbourhood design features valued across different neighbourhood types? J. Hous. Built Environ. 2008, 23, 297–316. [Google Scholar] [CrossRef]
  28. Gohar, M.; Muzammal, M.; Rahman, A.U. SMART TSS: Defining transportation system behavior using big data analytics in smart cities. Sustain. Cities Soc. 2018, 41, 114–119. [Google Scholar] [CrossRef]
  29. Ratti, C.; Frenchman, D.; Pulselli, R.M.; Williams, S. Mobile Landscapes: Using location data from cell phones for urban analysis. Environ. Plan. B Plan. Des. 2006, 33, 727–748. [Google Scholar] [CrossRef]
  30. Chi, G.; Liu, Y.; Wu, H. Ghost cities analysis based on positioning data in China. Comput. Sci. 2015, 68, 1150–1156. [Google Scholar]
  31. Li, L.; Yang, L.; Zhu, H.; Dai, R. Explorative analysis of Wuhan intra-urban human mobility using social media check-in data. PLoS ONE 2015, 10, e0135286. [Google Scholar] [CrossRef] [PubMed]
  32. Chhetri, P.; Stimson, R.J.; Western, J.S. Modelling the factors of neighbourhood attractiveness reflected in residential location decision choices. Stud. Reg. Sci. 2006, 36, 393–417. [Google Scholar] [CrossRef]
  33. Gehl, J. New City Spaces; Danish Architectural Press: Copenhagen, Denmark, 2000; pp. 33–37. [Google Scholar]
  34. Jacobs, J. The Death and Life of Great American Cities; Random House: New York, NY, USA, 1961. [Google Scholar]
  35. Attoe, W.; Logan, D. American Urban Architecture: Catalysts in the Design of Cities; University of California Press: Oakland, CA, USA, 1989. [Google Scholar]
  36. Maas, P.R. Towards a Theory of Urban Vitality; University of British Columbia: Vancouver, BC, Canada, 1984. [Google Scholar]
  37. Landry, B. Race, Gender and Class: Theory and Methods of Analysis; Routledge: New York, NY, USA, 2016. [Google Scholar]
  38. Akkerman, A. Harmonies of urban design and discords of city-form: Urban aesthetics in the rise of western civilization. J. Urban Des. 2000, 5, 267–290. [Google Scholar] [CrossRef]
  39. Adedeji, J.A.; Fadamiro, J.A. Urban open space transition and management in Lagos, Nigeria. Manag. Environ. Qual. Int. J. 2015, 26, 951–965. [Google Scholar] [CrossRef]
  40. March, A.; Rijal, Y.; Wilkinson, S.; Özgür, E.F. Measuring building adaptability and street vitality. Plan. Pract. Res. 2012, 27, 531–552. [Google Scholar] [CrossRef]
  41. Zarin, S.Z.; Niroomand, M.; Heidari, A.A. Physical and social aspects of vitality case study: Traditional street and modern street in Tehran. Procedia Soc. Behav. Sci. 2015, 170, 659–668. [Google Scholar] [CrossRef]
  42. Filion, P.; Hammond, K. Neighbourhood land use and performance: The evolution of neighbourhood morphology over the 20th century. Environ. Urban Plan. B Plan. Des. 2003, 30, 271–296. [Google Scholar] [CrossRef]
  43. Wu, J.; Ta, N.; Song, Y.; Lin, J.; Chai, Y. Urban form breeds neighborhood vibrancy: A case study using a GPS-based activity survey in suburban Beijing. Cities 2018, 74, 100–108. [Google Scholar] [CrossRef]
  44. Wu, C.; Ye, X.; Ren, F.; Du, Q. Check-in behaviour and spatio-temporal vibrancy: An exploratory analysis in Shenzhen, China. Cities 2018, 77, 104–116. [Google Scholar] [CrossRef]
  45. Li, Y.; Liu, X. How did urban polycentricity and dispersion affect economic productivity? A case study of 306 Chinese cities. Landsc. Urban Plan. 2018, 173, 51–59. [Google Scholar] [CrossRef]
  46. Conzen, M.R.G. Alnwick, Northumberland: A study in town-plan analysis. Trans. Pap. (Inst. Br. Geogr.) 1960, 27, 1–122. [Google Scholar] [CrossRef]
  47. Song, Y.; Knaap, G.J. Measuring urban form: Is Portland winning the war on sprawl? J. Am. Plan. Assoc. 2004, 70, 210–225. [Google Scholar] [CrossRef]
  48. Ewing, R.; Handy, L.S.; Brownson, C.R.; Clemente, O.; Winston, E. Identifying and measuring urban design qualities related to walkability. J. Phys. Act. Health 2006, 3, S223–S240. [Google Scholar] [CrossRef]
  49. Ewing, R.; Cervero, R. Travel and the built environment. J. Am. Plan. Assoc. 2010, 76, 265–294. [Google Scholar] [CrossRef]
  50. Ambarwati, L.; Verhaeghe, R.; Arem, B.V.; Pel, A.J. The influence of integrated space-transport development strategies on air pollution in urban areas. Transp. Res. Part D Transp. Environ. 2016, 44, 134–146. [Google Scholar] [CrossRef]
  51. Hamidi, S.; Ewing, R.; Preuss, I.; Dodds, A. Measuring sprawl and its impacts. J. Plan. Educ. Res. 2002, 57, 320–326. [Google Scholar] [CrossRef]
  52. Chao, L.; Qing, S. An empirical analysis of the influence of urban form on household travel and energy consumption. Comput. Environ. Urban Syst. 2011, 35, 347–357. [Google Scholar]
  53. Bereitschaft, B.; Debbage, K. Urban form, air pollution, and CO2 emissions in large U.S. metropolitan areas. Prof. Geogr. 2013, 65, 612–635. [Google Scholar] [CrossRef]
  54. Makido, Y.; Dhakal, S.; Yamagata, Y. Relationship between urban form and CO2 emissions: Evidence from fifty Japanese cities. Urban Clim. 2012, 2, 55–67. [Google Scholar] [CrossRef]
  55. Gill, S.E.; Handley, J.F.; Ennos, A.R.; Pauleit, S.; Theuray, N.; Lindley, S. Characterising the urban environment of UK cities and towns: A template for landscape planning. Landsc. Urban Plan. 2008, 87, 210–222. [Google Scholar] [CrossRef]
  56. Katz, P. The New Urbanism: Toward an Architecture of Community; McGraw-Hill Professional: New York, NY, USA, 1993. [Google Scholar]
  57. Delclòs-Alióa, X.; Gutiérrezc, A.; Miralles-Guasch, C. The urban vitality conditions of Jane Jacobs in Barcelona: Residential and smartphone-based tracking measurements of the built environment in a Mediterranean metropolis. Cities 2019, 86, 220–228. [Google Scholar] [CrossRef]
  58. Ye, Y.; Li, D.; Liu, X. How block density and typology affect urban vitality: An exploratory analysis in Shenzhen, China. Urban Geogr. 2018, 39, 631–652. [Google Scholar] [CrossRef]
  59. He, Q.; He, W.; Song, Y.; Wu, J.; Yin, C.; Mou, Y. The impact of urban growth patterns on urban vitality in newly built-up areas based on an association rules analysis using geographical ‘big data’. Land Use Policy 2018, 78, 726–738. [Google Scholar] [CrossRef]
  60. Richardson, H.W. The Economics of Urban Size; Saxon House: Lexington, KY, USA, 1973. [Google Scholar]
  61. Miles, R.; Song, Y. “Good” neighborhoods in Portland, Oregon: Focus on both social and physical environments. J. Urban Aff. 2009, 31, 491–509. [Google Scholar] [CrossRef]
  62. Cairnes, L. The compact city: A sustainable urban form. Urban Des. Int. 1996, 1, 293–294. [Google Scholar] [CrossRef]
  63. Randolph, B. Delivering the compact city in Australia: Current trends and future implications. Urban Policy Res. 2006, 24, 473–490. [Google Scholar] [CrossRef]
  64. Weitz, J. Smart growth in a changing world. J. Am. Plan. Assoc. 2008, 74, 142–143. [Google Scholar] [CrossRef]
  65. Shi, B.; Yang, J. Scale, distribution, and pattern of mixed land use in central districts: A case study of Nanjing, China. Habitat Int. 2015, 46, 166–177. [Google Scholar] [CrossRef]
  66. Wesolowski, A.; Eagle, N. The impact of biases in mobile phone ownership on estimates of human mobility. J. R. Soc. Interface 2013, 10, 20120986. [Google Scholar] [CrossRef] [PubMed]
  67. Wesolowski, A.; Eagle, N.; Noor, A.M.; Snow, R.W.; Buckee, C.O. Heterogeneous mobile phone ownership and usage patterns in Kenya. PLoS ONE 2012, 7, e35319. [Google Scholar] [CrossRef] [PubMed]

Article Metrics

Citations

Article Access Statistics

Multiple requests from the same IP address are counted as one view.