Abstract
Since populations in the developing world have been rapidly increasing, accurately determining the population distribution is becoming more critical for many countries. One of the most widely used population density estimation methods is dasymetric mapping. This can be defined as a precise method for areal interpolation between different spatial units. In most applications of dasymetric mapping, land use and land cover data have been considered as ancillary data for the areal disaggregation process. This research presents an alternative dasymetric approach using area specific ancillary data for hilly area population mapping in a GIS environment. Specifically, we propose a Hilly Area Dasymetric Mapping (HDM) technique by combining topographic variables and land use to better disaggregate hilly area population distribution at fine-grain division of ancillary units. Empirical results for Sri Lanka’s highest mountain range show that the combined dasymetric approach estimates hilly area population most accurately because of the significant association that is found to exist between topographic variables and population distribution within this setting. This research is expected to have significant implications for national and regional planning by providing useful information about actual population distributions in environmentally hazardous and sparsely populated areas.
1. Introduction
Accurate mapping of population distribution has become very important in a variety of applications, such as urban and regional planning, disaster management, resources and facility allocation, risk-assessment, and socioeconomic development policy [1,2,3,4,5,6,7,8,9,10,11,12]. This is particularly true for developing countries with a rapid population growth and inaccurate or unavailable census data. Sri Lanka is one of the South Asian countries that are experiencing explosive population growth, with unbalanced geographic concentrations in several specific cities. More reliable estimation of population distribution is therefore continuously needed in Sri Lanka for national land planning [13,14]. With the rapid expansion of population, the ‘land-human ratio’ of Sri Lanka has declined and the number of people living in environmentally risky and unstable areas, such as areas with the potential for landslides and mass erosion, has been increasing. One of the main reasons for this sprawling may be unplanned and very fast urbanization elsewhere in the country. Many negative impacts of rapid urbanization in Sri Lanka have been observed and studied, for example, land use-cover changes [15], rapid removal of vegetation cover, rapid increment of land surface temperature and formation of urban heat islands [16,17,18,19], degradation of residential conditions, and environmental pollution [20,21]. Due to these rapid nationwide changes, people seek alternative areas for housing, even in environmentally sensitive areas. Specifically, hilly areas that comprise a large portion of Sri Lanka land, have gradually become occupied by residents. However, the population of these hilly areas has never been systematically investigated. Investigation of the population distribution of such unsafe but obviously populated areas is an important task for federal government and local authorities for national land planning and taxation. On the other hand, from the perspective of management for national forest preservation, it would also be important to look over ongoing deforesting and land development for planting and housing in mountainous areas of Sri Lanka.
This paper focuses on examining the population distribution of hilly areas in Sri Lanka using a scientific estimation method. To achieve this, we propose an alternative dasymetric mapping approach, which has been one of the most widely used population estimation methods for several decades. Dasymetric mapping is a method of representing more realistic distribution of population by depicting finer density than aggregated statistical units (e.g., census unit) [22], thus is conceived as a way of areal interpolation, which is a transformation of attribute data between enumeration units with different spatial resolution [23]. In most applications of population estimation based on dasymetric mapping, land use and land cover data have been considered as ancillary data for the areal disaggregation process. However, this research combines new ancillary sources such as slope angle and altitude of land, which are highly relevant to a hilly areas population for classical land use and land cover dasymetric mapping. Our approach of estimating hilly areas population is expected to also be significant in the application contexts of many developing countries where the number of people living in such hilly areas is continuously increasing. It is also significant because these applications are not found in the case of Sri Lanka’s highest mountain range. Also, this research may have a significant implication in terms of regional planning, nature preservation practices, settlement management, and emergency management by providing useful information about actual population distributions in environmentally risky areas.
This paper is structured as follows. First, the population estimation and mapping methods are critically reviewed. The study then shows the empirical application of hilly areas dasymetric mapping, utilizing all ancillary data, including slope angle, altitude, and land use/cover. The resulting outcomes are discussed by comparing other results with different datasets for the estimation. Finally, summary and conclusions are provided.
2. Population Estimation and Mapping
For population mapping, census enumeration units and relevant population data for areas of interest are usually needed. These data are varied among regional geographical entities, particularly between countries. In general, population statistics are hierarchically structured as spatial units with different resolutions; such statistical systems significantly differ among countries [23]. This variability regarding population mapping can also be acknowledged in the existing body of literature. A number of studies have been introduced for population estimation and mapping in different geographic levels using various data sources such as remote sensing imagery and road network, as well as GIS derived data [3,5,24,25,26,27,28,29,30,31,32]. Meanwhile, it is noted that many studies have deployed a dasymetric approach as one of main techniques for estimating population distribution. A dasymetric map provides much finer details of population distribution than a traditional choropleth map using areas with known population information [23]. Also, a dasymetric map depicts areal data with relatively homogeneous boundaries showing underlying statistical surface [33]. Thus, the main advantage of a dasymetric mapping technique is that it estimates population characteristics of small areas that do not correspond to census enumeration boundaries [34]. To disaggregate the existing census units into fine-grain homogeneity statistical units in a meaningful way, all dasymetric methods have employed ancillary data as additional information in the disaggregation process. Although this information can vary in terms of data availability and cartographer’s knowledge of the area [33], from a seminal work of Wright [22], a large number of studies have utilized land use and land cover as basic ancillary data. Nevertheless, it is obvious that the availability of relevant ancillary data is essential for enhancing the accuracy of population maps [35]. The use of most appropriate ancillary data for particular areas with certain geographic characteristics is crucial for the accurate estimation of population by dasymetric approaches.
In this context, there have been many other approaches that have employed alternative ancillary data sources other than conventional land use and cover data (e.g., imperviousness of roads, road network density, and nighttime lights by Zandbergen and Ignizio [36]; addresses, points, and parcel locations by Zandbergen [34]; lobster traps and PGIS by Brehme et al. [37]). Examining unexplored ancillary data is obviously important for more accurate dasymetric estimation [36] because it might provide more significant information about true population distribution than that derived from land use/cover data alone. Unexplored ancillary data can also show the variation of population distribution in terms of different geographic settings, such as coastal areas or hilly areas. In this sense, this study proposes an alternative dasymetric mapping method named a Hilly area Dasymetric Mapping (HDM) using a combined ancillary dataset for hilly areas population mapping. Specifically, we utilize topographic information as area-specific ancillary data, including the slope angle and altitude of the land, which are relevant to hilly areas populations, as well as traditional land use/cover data. This approach makes sense because the correlation between land use and population density in hilly areas may be less pronounced, while slope angle and altitude are recognized as potentially influential factors for habitation density [38]. Also, this study adds to the existing body of literature by examining the case for the use of topographic variables in population estimation in hilly terrain. In fact, slope angle and/or altitude have only been addressed in a few studies [1,26,31,38,39,40]. Furthermore, to the best of our knowledge, no studies have been carried out that deal with slope angle, altitude, and land use/cover together. Moreover, there is a lack of research addressing dasymetric applications in rural and mountainous areas as well as in developing countries.
3. Empirical Application for Hilly Area Dasymetric Mapping
3.1. Study Area
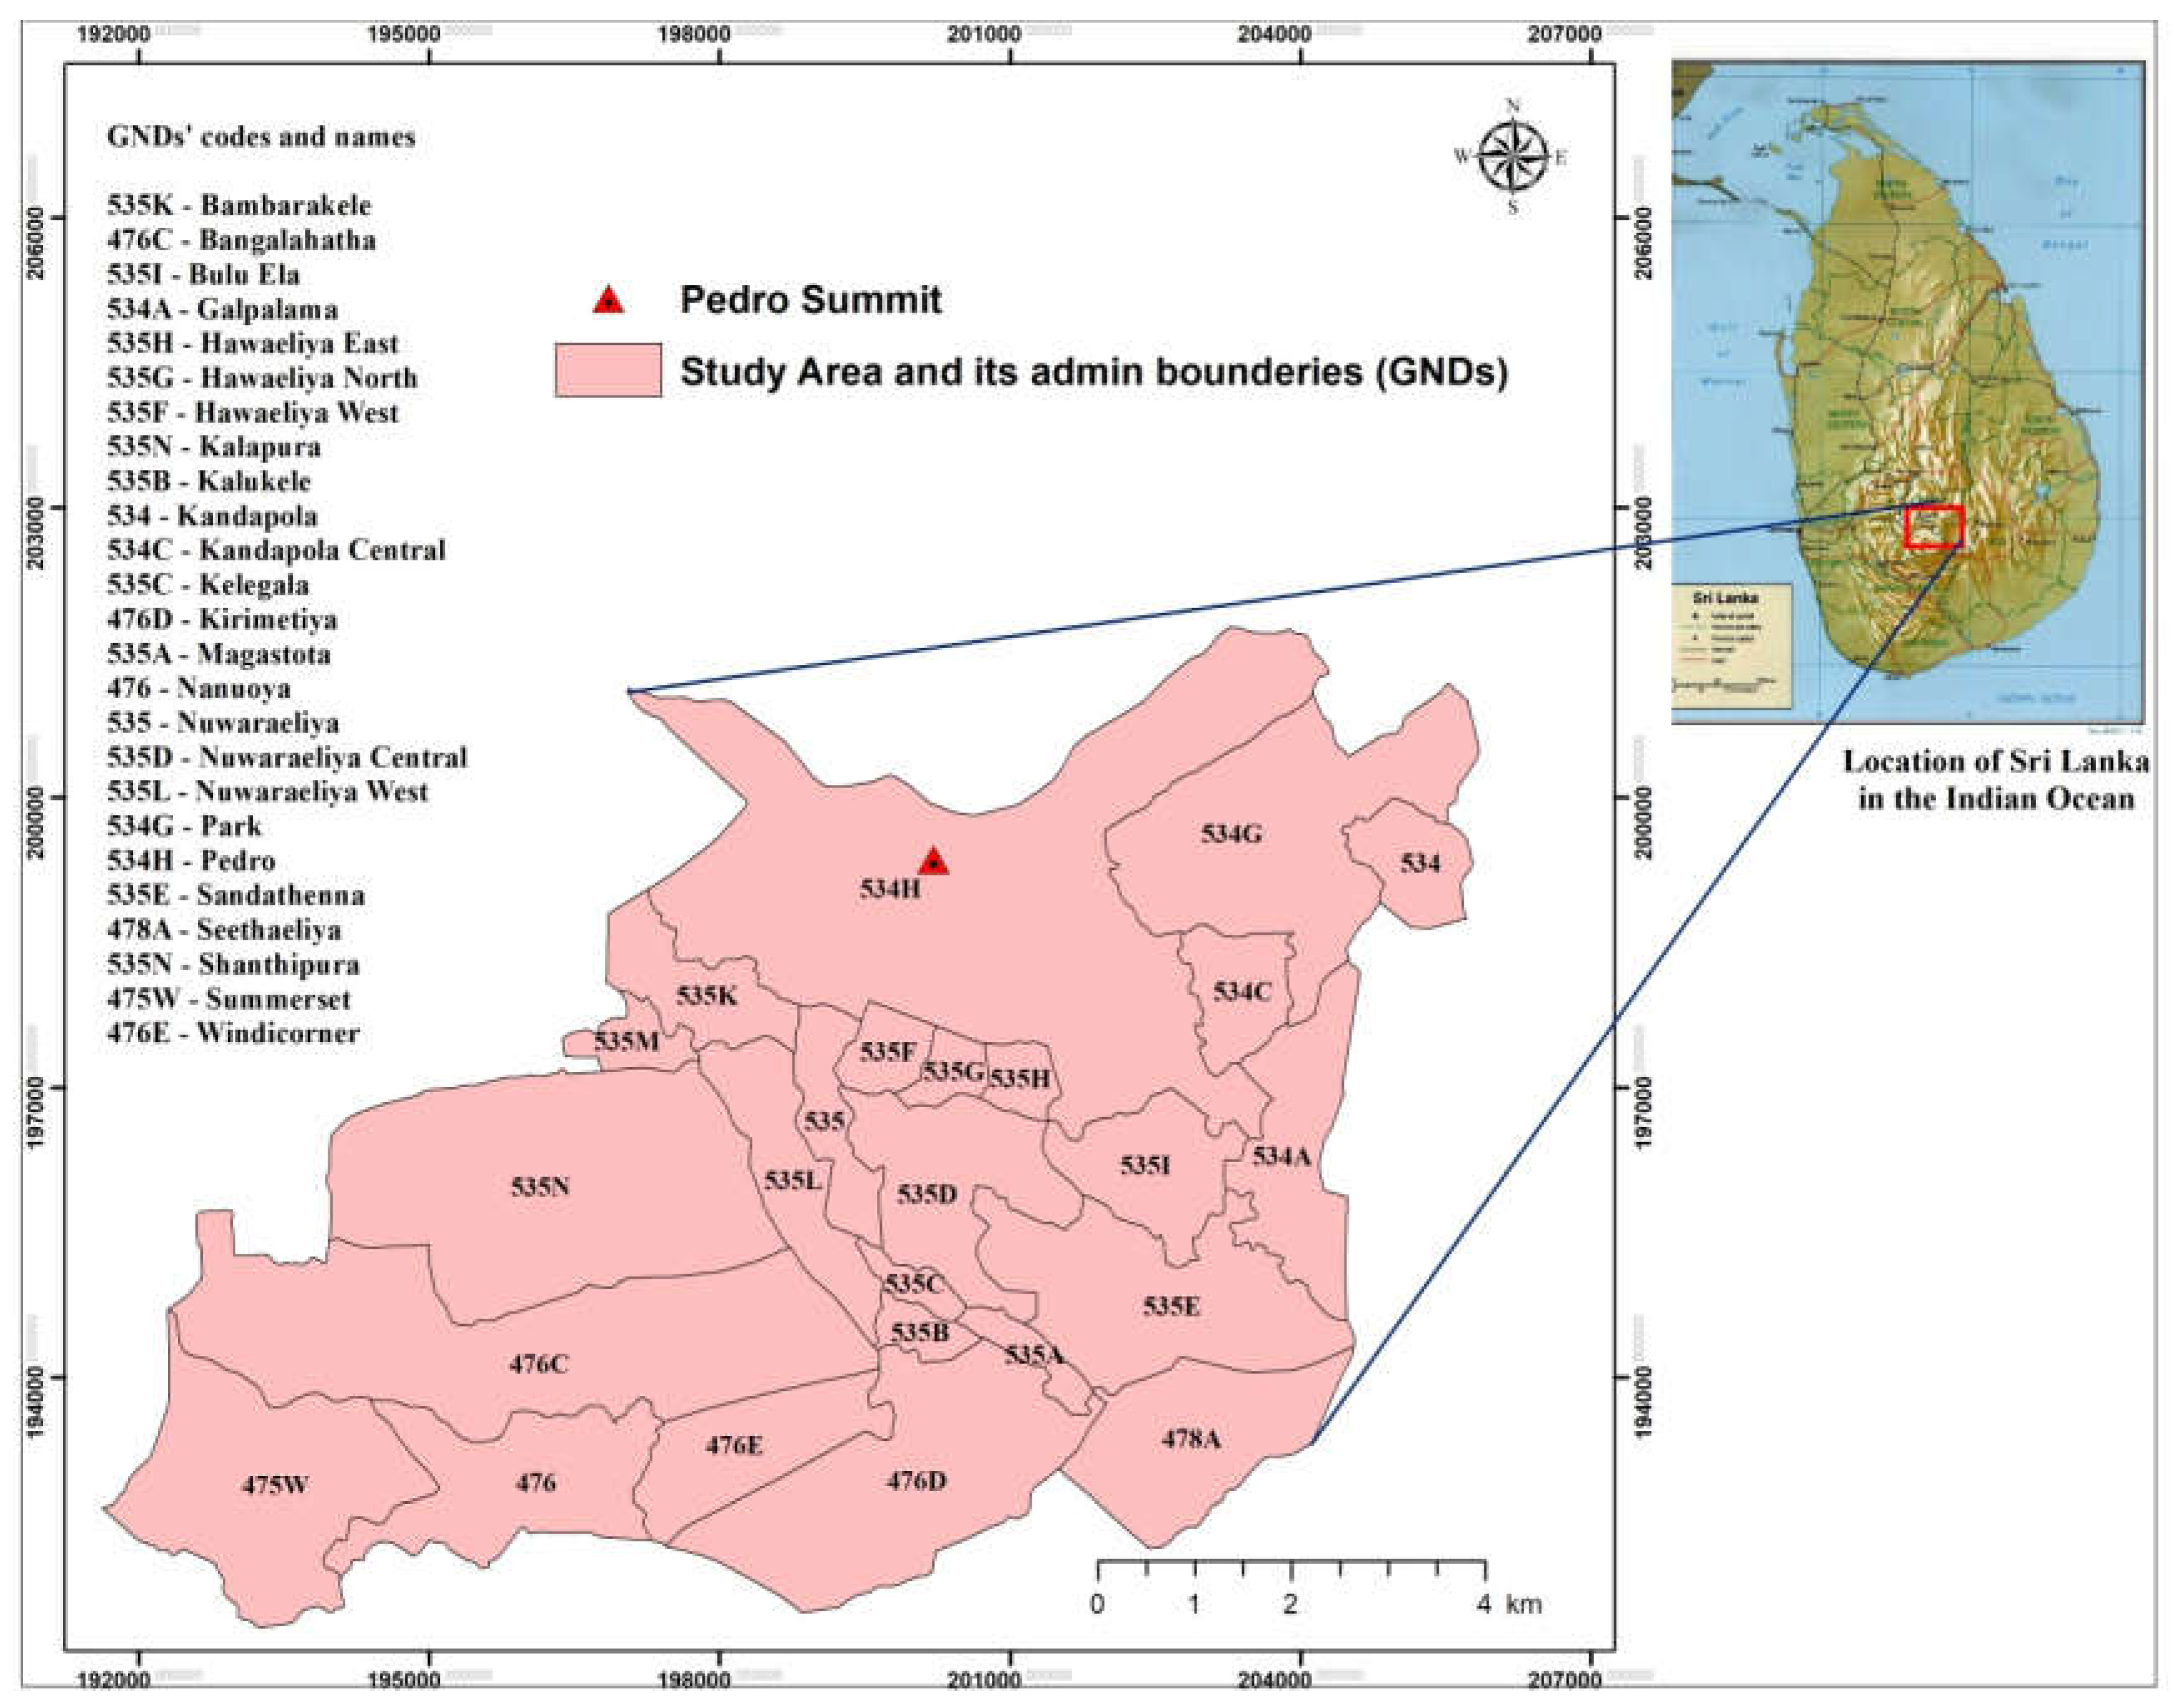
The study area of this research is the upper mountain range of Nuwara Eliya District Secretariat Division (DSD), which is within the highest mountain area of Sri Lanka that ranges from 1300 m to 3001 m in altitude (according to the DEM). Also, this area covers twenty-five Grama Niladari Divisions (GNDs) in the Nuwara Eliya DSD, which is a unit at the bottom level of the administration hierarchy in Sri Lanka. This is the entire area that we will estimate more detailed population by disaggregating sub area population (GNDs). One of the GNDs is Piduruthalagala, which is located on Mount Pedro, the tallest summit (at 2524 m or 8281 ft) in Sri Lanka (Figure 1). The study area comprises a highly rough terrain profile consisting of diverse sloped patterns. The main cultivation practice of the selected areas is tea, while scrub and forest land use categories are dominant.
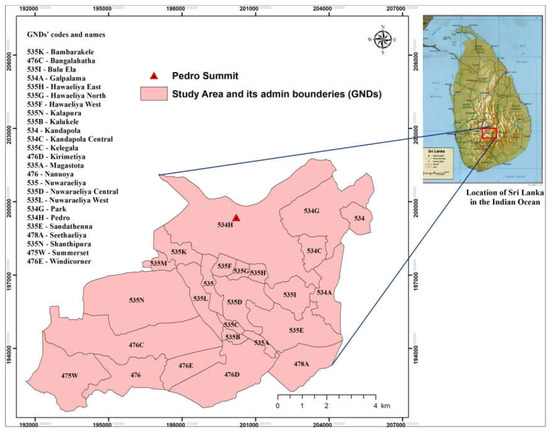
Figure 1.
Upper part of Nuwara Eliya DSD and administrative divisions.
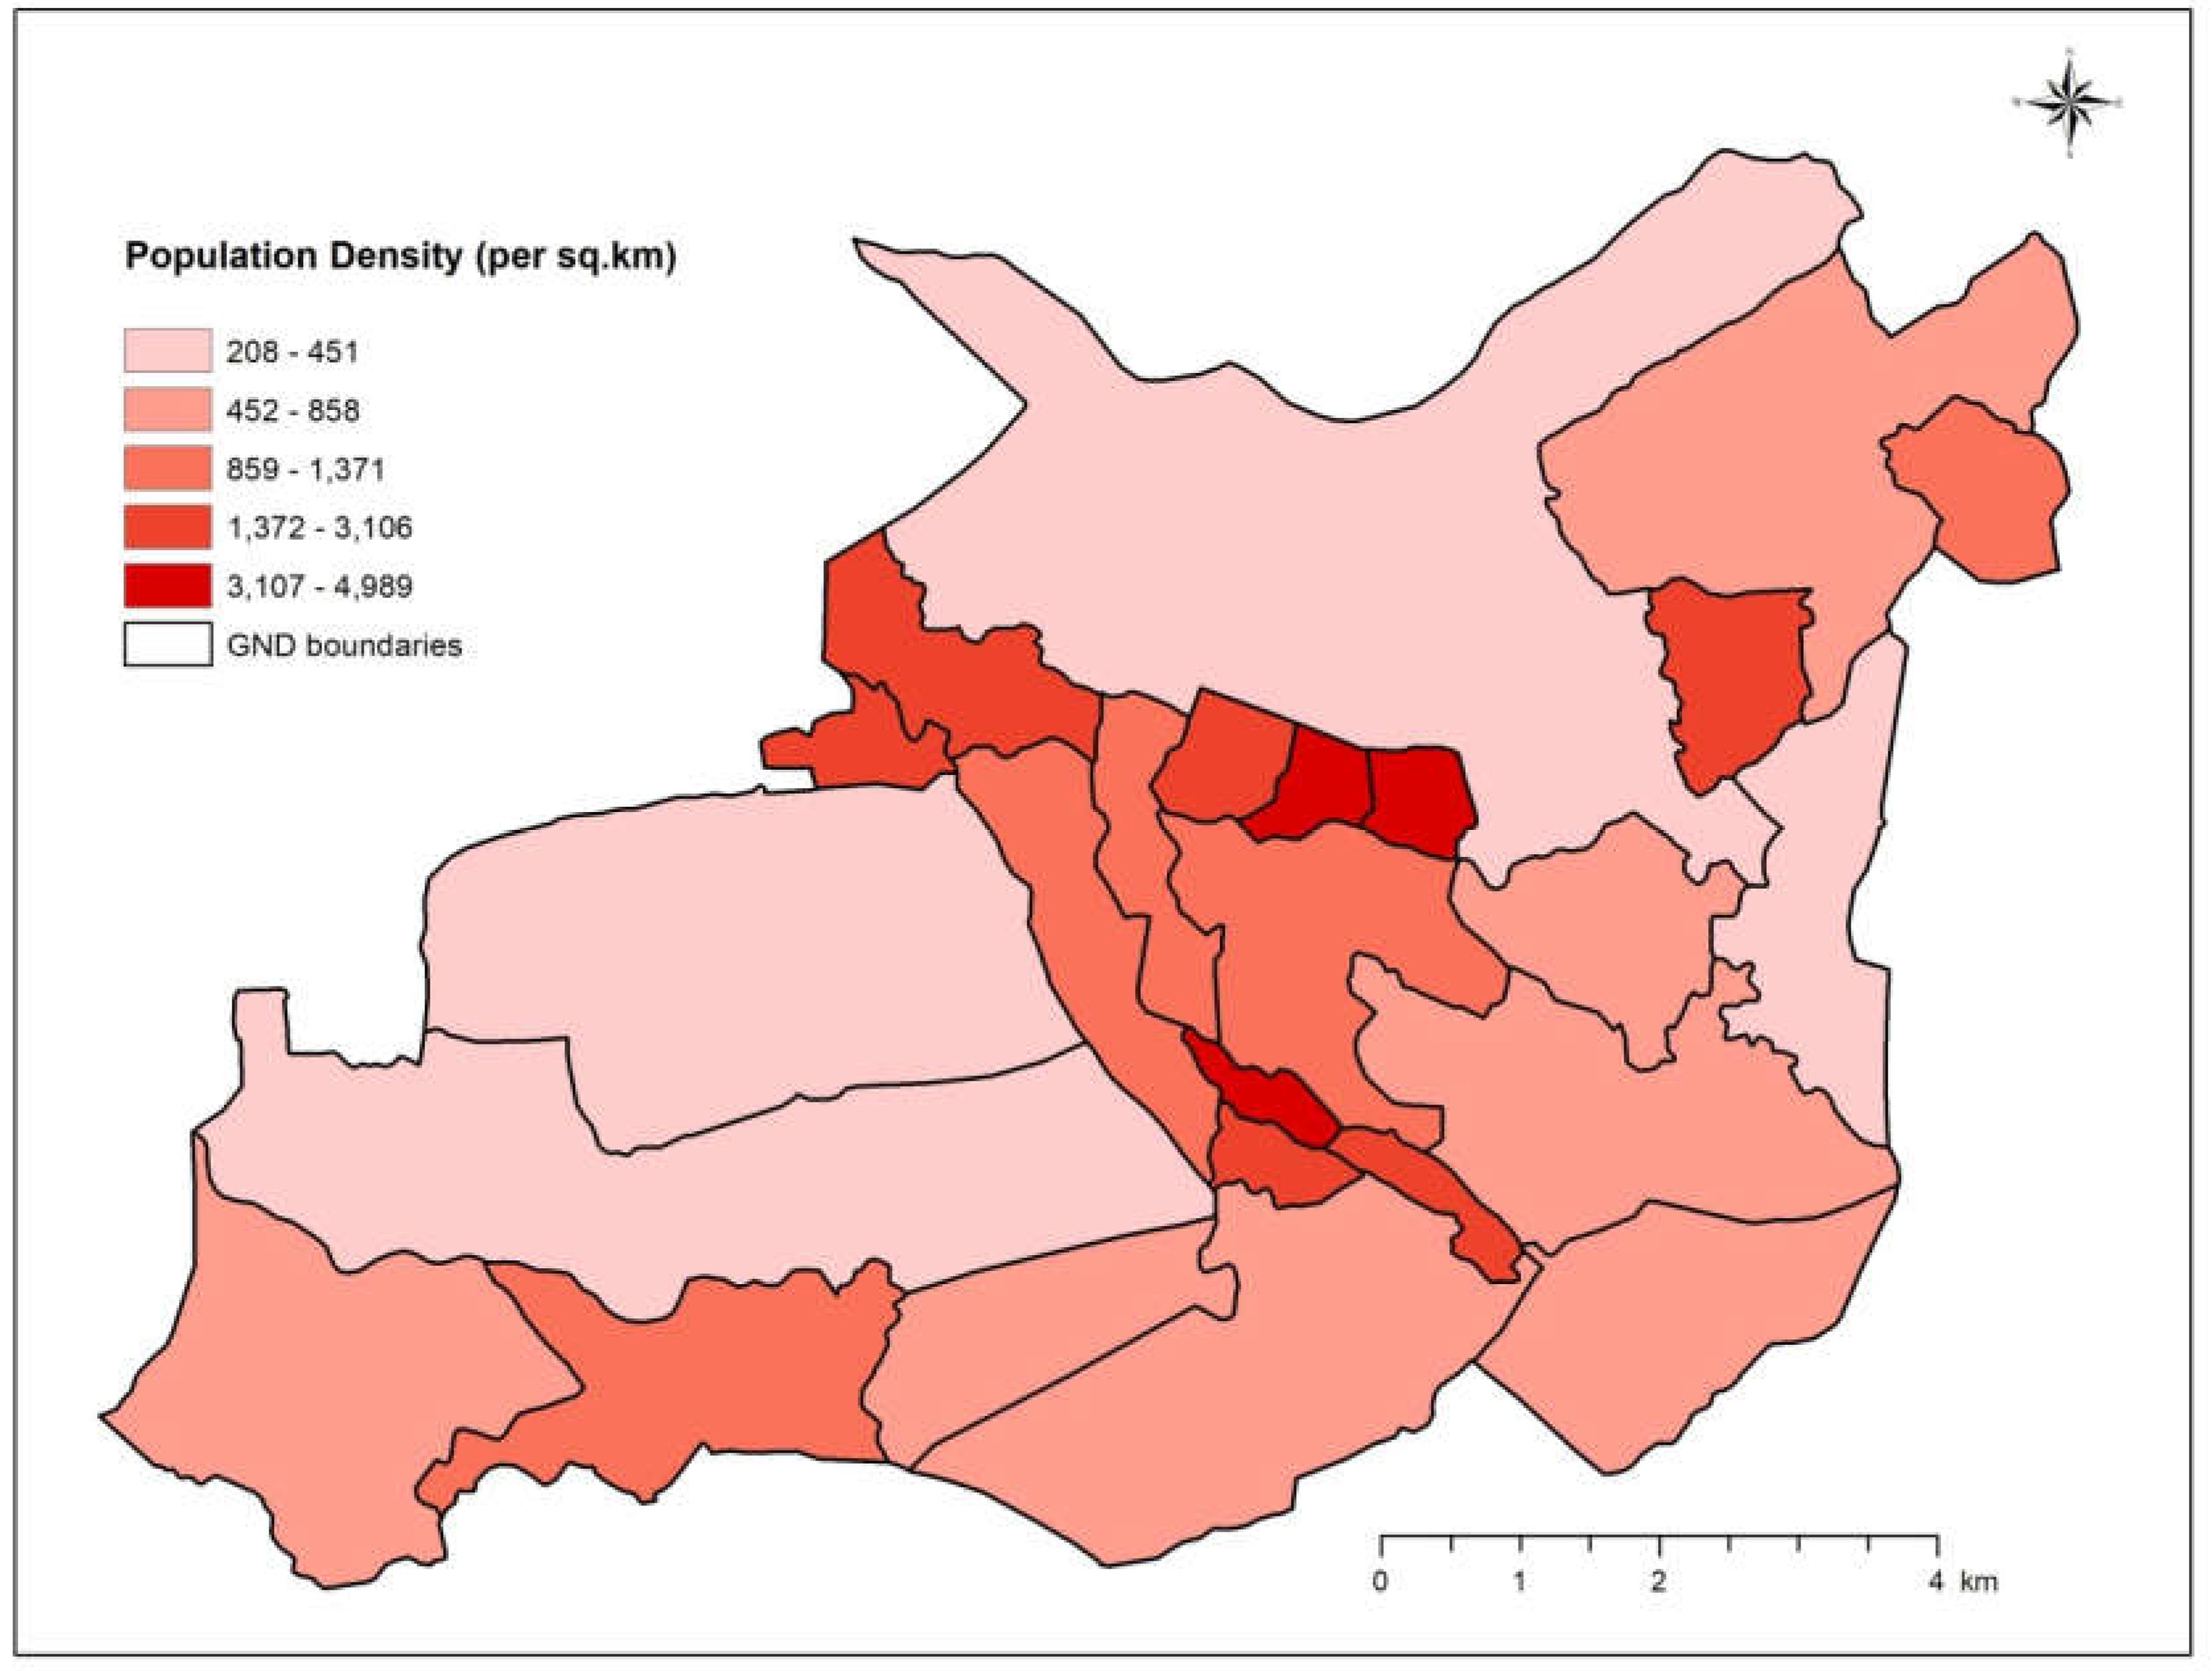
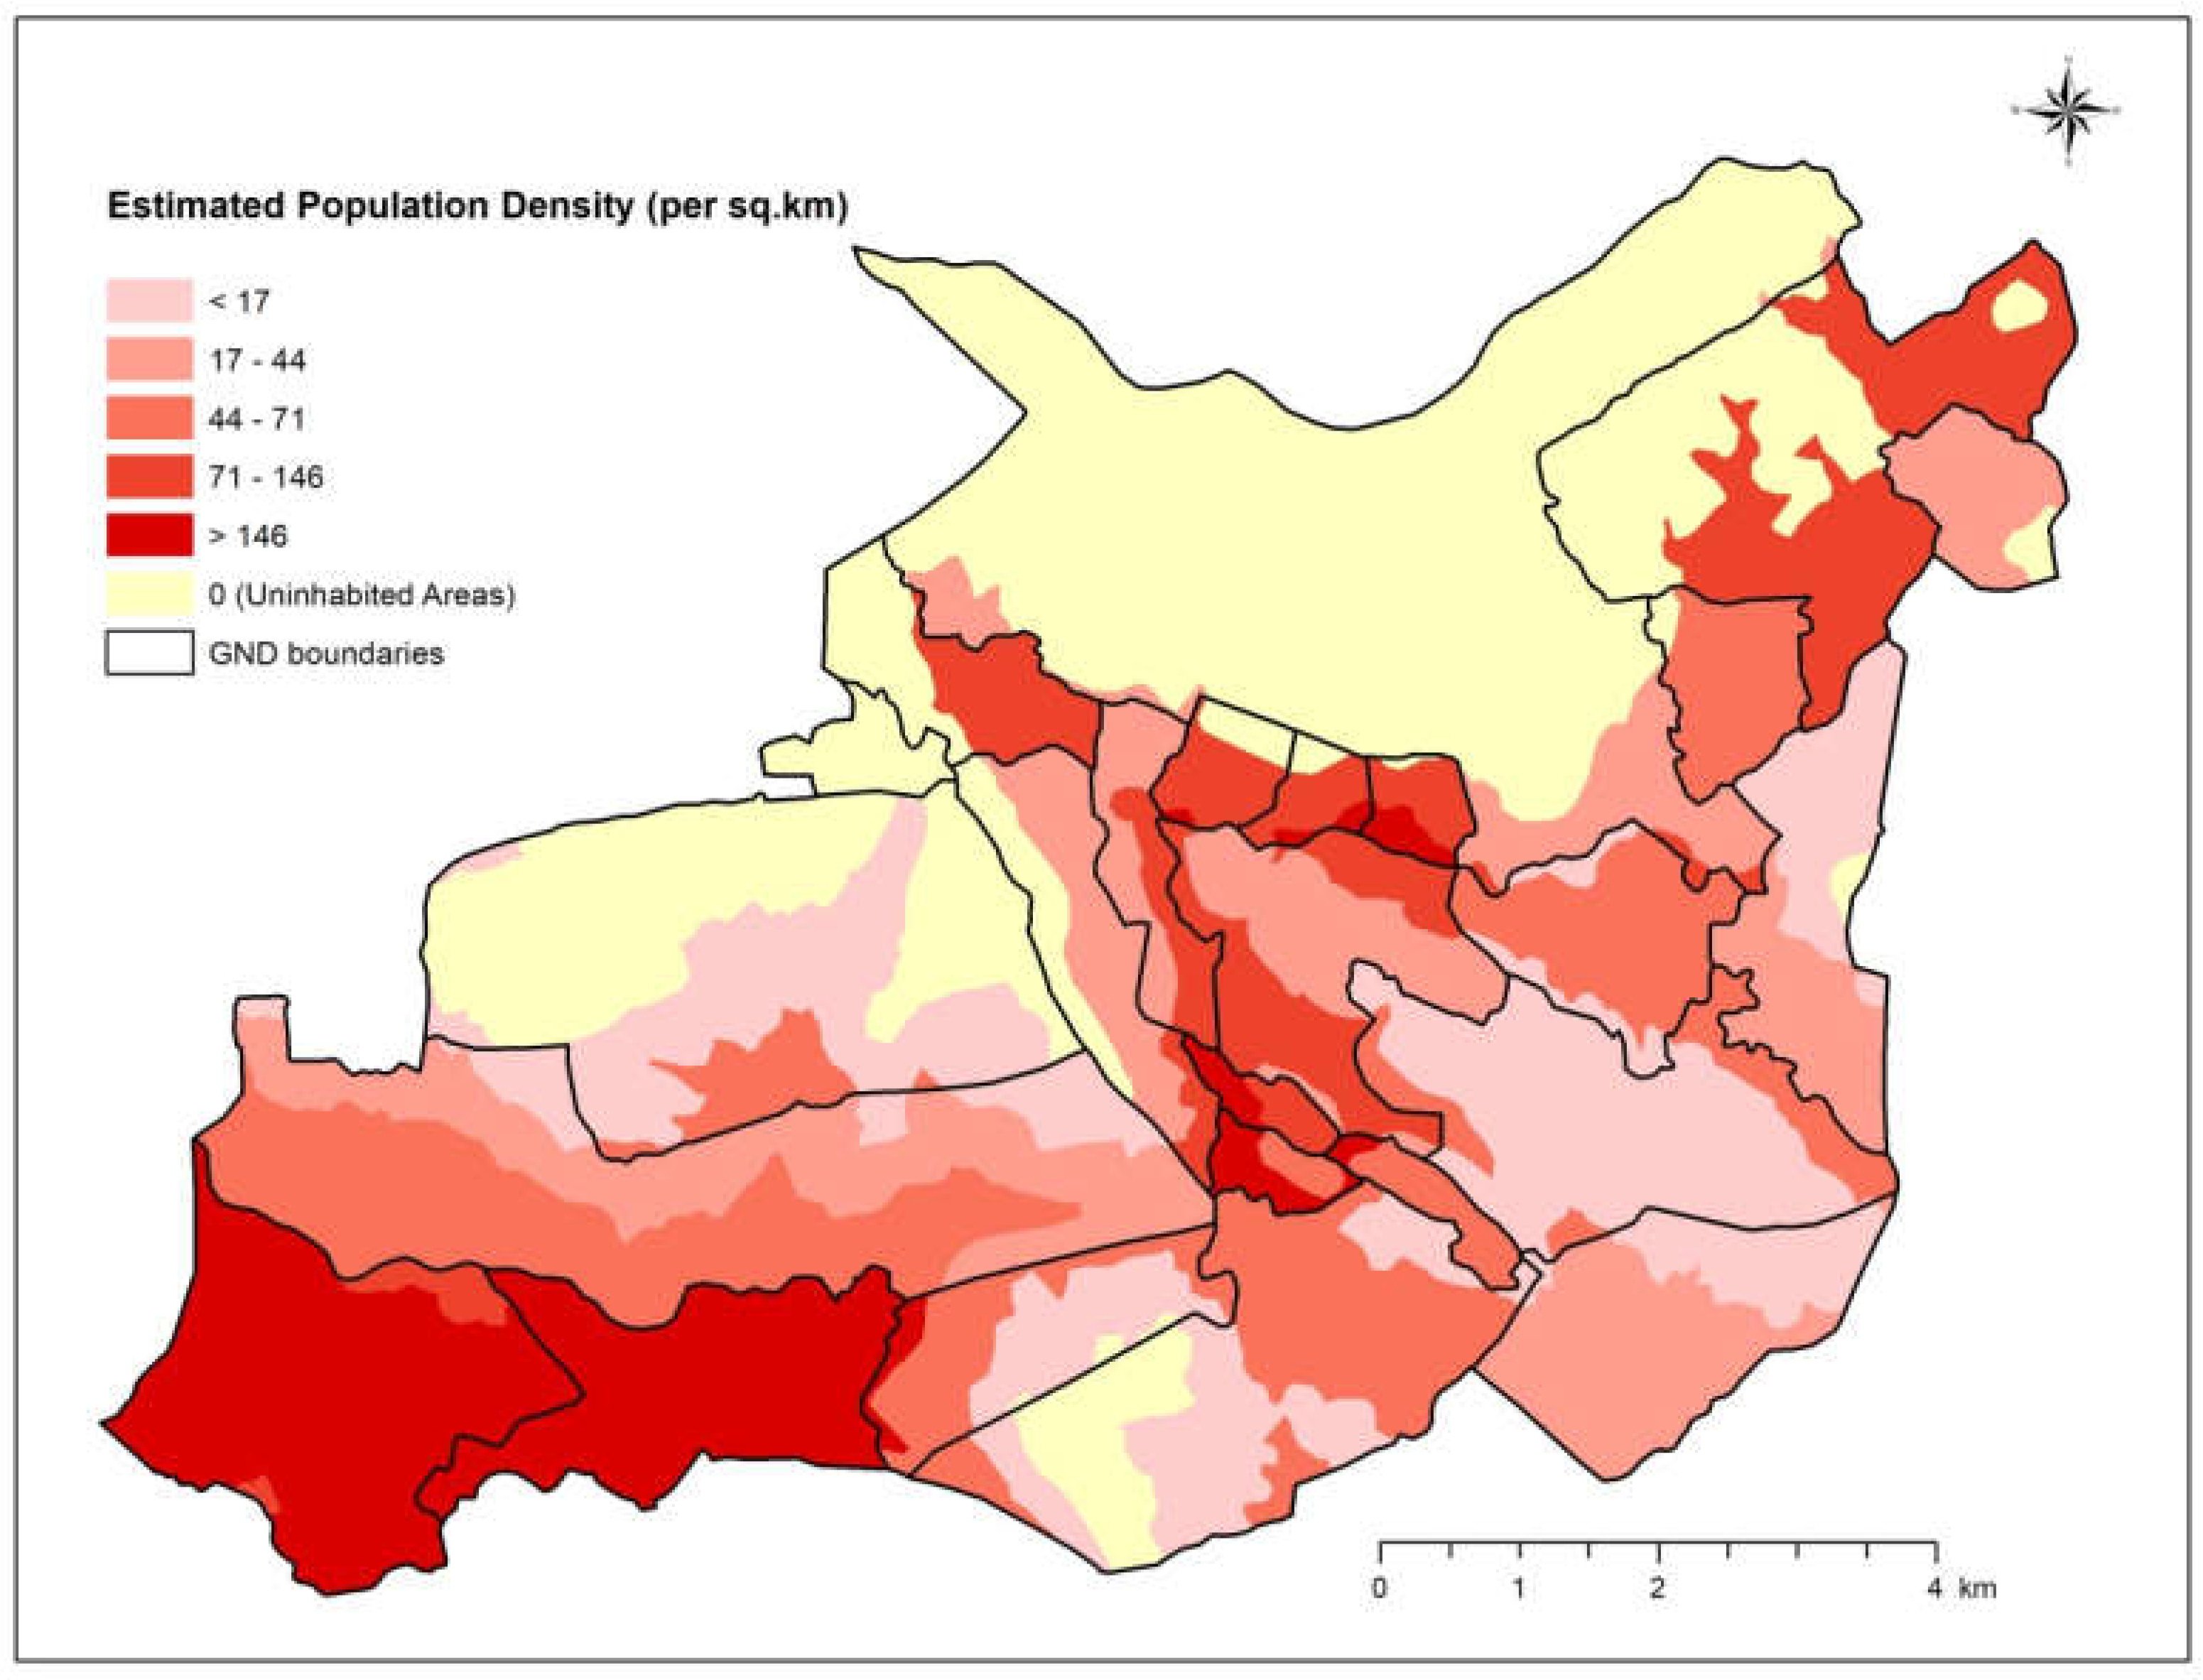
The total population of the study area is 62,981 and the minimum and maximum populations are 1093 and 4463 in the Kalukele (535B) and Park (534G) GNDs, respectively [7]. The significant aspect of this area is that a large portion of the population lives on very steep slopes and in very rugged topological structures and landforms. For example, 3316 people live within the Pedro GND, which is located at the highest topographical region of Sri Lanka. Other GNDs nearby the Pedro GND represent similar situations (Figure 2).

Figure 2.
Population density of the study area.
3.2. Hilly Area Population Estimation
In this section, the Hilly area Dasymetric Mapping method (HDM) is discussed for more accurate estimation of population distribution in hilly areas. In particular, this study utilizes the regional characteristics of highly mountainous areas, such as height, slope, and land use as well as land cover ancillary data for fine grain population distribution mapping. Visual observation of Figure 2, Figure 3 and Figure 4 indicate that the population and topographic characteristics of the study area appear to be spatially correlated. Hence, using slope angle and altitude data may be appropriate for accurate population estimation in hilly mountainous areas, while also utilizing conventional land use data. A hilly area dasymetric process is conducted in the multi-layer, multi-class dasymetric framework introduced by Su et al. [41], which disaggregates the aggregated population data with several relevant information for detailed true population density; for example, land cover, land value, and traffic networks. Each variable or layer related to true population distribution has a number of classes of different population densities and weighting factors based on relative population density are assigned to each class. Accordingly, the first step of hilly area dasymetric process is to classify an ancillary variable and then weight factors for population density are assigned to each class. Total population is then redistributed to each weighted class based on a simple areal weighting method. This process is repeated to combine other ancillary variables using the same areal weighting method to reveal detailed spatial patterns of population distribution.
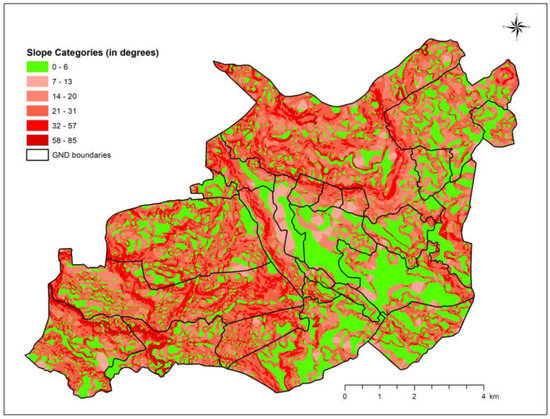
Figure 3.
Slope distribution of the study area.
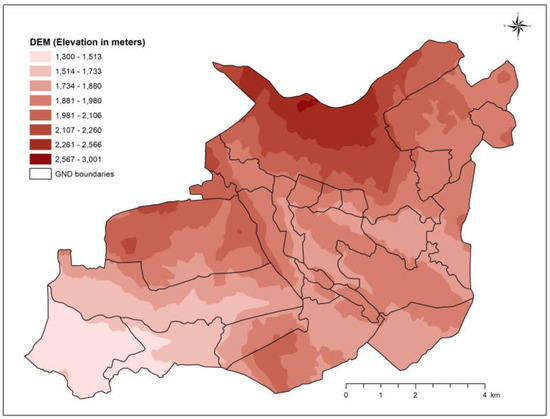
Figure 4.
Elevation distribution of the study area.
For the preparation of topographic ancillary data, this study considers the contours surface at a scale of 1:50,000 [42], as a base source to derive both slope angle (Figure 3) and altitude classes using a Digital Elevation Model (DEM) (Figure 4). The spatial resolution of raster DEM is 25 m and the vertical resolution of input data is 20 m contour interval. In the process of generating DEM in a GIS environment, which is based upon a contour layer, elevation values of all considered points (derived from contour heights) are interpolated to produce a continuous raster. In addition, land use data (2010) are obtained from the Department of Surveying of Sri Lanka [43] at a scale of 1:50,000 (Figure 5).
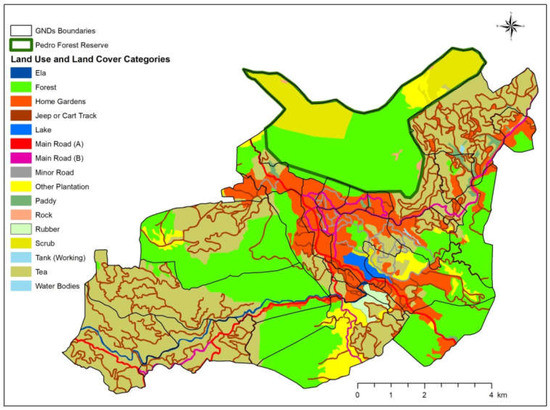
Figure 5.
Land use/cover of the study area.
No unilateral solution exits for data classification method, or the number of classes. So, in this paper we reviewed the data distribution first and then determined the classification method and the number of classes. Each ancillary data is classified based on Jenks algorithm [44] because we wish to utilize the classes representing data distribution very well. Jenks classification is useful to represent data distribution with natural groups inherent in the data by minimizing the variance within classes and maximizing the between-class variance. Then, various weight factors for the population disaggregation are assigned to each of the ancillary data classes, similar to the classical dasymetric methods [22,33]. However, this study simulates several weighing schemes for each ancillary variable and calculates the performances of the schemes using Root Mean Square Error (RMSE) and Mean Absolute Error (MAE), in order to avoid subjective choices of weights for classes and to identify the best performing scheme for hilly area population estimation. In addition, this paper considers some significant findings from the previous works for appropriate weight factors of classes. Lin et al. [26] revealed empirically the influences of topographic and climate variables on population distribution in East and Southeast Asia. According to their results, population density tends to increase with lower values of topographic altitude and slope, but a terrain with the steepest slopes and highest elevations are usually unsuitable for living because of poor land stability and difficulties in transportation. Therefore, zero or a much lower value of weight might be assigned to the steep and high elevated classes.
As mentioned previously, measures of both RMSE and MAE are utilized for quantifying errors from the models; RMSE and MAE have been widely utilized in many applications of population estimation, e.g., [27,28,45,46,47,48]. The RMSE and MAE of the model are calculated according to the following general equations:
where RMSE is the error of source zone, yi depicts the actual population of GNDs, represents the estimated population of GNDs, and n refers to the number of observation units (GNDs) considered.
Table 1 shows the predefined categories of each ancillary variable and the performances of estimation with different weight schemes. For the slope angle classes, the lowest group range is 0–6, while the steepest group range is 58–85. The first two groups (0–6 and 7–13) are considered to be areas where the population is likely to be highly scattered. Actually, the total area of these two categories is 28.83 km2 (i.e., 34.31% of study area). Weight factors of 80% and 15% are assigned to these two slope angle categories from the simulation results in Table 1. From a preliminary observation, it is easy to understand the close association between slope angle categories and population density distribution. For the third category (14–20), 5% is assigned. The other three slope angle classes are considered as ‘uninhabited’ due to their significant steepness, relatively similar to the classes in Lin et al. [26]. A similar approach is used to allocate the weights for the altitude categories based on performance results. Weights of 75%, 17%, 5%, and 3% are assigned to elevation classes from ‘1300–1513’ to ‘1881–1980’. Also, the elevation classes such as ‘1981–2106’, ‘2107–2260’, ‘2261–2566’, and ‘2567–3001’ are considered to be uninhabited areas, which concur with the results by Lin et al. [19]. In fact, zero population assignment for both slope angle and altitude classes belongs to the upper quartile (above 75% when the data is in order). Wright [22] and Eicher and Brewer [33] applied a similar process to land use categories that are usually based on previous classical works for population mapping with land use data. Moreover, unique land use and cover in the hilly areas of Sri Lanka should be considered as home gardens and tea or rubber plantations. Weights of 80%, 15%, 4%, and 1% are assigned for the land-use categories of ‘Home Gardens’, ‘Other Plantation’, ‘Tea’, and ‘Rubber’, respectively. This categorization reflects the suitability of home gardens and other plantations for residential environments. These land-use categories are therefore dominant in the landscape for highly populated hilly areas. Meanwhile, forest, paddy lands, all water body categories, rocky land, and all road categories are obviously considered as uninhabited areas. Based on the weights for each of the above variables, individual dasymetric maps derived from slope angle, altitude, and land use/cover layer are generated.

Table 1.
Performance in terms of different weighting schemes for ancillary classes.
As a final step of hilly areas dasymetric mapping, all of the individual dasymetric maps are overlaid within the multi-layer multi-class dasymetric framework [41] for better disaggregation of the aggregated population data and to determine the true population distribution patterns according to several parameters (in this study, land use/cover, slope angle, and altitude) correlated with population density. Here, a slope-based dasymetric map is considered as the base layer (as it reports less error), while land use/cover and altitude based dasymetric maps are used as second and third layers, respectively, for the further disaggregation phase of the population density of slope angle classes. For example, if a polygon with an 80% weighted slope angle (0–6) is located inside a water body, that polygon slope angle is considered to represent an uninhabited area. The same procedure is applied for all disaggregation processes to generate the final result of hilly areas population using dasymetric mapping based on combined variables.
Dasymetric mapping operates by employing weights that capture both the relative areas of the target spatial units and the relative population densities of the different nominal ancillary classes. In this study, the areal weighting disaggregation formulation [41,49,50,51] is applied for the population density calculations in a GIS environment as follows:
where EPDij ensures the estimated population density of the target zones, Pi is the total population of area unit i, Aij represents the total area of subclass j in unit i, n represents the number of subclasses, and Wj denotes the weight for subclass j. It is noted that the calibration of the Wj parameters becomes a major problem in the application of general multi-class dasymetric models [41].
4. Results for Hilly Area Dasymetric Mapping
Figure 6 presents the resultant map of the study according to slope. In this figure, areas where the population density is equal to zero represent the areas where people have been incorrectly placed. Table 2 shows the results of the study with various ancillary data. The number of people incorrectly placed is based on the sum of the absolute values of the difference between estimated and known population counts for the target area [36].
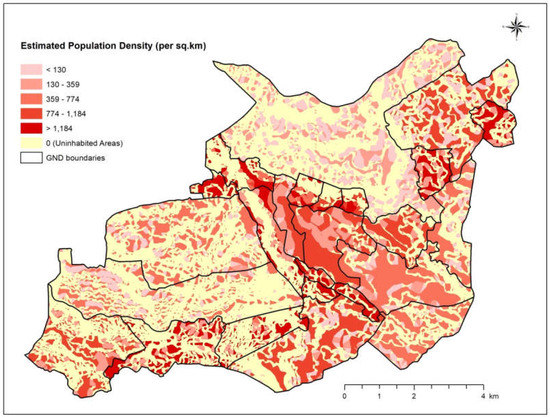
Figure 6.
Population estimation using the slope angle-based dasymetric mapping.
Table 2.
Results of the HDM with various ancillary data.
Proportionally, areas where the number of incorrectly placed people is small are considered to be well disaggregated regional GNDs (census enumeration units) and vice versa. The distribution of the estimated population density represents a strongly negative association with the layers’ slope angles categories and altitude, as revealed through a visual inspection. In contrast, high density areas are significantly correlated with the distribution of the areas of low slopes categories, particularly the group of 0–6. Also, this study assists in disaggregating the GND census enumeration units into very fine-grain levels by showing the exact population density distribution at a considerably accurate level (Table 2). The areas of the west, north, northeast, and southeast represent a relatively higher altitude than other areas of the region. Hence, these areas are estimated as having the lowest density of population distribution. However, several small areas located near the top of the mountains (e.g., Pedro) represent a high population density (e.g., 243–596 per km2) due to the presence of low slope angle categories. The actual number of people living in the Pedro GND is 3316, which is a relatively large number. The population estimations according to the ancillary data of land use (Figure 7) and altitude (Figure 8) appear to show relatively different outcomes. It is difficult to identify a rigorous association between land use categories (except ‘Home Gardens’ and ‘Other Plantation’) and inhabited areas in hilly areas.

Figure 7.
Population estimation using the land use-based dasymetric mapping.

Figure 8.
Population estimation using the altitude-based dasymetric mapping.
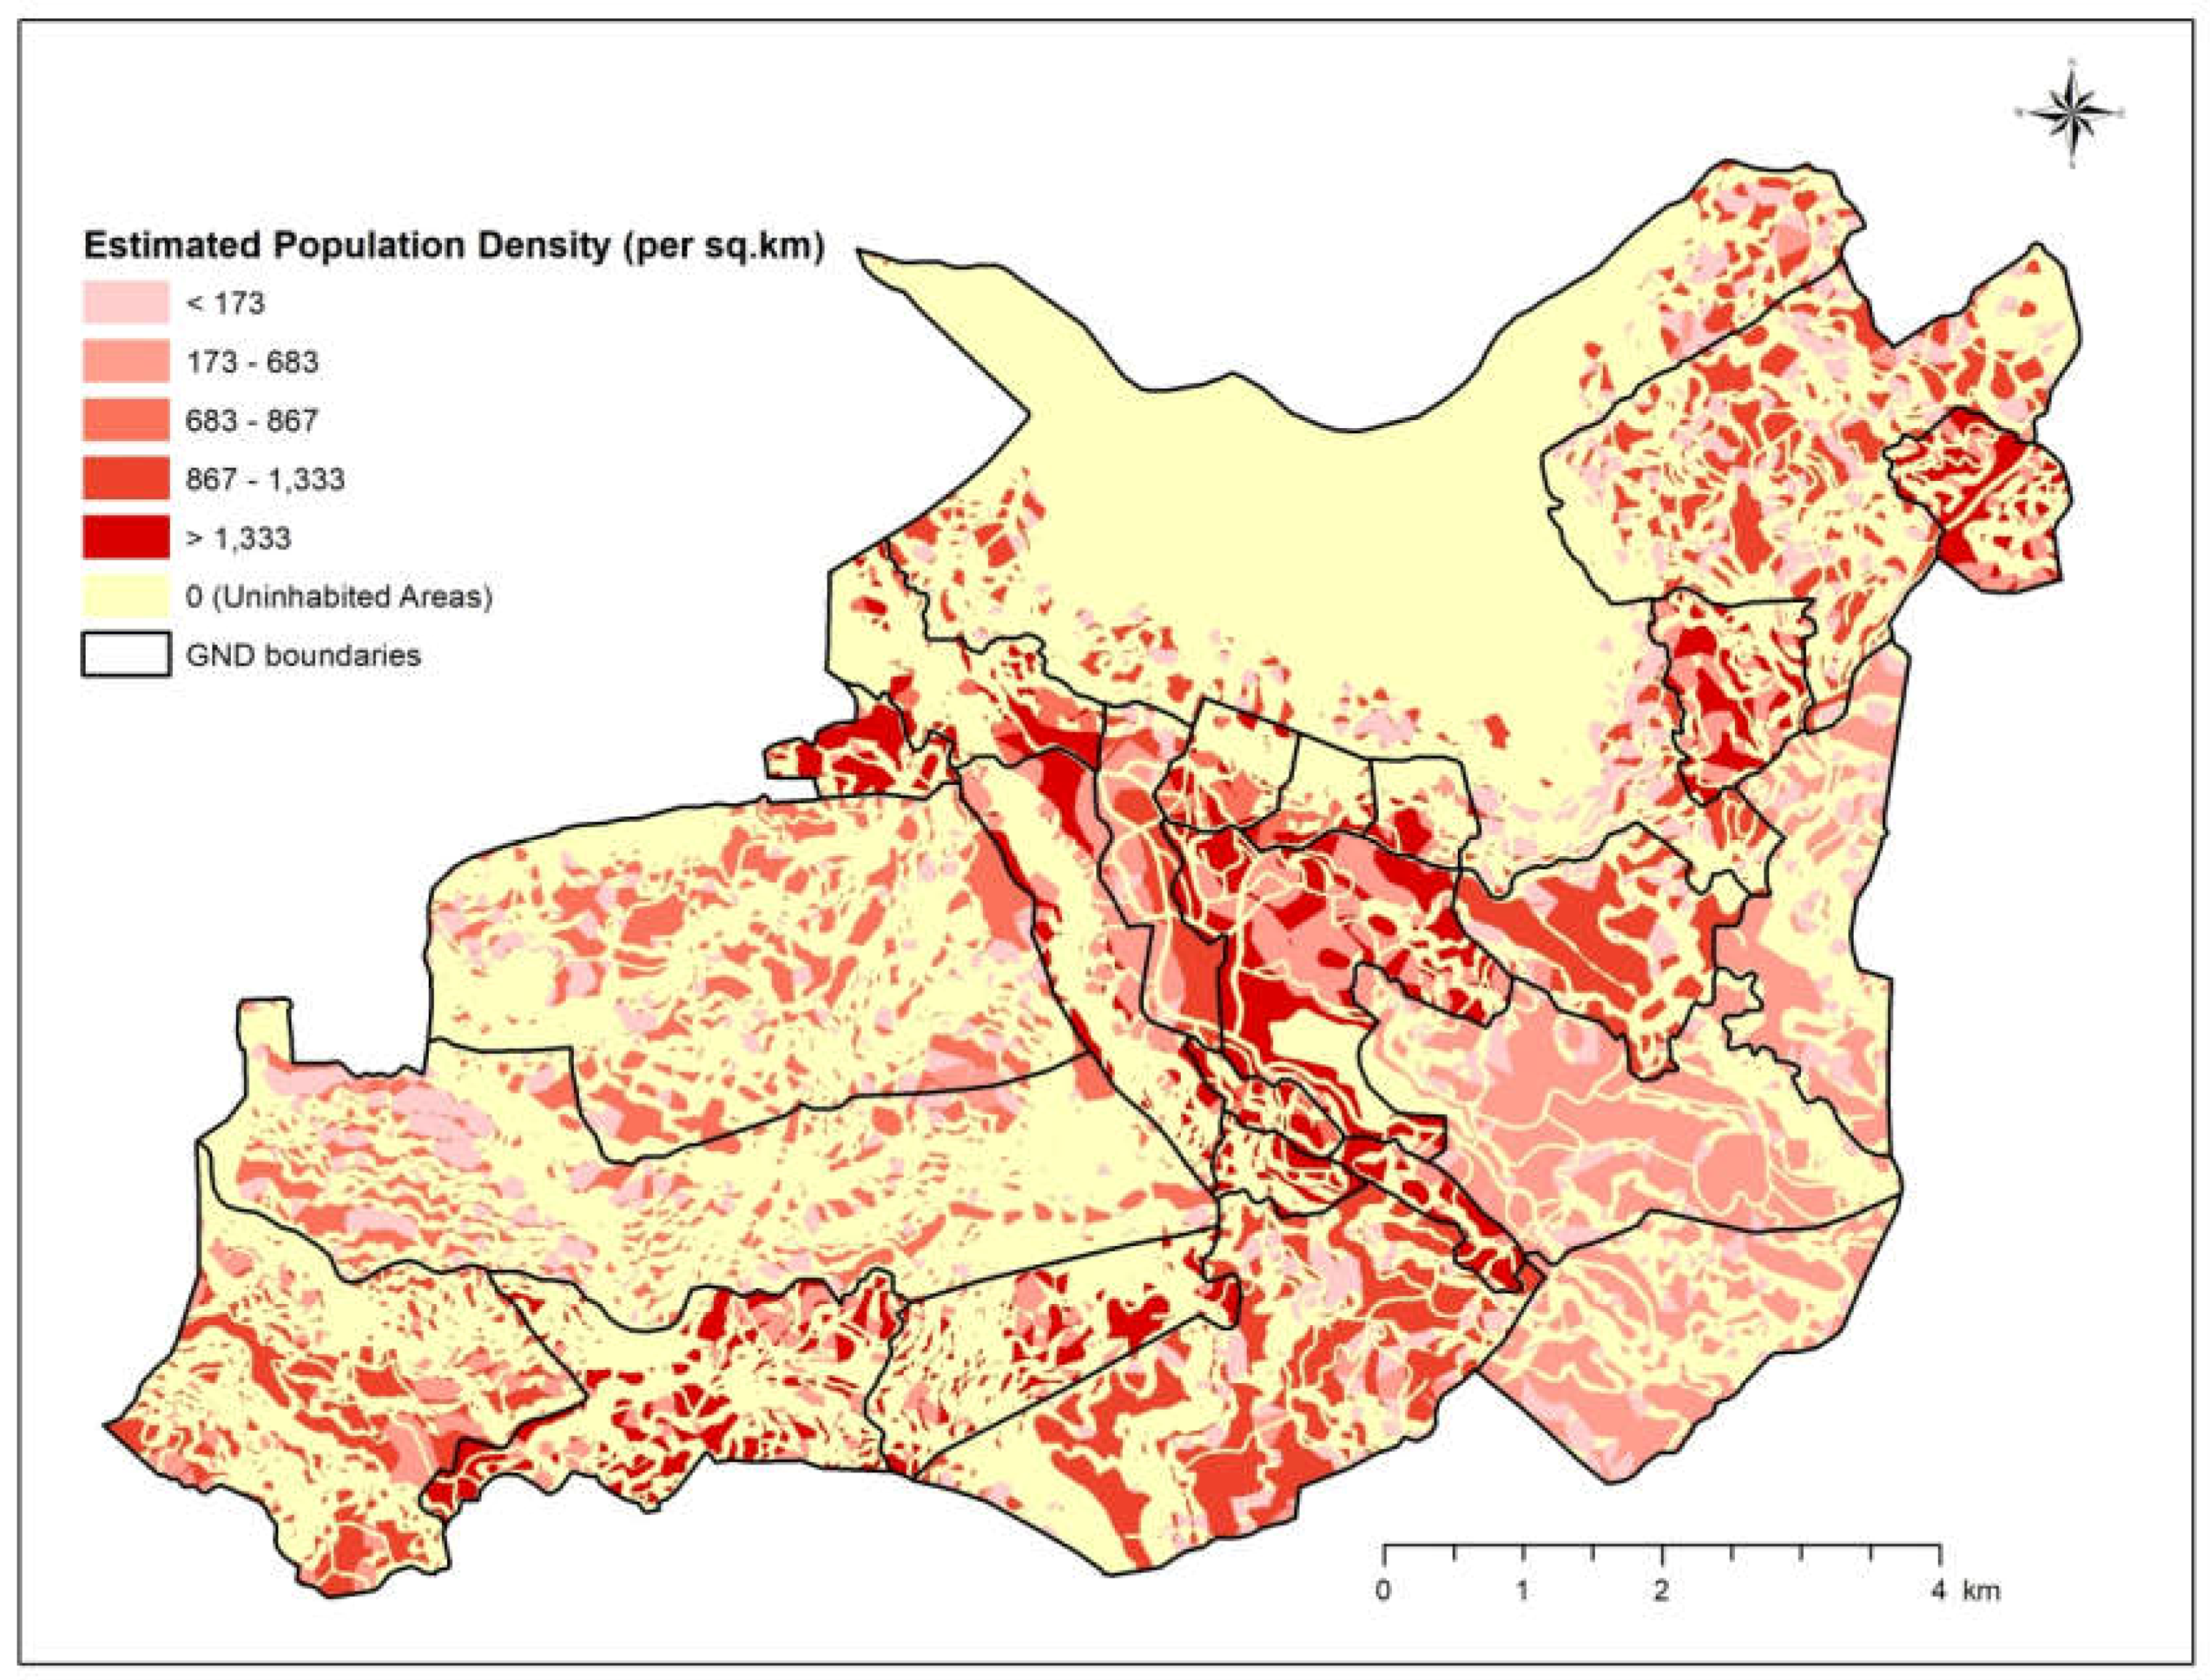
Figure 9 shows the use of three combined ancillary variables that appear to provide a better disaggregation result of source observation units (GNDs) into fine-grain divisions of target units. The estimated population density map appears to have a more scattered pattern than other population maps that use a single ancillary variable. This is because a large number of classes from all the layers can be mixed and considered to judge the population distribution through the disaggregation process within the multi-layer multi-class approach (6, 8, 16 classes for slope, altitude, and land use, respectively). Also, it should be noted that this dasymetric mapping represents the fine-grain division of hilly area population disaggregation by preserving the pycnophylactic property of population mapping [52], which maintains the same total population in each source zone.

Figure 9.
Population estimation using the combined dasymetric mapping.
Table 2 shows the results of the different ancillary data approaches based on the number of incorrectly placed people, which represents the errors counted for each observation unit (GNDs). For errors by slope angle ancillary data, the total number of incorrectly placed people is 26,172. The GNDs such as Bangalahatha (2058, 62%), Bambarakele (1950, 62%), Pedro (1964, 59%), Windicorner (985, 59%), Summerset (1910, 54%) and Kalapura (1850, 53%) show a large number of incorrectly placed people, compared to the other GNDs, because these GNDs are located in very steep areas. Meanwhile, several GNDs such as Nuwaraeliya (85, 7%), Nuwaraeliya Central (430, 10%), and Sandathenna (612, 22%) show fewer errors. A similar pattern is revealed in the altitude ancillary data application. For example, the Pedro (2471, 75%), Shanthipura (962, 68%), Park (2875, 64%), and Bambarakele (2011, 64%) GNDs are identified as areas with relatively high numbers of incorrectly placed people. The dasymetric mapping by land use/cover data shows that the Sandathenna (1968, 70%), Nuwaraeliya (886, 69%), Pedro (2080, 63%), and Seethaeliya (1066, 59%) GNDs are areas with the largest number of incorrectly placed people. This finding somewhat differs to the result from the slope angle-based estimation. On the other hand, in the combined dasymetric mapping using slope angle, altitude, and land use/cover, Pedro (1940, 59%), Kalapura (1771, 51%), Bangalahatha (1620, 49%), and Summerset (1687, 48%) are identified as areas with large numbers of incorrectly placed people, while Nuwaraeliya (68, 5%), Nuwaraeliya Central (387, 9%), and Sandathenna (514, 18%) show fewer errors of estimation. The total errors of altitude, land use/cover, slope angle, and combined approaches are 27,679 (44%), 26,954 (43%), 26,172 (42%), and 22,392 (36%), respectively. Among these total errors, the combined dasymetric mapping represents relatively fewer overall errors in terms of incorrectly placed people. This might be because the error of dasymetric mapping tends to be reduced by improving the fine-grain disaggregation layers with many subclasses. Slope and land use/cover-based dasymetric mapping also performed well compared to the combined approach. According to the results revealed, the land extent of the areas where inhabitants accurately assigned is about 60% of the study area (that is similar to 50.42 km2).
In addition, the RMSE and MAE of population estimation confirm that the combined dasymetric mapping shows the best performance with least errors (Table 3). As per the table, both the RMSE and MAE are comparatively high in altitude, land use, and slope angle approaches as compared to the combined approach. Also, slope angle approach performed better than the rest of land use and altitude in terms of statistical error parameters.
Table 3.
RMSE summary statistics for different dasymetric approaches.
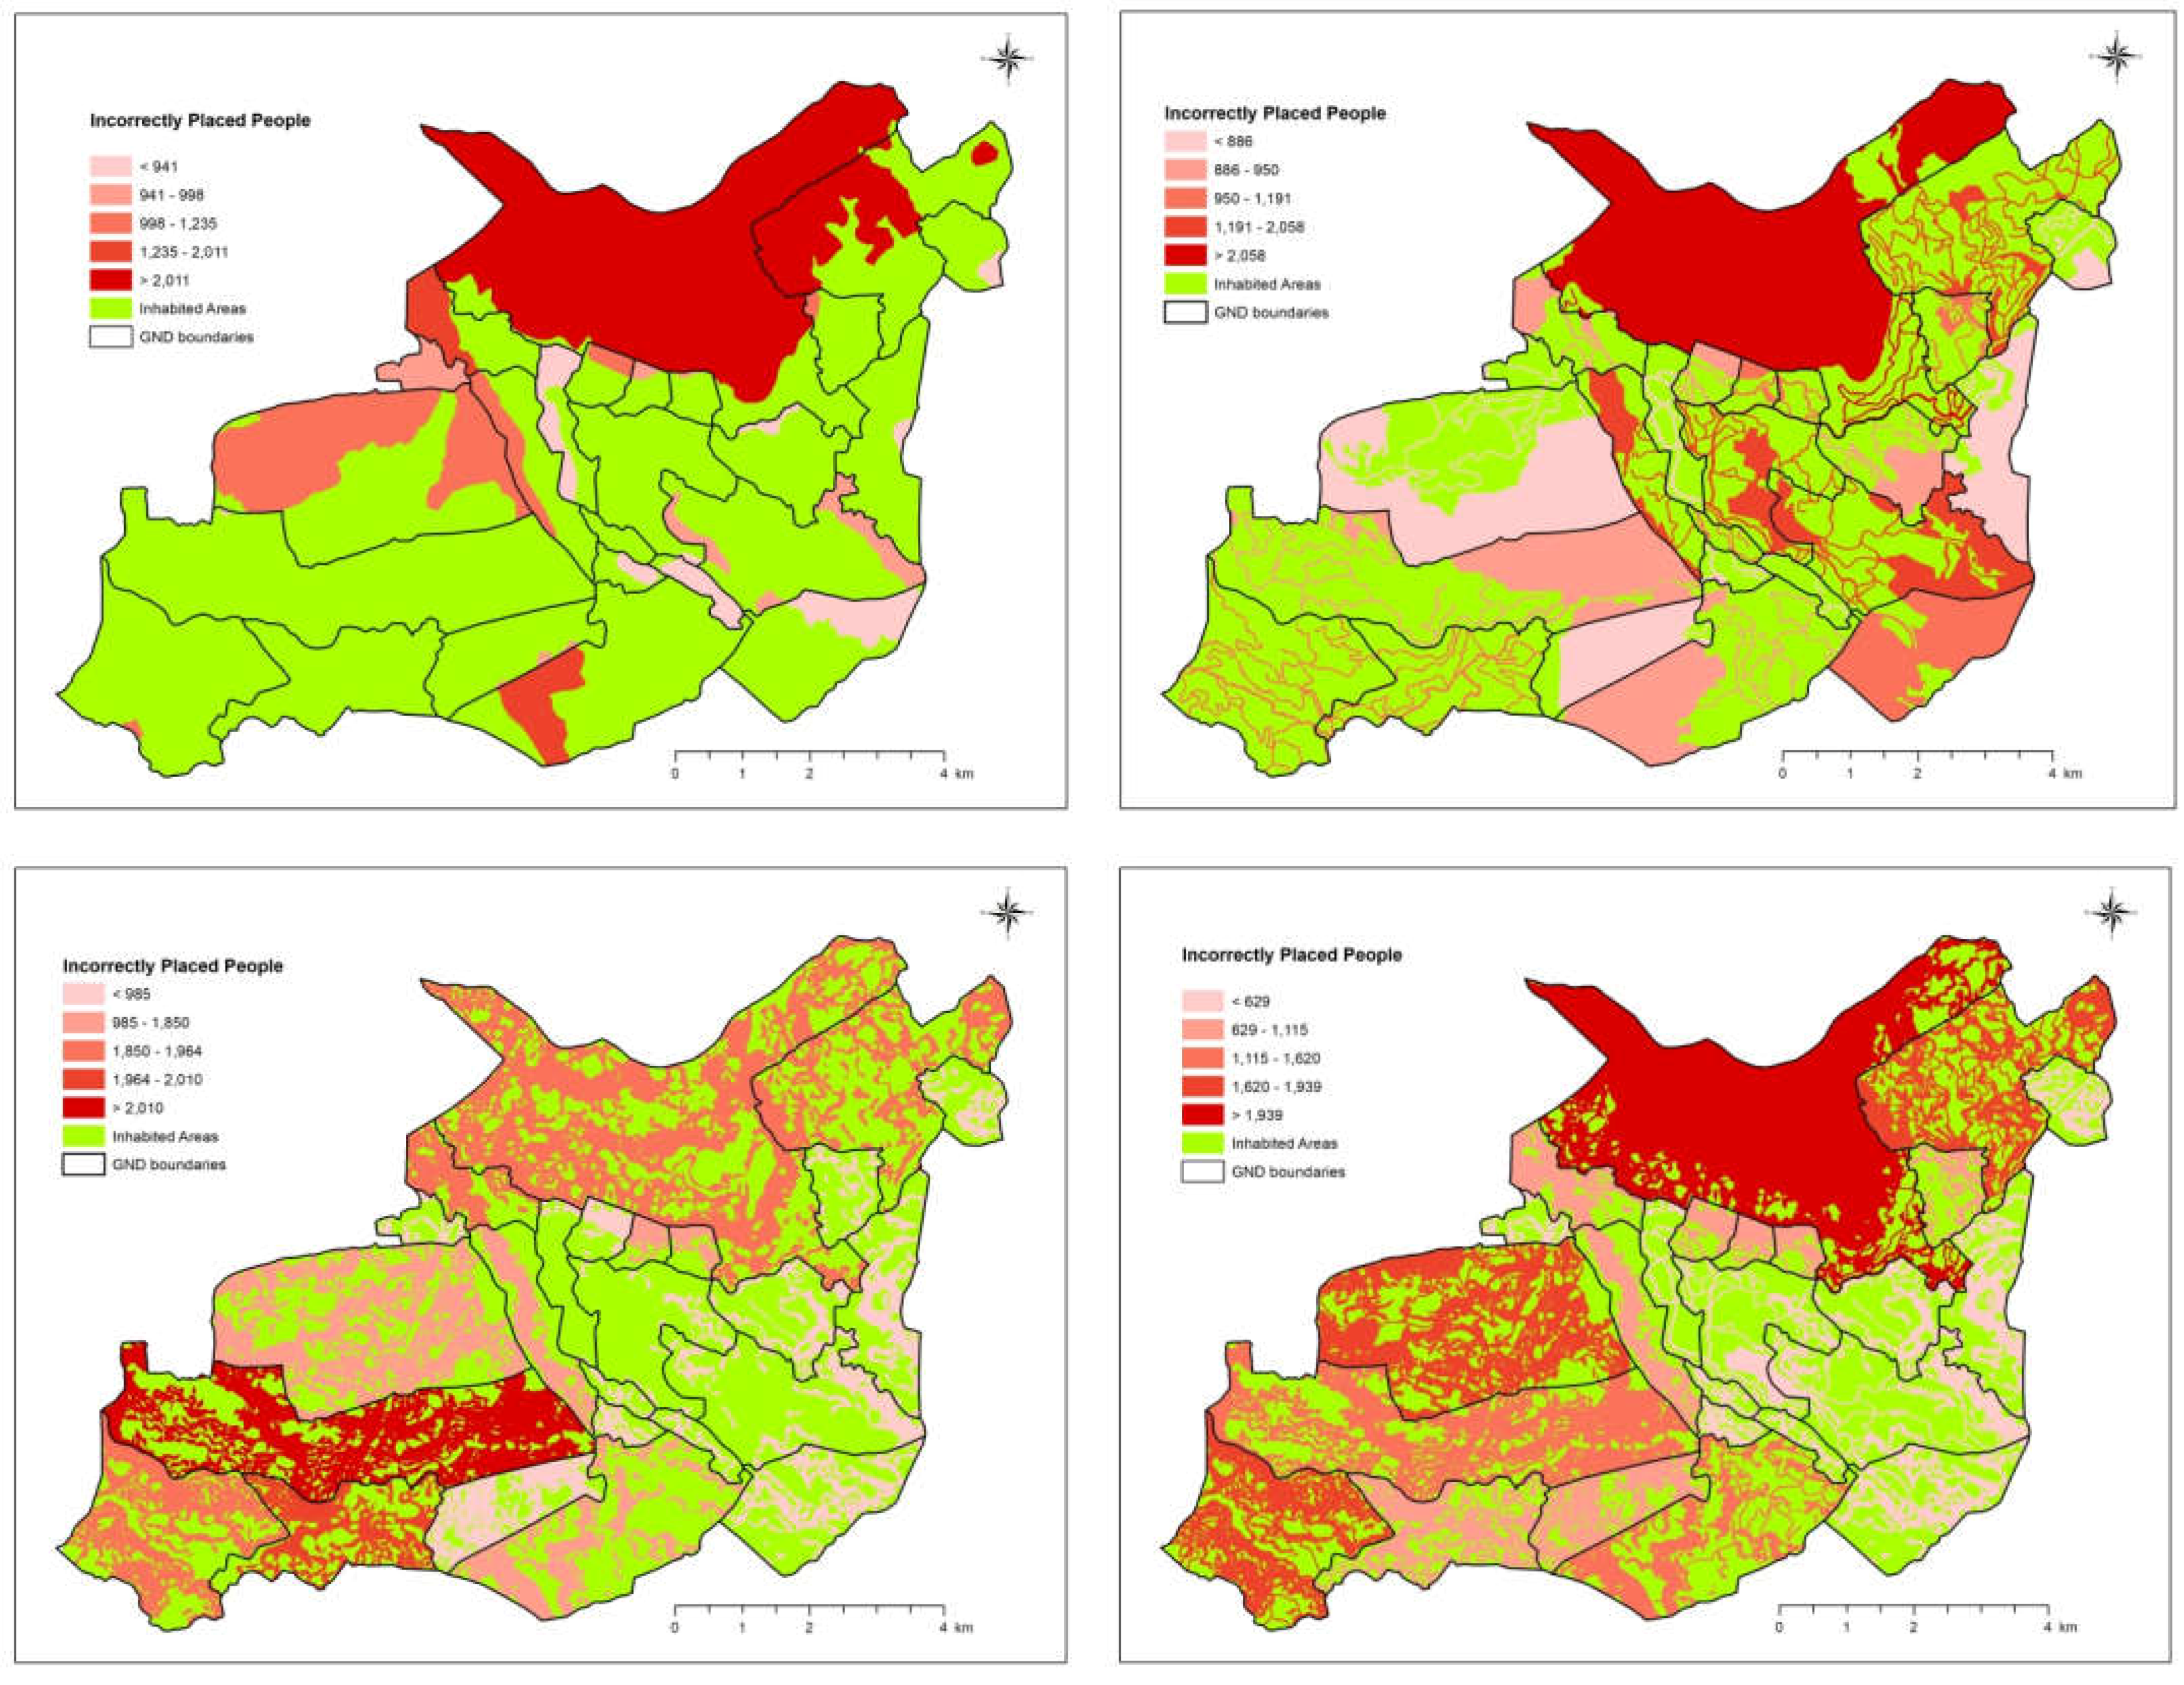
Figure 10 graphically shows the spatial distribution patterns of incorrectly placed population in terms of different dasymetric approaches. The areas with a large number of incorrectly placed people imply environmentally risky and physiologically difficult areas for living and human activities, while lower values of incorrectly placed people indicate fewer errors of estimation of hilly area population. As each distribution of incorrectly placed people presents different levels of disaggregation by its ancillary data resolution, the bottom right map of the combined dasymetric mapping appears to have more disaggregated units, and thus a finer level of population estimation than the other maps.
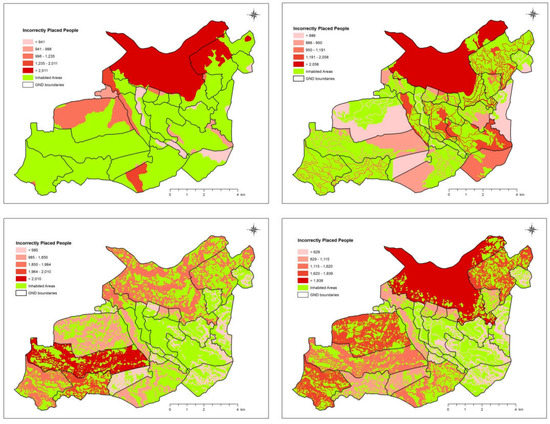
Figure 10.
Incorrectly placed people by different dasymetric approaches: upper left for altitude-based; upper right for land use-based; bottom left for slope-based; bottom right for a combined dasymetric approach.
5. Discussion
According to the revealed results, GND source zones are appropriately disaggregated by fine-grain slopes, land use and altitude categories. Therefore, slopes angle, altitude, and land use can be considered as significant exponents of population density mapping in hilly areas. However, for further fine-grain disaggregation of hilly area population, rigorous high-resolution spatial data are needed. For example, address points of dwelling units, remotely sensed data, as well as aerial photographic imagery are potential materials for high-resolution disaggregation. Building blocks may also be important if the living units are clearly clarified. Thus, in order to improve the reliability of the results of this study, high-quality data may be required too. In fact, it is difficult to find a consensus yet on hilly area population mapping, except the trade-offs of slopes and elevation with population distribution. All the possible alternative approaches on population mapping may be latent in the developing world due to data scarcity. Future applications on hilly area population mapping may continue with the application of more unobserved ancillary data, which is related to mountainous topographies.
In the weighting schemas for relevant factors for the population, higher slope classes, higher elevation classes, and some of land use/cover variables such as water bodies, roads categories, forested areas, paddy lands, etc. are obviously considered as uninhabited (zero population) entities. Therefore, these entities received zero weights in the calculation process. Also, it is noted that topographic ancillary classes and corresponding weights are obtained based on a statistical method from our own data distribution, as well as prior knowledge of the authors for study area. In fact, the determination of weights for the dasymetric mapping is still controversial and more empirical studies and discussion are needed (Su, et al. [41]). This is why many studies have adopted domain knowledge and subjective assignments for weights (Eicher and Brewer [33]). Therefore, different weighting approaches may need to be broadly examined for hilly area populations with various environments for more generalization. Also, future studies can appropriate the validation of results through field observations and verifications.
Despite some drawbacks, our method is very significant because it could mitigate the limitation of low-resolution data for typical hilly areas. Although population data is a fundamental component for policy-making and disaster response [1], estimating populated hilly areas is a difficult task because it is usually based on available census enumeration units. Alternatively, ancillary data relevant to hilly areas population, such as land use, slopes angle, and altitude are empirically considered for the model in order to disaggregate low-resolution area population into more detailed distribution. In future studies, this methodology can easily be applied to accurately calculate the prospective population of mountainous areas.
6. Concluding Remarks
With rapid expansion of the world’s population, particularly in developing countries, the exact counting or estimation of population distribution is important for national and regional planning. In particular, estimating a more accurate and detailed level of population distribution for inaccessible and unavailable areas, such as mountainous areas, is challenging. In this context, this study introduced an alternative method of estimating such unmanageable area populations by utilizing dasymetric mapping approaches that incorporate the ancillary variables of regional characteristics. From the empirical results, area-specific ancillary data, including slope angle, altitude, and land use are very significant in plotting hilly areas’ population. Also, it is shown that an explicit and strong correlation exists between the population density distribution and slope, and altitude distribution of land. Among several applications, the dasymetric mapping with the combined ancillary data of slope angle, altitude, and land use/cover shows the best performance for estimating a population in hilly areas. Accordingly, the GNDs source zones were appropriately disaggregated by fine-grain slope angle, land use, and altitude categories. Despite this result, much higher resolution spatial data are needed for further fine-grain disaggregation of hilly area populations. However, in most developing nations, these data are usually unavailable in census and often inaccurate, even in official statistics. Alternatively, the address points of dwelling units or available remotely sensed data such as aerial photographic imagery could be considered for more detailed information of population distribution. It is expected that the proposed method will provide a viable option for estimating more accurate population density, particularly in geographically challenging areas, and will function as a methodological extension to classical dasymetric mapping. On the other hand, some significant findings were revealed from this work. Under the situation of a rapidly growing population and decline of available land, people are often provoked to settle down in environmentally uninhabitable areas. In particular, the high altitude areas in this study, such as Pedro and Park GNDs, are highly vulnerable for inhabitation. Since the number and size of such vulnerable residential areas are increasing in many developing countries, additional population studies about various geographic environments and empirical clarifications will be needed in the future. Further, various ancillary sources need to be explored to support more accurate dasymetric mapping techniques for population estimation.
One weakness of this study is the application of low spatial resolution data for the analysis. This is because up-to-date high resolution data are not available in Sri Lanka. Therefore, the revealed results could be improved with the application of up-to-date high resolution data. Nevertheless, some studies can be found with coarse resolution data applications, e.g., Song et al. [53]. Although our research is certainly worth presenting how to combine area specific variables which are useful for deriving detailed population of hilly areas on an empirical basis, our case study is limited to the population distribution in Sri Lanka’s highest mountain range. According to our practical knowledge and experiences on the study area, the identified variables such as slope angle, altitude, land use/cover (particularly topographic variables) are highly correlated with hilly area population distributions, and the resulting estimation is well performed to disaggregate the population distribution. However, it is noted that these variables and their weight factors may vary among different regions of interest.
Author Contributions
All authors are involved in the design and implementation of research, data processing, analyzing and writing.
Funding
This work was supported by ‘Overseas Training Expenses for Humanities & Social Sciences’ through Seoul National University and ‘BK21 Plus Program’ by Department of Geography at Seoul National University.
Acknowledgments
We are grateful to anonymous reviewers for valuable comments.
Conflicts of Interest
The authors declare no conflict of interest.
References
- Azar, D.; Engstrom, R.; Graesser, J.; Comenetz, J. Generation of fine-scale population layers using multi-resolution satellite imagery and geospatial data. Remote Sens. Environ. 2013, 130, 219–232. [Google Scholar] [CrossRef]
- Dmowska, A.; Stepinski, T.F. High resolution Dasymetric model of U.S demographics with application to spatial distribution of racial diversity. Appl. Geogr. 2014, 53, 417–426. [Google Scholar] [CrossRef]
- Jia, P.; Qiu, Y.; Gaughan, A.E. A fine-scale spatial population distribution on the High-resolution Gridded Population Surface and application in Alachua County, Florida. Appl. Geogr. 2014, 50, 99–107. [Google Scholar] [CrossRef]
- Cockx, K.; Canters, F. Incorporating spatial non-stationarity to improve Dasymetric mapping of population. Appl. Geogr. 2015, 63, 220–230. [Google Scholar] [CrossRef]
- Weber, E.M.; Seaman, V.Y.; Stewart, R.N.; Bird, T.J.; Tatem, A.J.; McKee, J.J.; Bhaduri, B.L.; Moehl, J.J.; Reith, A.E. Census-independent population mapping in northern Nigeria. Remote Sens. Environ. 2018, 204, 786–798. [Google Scholar] [CrossRef]
- Garcia, R.A.C.; Oliveira, S.C.; Zêzere, J.L. Assessing population exposure for landslide risk analysis using dasymetric cartography. Nat. Hazards Earth Syst. Sci. 2016, 16, 2769–2782. [Google Scholar] [CrossRef]
- Fuchs, S.; Keiler, M.; Zischg, A. A spatiotemporal multi-hazard exposure assessment based on property data. Nat. Hazards Earth Syst. Sci. 2015, 15, 2127–2142. [Google Scholar] [CrossRef]
- Fuchs, S.; Sokratov, S.A.; Keiler, M.; Shnyparkov, A. Spatiotemporal dynamics: The need for an innovative approach in mountain hazard risk management. Nat. Hazards 2013, 68, 1217–1241. [Google Scholar] [CrossRef]
- Freire, S.; Aubrecht, C.; Wegscheider, S. Advancing tsunami risk assessment by improving spatio-temporal population exposure and evacuation modeling. Nat. Hazards 2013, 68, 1311–1324. [Google Scholar] [CrossRef]
- Freire, S.; Aubrecht, C. Integrating population dynamics into mapping human exposure to seismic hazard. Nat. Hazards Earth Syst. Sci. 2012, 12, 3533–3543. [Google Scholar] [CrossRef]
- Calka, B.; Da Costa, N.J.; Bielecka, E. Fine scale population density data and its application in risk assessment. Geomat. Nat. Hazards Risk 2017, 8, 1440–1455. [Google Scholar] [CrossRef]
- Calka, B.; Bielecka, E.; Zdunkiewicz, K. Redistribution population data across a regular spatial grid according to buildings characteristics. Geod. Cartogr. 2016, 65, 149–162. [Google Scholar] [CrossRef]
- De Silva, W.I. A Population Projection of Sri Lanka for the New Millennium, 2001–2101: Trends and Implications; IHP Publishers: Colombo, Sri Lanka, 2007; p. 5. [Google Scholar]
- Department of Census and Statistics—Sri Lanka. Available online: http://www.webcitation.org/75ejkY9Iu (accessed on 23 January 2019).
- Emmanuel, R. Assessment of Impact of Land Cover Changes on Urban Bioclimate: The Case of Colombo, Sri Lanka. Archit. Sci. Rev. 2003, 46, 151–158. [Google Scholar] [CrossRef]
- Emmanuel, R.; Rosenlund, H.; Johansson, E. Urban shading—A design option for the tropics? A study in Colombo, Sri Lanka. Int. J. Climatol. 2007, 27, 1995–2004. [Google Scholar]
- Senanayake, I.P.; Welivitiya, W.D.D.P.; Nadeeka, P.M. Remote sensing-based analysis of urban heat islands with vegetation cover in Colombo city, Sri Lanka using Landsat-7 ETM+ data. Urban Clim. 2013, 5, 19–35. [Google Scholar] [CrossRef]
- Senanayake, I.P.; Welivitiya, W.D.D.P.; Nadeeka, P.M. Urban green spaces analysis for development planning in Colombo, Sri Lanka, utilizing THEOS satellite imagery—A remote sensing and GIS approach. Urban For. Urban Green. 2013, 12, 307–314. [Google Scholar] [CrossRef]
- Hettiarachchi, M.; Wickramasinghe, D.; Mapa, R.; Morrison, T. The eco-social transformation of urban wetlands: A case study of Colombo, Sri Lanka. Landsc. Urban Plan. 2014, 132, 55–68. [Google Scholar] [CrossRef]
- Johansson, E.; Emmanuel, R. The influence of urban design on outdoor thermal comfort in the hot, humid city of Colombo, Sri Lanka. Int. J. Biometeorol. 2006, 51, 119–133. [Google Scholar] [CrossRef]
- Perera, N.G.R.; Emmanuel, R. A ‘Local Climate Zone’ based approach to urban planning in Colombo, Sri Lanka. Urban Clim. 2016, 23, 188–203. [Google Scholar] [CrossRef]
- Wright, J.K. A Method of Mapping Densities of Population: With Cape Cod as an Example. Geogr. Rev. 1936, 26, 103–110. [Google Scholar] [CrossRef]
- Fisher, P.F.; Langford, M. Modeling Sensitivity to Accuracy in Classified Imagery: A Study of Areal Interpolation by Dasymetric Mapping. Prof. Geogr. 1996, 48, 299–309. [Google Scholar] [CrossRef]
- Creamer, M.C. Isolines in Population Density Mapping. Prof. Geogr. 1958, 10, 14–15. [Google Scholar] [CrossRef]
- Haaland, C.M.; Heath, M.T. Mapping of population density. Demography. 1974, 11, 321–336. [Google Scholar] [CrossRef]
- Lin, Z.; Oguchi, T.; Duan, F. Topographic and climate influences on population and soil in East to Southeast Asia: A GIS approach. Geogr. Rev. Jpn. 1999, 72, 181–192. [Google Scholar] [CrossRef]
- Ural, S.; Hussain, E.; Shan, J. Building population mapping with aerial imagery and GIS data. Int. J. Appl. Earth Obs. Geoinf. 2011, 13, 841–852. [Google Scholar] [CrossRef]
- Alahmadi, M.; Atkinson, P.; Martin, D. Estimating the spatial distribution of the population of Riyadh, Saudi Arabia using remotely sensed built land cover and height data. Comput. Environ. Urban Syst. 2013, 41, 167–176. [Google Scholar] [CrossRef]
- Patel, N.N.; Angiuli, E.; Gamba, P.; Gaughan, A.; Lisini, G.; Stevens, F.R.; Tatem, A.J.; Trianni, G. Multitemporal settlement and population mapping from Landsatusing Google Earth, Engine. Int. J. Appl. Earth Obs. Geoinf. 2015, 35, 199–208. [Google Scholar] [CrossRef]
- Zoraghein, H.; Leyk, S.; Ruther, M.; Buttenfield, B.P. Exploiting temporal information in parcel data to refine small area population estimates. Comput. Environ. Urban Syst. 2016, 58, 19–28. [Google Scholar] [CrossRef]
- Yao, Y.; Liu, X.; Li, X.; Zhang, J.; Liang, Z.; Mai, K.; Zhang, Y. Mapping fine-scale population distributions at the building level by integrating multisource geospatial big data. Int. J. Geogr. Inf. Sci. 2017, 31, 1220–1244. [Google Scholar] [CrossRef]
- GHSL—Global Human Settlement Layer. Available online: http://www.webcitation.org/76PdvAt5G (accessed on 23 February 2019).
- Eicher, C.L.; Brewer, C.A. Dasymetric Mapping and Areal Interpolation: Implementation and Evaluation. Cartogr. Geogr. Inf. Sci. 2001, 28, 125–138. [Google Scholar] [CrossRef]
- Zandbergen, P.A. Dasymetric Mapping Using High Resolution Address Point Datasets. Trans. GIS 2011, 15, 5–27. [Google Scholar] [CrossRef]
- Bozheva, A.M.; Petrov, A.N.; Sugumaran, R. The Effect of Spatial Resolution of Remotely Sensed Data in Dasymetric Mapping of Residential Areas. GISci. Remote Sens. 2005, 42, 113–130. [Google Scholar] [CrossRef]
- Zandbergen, P.A.; Ignizio, D.A. Comparison of Dasymetric Mapping Techniques for Small-Area Population Estimates. Cartogr. Geogr. Inf. Sci. 2010, 37, 199–214. [Google Scholar] [CrossRef]
- Brehme, C.E.; McCarron, P.; Tetreault, H. A Dasymetric Map of Maine Lobster Trap Distribution Using Local Knowledge. Prof. Geogr. 2015, 67, 98–109. [Google Scholar] [CrossRef]
- Lloyd, C.T. High resolution global gridded data for use in population studies. Int. Arch. Photogramm. Remote Sens. Spat. Inf. Sci. 2017, 4, 117–120. [Google Scholar] [CrossRef]
- Lung, T.; Ngochoch, J.K.; Lübker, T.; Schaab, G. Human population distribution modelling at regional level using very high-resolution satellite imagery. Appl. Geogr. 2013, 41, 36–45. [Google Scholar] [CrossRef]
- Linard, C. Modelling changing population distributions: An example of the Kenyan Coast, 1979–2009. Int. J. Digit. Earth 2017, 10, 1017–1029. [Google Scholar] [CrossRef]
- Su, M.; Lin, M.; Hsieh, H.; Tsai, B.; Lin, C. Multi-layer multi-class Dasymetric mapping to estimate population distribution. Sci. Total Environ. 2010, 408, 4807–4816. [Google Scholar] [CrossRef]
- Department of Surveying of Sri Lanka. Sri Lankan Topological Maps; Department of Survey: Colombo, Sri Lanka, 2003.
- Department of Surveying of Sri Lanka. Sri Lankan Topological Maps; Department of Survey: Colombo, Sri Lanka, 2010.
- Jenks, G.F. Optimal data classification for choropleth maps. In Occasional Paper 2; Department of Geography, University of Kansas: Lawrence, KS, USA, 1977. [Google Scholar]
- Willmott, C.J.; Matsuura, K. Advantages of the mean absolute error (MAE) over the root mean square error (RMSE) in assessing average model performance. Clim. Res. 2005, 30, 79–82. [Google Scholar] [CrossRef]
- Schroeder, J.P. Hybrid areal interpolation of census counts from 2000 blocks to 2010 geographies. Comput. Environ. Urban Syst. 2017, 62, 53–63. [Google Scholar] [CrossRef]
- Jain, D.; Tiwari, G. Population disaggregation to capture short trips—Vishakhapatnam, India. Comput. Environ. Urban Syst. 2017, 62, 7–18. [Google Scholar] [CrossRef]
- Wei, C.; Taubenbock, H.; Blaschke, T. Measuring urban agglomeration using a city-scale Dasymetric population map: A study in the Pearl River Delta, China. Habitat Int. 2017, 59, 32–43. [Google Scholar] [CrossRef]
- Goodchild, M.F.; Anselin, L.; Deichmann, U. A framework for the areal interpolation of socioeconomic data. Environ. Plan. 1993, 25, 383–397. [Google Scholar] [CrossRef]
- Holt, J.B.; Lo, C.P.; Hodler, T.W. Dasymetric Estimation of Population Density and Areal Interpolation of Census Data. Cartogr. Geogr. Inf. Sci. 2004, 31, 103–121. [Google Scholar] [CrossRef]
- Langford, M. Obtaining population estimates in non-census reporting zones: An evaluation of the 3-class dasymetric method. Comput. Environ. Urban Syst. 2006, 30, 161–180. [Google Scholar] [CrossRef]
- Tobler, W.R. Smooth pycnophylactic interpolation for geographical regions. J. Am. Stat. Assoc. 1979, 74, 519–530. [Google Scholar] [CrossRef]
- Song, G.; Yu, M.; Liu, S.; Zhang, S. A dynamic model for population mapping: A methodology integrating a Monte Carlo simulation with vegetation-adjusted night-time light images. Int. J. Remote Sens. 2015, 36, 4054–4068. [Google Scholar] [CrossRef]


© 2019 by the authors. Licensee MDPI, Basel, Switzerland. This article is an open access article distributed under the terms and conditions of the Creative Commons Attribution (CC BY) license (http://creativecommons.org/licenses/by/4.0/).