Abstract
Building groups with special patterns are common layouts in urban settlement areas, which should be carefully generalized. Typification is considered as an appropriate operator to generalize building groups with grid patterns. As an important operator in building generalization, the purpose of typification is to reduce the number of objects while preserving the original distribution characteristics as much as possible. This study proposes a mesh-based method to typify buildings with grid patterns. Firstly, the pattern is subdivided into perfect grid or grid-like patterns by considering the completeness of the grids. The proposed typification method consists of three steps: (1) generating mesh from the proximity graph of buildings; (2) eliminating triangular meshes; (3) determining the number, positions, and representations of the newly created buildings with the help of the related meshes. The proposed method is modeled as an iterative process to achieve hierarchical typification results, which provides support to the map multiple representation. The experimental results demonstrate that the mesh-based typification method can achieve satisfying results in the perfect grid pattern, as well as the grid-like pattern. The new distribution of the typified buildings preserves the original pattern characteristics.
1. Introduction
Map generalization is a core issue in automated map production, which aims at deriving smaller-scale maps from larger-scale maps by utilizing transformation operations [1,2,3]. Among various geographical objects, buildings attract much attention in map generalization for reasons of their artificial shape and complex spatial distribution [4,5,6]. Building generalization is normally subdivided into two steps: building grouping and generalization execution [6]. Building grouping is the process of arranging individual buildings into clusters by considering their similarities and differences. Generalization execution denotes the selection of appropriate operators to generalize the grouped building clusters. The most frequently used operators for building generalization are elimination, collapse, simplification, aggregation, typification, exaggeration, and displacement. These operators have different functions in diverse situations. For example, for an unstructured building cluster, aggregation is normally implemented, while, in a regular linear building group, typification is considered as an appropriate operator.
In some cases of urban and suburban areas, buildings are displayed on maps with specific regular patterns. Linear patterns and grid patterns are two common regular layouts presented in building groups. With the map scale decreasing, the building groups with these two regular patterns should be carefully generalized, in order that the number of buildings is reduced, and the characteristics of the original patterns are preserved. Based on the above generalization requirements, in general, the typification is considered an appropriate operator to generalize building groups with regular patterns [6]. This study only considers the geometry information of the building groups as a local typification, while the quality and function of buildings are ignored. Typification denotes the process of reducing the number of objects out of a set of similar objects, while preserving their relative spatial density and distribution characteristics. Based on the definition, typification focus on the level of building groups rather than the individual buildings; thus, typification is an ideal operator with regard to contextual generalization (building group generalization). The target of typification is to transform an initial set of objects into a subset, while maintaining the distribution characteristics and patterns of the original set. As an important and frequently used operator in map generalization, typification can provide continuous generalization results for multiple representation [7]. Currently, the existing methods mainly aim to solve the global typification issues by considering the entire region, while few studies were developed for the building groups with local characteristics (grid patterns). The building groups with local structures appear frequently on maps, which dominates the visual effects so that they should be carefully generalized. For this reason, the objective of this study is to develop an operator of typification aiming at solving the generalization issues for building groups with grid patterns. With the proposed typification strategy, building groups with grid patterns can be generalized appropriately and their original characteristics of grid patterns can be preserved after generalization.
The remainder of this paper is structured as follows: Section 2 gives a review of previous work on building typification. Section 3 introduces the proposed typification methods to generalize building groups with grid patterns. Section 4 carries out the experiments to test the proposed methods, and the results are displayed and evaluated with manual generalization maps. Section 5 discusses the advantages and further improvements of the proposed methods. Section 6 gives the conclusions.
2. Related Work
Over past decades, many studies were carried out on building generalization. Some studies focused on the overall process of generalization, while others were devoted to developing strategies on specific generalization operators. The generalization operators can be categorized into two classes: non-contextual operators for an individual building (such as simplification or exaggeration) and contextual operators for building groups (such as aggregation or typification). Among the contextual generalization operators, typification is a discrete process in which a set of objects is replaced by another set containing a smaller number of objects [7]. In his work, Burghardt modeled the typification procedure as a two-stage process with the steps of “positioning” and “representation” [8]. The “positioning” step determines the number and the position of the newly created typified buildings, while the “representation” step considers calculating the size, shape, and orientation of the newly created buildings. Compared with other generalization operators, the specificity of typification implies that it is compulsory to create newly buildings by considering number, position, and representation, which increases the complexity and difficulty in the generalization process.
To date, many strategies were created for building typification. Regnauld proposed the idea of “global typification”, which processes the entire region as the typification objects instead of just processing one group of buildings [9]. According to his terminology of “global typification”, by contrast, the opposite terminology “local typification” is proposed herein because building groups are mainly considered in our study. Global typification regards the buildings in the whole region as inputs, which considers the structural knowledge less. The aim of global typification is to maintain the overall distribution and structure as much as possible and to preserve the similarities and differences between the groups with regard to density, size, and orientation of buildings. Global typification is often adopted in medium or small scales. For example, Bildirici developed “length and angle” methods to typify buildings with point geometries [10,11]. Sester selected optimization approaches for generalization and used self-organizing maps for building typification [12]. Burghardt used a mesh simplification technique adapted from computer graphics to typify buildings [8]. Li’s study considered three steps (number, representation, and harmonizing) for the typification procedure based on multi-scale data matching [13]. From the above studies, it is found that global typification processes more on the entire region and aims to preserve the global pattern; this may result in some limitations on preserving the local characteristics of building groups.
By comparison, local typification is implemented on the level of building groups; thus, the structural knowledge of the groups is largely considered in the process of typification [14]. Local typification is often combined with building grouping and pattern detection. Many ideas were proposed to detect building groups and recognize building patterns [15,16,17,18,19,20,21,22,23,24]. Local typification normally concentrates on the buildings with regular patterns, such as linear patterns and grid patterns. For example, Anders presented a parameter-free graph-based clustering approach and applied it for building typification [25]. He also used a relative neighborhood graph to detect building groups with grid structures and then reduced or simplified the grid structure using least-squares adjustment of an affine or Helmert transformation approach [26]. Gong regarded typification as a progressive and iterative process consisting of elimination, exaggeration, and displacement so as to typify linear building patterns [27]. Apart from buildings, the typification of other geographical objects, such as islands, ditches, drainage, facades, etc., also belongs to the topic of local typification [28,29]. The above researches can provide inspirations for building typification. For instance, the issue of facade typification has large similarities with the typification of buildings with grid patterns. Jahnke dedicated his effort to the typification of facade features and presented a user survey for the evaluation of different typification results [30]. Shen used a user survey to show that the preservation of the shape of facade features is the most important constraint for a reasonable typification process. Based on the survey’s conclusions, an algorithm was developed to generate a perceivably reasonable representation from an original facade [31].
From the above descriptions of global and local typification, the difference between these two ideas lies in three aspects. The first aspect is the number of buildings. Global typification normally calculates the typified building number based on radical law; for local typification, the typification is normally modeled as an iterative process and the number of buildings reduces gradually; for example, some methods of linear pattern typification only remove one building in each iteration. The second aspect is the position of buildings. Global typification normally uses the centroids of buildings to replace buildings, which transforms building typification to point selection by mainly considering the density; this may result in disrupting local characteristics. The local typification primarily takes group characteristics into consideration; thus, the new positions for remaining buildings must be consistent with the original patterns. The third aspect is the representation of buildings. Global typification is often carried out on medium- or small-scale maps, where buildings are abstracted as built-up or settlement areas with simple outlines. Local typification is implemented mainly on large-scale maps where the buildings can have more detail after generalization.
Although many works were done previously on building typification, there are still some issues to be further studied or improved. To date, most local typification algorithms were developed for buildings with linear patterns. To the authors’ knowledge, there is almost no specific research concerning how to typify building groups with grid patterns that are frequently presented on maps. In essence, the typification of grid-pattern buildings belongs to the problem of m:n relation generalization [32]. The difficulty lies in how to keep the balance between reducing an appropriate number of buildings and preserving the original grid pattern in the remaining buildings after typification. Based on the above points, the proposed study works on the local typification level and aims to typify buildings with grid patterns.
3. Methodology of Mesh-Based Typification
3.1. Grid Pattern Classification
The word “grid” is defined as “a pattern, structure, or network consisting of evenly spaced horizontal and vertical straight lines that cross over each other and form squares” [33]. The definition emphasizes and demonstrates that the horizontal lines of the grid pattern should be perpendicular with their vertical lines and their spaces should be the same. Therefore, based on the above definition, the buildings with a grid pattern should meet the following three constraints:
- C1: the space between buildings should be the same;
- C2: the buildings are located perpendicular to each other;
- C3: the number of buildings in each row and column should be equal.
However, in real building datasets, it is not easy to find such perfect grid patterns meeting all the above constraints. Nevertheless, one can frequently find buildings with similar presentations to a perfect grid pattern. Therefore, in this paper, we subdivide the grid patterns into two categories: perfect grid patterns and grid-like patterns.
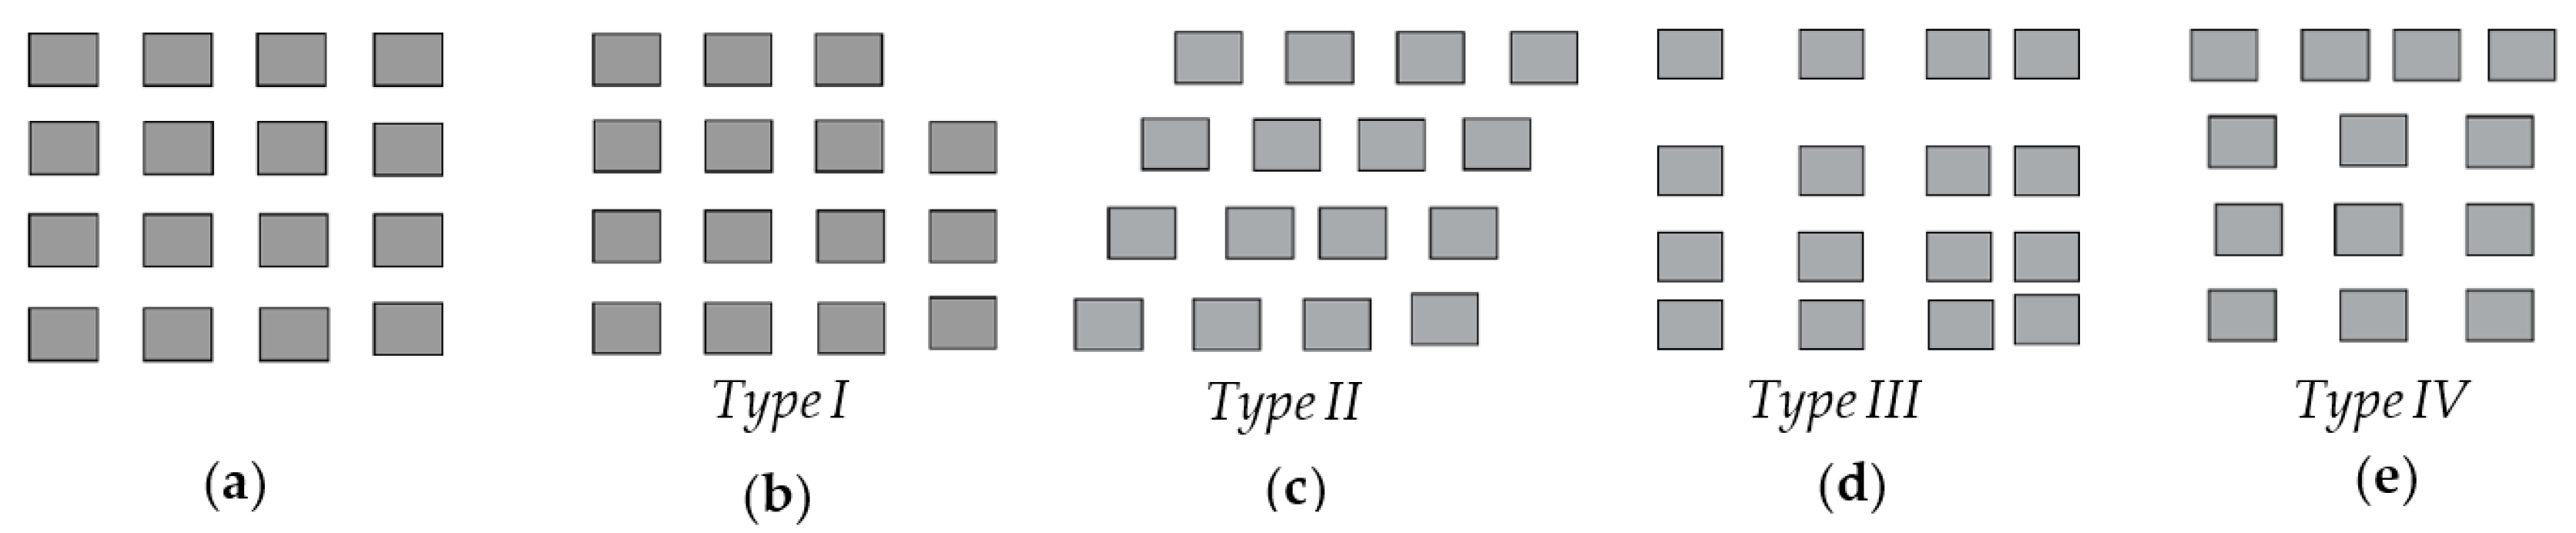
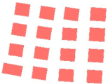
A perfect grid pattern denotes that the buildings are arranged with equidistant horizontal and vertical forms and are equalized in terms of the amount in each row and column (Figure 1a). The perfect grid pattern normally contains n rows and m columns, which has the distribution form of n × m. The number of buildings in each row and column is the same. A grid-like pattern denotes that the buildings are visually like a perfect grid pattern, but without meeting the above three constraints. There are some typical cases where building groups are presented in grid-like patterns. As shown in Figure 1b–d, the Type I building group violates constraint C3, the Type II building group does not meet constraint C2, and the Type III building group violates constraint C1. Therefore, these three building groups do not have a perfect grid pattern, but rather grid-like patterns. Some building groups may violate all three constraints, but still look like grid patterns. For example, in Figure 1e, the Type IV building group does not meet constraints C1, C2, and C3; however, in this situation, it also visually emulates a grid-like pattern. Grid-like patterns are more common than perfect grid patterns in the real building dataset.
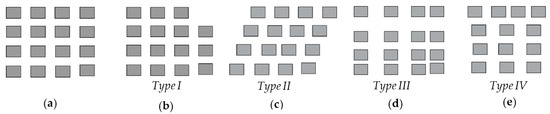
Figure 1.
Classification of grid patterns: (a) perfect grid pattern; (b–e) typical types of grid-like patterns.
3.2. Mesh Generation
Since the proposed typification method is mesh-based, generating meshes is the first step. The mesh is derived from the buildings’ proximity graph. In general, constrained Delaunay triangulation (CDT) is used to generate the proximity graph. CDT is preprocessed by removing the triangles which connect three buildings, which aims to avoid generating too many edges in the proximity graph. Afterward, the two buildings which are connected by the same triangle are detected as proximal, and their centroids are connected by a proximal edge. These edges form the proximity graph. Although the preprocessing eliminates some redundant proximal edges, it cannot guarantee that all the proximal edges are generated appropriately. For the above reason, the facing ratio index is calculated between two proximal buildings to further refine the proximity graph. The facing ratio reflects the facing degree of two buildings [34]. The buildings with a higher facing ratio denote that they are more visually homogeneous. To quantitatively calculate the facing ratio, Equation (1) was developed by measuring the projection overlap length of their oriented bounding box (OBB). As Figure 2 shows, the building’s OBB has a major axis and a minor axis, such that a coordinate system can be formed by the two axes. The two buildings are projected into their four coordinate axes. If ProLength(A) and ProLength(B) are the projection lengths of building A and building B on axis XA, the facing ratio of the two buildings on axis XA is calculated by Equation (1).
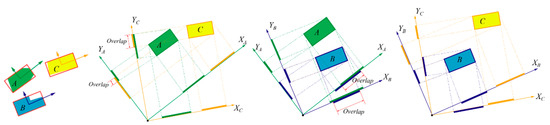
Figure 2.
Facing ratio calculation.
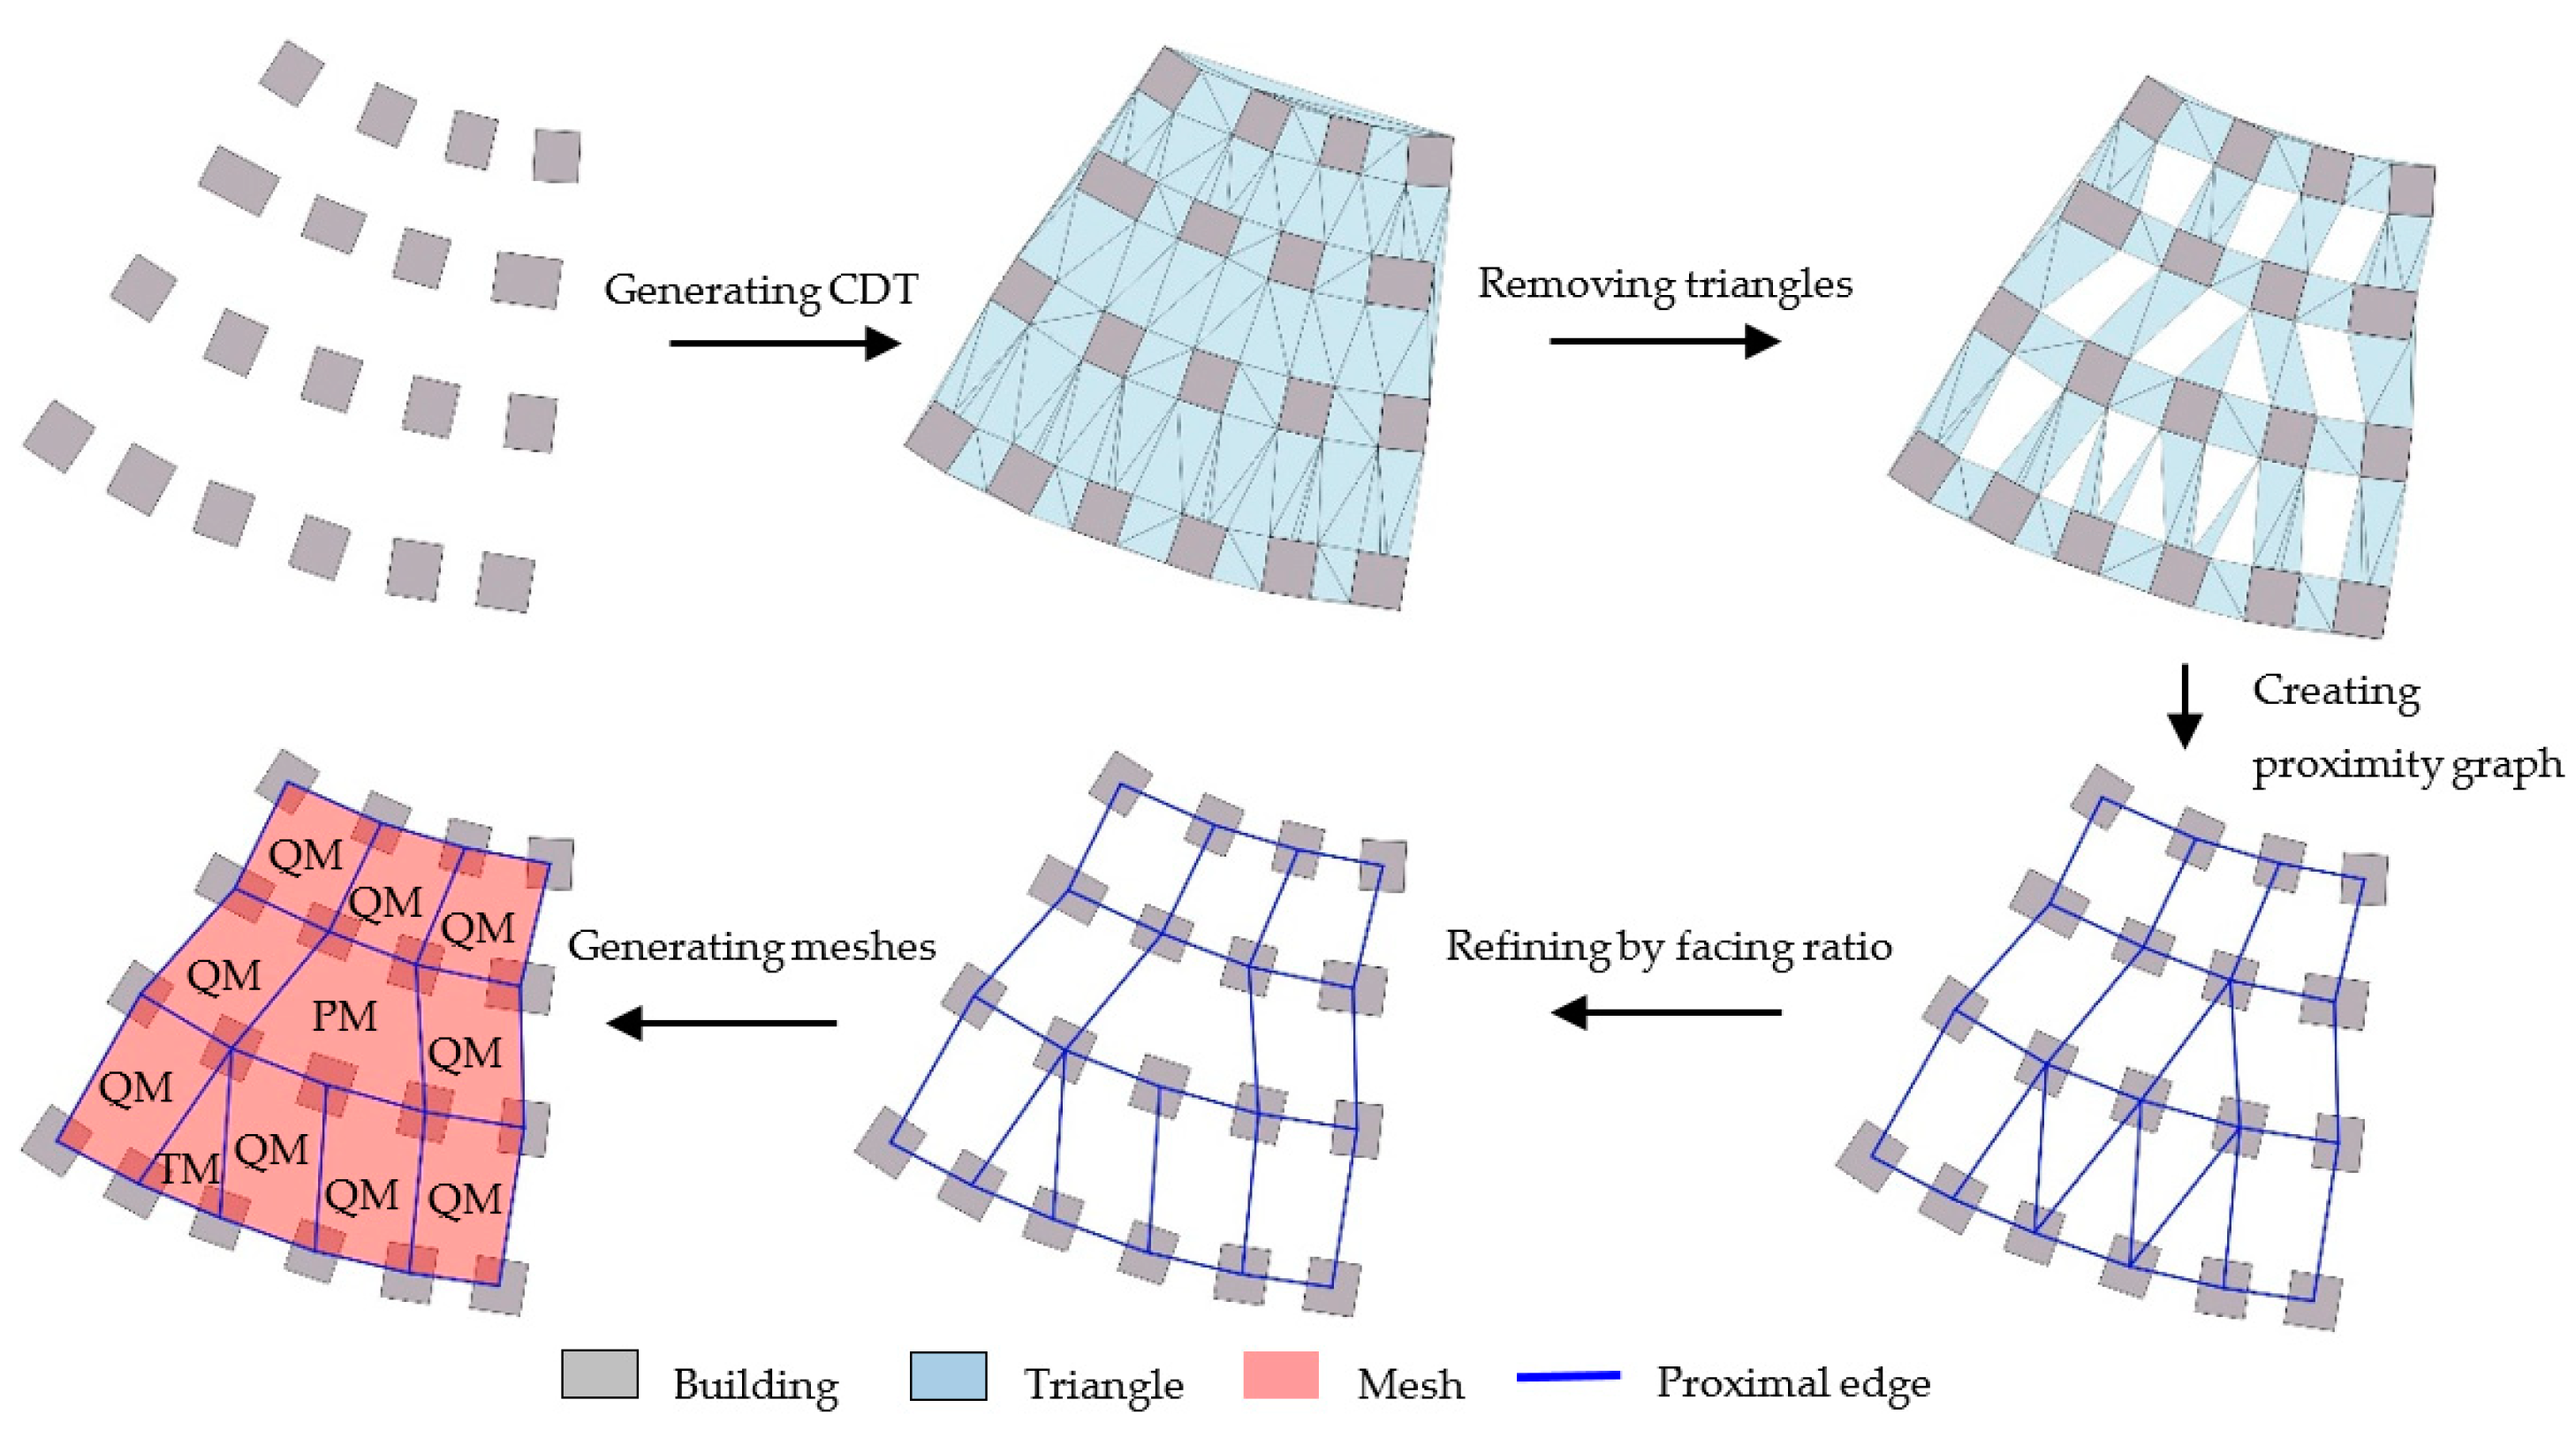
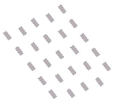
In the same way, another three facing ratios on the other three axes (YA, XB, and YB) are also calculated; thus, the maximum facing ratio between building A and B can be obtained. The larger the maximum facing ratio is, the higher the facing degree of the two buildings is. The examples in Figure 2 show that building A faces buildings B and C, but buildings B and C do not face each other. Moreover, the maximum Facing_ratioAB is larger than the maximum Facing_ratioAC. In our study, if the facing ratio between two buildings is equal to zero, i.e., the two buildings do not face each other, as a result, the corresponding proximal edge will be removed from the two buildings. Within the refined proximity graph, the mesh is generated. This mesh denotes the spaces in networks. Here, the refined proximity graph is regarded as a network, while the mesh is defined as the closed region, bound by several proximal edges and without any other regions. After generating meshes from the buildings, the meshes are classified into three types by determining the number of the composed proximal edge: triangular mesh (TM) with three proximal edges, quadrangular mesh (QM) with four proximal edges, and polygonal mesh (PM) with more than four proximal edges. The overall process of generating the meshes from the buildings is displayed in Figure 3.

Figure 3.
Mesh generation process (in last graph, TM: triangular mesh; QM: quadrangular mesh; PM: polygonal mesh).
3.3. Triangular Mesh Elimination
In some grid-like patterns, because of their non-perpendicular distribution and different building numbers between rows and/or columns, some triangular meshes will be generated, which are not beneficial for the further typification steps. Thus, with the aim of generating high-quality typification results, the TMs should be eliminated through the merging process. Afterward, only QMs and/or PMs will remain. The merging process is described below.
The neighboring (with common boundary) triangular meshes should be detected first, which will form triangular mesh clusters (TMC). These TMCs include the following possibilities:
Situation (1): For a one-TM cluster (ITMC), only one TM should be merged with its smallest neighboring QM (Figure 4a); if there is no neighboring QM, it should be merged with its smallest neighboring PM (Figure 4b);
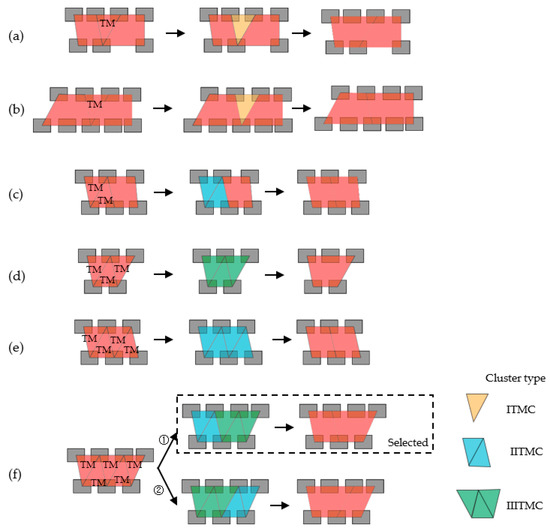
Figure 4.
Rules of eliminating triangular meshes: (a,b) merging single triangular mesh; (c–f) generating triangular mesh clusters (TMCs).
Situation (2): For a two-TM cluster (IITMC), the two neighboring TMs should be merged into one QM (Figure 4c);
Situation (3): For a three-TM cluster (IIITMC), the three neighboring TMs should be merged into one PM (Figure 4d);
Situation (4): A cluster with more than three TMs can be regarded as the combination of IITMC and IIITMC. Then, the next merge process is the same with Situation (2) and Situation (3). For example, a four-TM cluster can be regarded as two IITMCs (Figure 4e), and a five-TM cluster can be regarded as one IITMC plus one IIITMC (Figure 4f). To summarize, the nTM cluster can be regarded as the combination of several IITMCs plus one IIITMC (as appropriate). The specific calculation is based on Equation (2).
where n denotes the number of TMs in the cluster, and int() means the integer value. When n is an odd number and larger than three, there exists different combinations of IITMCs and IIITMCs. In the example in Figure 4f, the cluster contains five TMs, and, based on Equation (2), this cluster can be regarded as one IITMC plus one IIITMC. However, there are two arrangements. Based on the study rules, the IITMCs are firstly formed; after that, the last three TMs will be formed into one IIITMC. In theory, the number of TM clusters can change from one to infinity. However, in reality, there exist few TMs after generating the meshes, because the possibility of generating TMs is reduced by the previous steps, i.e., removing triangles connecting three buildings, and using the facing ratio to refine proximity graph. The above process makes sure that all triangular meshes are eliminated.
3.4. Number and Positioning of Typified Buildings
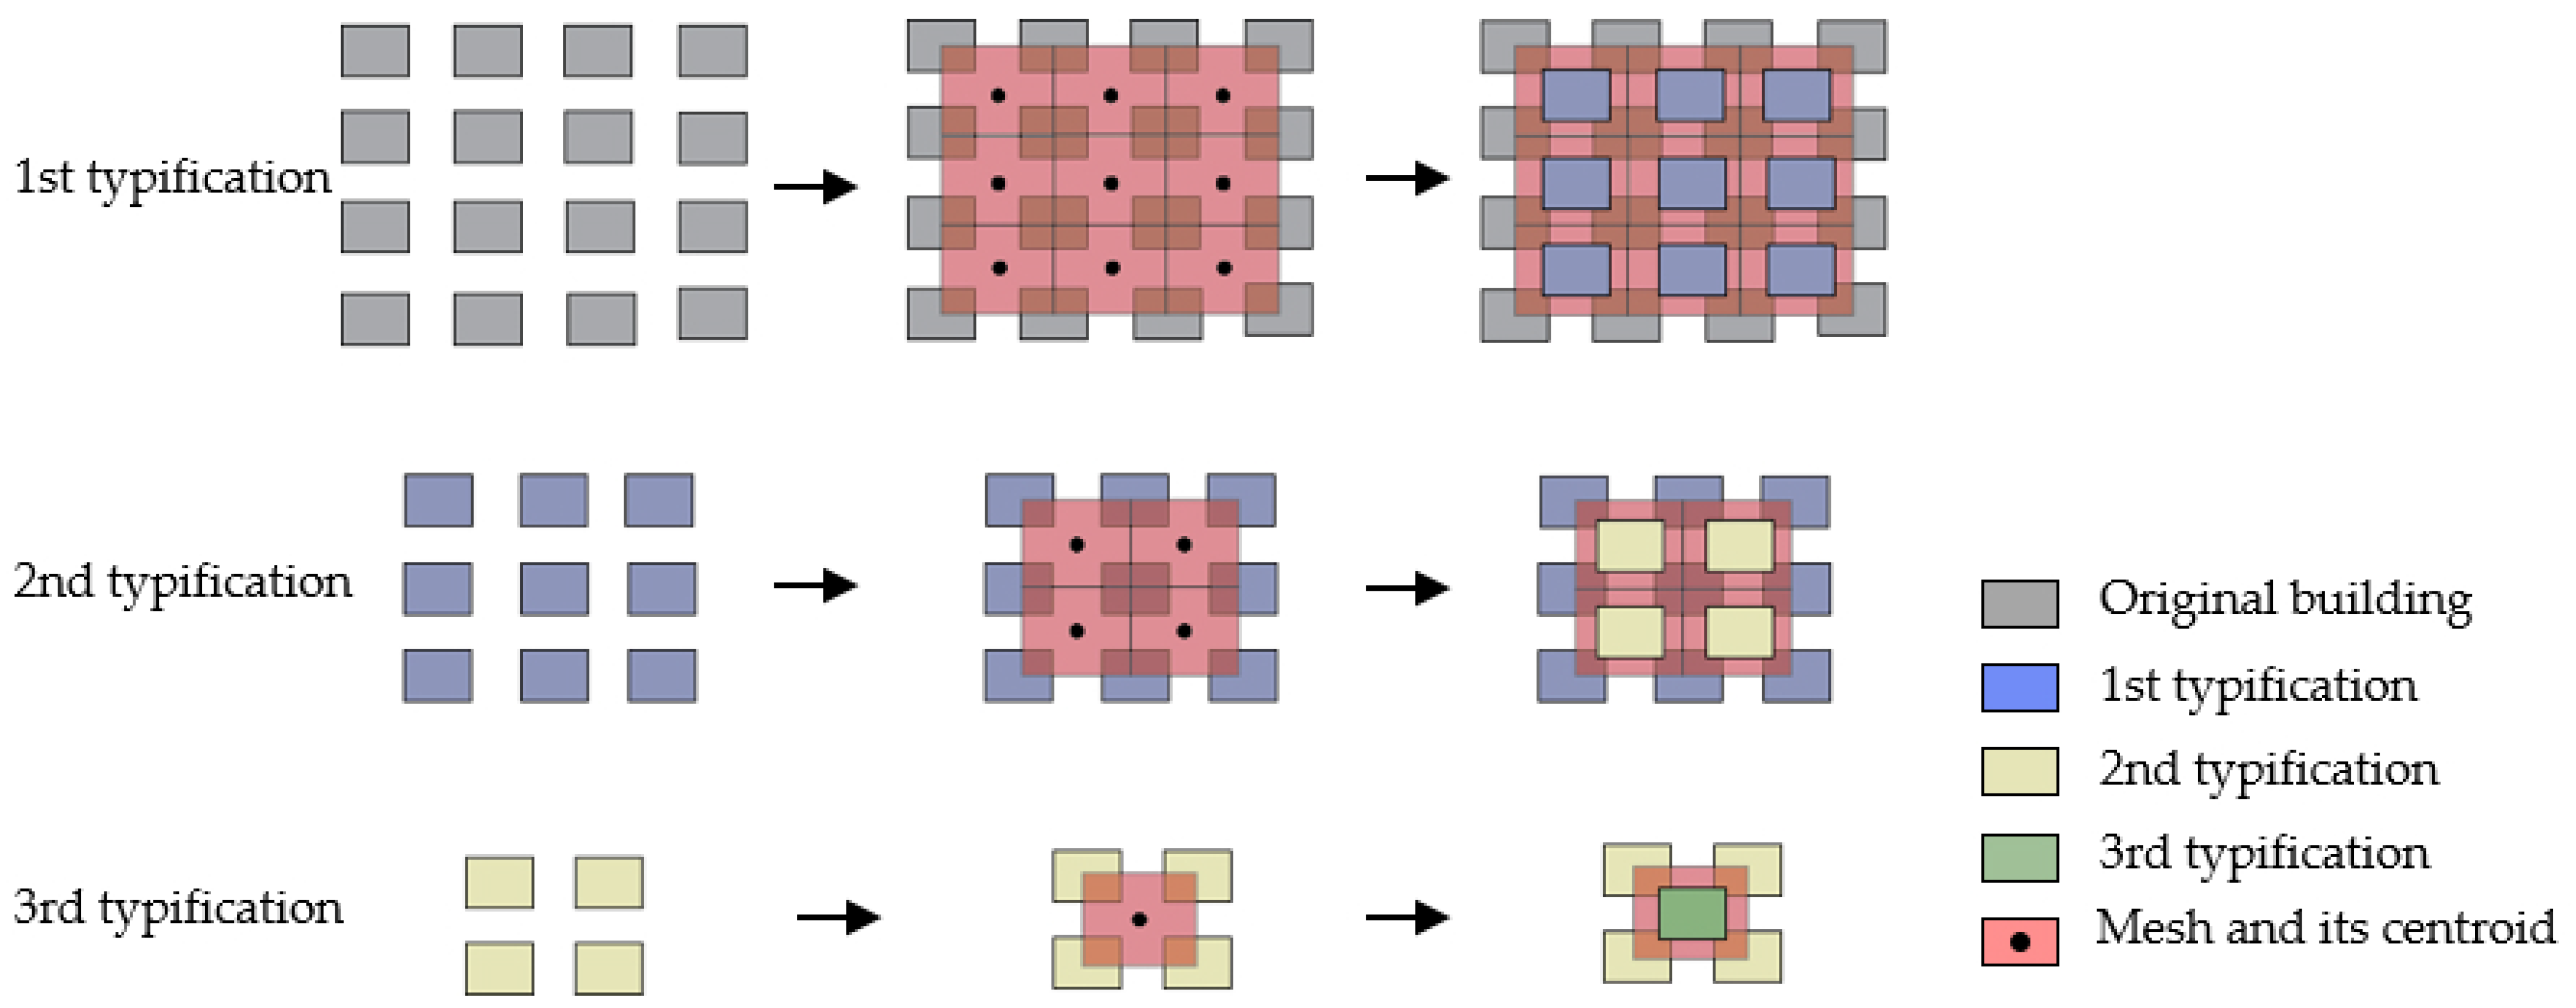
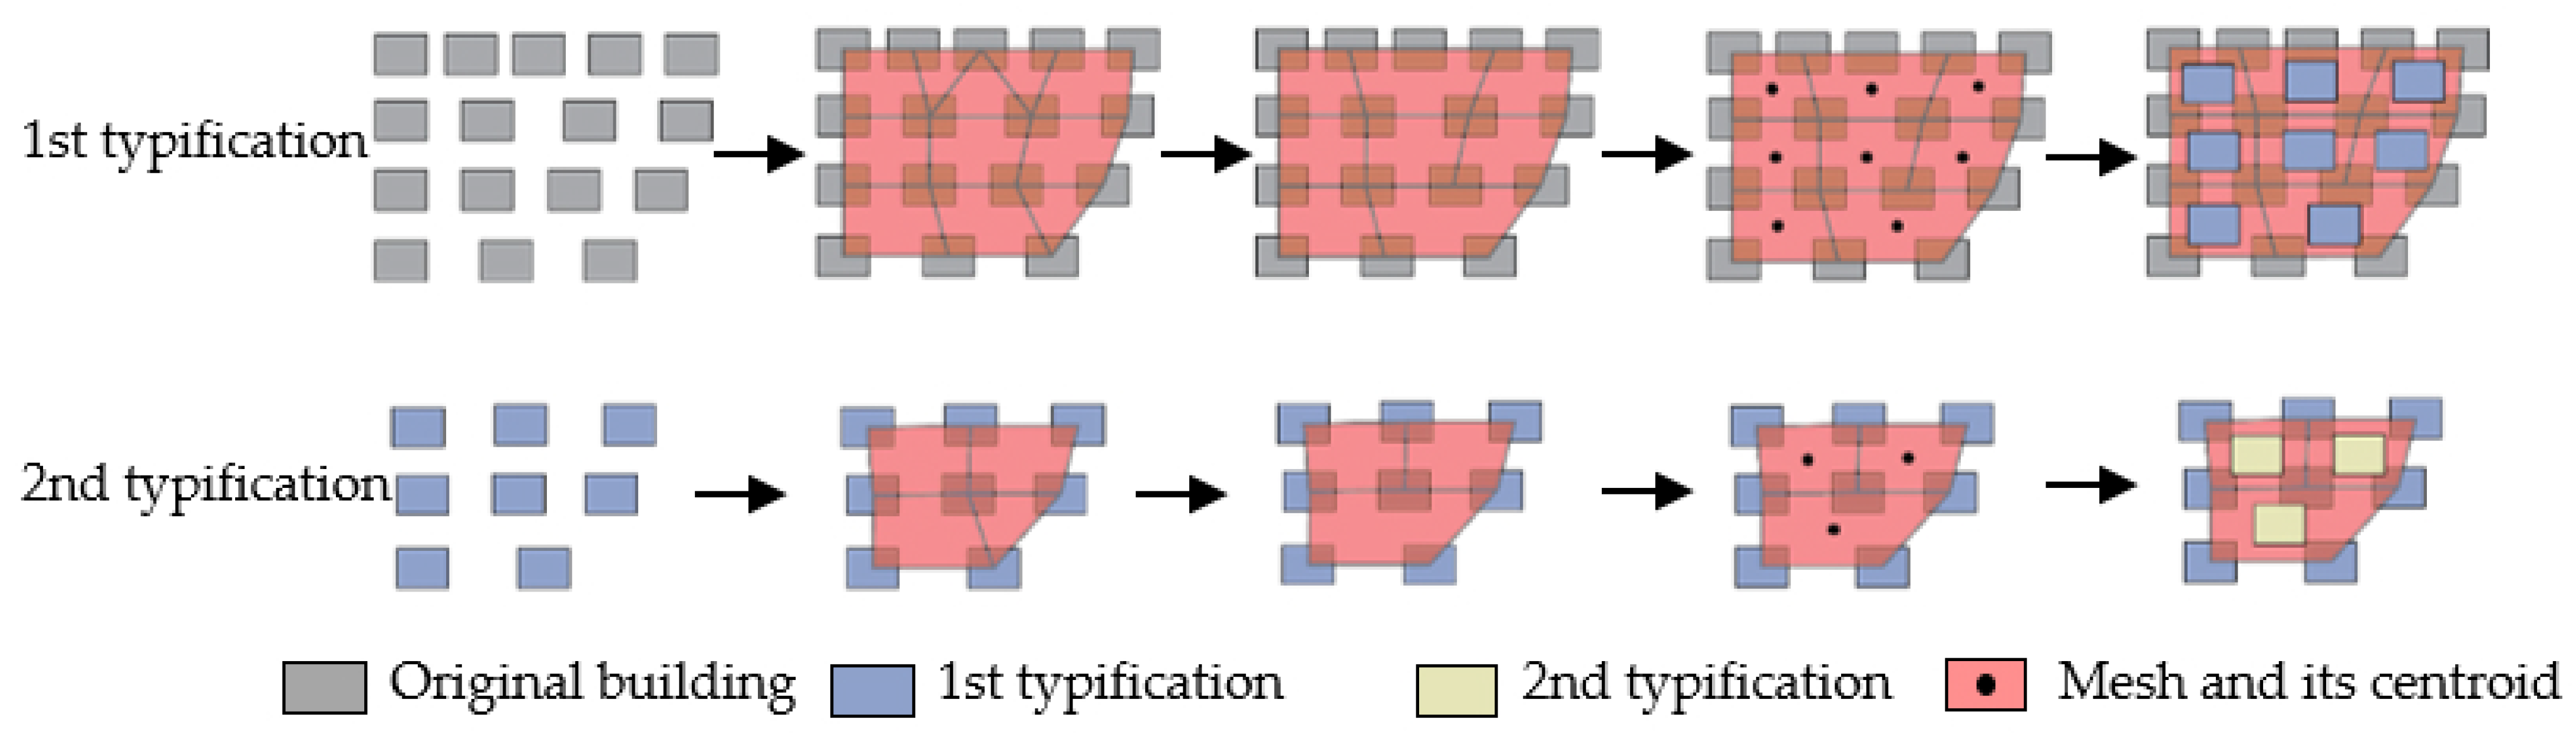
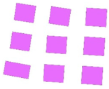
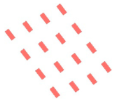
From the previous work of building typification, three issues must be solved to produce the typified buildings: the number, the positions, and the representations of the newly created buildings. The proposed typification strategy uses the meshes as the auxiliary data structure to determine the number and positions of the newly created typified buildings. The typified building number is equal to the mesh number, i.e., only one new building will be created in its corresponding mesh. The centroid position of the mesh is considered as the centroid of the newly created building. Figure 5 shows the iterative process of determining the number and positions of typified buildings in perfect grid patterns. The original perfect grid pattern has a 4 × 4 structure; after the first typification, the structure becomes a 3 × 3 structure. Based on the newly created buildings, new meshes are generated again. If the typification is implemented a second time guided by the same rule, the structure becomes 2 × 2. The rest can be done iteratively in the same manner. The end condition of the iteration is that the remaining typified buildings can no longer generate meshes.
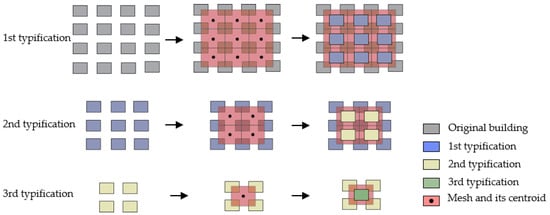
Figure 5.
Typification process of determining number and position in a perfect grid pattern.
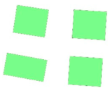
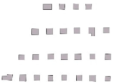
For grid-like patterns, the process of determining number and position is generally the same as with a perfect grid pattern, but with an extra step of eliminating triangular meshes (Figure 6). The end condition of iteration for a grid-like pattern is that the remaining buildings can no longer generate quadrangular meshes or polygonal meshes.
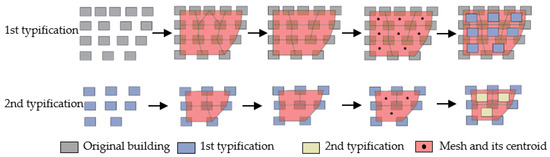
Figure 6.
Typification process of a grid-like pattern.
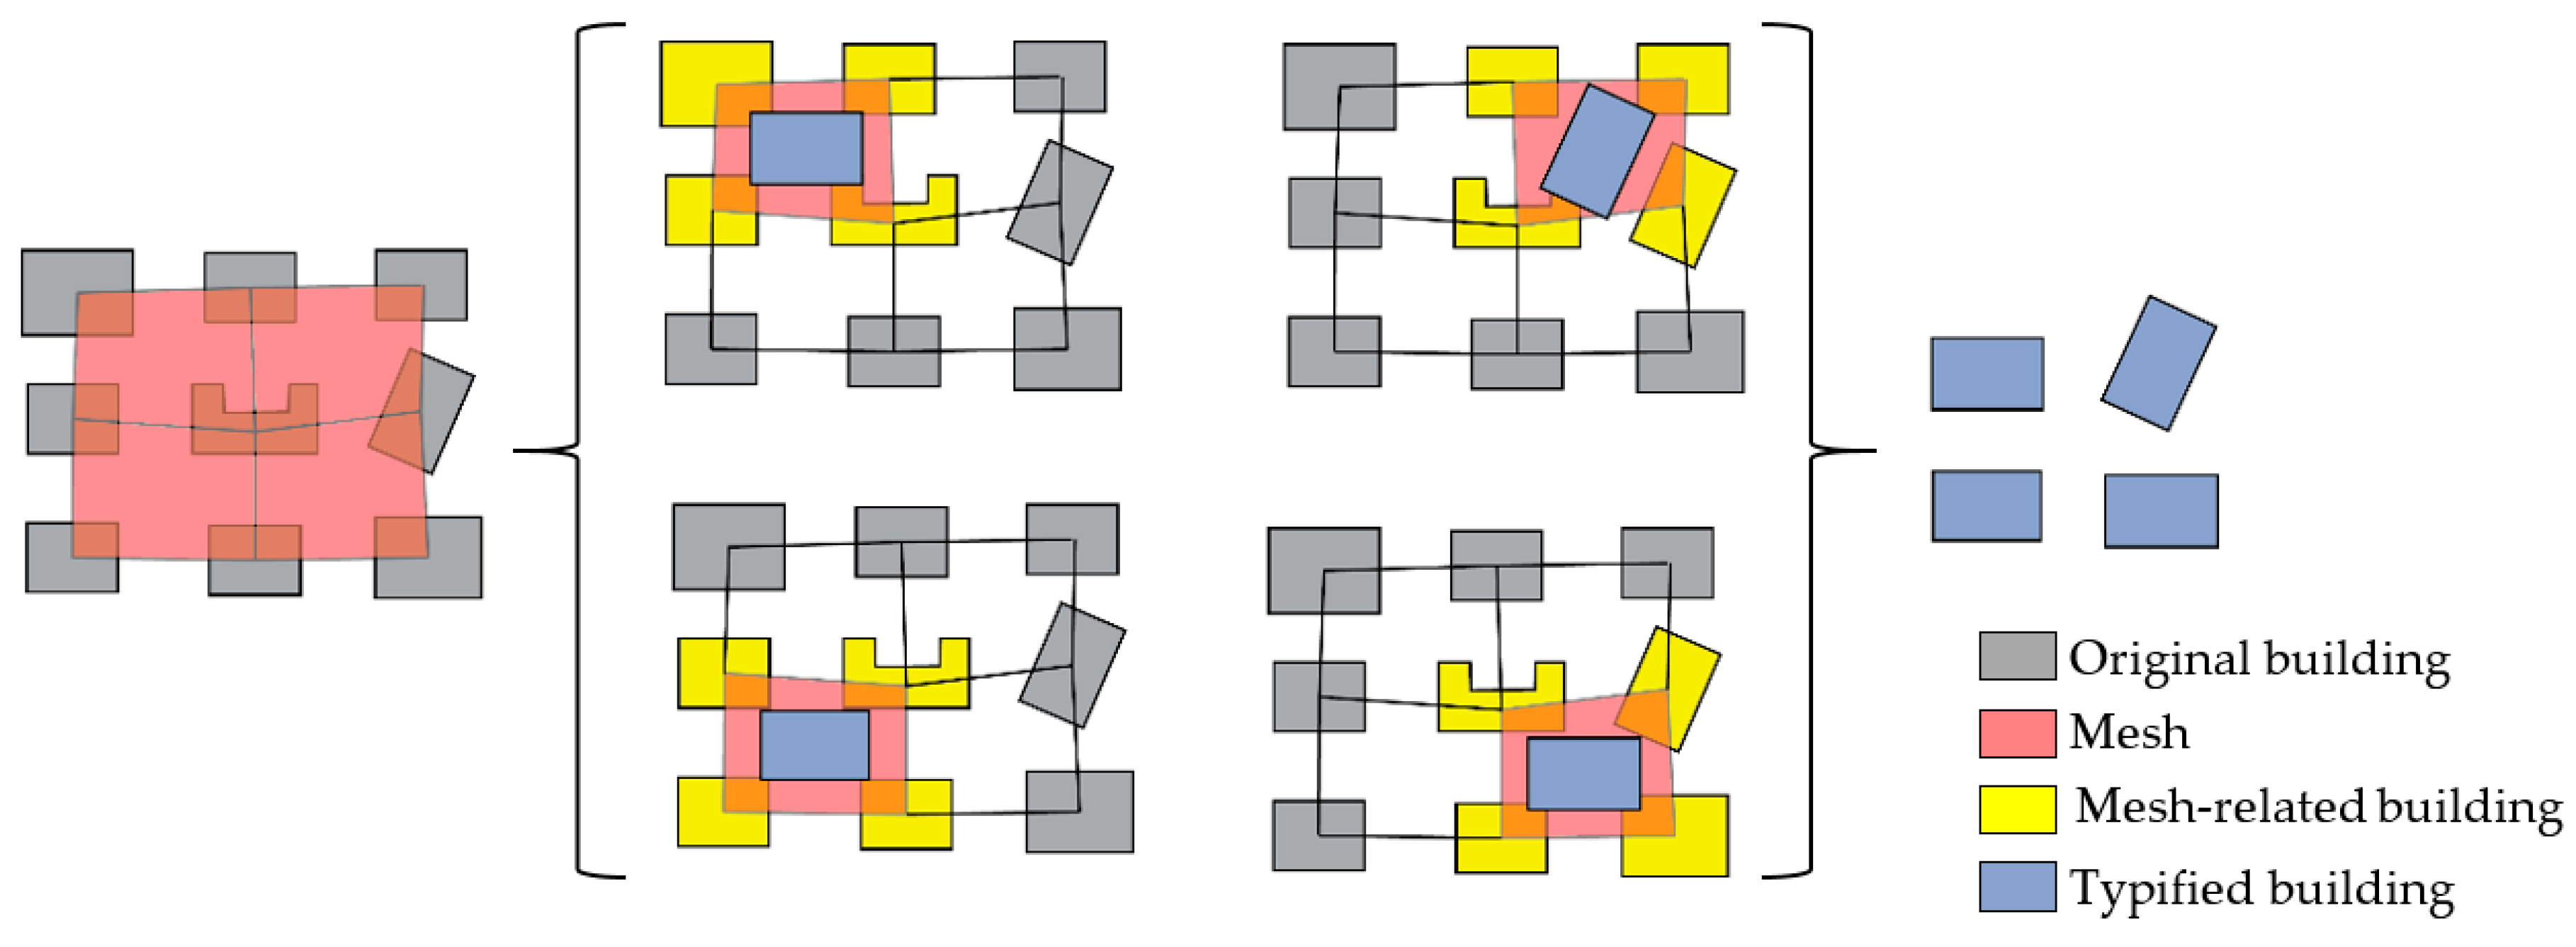
3.5. Representation of Typified Buildings
After determining the number and position of the typified buildings, another important issue is to determine the representations of the newly created buildings. From the above positioning process, the centroid location of the newly created building is determined, in addition to another four indicators (size, shape, elongation, and orientation); then, the newly typified building can be uniquely determined and created. These four indicators of the newly typified building are calculated based on its related original buildings. The related buildings are determined by the corresponding mesh. The determination of the four indicators is described as follows:
(1) Size. The size is represented by the building area. Here, the average area of the mesh-related buildings is regarded as the area of the newly typified building. The area of the newly typified building Ᾱ is calculated using Equation (3).
where An is the area of the mesh-related buildings, and n is the number of mesh-related buildings.
(2) Shape. For the shape of the typified buildings, we regard all the typified buildings as having a rectangular shape. With the scale becoming smaller, most buildings are strongly simplified with fewer details to meet the minimum separability distance. In the context of web mapping, the minimum separability distances are more severe because of the coarse display resolution. In most situations, the buildings are simplified into a rectangular shape. Moreover, the buildings with perfect grid patterns or grid-like patterns, normally located in the residential suburban areas or rural areas, except for shopping malls or industrial buildings, which have complex outlines, are represented as rectangles on maps. For the above reasons, the shape of the newly typified buildings is determined to be rectangular [35,36].
(3) Elongation. Although the issue of shape and size is now solved, the newly created building cannot be determined uniquely, because it is necessary to give an elongation value to the newly created building. Considering the contextual information and effects of visual perception, the elongation value of the largest mesh-related building is chosen as representative. The building with the largest area can be regarded as the most representative building among the mesh-related buildings because it is more outstanding in presentation than other smaller ones; thus, its elongation can represent the characteristics of the related context.
(4) Orientation. The orientation of the newly created building is also determined by the largest mesh-related building. By calculating the deviation angle between the major axis of the building’s oriented bounding box (OBB) and the horizontal direction, the orientation value of the newly created building is determined. The reason for choosing the largest mesh-related building as representative is the same as with elongation. Visually, the largest mesh-related building gives the most impressive feeling to a map reader. Therefore, the largest one has a dominant status in its related context.
With the above four indicators and the centroid location, the newly typified building can be created uniquely. Figure 7 is a conceptual graph to show the process of determining the representations of the newly typified buildings based on meshes. As shown in Figure 7, the geometry information of the newly typified buildings is derived from the original mesh-related buildings. The original building which has a larger size will dominate the orientation and elongation of the typified building. This strategy is in accordance with the visual perception.
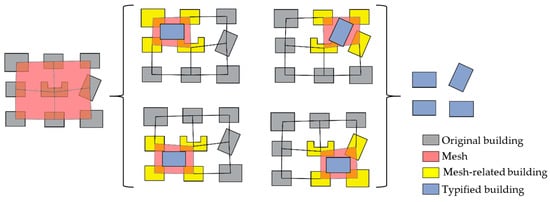
Figure 7.
Representation determination of newly typified buildings.
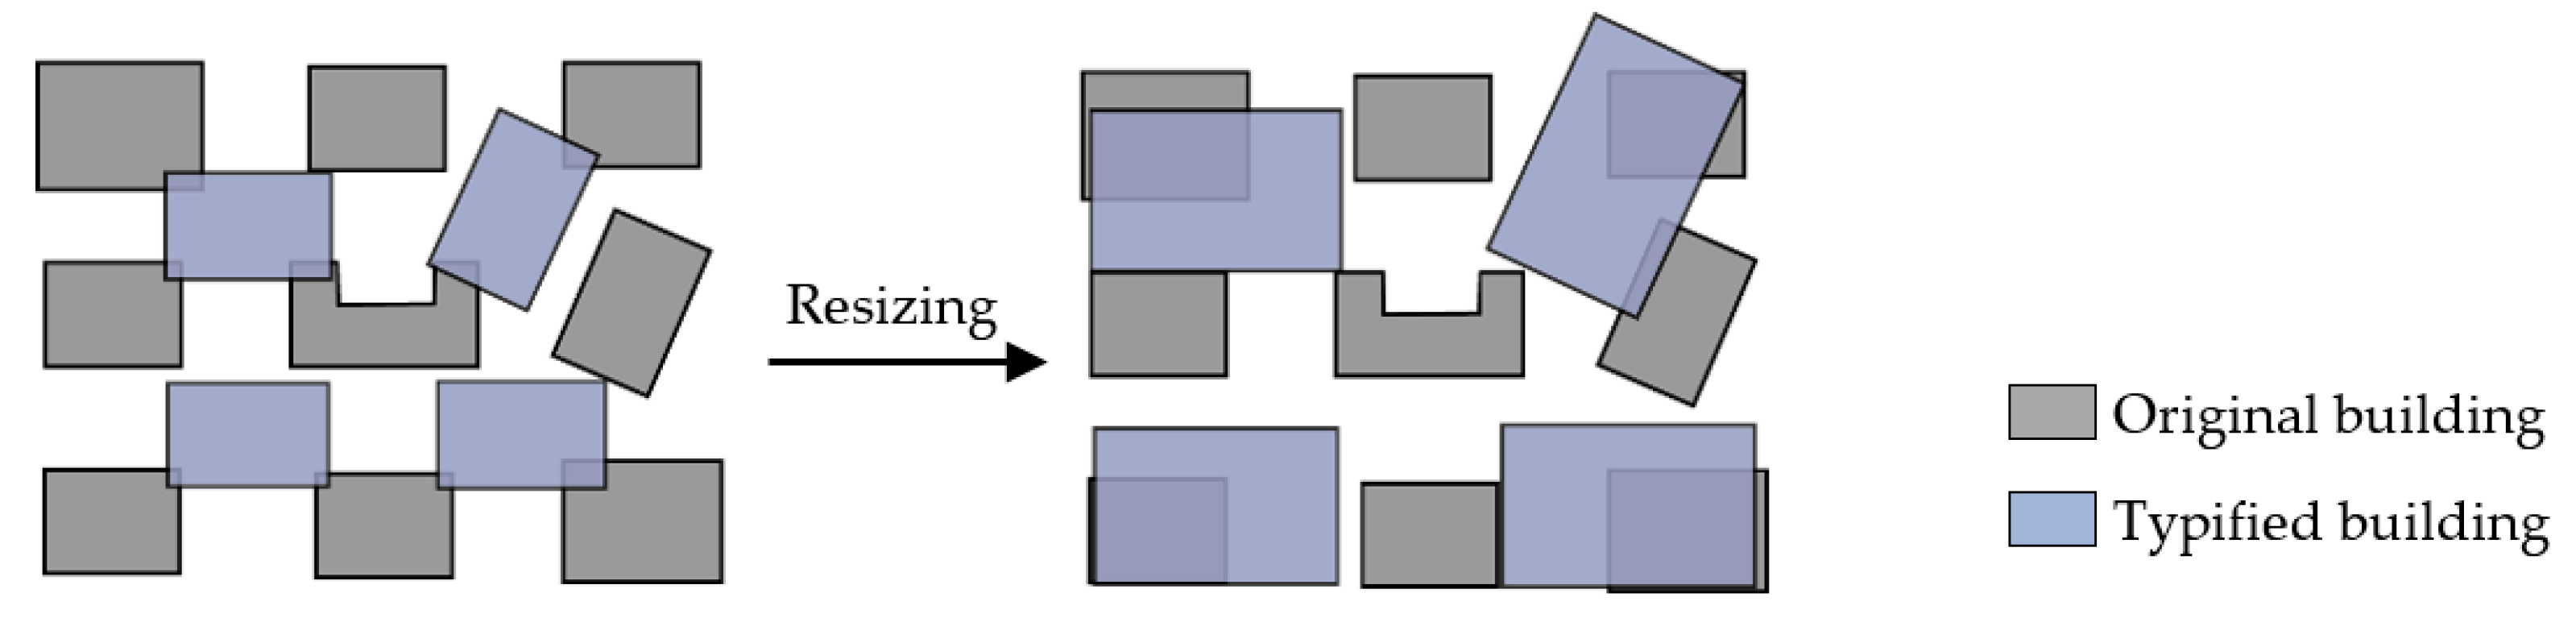
3.6. Resizing Newly Typified Buildings
The number of newly typified buildings must be reduced after typification; thus, the total area of the building group is decreased. To keep the total area consistency of the buildings, the newly typified buildings should be resized. As shown in Figure 8, the resizing process takes the center position of the newly typified buildings as the origin and proportionally enlarges the newly typified buildings with the resizing factor F. The resizing factor F is calculated using Equation (4).
where AO denotes the total area of the original buildings in the group, and AT is the total area of the newly typified buildings.
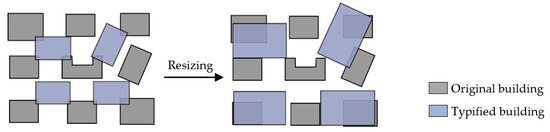
Figure 8.
Resizing of the newly typified buildings.
4. Experiments
4.1. Data Derivation
To verify the effectiveness of the proposed typification method, we carried out some experiments. Two datasets were chosen from OpenStreetMap (OSM).
(1) Dataset I: isolating building groups
We manually selected several isolating building groups with perfect grid patterns and grid-like patterns from the suburban and rural areas in Dresden, Germany (See Table 1). The selected building groups were divided into five pairs, numbered with A1, A2, B1, B2, C1, C2, D1, D2, E1, and E2. Each pair had similarity in distribution and in number of buildings. In the selected building groups, A1, A2, B1, B2, C1, and C2 were common building groups with reasonable building amounts, while D1, D2, E1, and E2 were special building groups because only parts of their patterns were grid-like. Moreover, these four groups had a large amount of buildings, and their coverages were also larger than normal. The purpose of selecting such groups was to test the universality of the proposed typification method.

Table 1.
Typification results of building groups.
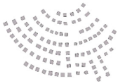
(2) Dataset II: building groups from an entire village
The second part of the test dataset involved a whole village named Akarp, from the rural area in Lund, Sweden (See Figure 8). This region contains many outstanding perfect grid and grid-like patterns. Based on the results of manual detection, the whole region contains eleven grid pattern building groups, which were numbered from G1 to G11. For the remaining buildings, because they do not present like grid or grid-like patterns, they were not considered and they remained untouched after generalization.
4.2. Typification Results and Evaluation
(1) Dataset I
The selected building groups contained various types of grid and grid-like patterns in order to show the universality of the proposed typification method. To get the gradual typification results, the proposed typification method was applied to the building groups in Dataset I with three iterations. The three iterative typification results are shown in Table 1. Overall, the typification results were satisfactory, since they could keep the characteristics of the original gird or grid-like distributions. A detailed evaluation is described in the next paragraphs.
Groups A1 and A2 were almost typical perfect grid patterns with a regular grid distribution in each row and column. The typification results preserved this regular distribution well. The lower left building in A1 was quite outstanding in size and elongation compared with the others. The local characteristic of this group was also kept in the iterative typification results. Groups B1, B2, C1, and C2 were grid-like patterns, whereby the number of buildings was different in each row or column, and the distributions were not always perpendicular within rows and columns. The first and second typification results kept this uneven distribution. The difference in building amounts between rows or columns was also presented in the typified buildings, and the total building amounts decreased gradually. Groups D1, D2, E1, and E2 were special grid-like patterns which contained more buildings and had larger coverage areas. From the results, it was found that global distributions could be preserved, as well as the local characteristics. For example, Groups D1 and D2 had triangular-like outlines in the distribution, while Groups E1 and E2 had a circular sector and rectangular global shape, respectively. In the typification results, their global outline shapes kept the same consistency as the original. The original local characteristics were also reflected in the typification results, such as the local difference in building amounts and the uneven distribution.
There were also some weaknesses in the third typification results of Groups B2, C1, E1, and E2, which lost some characteristics. The main reasons were as follows: after the previous two typifications, the newly created buildings no longer belonged to grid-like patterns; thus, if the proposed typification strategy was still applied, it would not get satisfactory results. Therefore, after every iteration, the newly created buildings should be checked to see whether they still present grid-like patterns. If not, the iteration process should be stopped, and, for further generalization, the selection of other appropriate operators could be a better solution.
(2) Dataset II
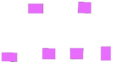
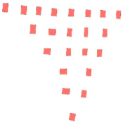
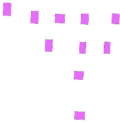
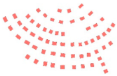
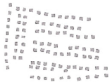
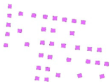
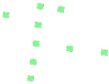
For the detected building groups in the village of Akarp, the typification method was implemented two times, with the first and second typification results displayed in Figure 9, overlapping with the original ones. Overall, the results are visually satisfactory. The characteristics of the original grid patterns are reflected in the typification results.
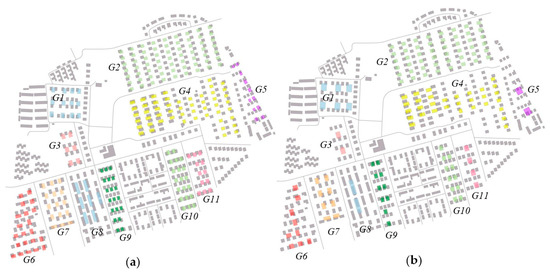
Figure 9.
Overlapping typified buildings with original buildings: (a) first typification; (b) second typification.
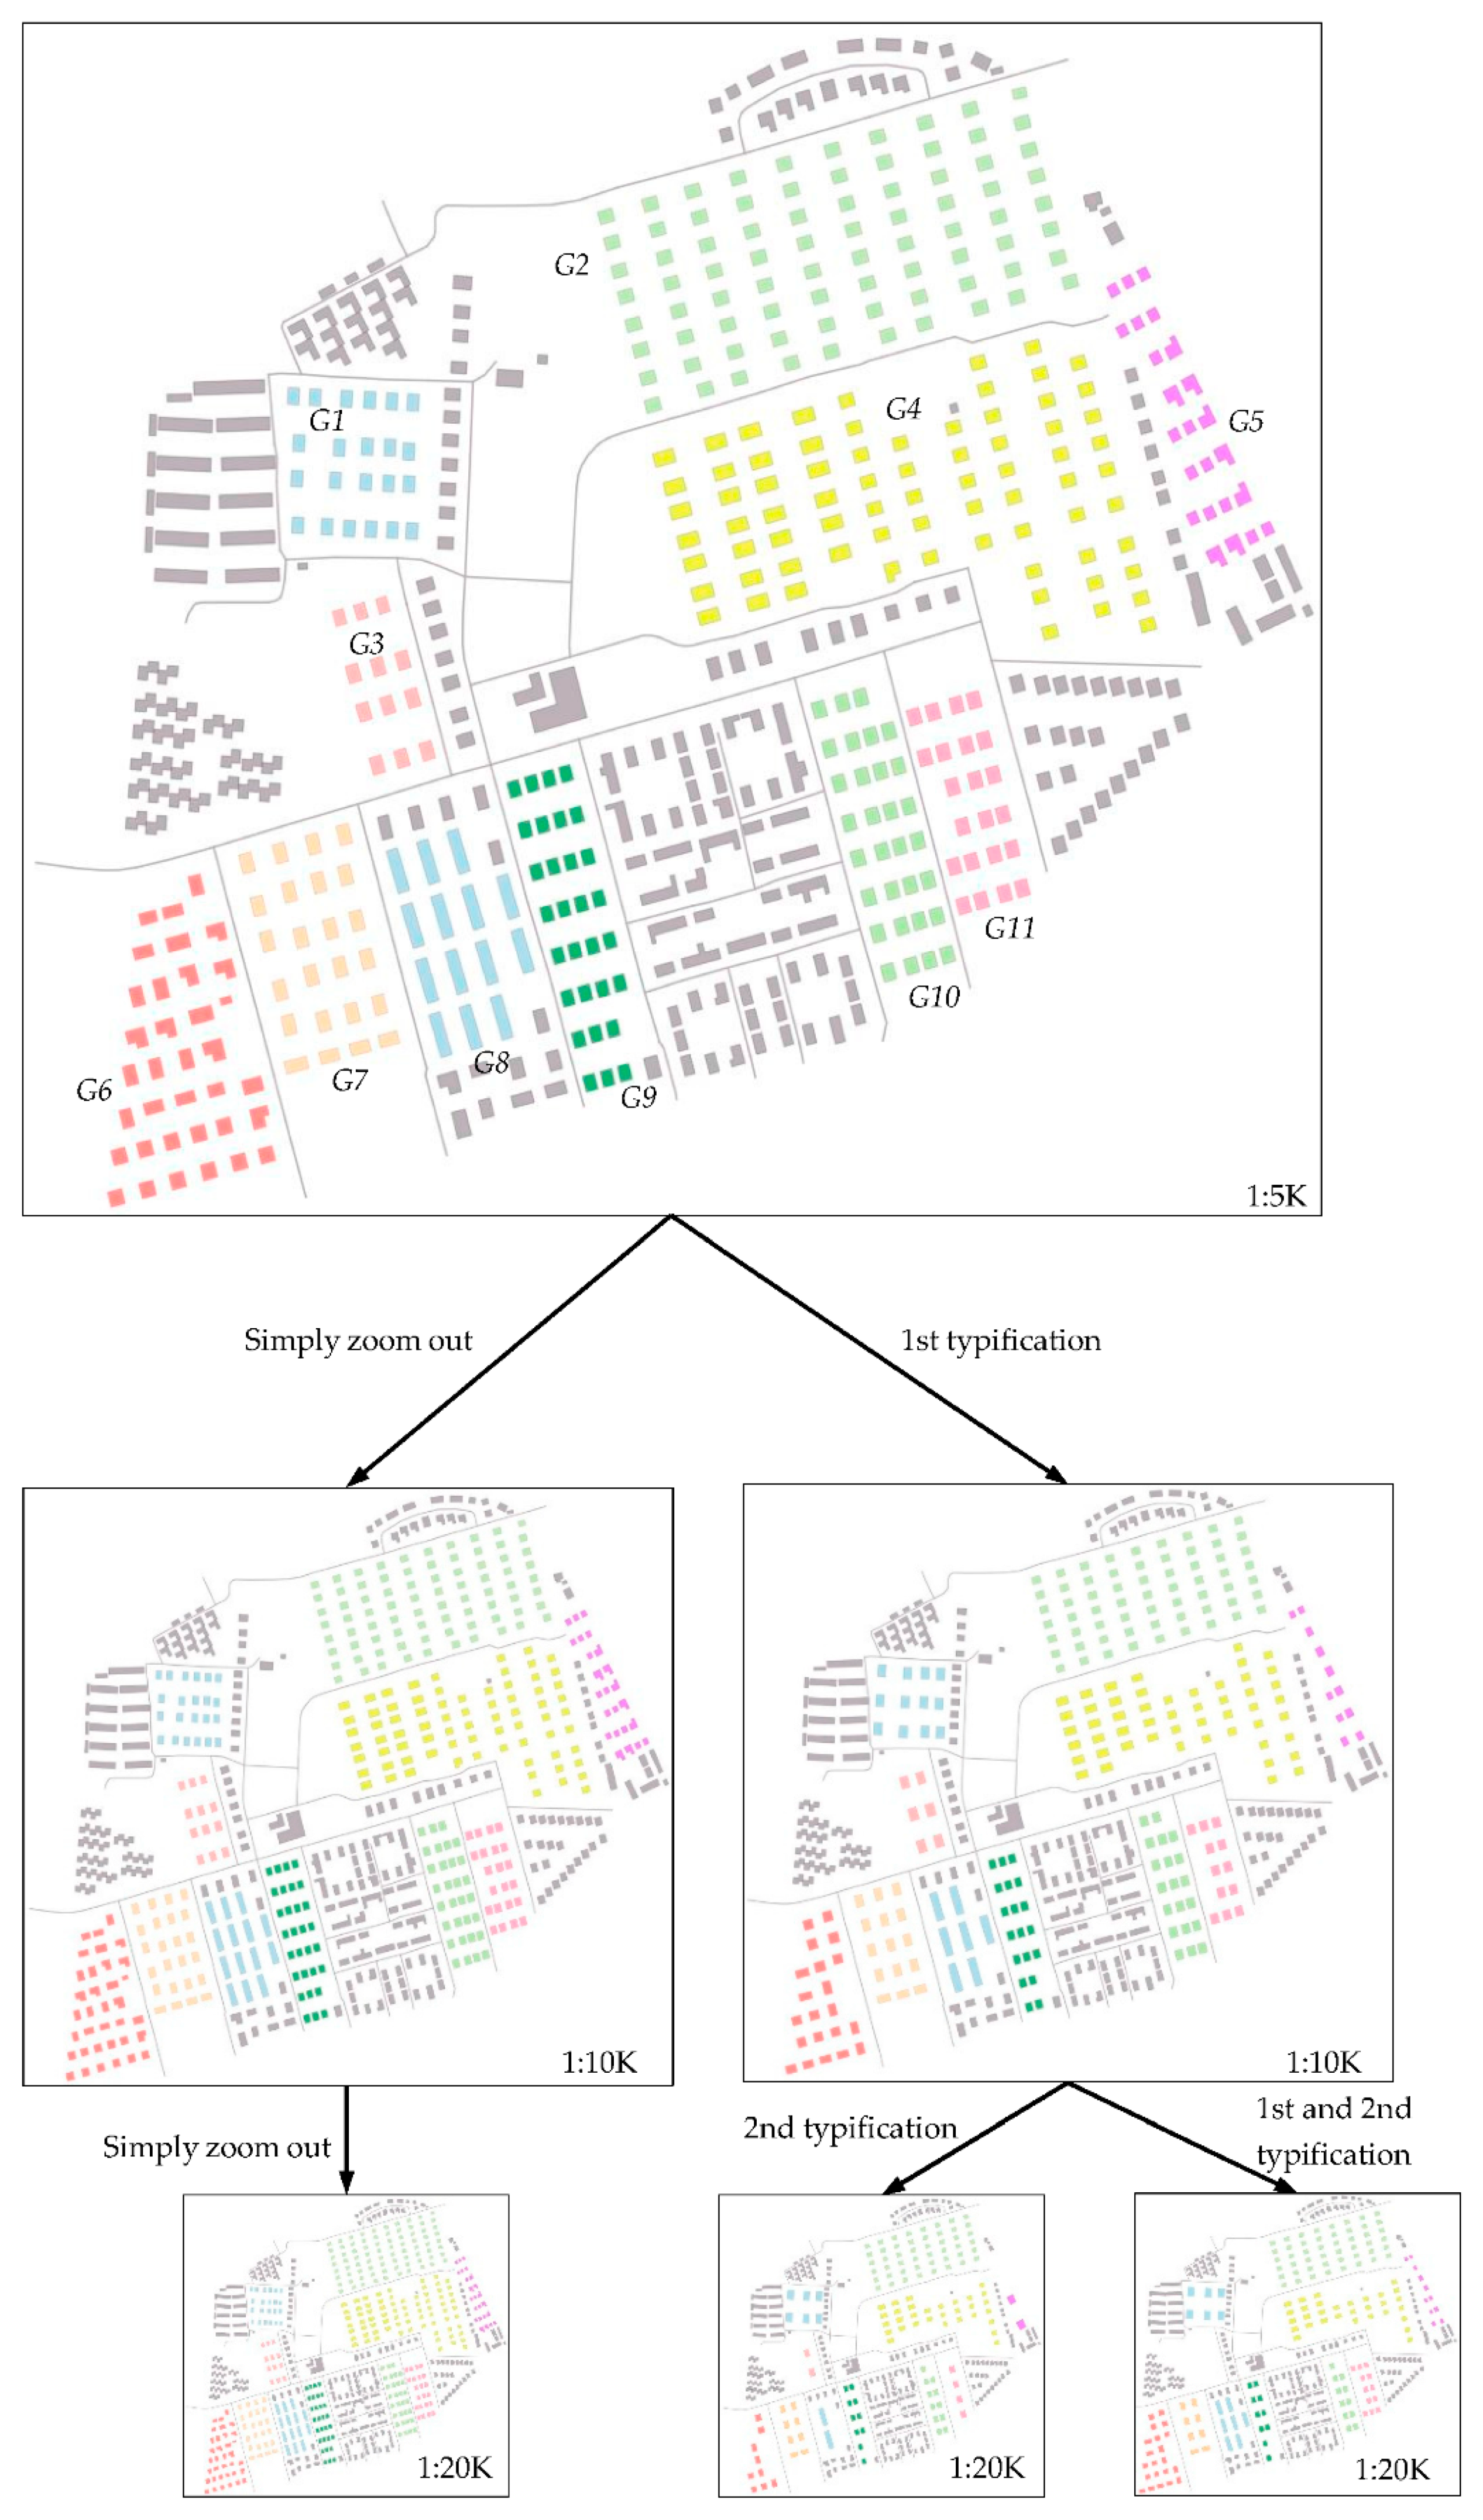
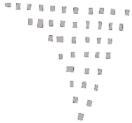
Figure 10 shows a comparison between the building groups with generalization (typification) and simply zooming out on smaller-scale maps. From the comparison, it is obvious that, due to scale reduction, the buildings shrank which led to congestion problems. The buildings are not easy to recognize; thus, the legibility of the map becomes lower. Thus, just simply zooming out the map is not a good way to represent the buildings on a smaller-scale map. On the contrary, when the first typification results were used to replace the original buildings on a scale of 1:10,000, the readability of the map improved. The original perfect and grid-like patterns in different building groups were also kept with the reduced building amounts. In the smaller scale of 1:20,000, if the original buildings were all replaced by the second typification results, there existed some deficiencies. For example, Groups G3, G5, and G8 had only two buildings left, which created an unbalanced distribution on the map. Groups G6 and G11 lost their original patterns, due to the same reason as above, whereby, after the first typification, G6 and G11 no longer presented grid or grid-like patterns; thus, it was not appropriate to use the proposed typification method to generalize them, and using another operator would be a better solution. Therefore, for different groups, the iteration time of typification should be considered differently based on the group size and building number. Therefore, it was better to use the first typification results for groups G3, G5, G6, G8, and G11, and the second typification results for groups G1, G2, G4, G7, G9, G10, and G12. As shown in Figure 10, the building groups with mixed first and second typification results seems more reasonable on the map.
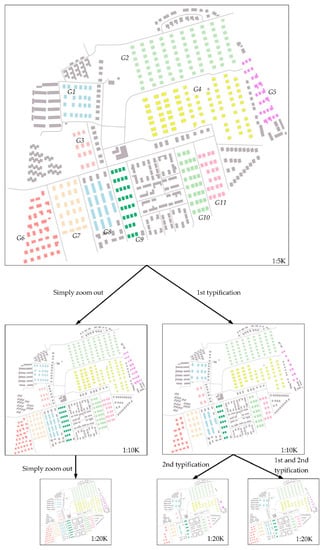
Figure 10.
Comparison between simply zooming out and typification in different scales.
4.3. Comparison with Official Map
The typification results of some selected building groups were compared with the corresponding generalization results in the official map. The official map was derived from the State Enterprise Geobasis information and Surveying of Saxony (GeoSN) (German: Staatsbetrieb Geobasis information und Vermessung Sachsen). The number of the map sheet was L4948 (Scale = 1:50,000) with the edition year of 2004. Building groups C1 and A1 were selected to allow a general comparison in the same region on the official map.
As shown in Figure 11, for Group C1, the official map generalized the original grid-like pattern building group into a 4 × 3 pattern, and this process kept the original grid-like pattern. The first typification results of the proposed method were selected for comparison. The original building groups had a building number difference in rows, and the difference was also reflected in the typified groups. For another Group A1, the official map only used two buildings to represent the original groups, such that the original grid patterns were lost. When the second typification result of Group A1 was overlapped on the official map, the proposed typification method kept the original grid pattern better than the official map. Therefore, if the typified groups can be shown in the corresponding locations, the map can better preserve the original distribution.
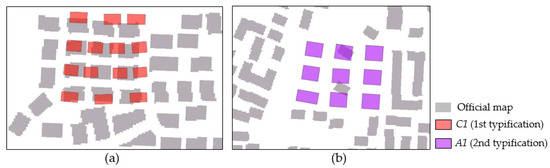
Figure 11.
Comparison with official map: (a) Group C1; (b) Group A1.
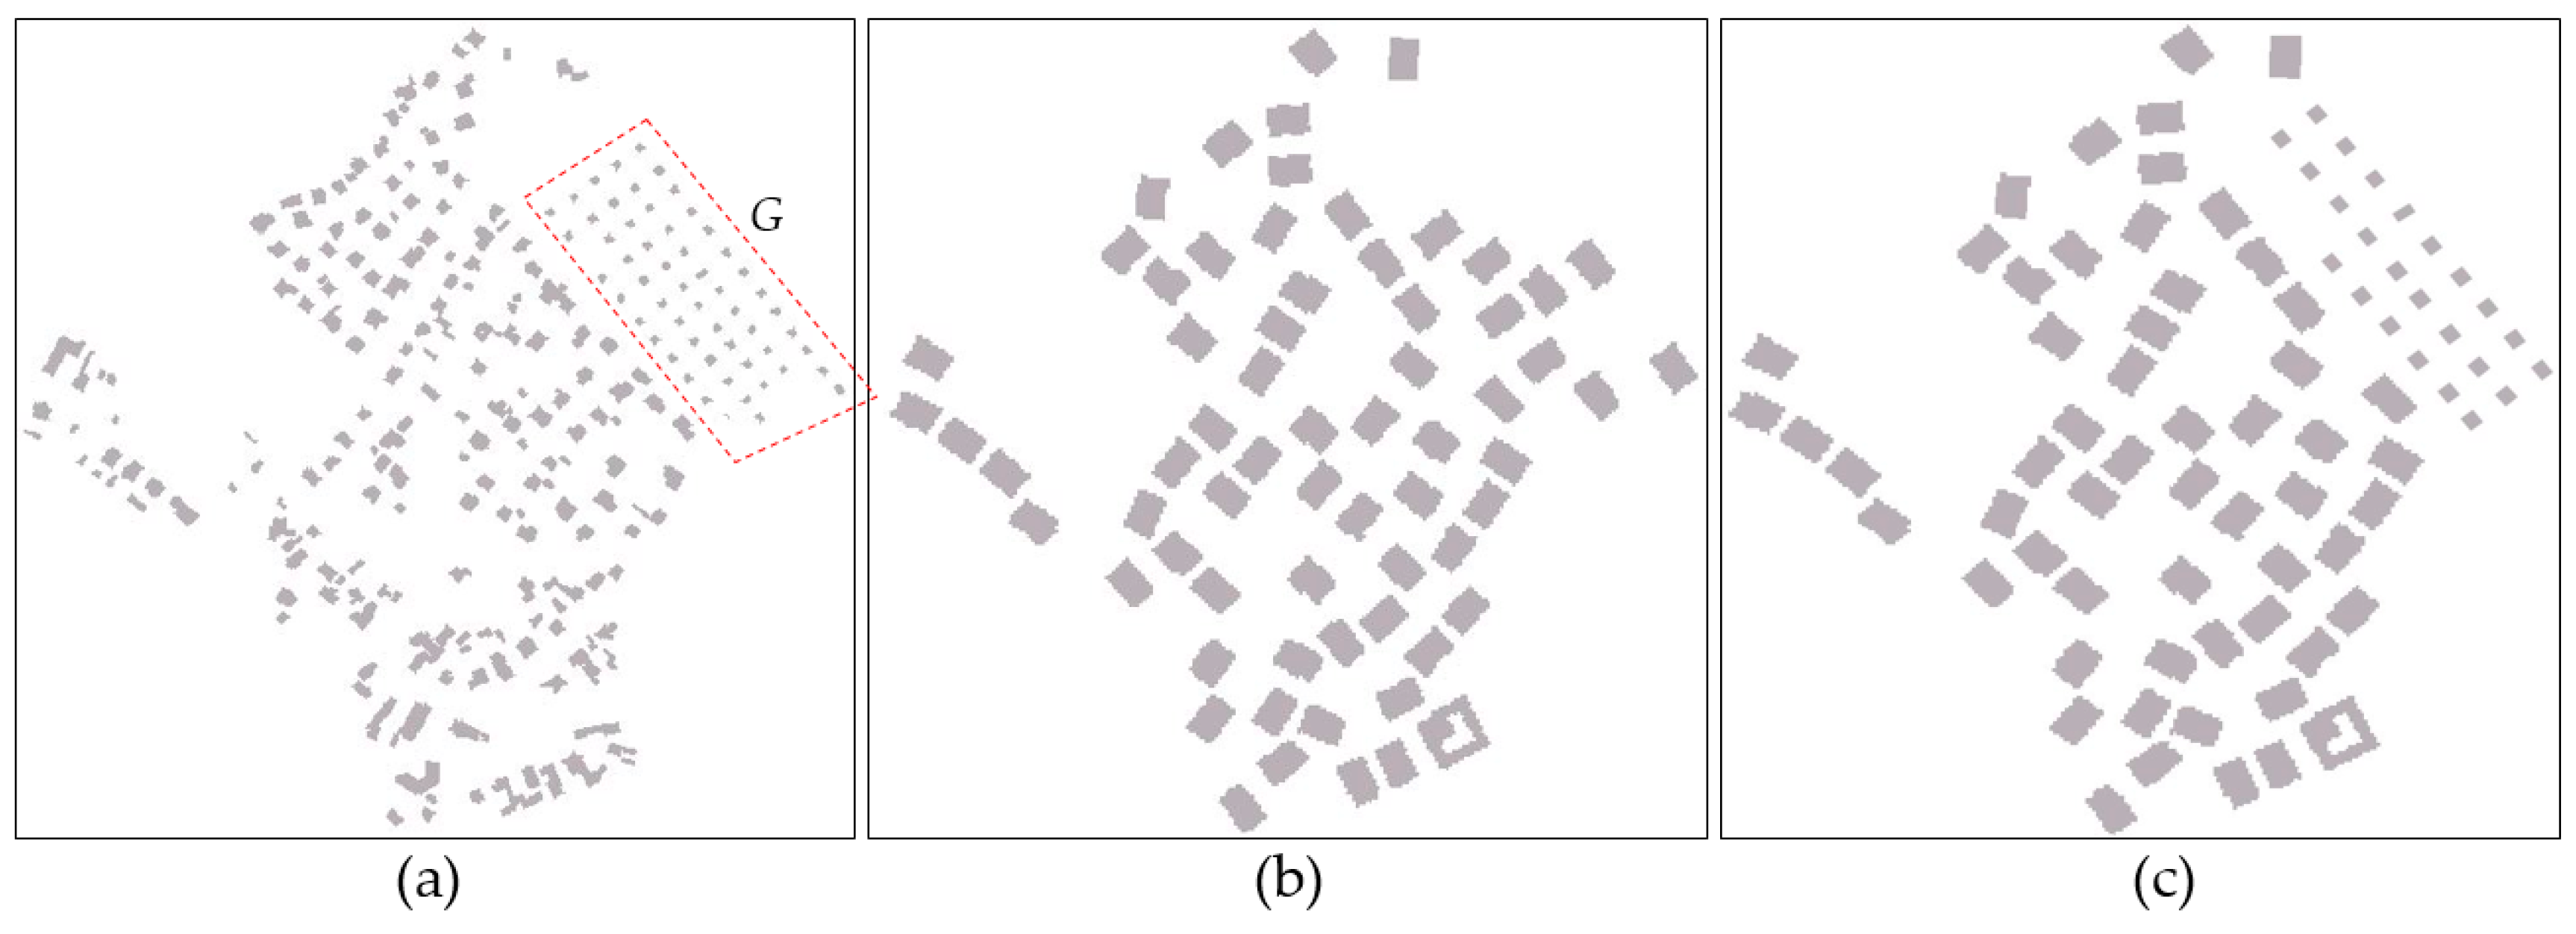
To make another comparison, as shown in Figure 12a, on the marked area of the official map, there exists a building group (G) with the obvious grid-like pattern. Figure 12b displays the generalization results of the same area on the official 1:50,000 map. It is found that Group G was generalized into several unstructured buildings, which lost the original grid-like pattern. By comparison, this group was generalized using the proposed typification method. As shown in Figure 12c, when the second typification result was applied on the map instead of the official generalized result, the new solution preserved the original distribution characteristics of this area.
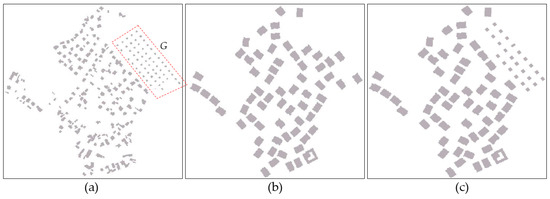
Figure 12.
Comparison with official map: (a) map of 1:25,000; (b) map of 1:50,000 (original generalization results); (c) results using the proposed typification method.
5. Discussion
5.1. Advantages
Typification belongs to the m to n generalization problem. The difficulty of grid pattern typification lies in how to create a general rule to determine the remaining number of newly typified buildings, as well as keeping the original grid patterns. The advantages of the proposed mesh-based grid pattern typification method are as follows:
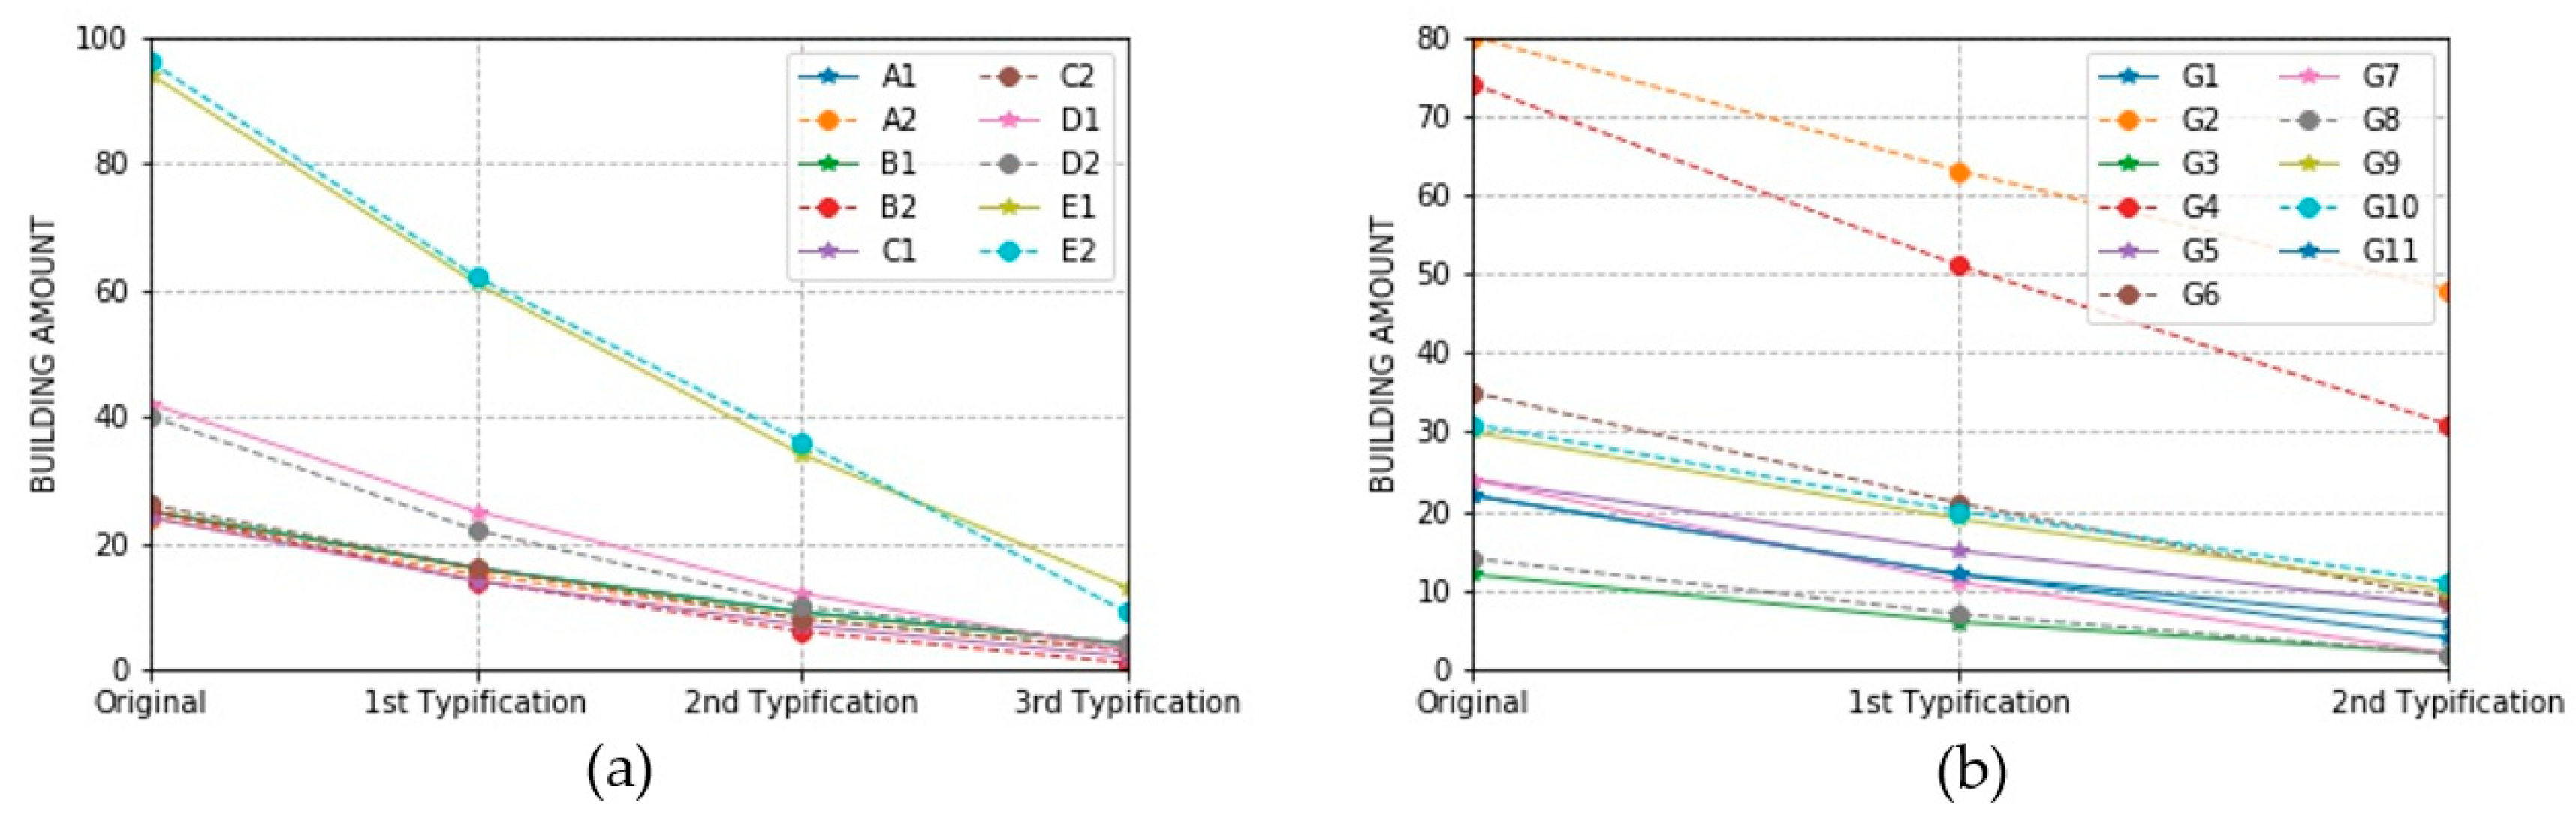
(1) The number of typified buildings can be easily determined by meshes. The number of newly created buildings is equal to the number of meshes. For the perfect grid pattern, the number changes from m × n to (m − i) × (n − i) (I = 1, 2, …, min(m, n) − 1) in each iterative process. For the grid-like patterns, the number reduces mildly. Figure 13 shows the number of buildings after each typification in the building groups of the two datasets. For a similar original number of buildings, the reducing rate of building number remains consistent, which demonstrates that the proposed method performs steadily in different building groups.
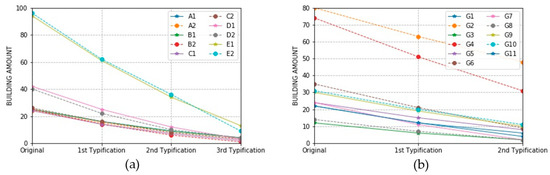
Figure 13.
The number change of building groups after typification: (a) dataset 1; (b) dataset 2.
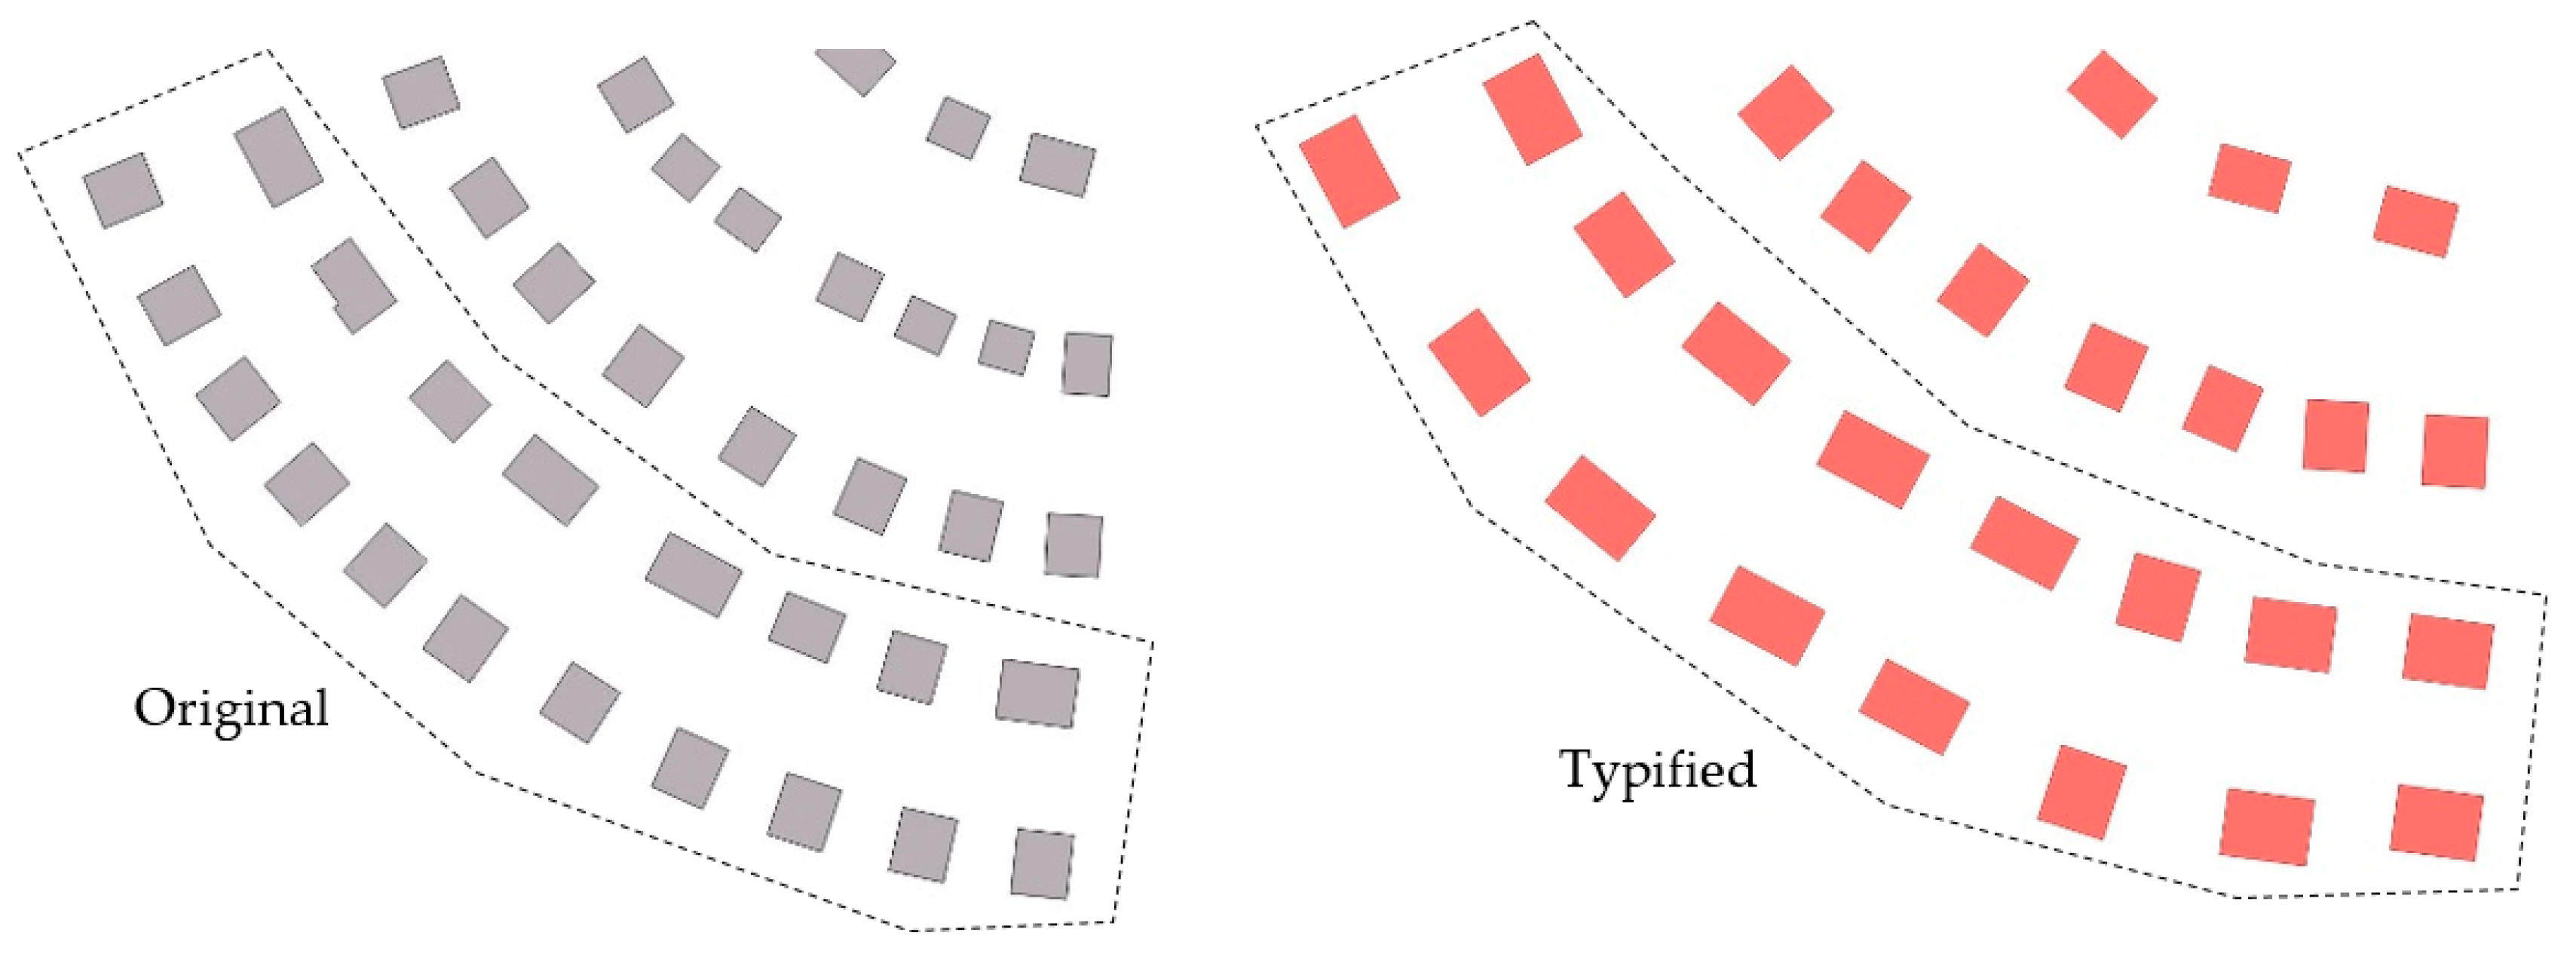
(2) The mesh-based typification method preserves the global characteristics of the building group, as well as the local details, such as the local convex and concave characteristics and the difference between the number of rows and columns in grid patterns. Not only the grid patterns but also some special local characteristics of the original patterns can be preserved and reflected on the newly typified buildings, which keeps the visual consistency.
(3) The method is modeled as an iterative process, which creates progressive typification results. With several iterative typification processes, the hierarchical typification results of the building groups can be obtained, which is useful for continuous generalization. With the scale reducing, the hierarchical typification results can give support to mapmakers when generalizing building groups on maps. The hierarchical typification results can also avoid large and sudden changes in generalized maps, thereby improving the quality of the multiple representations.
5.2. Further Improvements
There are also some issues to be further studied or improved. Firstly, the proposed typification method is conducted as an iterative process, which can create a series of hierarchical typification results. The iterative time should be determined based on the group size and building number. Moreover, in different scales, there are different constraints for the features to be represented on maps, e.g., minimum distance and minimum size; therefore, more studies are needed on how many iterations should be made for one building group to give an optimal representation on smaller-scale maps. Secondly, the typification effect is based on the mesh quality. The mesh generation and merging processes cannot guarantee that all the meshes are of good quality in every situation. Therefore, once an unsatisfying mesh appears, revision should be made manually after typification. Thirdly, the orientations of the newly created buildings are determined by the largest mesh-related building, which may disrupt the smooth trends of the building orientations. As shown in the marked areas of Figure 14, with the original orientations, the buildings are presented with a smooth and consistent trend. After typification, the homogeneity of building orientation becomes weak in some places. Lastly, the grid pattern typification strategy enlarges the buildings, which may cause overlap problems with other geographical features, such as roads. When overlaps appear, it is necessary to use the displacement operator to make the refinement.
Figure 14.
Deficiency of keeping orientation homogeneity after typification.
6. Conclusions
Typification is one of the most challenging tasks in map generalization for its complex m–n relationships. The proposed mesh-based typification method provides a solution for the generalization issue of building groups with grid patterns. The meshes are generated from buildings and they are used to determine the number and position of the newly created buildings. The representations of the newly created buildings are calculated from their corresponding mesh-related buildings. The method can be implemented iteratively such that hierarchical typification results are created, which contributes to multiple representations and continuous generalization. The experimental results show that the original characteristics of the grid patterns can be preserved, and some special characteristics in the grid-like patterns can be also captured and reflected in the typification results. The comparison with the official map demonstrates that this method can preserve the original grid or grid-like patterns in building groups; therefore, the official map can consider the proposed typification results as solutions in the corresponding building groups. This study only focuses on the development of the typification operator; future work should study how to suitably decide the iteration times on different scales.
Author Contributions
Xiao Wang designed the study, ran and analyzed the method, organized and carried out the experiments, drafted and revised the manuscript, and acted as the corresponding author. Dirk Burghardt acted as the advising author, contributed to the method design, and edited and revised the manuscript.
Funding
This research was funded by the German Research Foundation, grant number [DFG, BU 2605/5-1].
Acknowledgments
The first author also thanks the support of the Chinese Scholarship Council (CSC).
Conflicts of Interest
The authors declare no conflict of interest.
References
- Brassel, K.E.; Weibel, R. A review and conceptual framework of automated map generalization. Int. J. Geogr. Inf. Syst. 1988, 2, 229–244. [Google Scholar] [CrossRef]
- McMaster, R.B.; Shea, K.S. Generalization in Digital Cartography; Publication of the Association of American Geographers: Washington, DC, USA, 1992; p. 121. [Google Scholar]
- Brychtová, A.; Çöltekin, A.; Pászto, V. Do the visual complexity algorithms match the generalization process in geographical displays? Int. Arch. Photogramm. Remote Sens. Spat. Inf. Sci. 2016, 41, 375–378. [Google Scholar] [CrossRef]
- He, X.; Zhang, X.; Yang, J. Progressive Amalgamation of Building Clusters for Map Generalization Based on Scaling Subgroups. ISPRS Int. J. Geo-Inf. 2018, 7, 116. [Google Scholar] [CrossRef]
- Wang, L.; Guo, Q.; Liu, Y.; Sun, Y.; Wei, Z. Contextual Building Selection Based on a Genetic Algorithm in Map Generalization. ISPRS Int. J. Geo-Inf. 2017, 6, 271. [Google Scholar] [CrossRef]
- Li, Z.; Yan, H.; Ai, T.; Chen, J. Automated building generalization based on urban morphology and Gestalt theory. Int. J. Geogr. Inf. Sci. 2004, 18, 513–534. [Google Scholar] [CrossRef]
- Sester, M.; Brenner, C. Continuous Generalization for Visualization on Small Mobile Devices. Dev. Spat. Data Handl. 2005, 30090, 355–368. [Google Scholar]
- Burghardt, D.; Cecconi, A. Mesh simplification for building typification. Int. J. Geogr. Inf. Sci. 2007, 21, 283–298. [Google Scholar] [CrossRef]
- Regnauld, N. Contextual building typification in automated map generalization. Algorithmica 2001, 30, 312–333. [Google Scholar] [CrossRef]
- Bildirici, I.; Aslan, S. Building Typification at Medium Scales. In Proceedings of the 3rd International Conference on Cartography and GIS, Nesebar, Bulgaria, 12–15 June 2010. [Google Scholar]
- Bildirici, I.; Aslan, S.; Simav, O.; Çobankaya, O.N. A Generic Approach to Building Typification. In Proceedings of the 14th ICA/ISPRS Workshop on Generalisation and Multiple Representation, Paris, France, 30 June–1 July 2011; pp. 1–10. [Google Scholar]
- Sester, M. Optimization approaches for generalization and data abstraction. Int. J. Geogr. Inf. Sci. 2005, 19, 871–897. [Google Scholar] [CrossRef]
- Li, H.; Guo, Q.; Liu, J. Rapid algorithm of building typification in web mapping. In Proceedings of the International Symposium on Spatio-Temporal Modelling, Spatial Reasoning, Analysis, Data Mining and Data Fusion, Beijing, China, 27–29 August 2005. [Google Scholar]
- Anders, K.H. Grid Typification. In Progress in Spatial Data Handling; Riedl, A., Kainz, W., Elmes, G.A., Eds.; Springer: Heidelberg, Germany, 2006; pp. 633–642. [Google Scholar]
- Regnauld, N. Recognition of building clusters for generalization. In Proceedings of the 7th International Symposium on Spatial Data Handling, Delft, The Netherlands, 12–16 August 1996; pp. 1–14. [Google Scholar]
- Christophe, S.; Ruas, A. Detecting Building Alignments for Generalisation Purposes. In Proceedings of the 10th International Symposium on Spatial Data Handling, Ottawa, ON, Canada, 9–12 July 2002; pp. 419–432. [Google Scholar]
- Anders, K.H. A hierarchical graph-clustering approach to find groups of objects. In Proceedings of the 7th ICA Workshop on Progress in Automated Map Generalization, Paris, France, 28–30 April 2003. [Google Scholar]
- Mesev, V. Identification and characterisation of urban building patterns using IKONOS imagery and point-based postal data. Comput. Environ. Urban Syst. 2005, 29, 541–557. [Google Scholar] [CrossRef]
- Yan, H.; Weibel, R.; Yang, B. A multi-parameter approach to automated building grouping and generalization. Geoinformatica 2008, 12, 73–89. [Google Scholar] [CrossRef]
- Zhang, L.; Hao, D.; Dong, C.; Zhen, W. A spatial cognition-based urban building clustering approach and its applications. Int. J. Geogr. Inf. Sci. 2013, 27, 1–20. [Google Scholar]
- Zhang, X.; Ai, T.; Stoter, J.; Kraak, M.J.; Molenaar, M. Building pattern recognition in topographic data: Examples on collinear and curvilinear alignments. Geoinformatica 2013, 17, 1–33. [Google Scholar] [CrossRef]
- Du, S.; Shu, M.; Feng, C. Representation and discovery of building patterns: A three-level relational approach. Int. J. Geogr. Inf. Sci. 2016, 30, 1161–1186. [Google Scholar] [CrossRef]
- He, Y.; Ai, T.; Yu, W.; Zhang, X. A linear tessellation model to identify spatial pattern in urban street networks. Int. J. Geogr. Inf. Sci. 2017, 31, 1541–1561. [Google Scholar] [CrossRef]
- He, X.; Zhang, X.; Xin, Q. Recognition of building group patterns in topographic maps based on graph partitioning and random forest. ISPRS J. Photogramm. Remote Sens. 2018, 136, 26–40. [Google Scholar] [CrossRef]
- Anders, K.H.; Sester, M. Parameter-free cluster detection in spatial databases and its application on typification. Int. Arch. Photogramm. Remote Sens. 2000, 33, 75–83. [Google Scholar]
- Anders, K.H. Level of detail generation of 3D building groups by aggregation and typification. In Proceedings of the 22nd International Cartographic Conference, Coruña, Spain, 9–16 July 2005. [Google Scholar]
- Gong, X.; Wu, F. A typification method for linear pattern in urban building generalisation. Geospat. Int. 2018, 33, 189–207. [Google Scholar] [CrossRef]
- Zhang, Q. Drainage Typification Based on Dendritic Decomposition. Cartogr. J. 2007, 44, 321–328. [Google Scholar] [CrossRef]
- Sandro, Z.; Massimo, R. Pattern Recognition and Typification of Ditches. Trans. GIS 2017, 21, 332–358. [Google Scholar]
- Jahnke, M.; Fan, H.; Meng, L. A user perspective on typification of façade features of 3D Building models. In Proceedings of the 24th International Cartographic Conference (ICC), Santiago, Chile, 15–21 November 2009. [Google Scholar]
- Shen, J.; Fan, H.; Mao, B.; Wang, M. Typification for Façade Structures Based on User Perception. ISPRS Int. J. Geo-Inf. 2016, 5, 239. [Google Scholar] [CrossRef]
- Ai, T.; van Oosterom, P. A map generalization model based on algebra mapping transformation. In Proceedings of the 9th ACM International Symposium on Advances in Geographic Information Systems, Atlanta, GA, USA, 9–10 November 2001; p. 21. [Google Scholar]
- Cambridge Dictionary. Available online: https://dictionary.cambridge.org/dictionary/english/grid (accessed on 25 February 2019).
- Yang, W. Identify building patterns. In Proceedings of the International Archives of the Photogrammetry, Remote Sensing and Spatial Information Sciences, Beijing, China, 3–11 July 2008; Volume XXXVII, pp. 391–397. [Google Scholar]
- Pászto, V.; Brychtová, A.; Marek, L. On shape metrics in cartographic generalization: A case study of the building footprint geometry. In Modern Trends in Cartography; Springer: Cham, Germany, 2015; pp. 397–407. [Google Scholar]
- Bayer, T. Automated building simplification using a recursive approach. In Cartography in Central and Eastern Europe; Springer: Berlin/Heidelberg, Germany, 2009; pp. 121–146. [Google Scholar]


© 2019 by the authors. Licensee MDPI, Basel, Switzerland. This article is an open access article distributed under the terms and conditions of the Creative Commons Attribution (CC BY) license (http://creativecommons.org/licenses/by/4.0/).