Estimating Hilly Areas Population Using a Dasymetric Mapping Approach: A Case of Sri Lanka’s Highest Mountain Range


Abstract
:1. Introduction
2. Population Estimation and Mapping
3. Empirical Application for Hilly Area Dasymetric Mapping
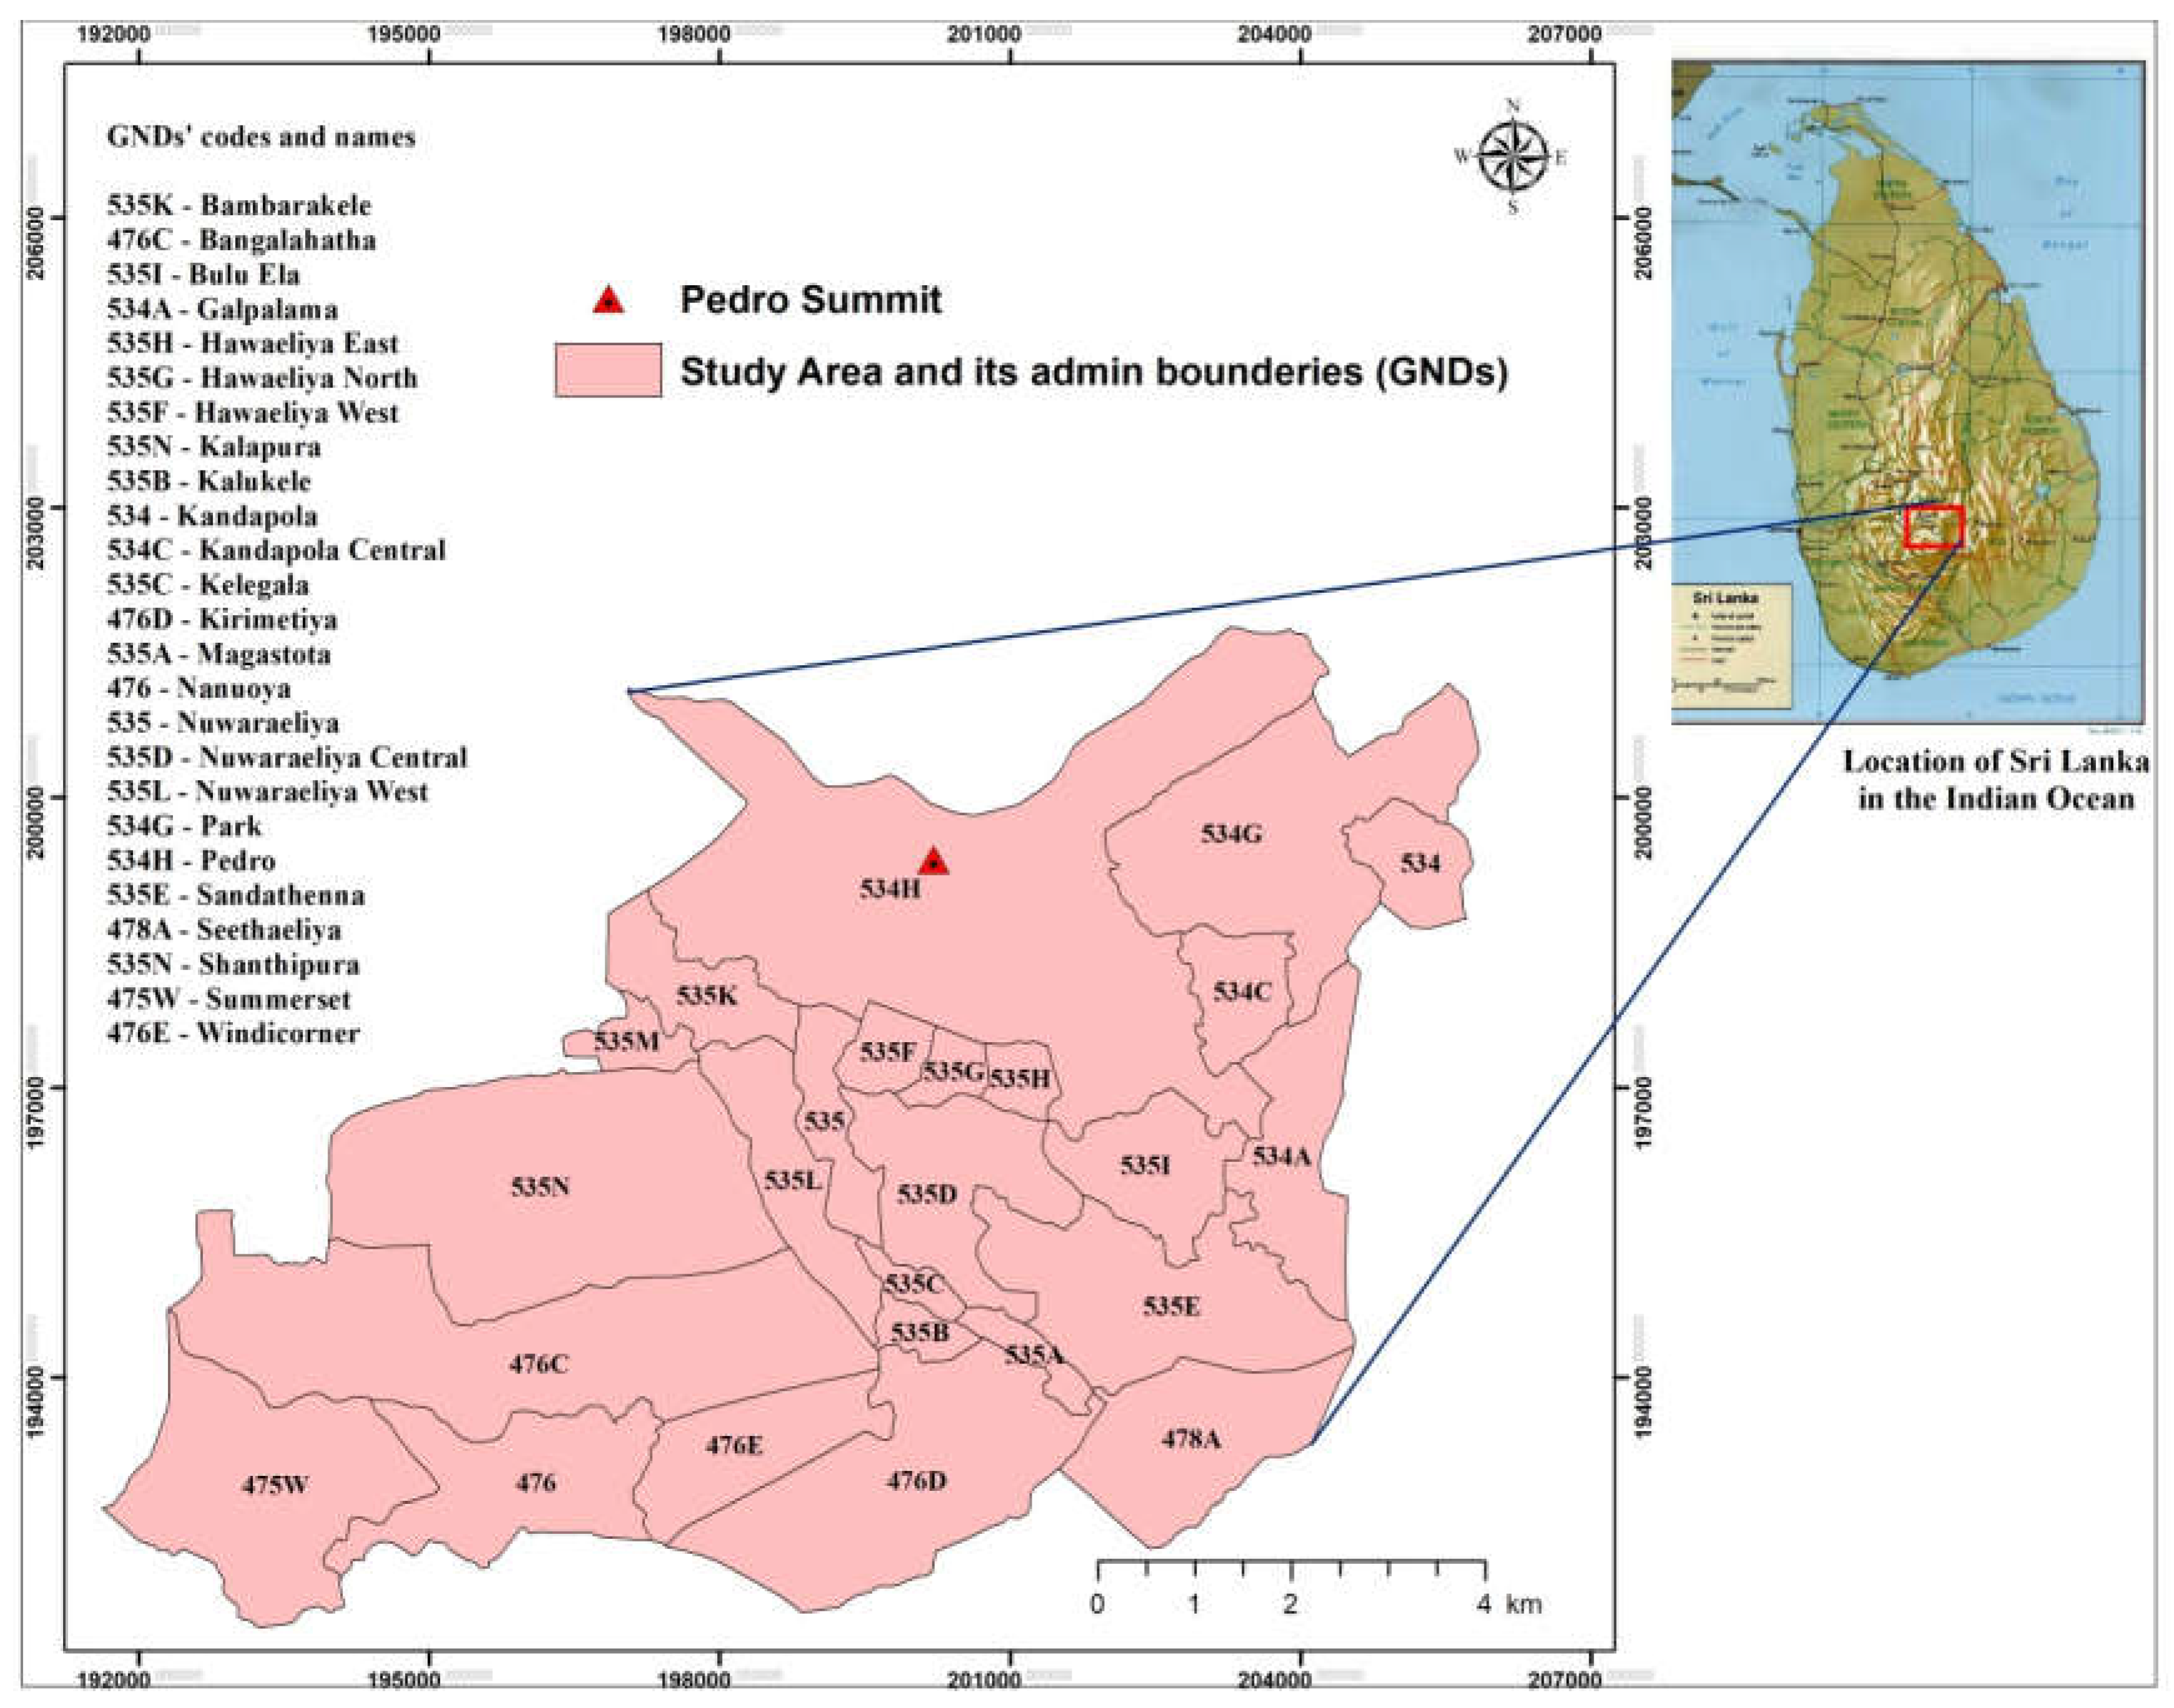
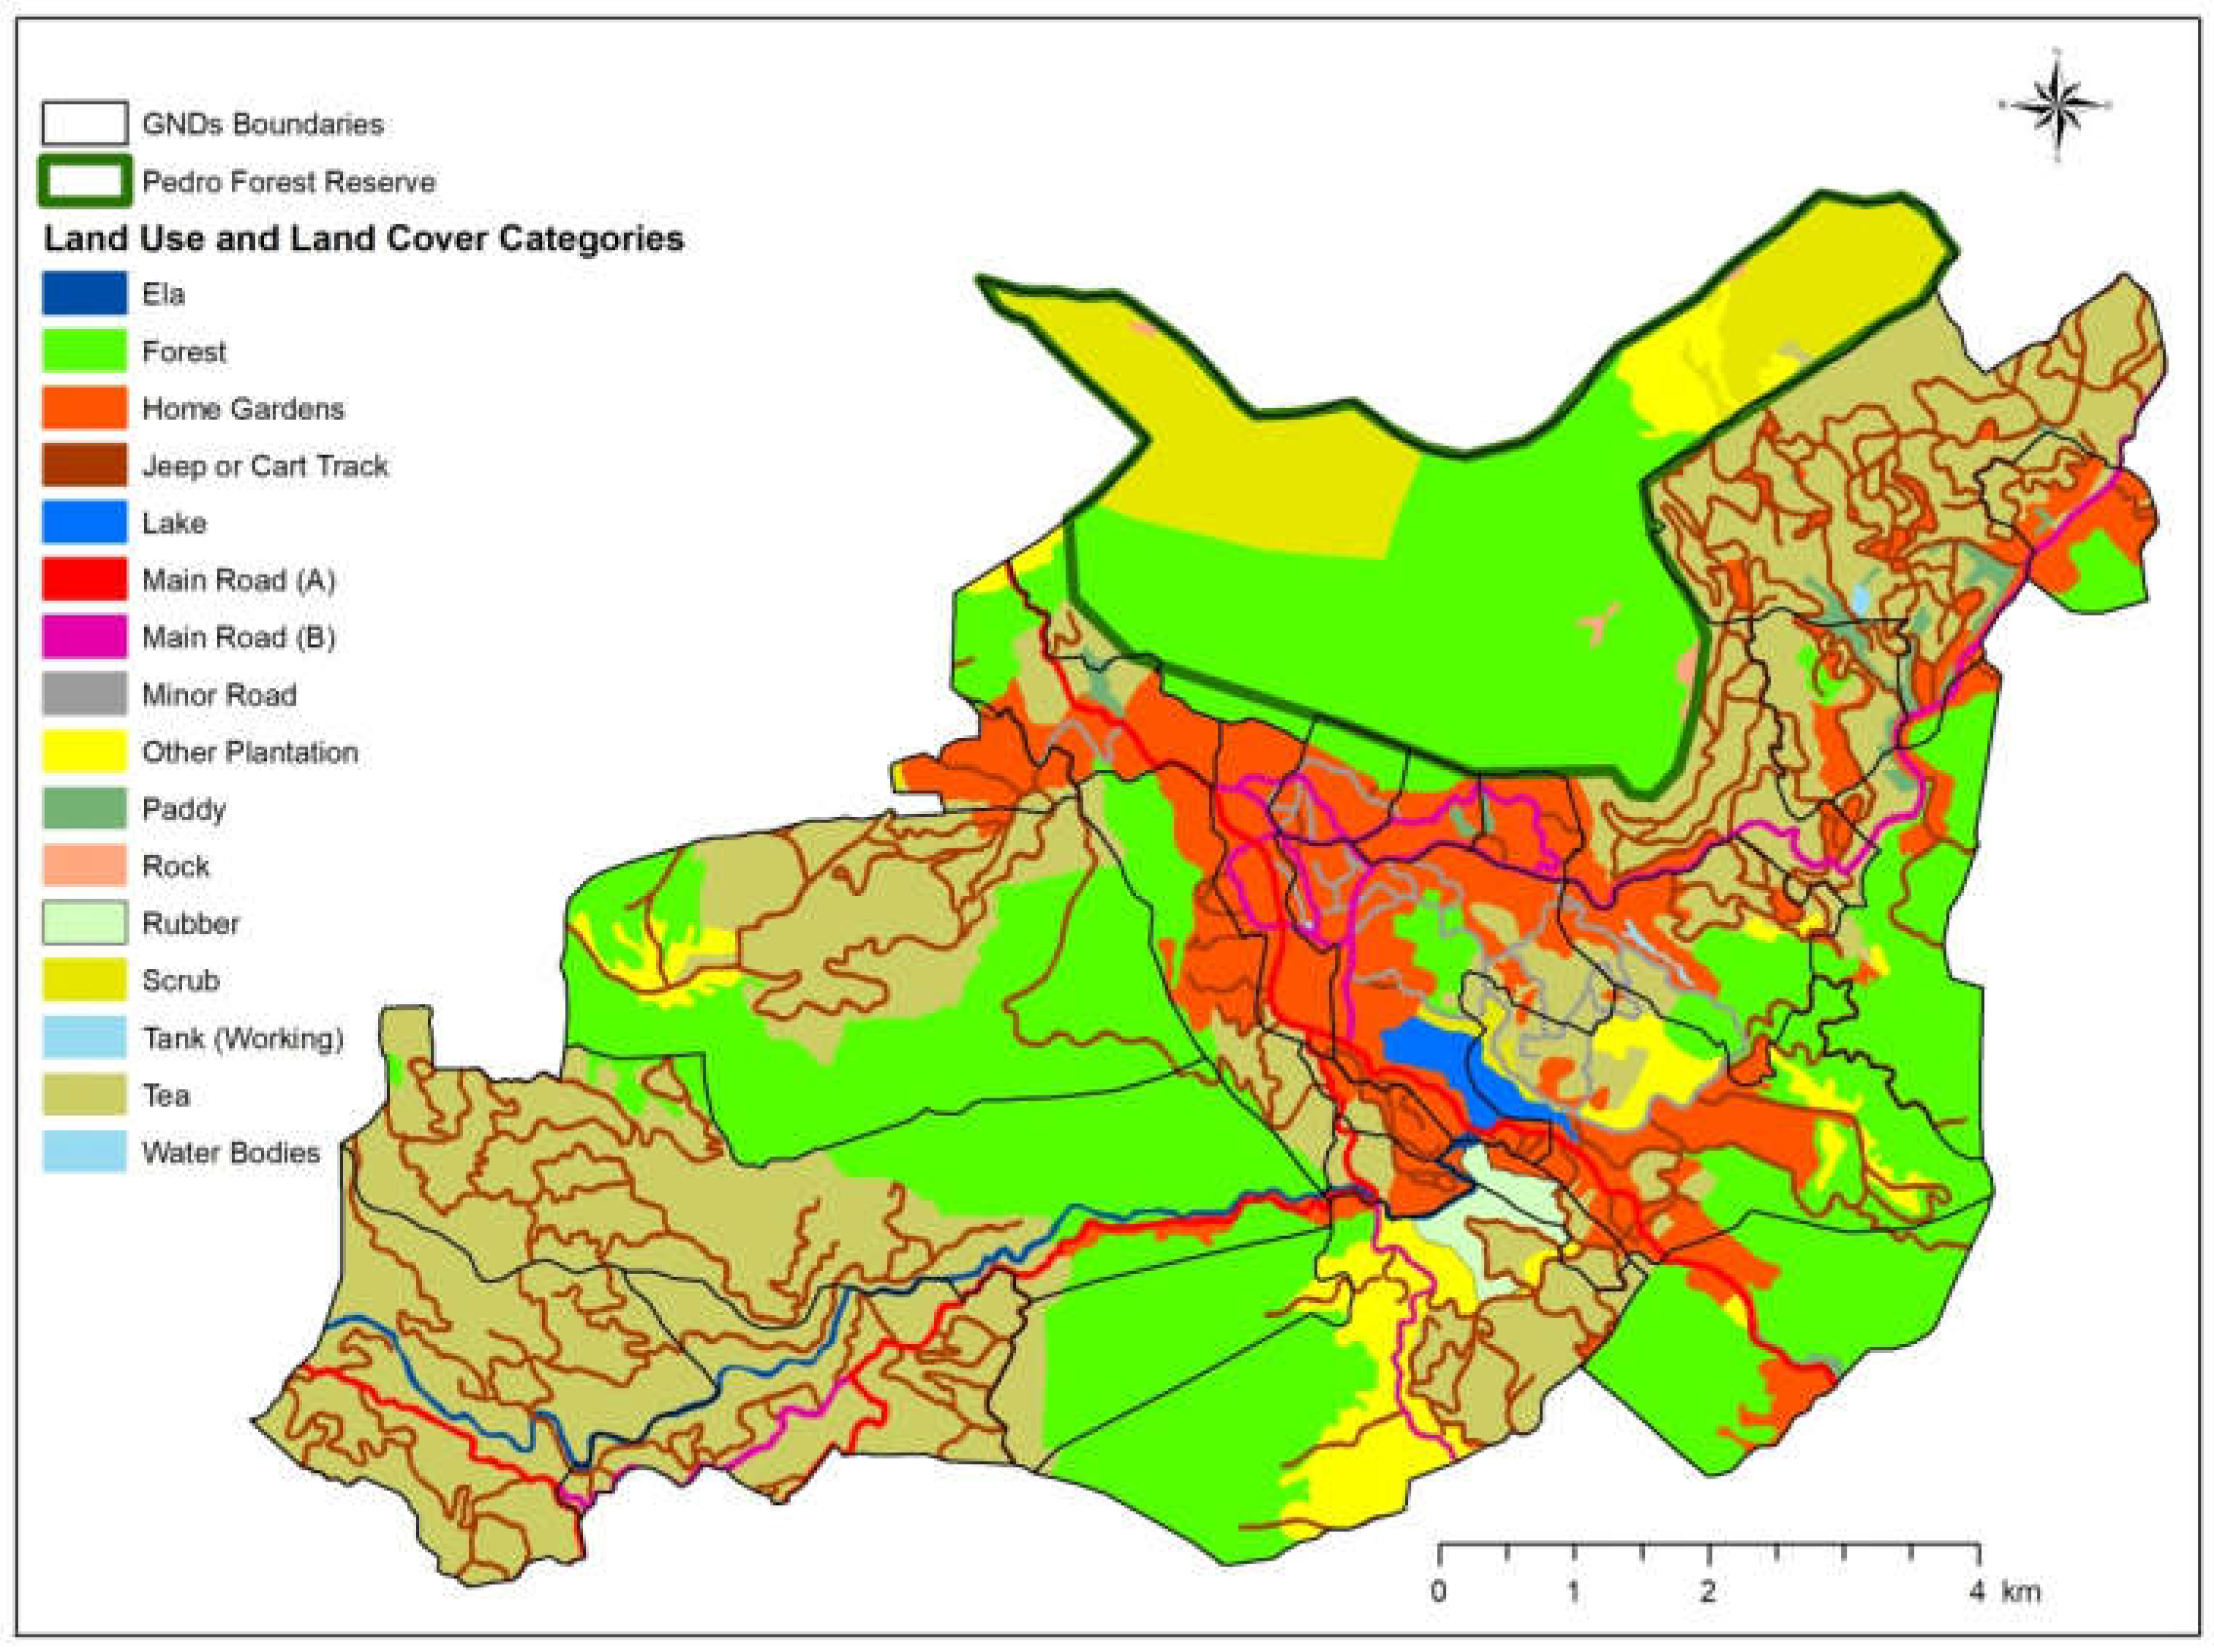
3.1. Study Area
3.2. Hilly Area Population Estimation
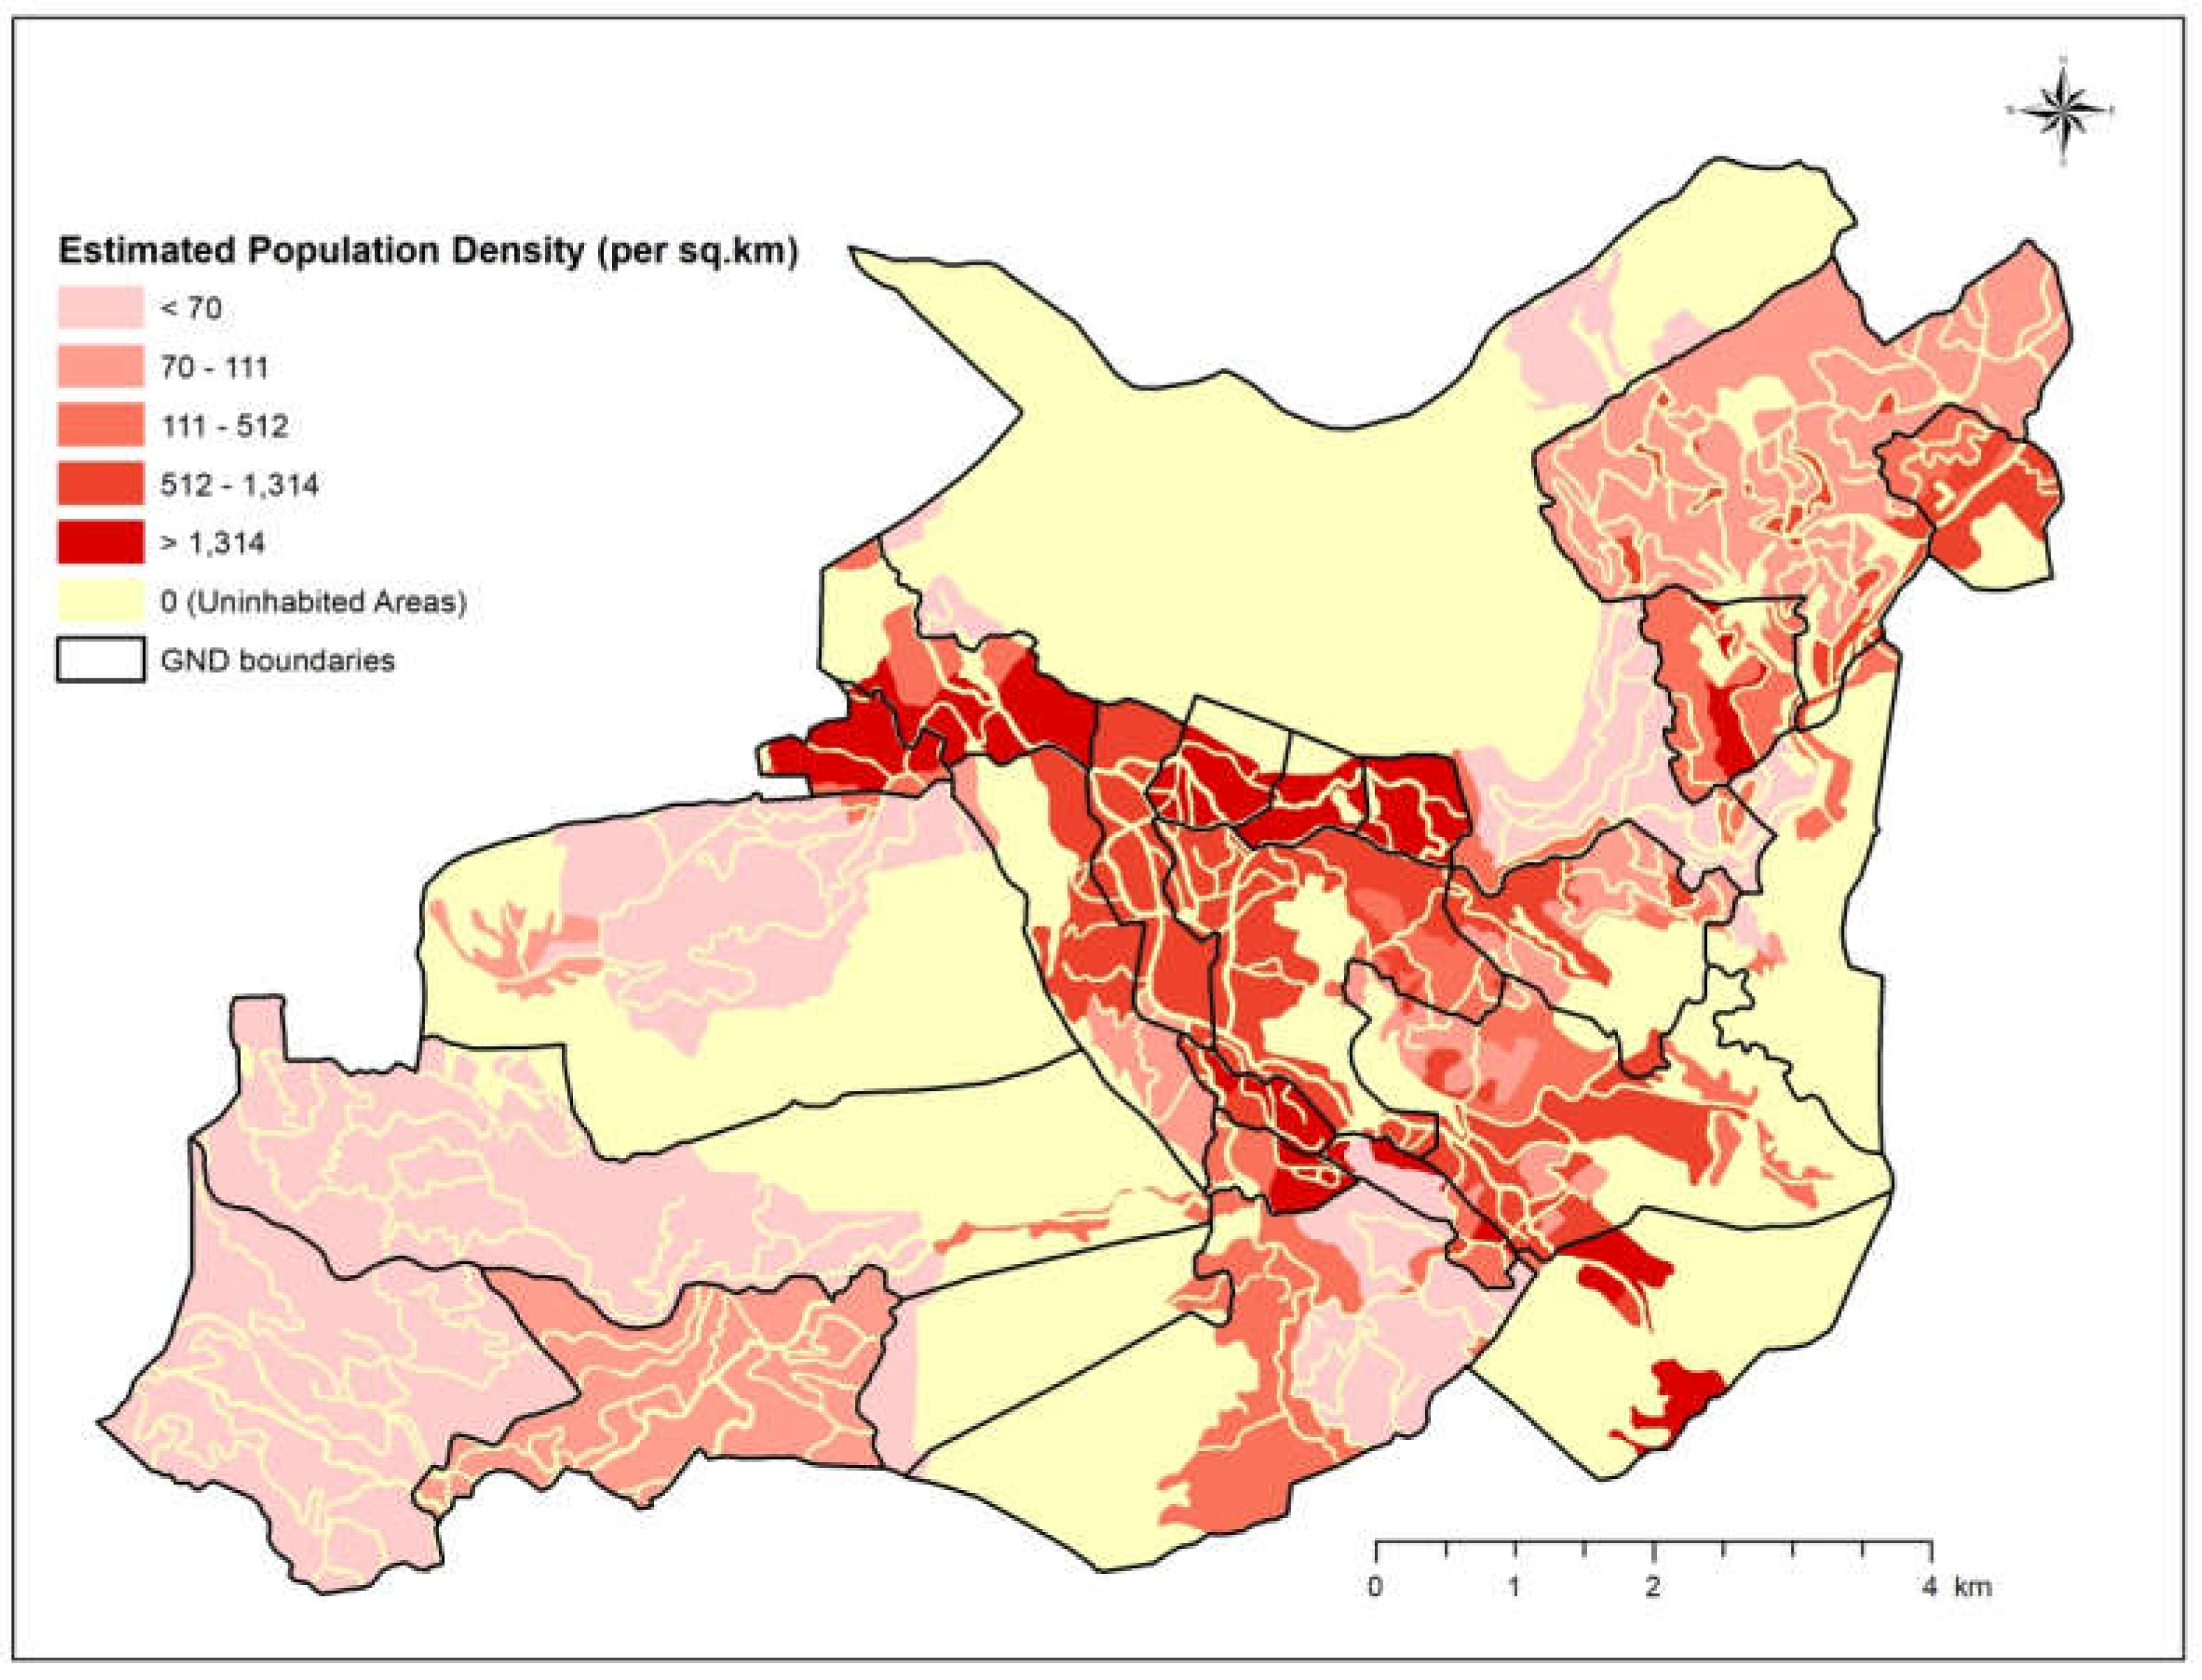
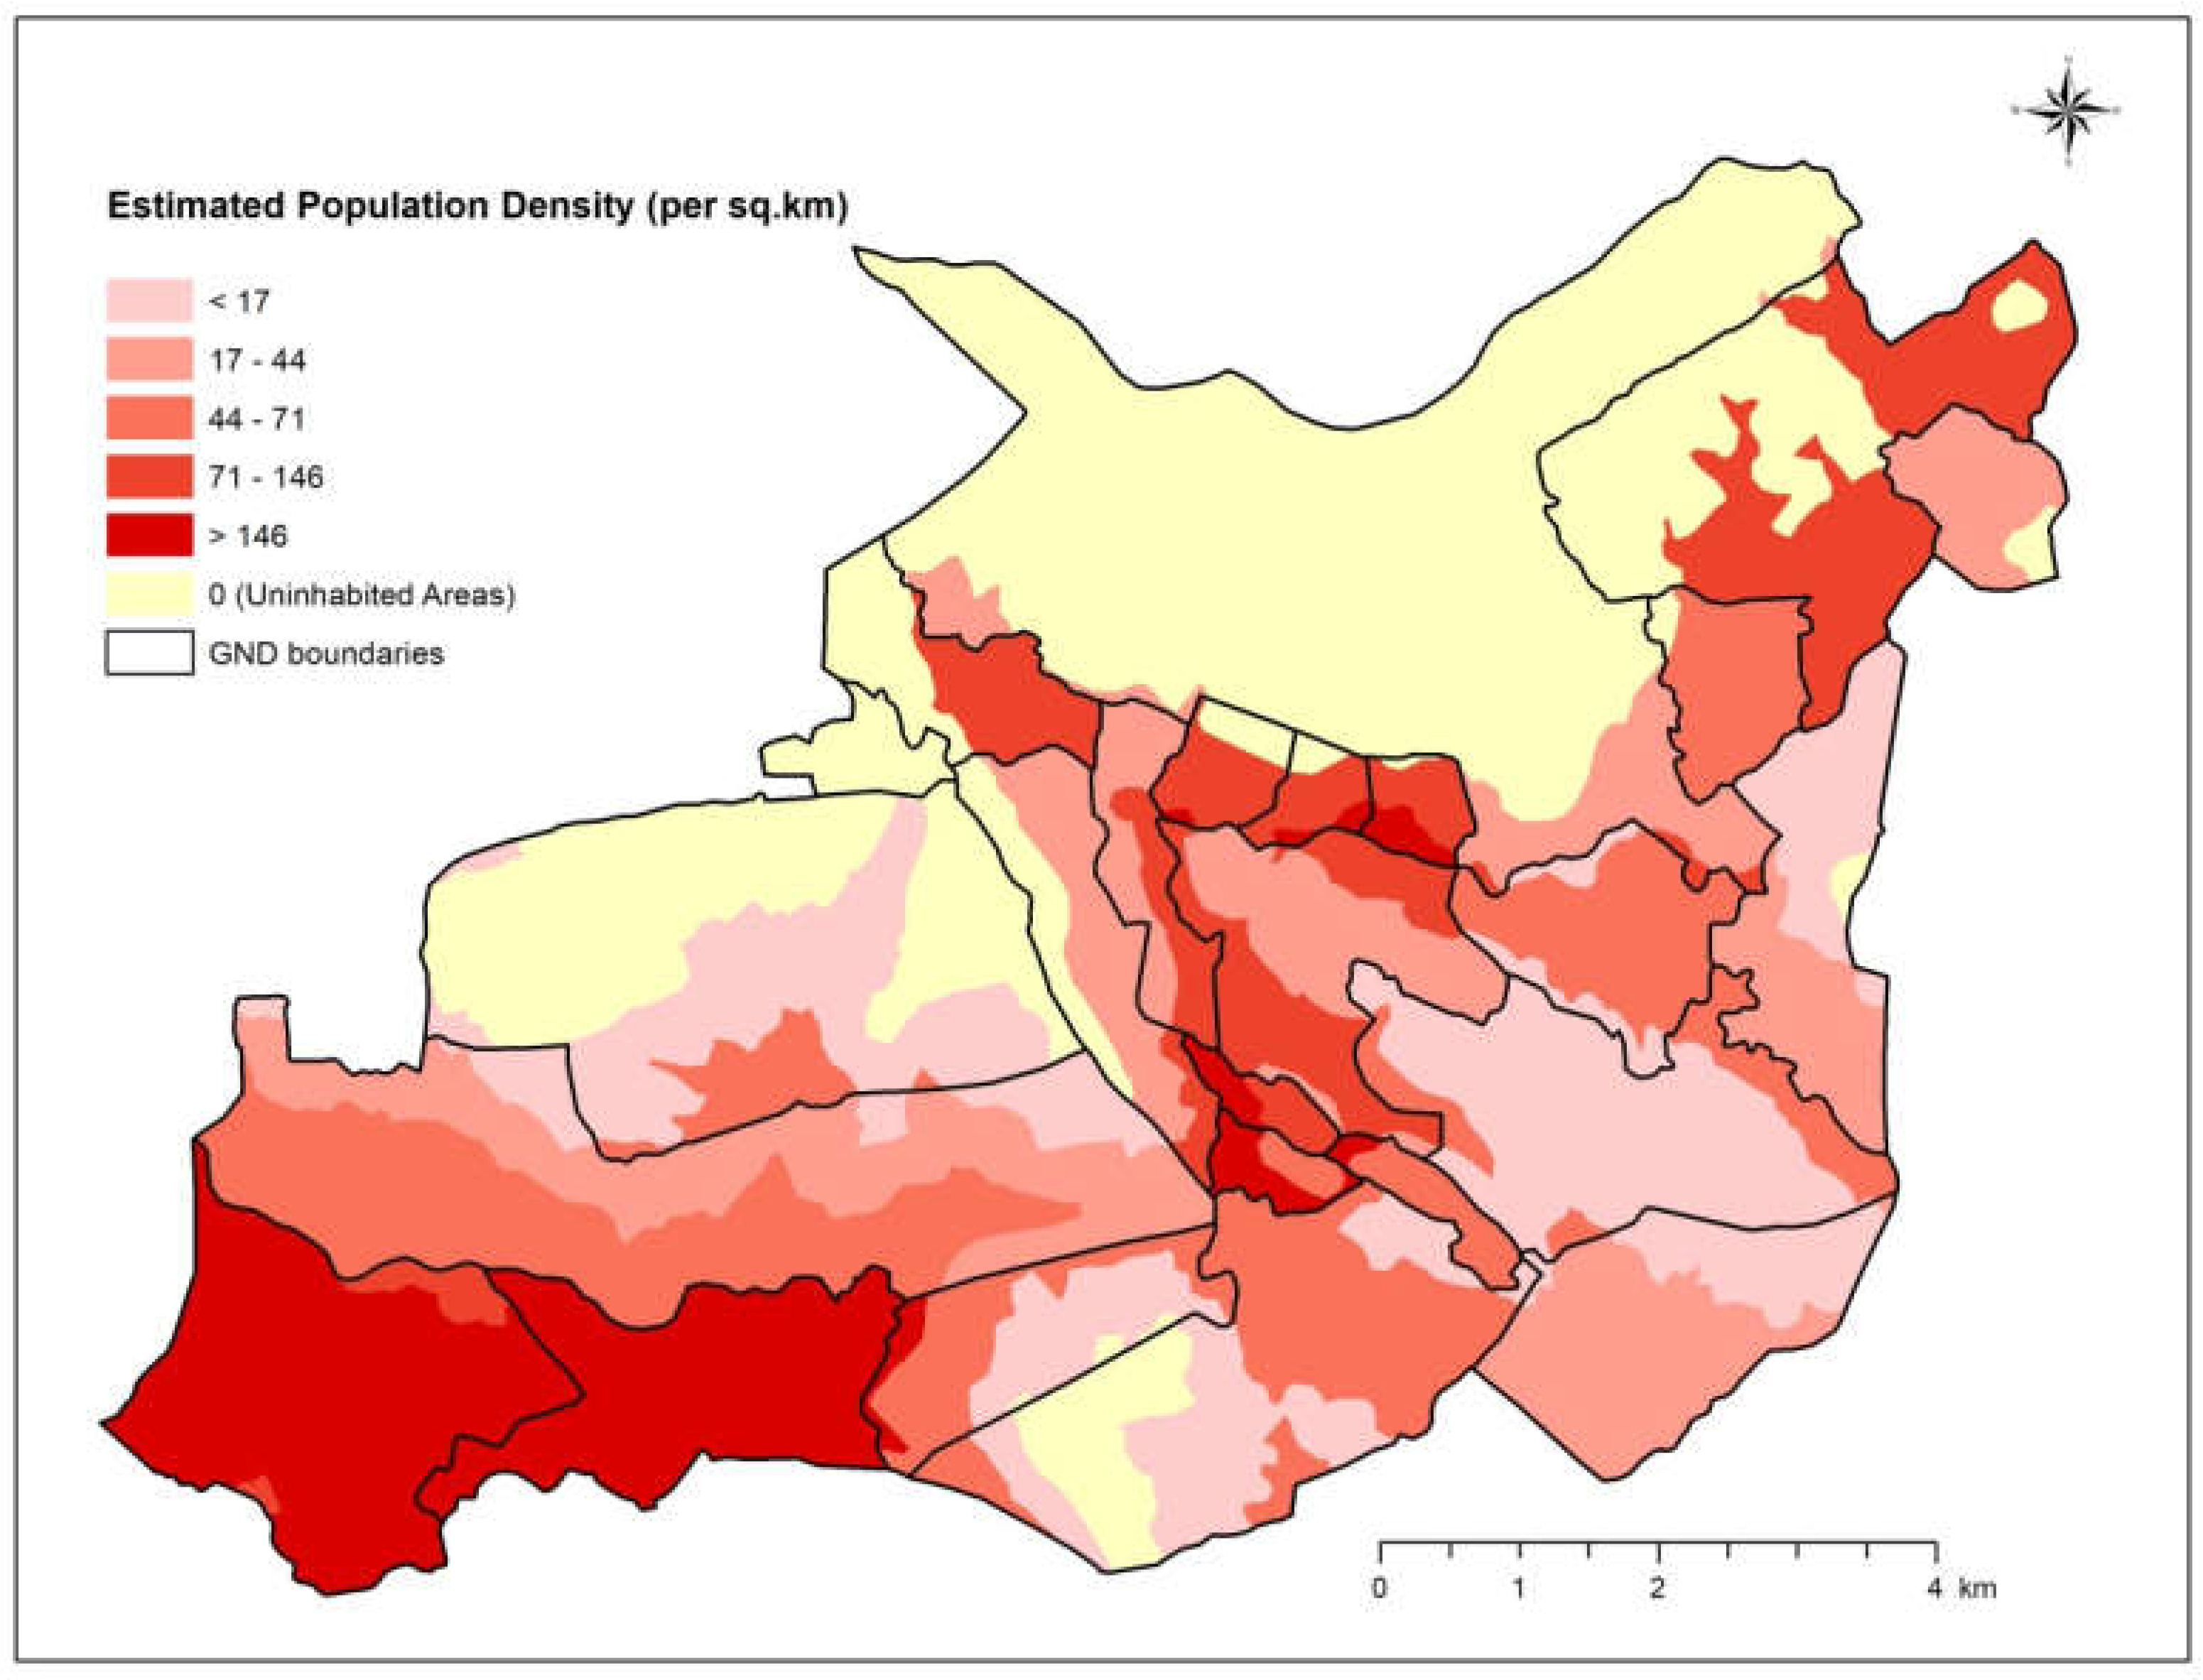
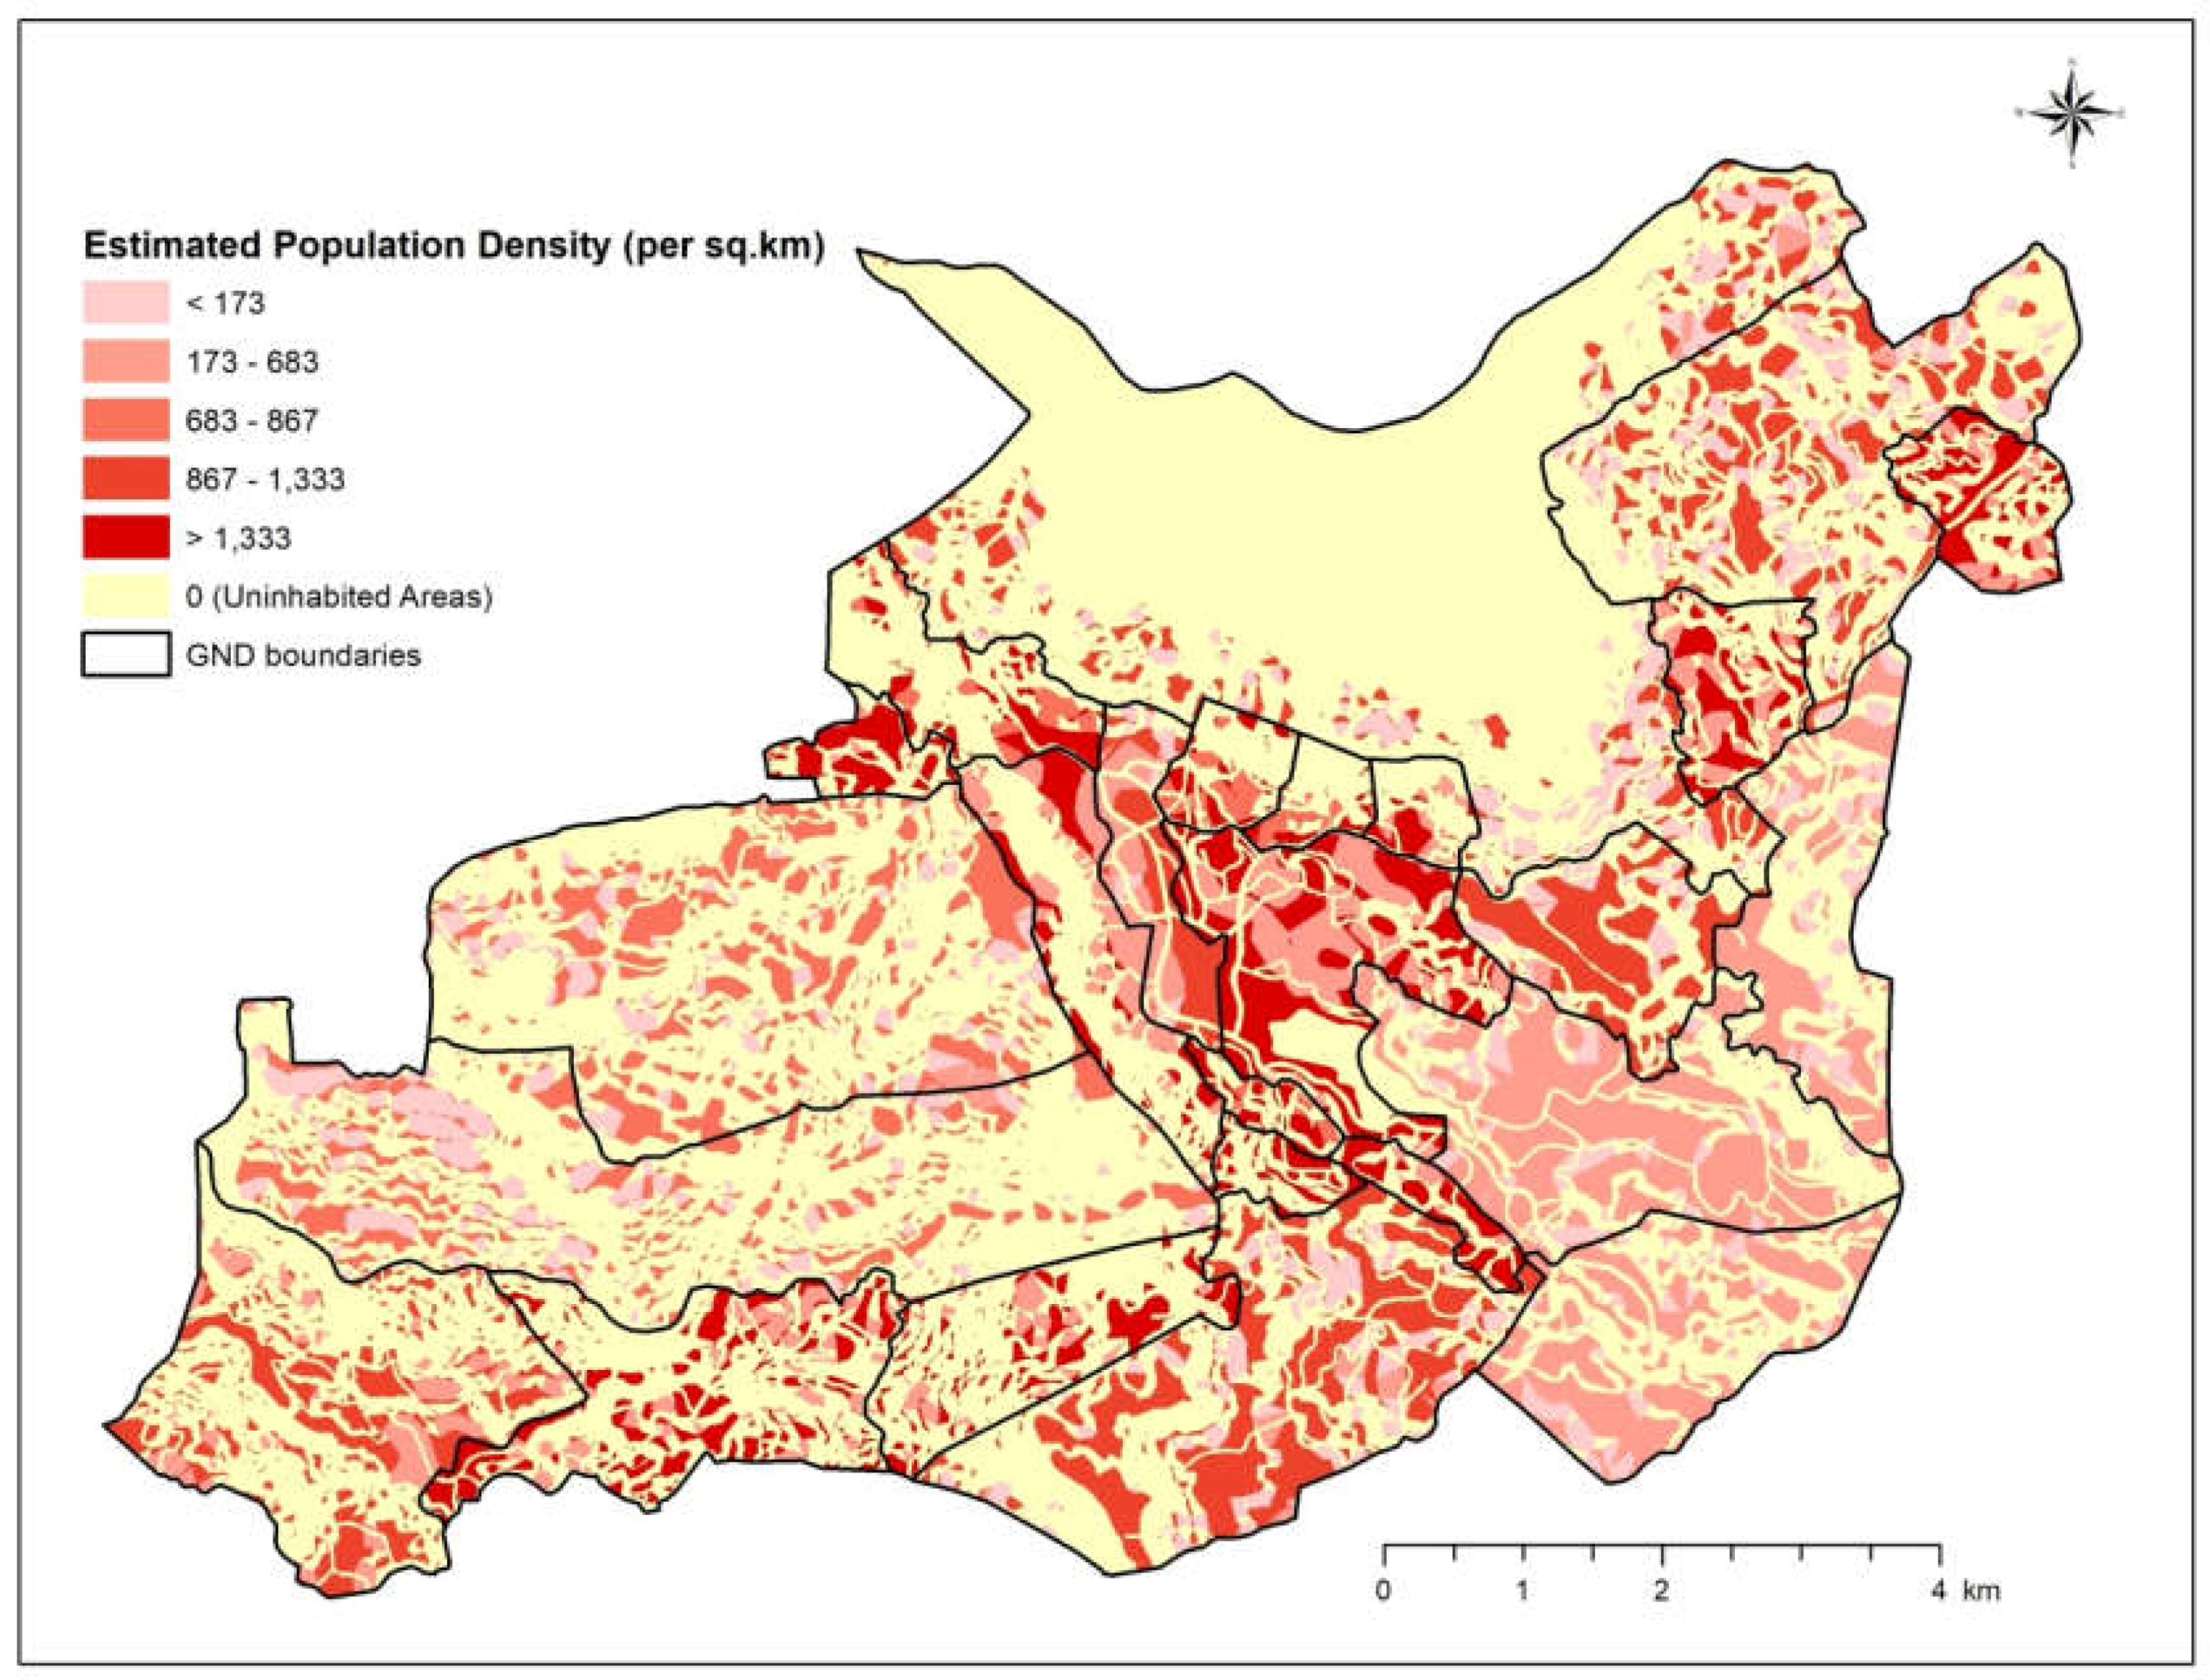
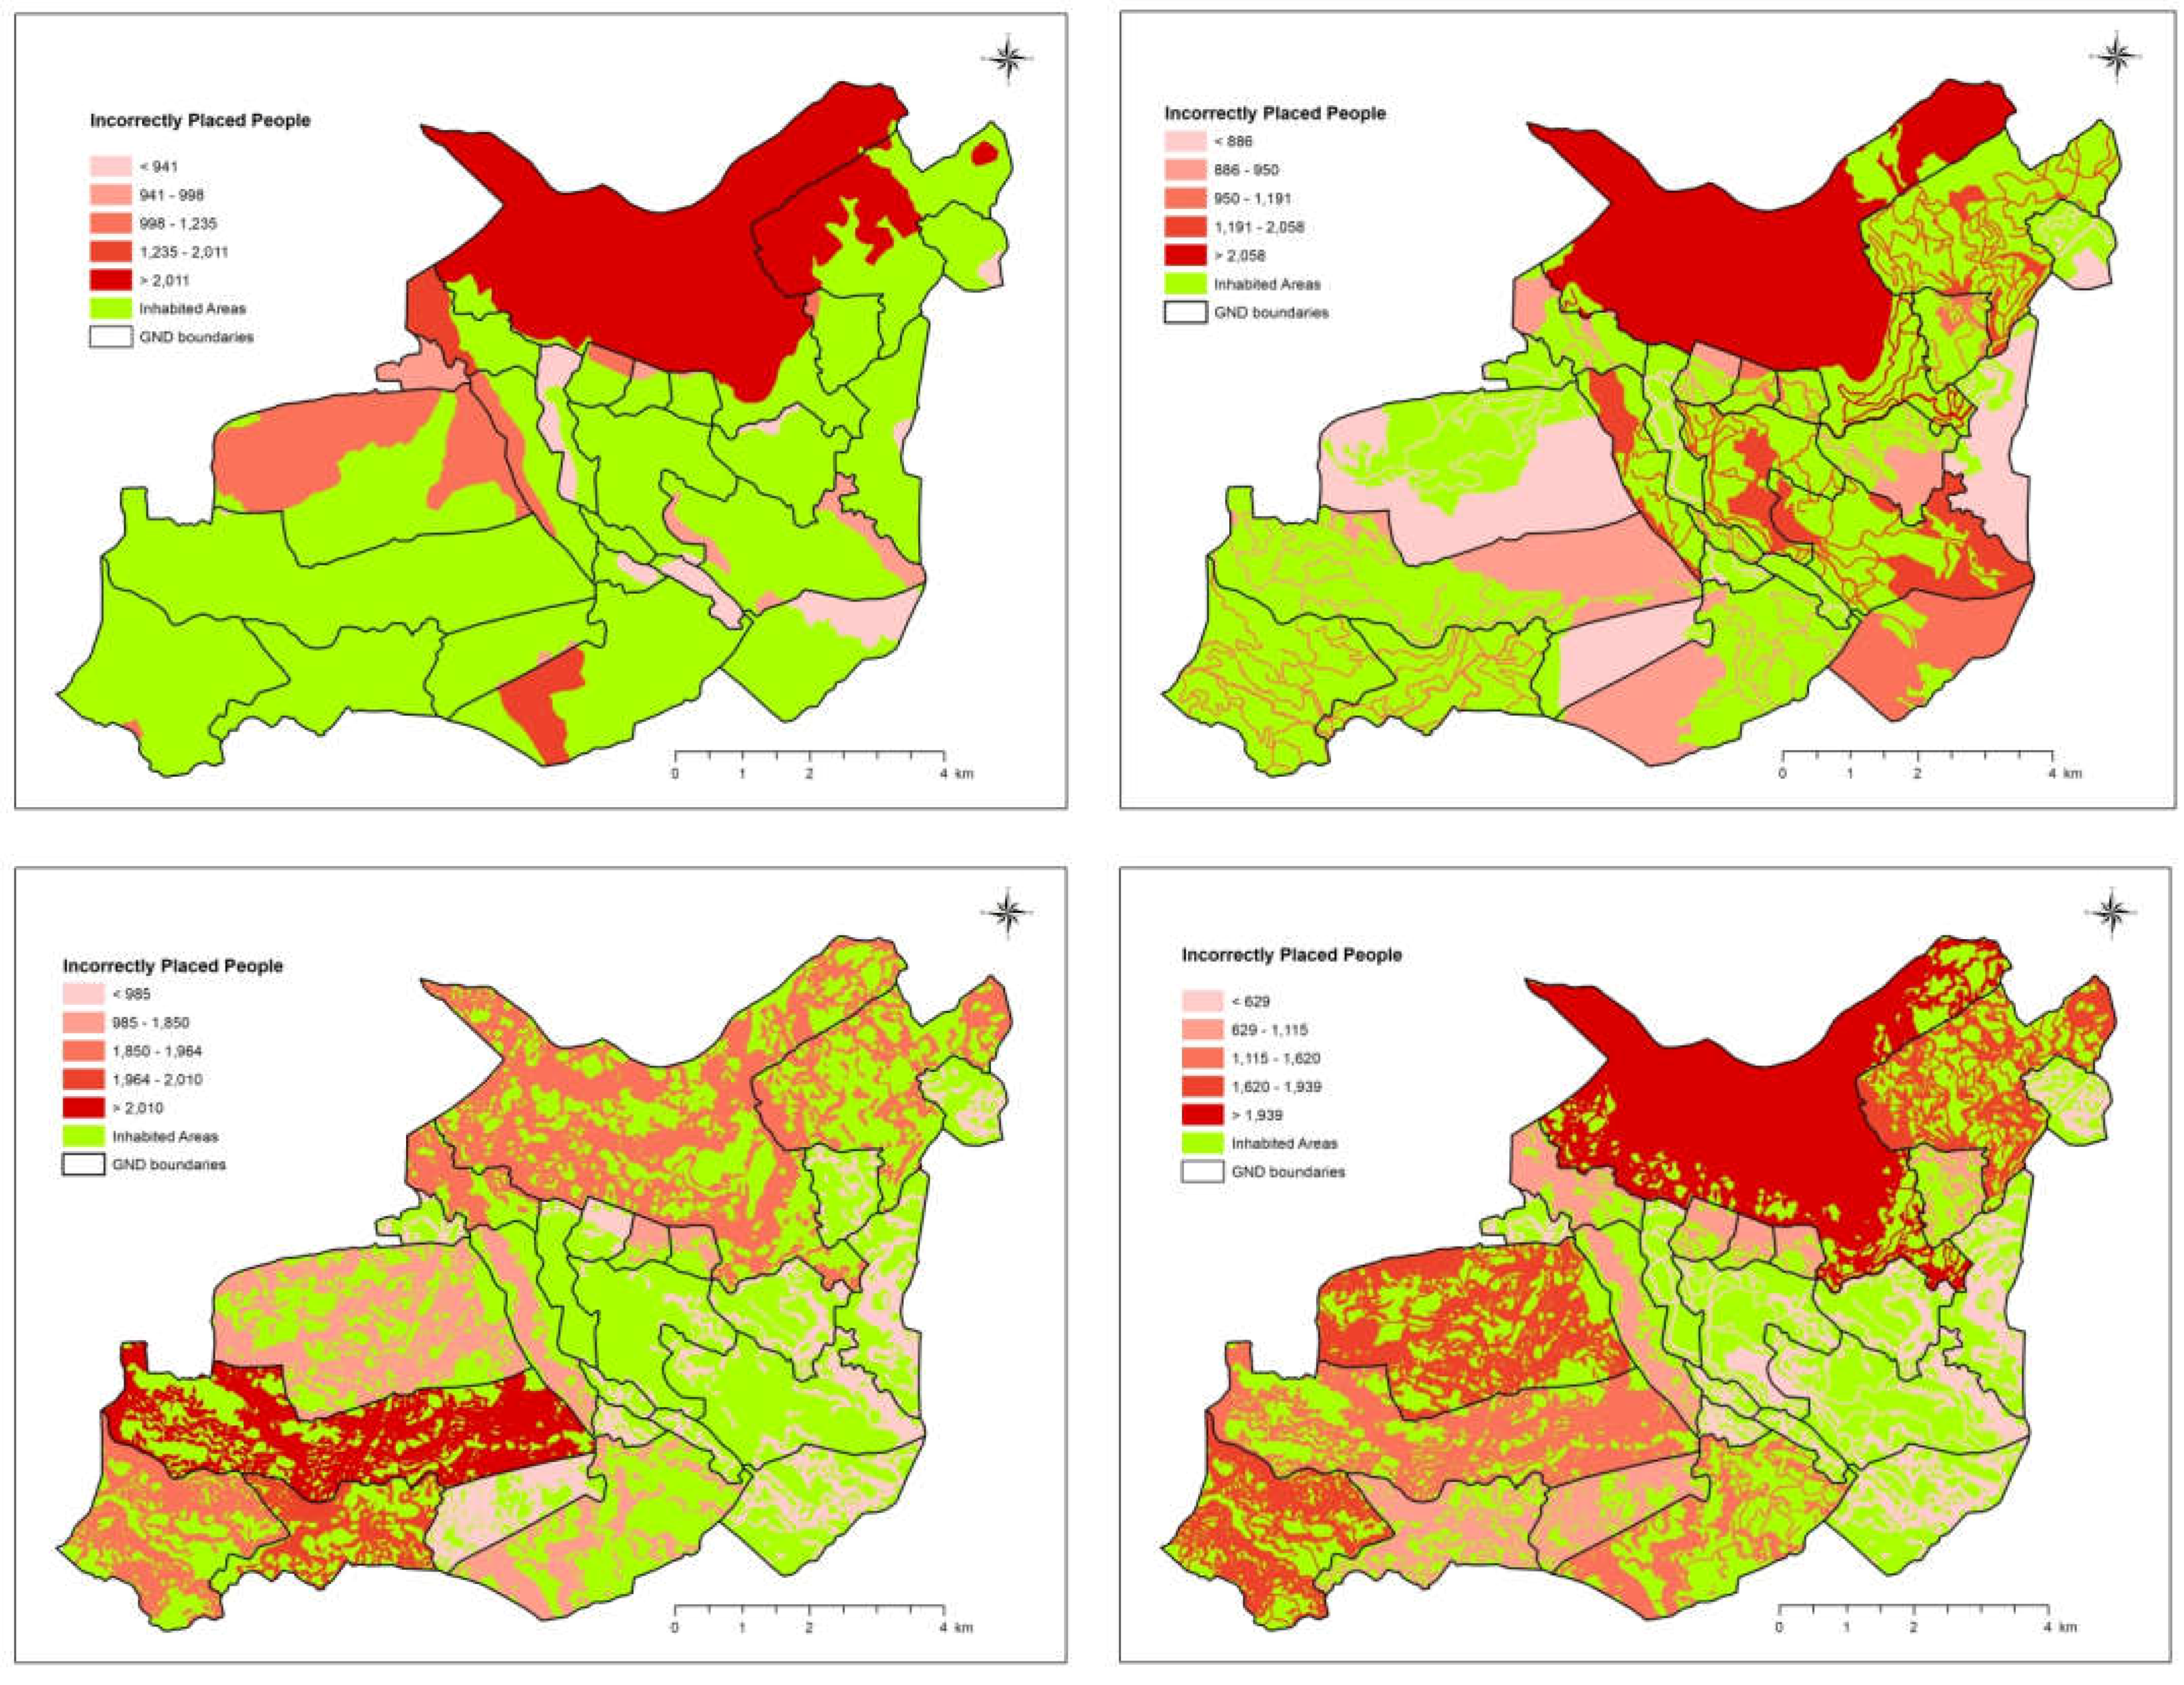
4. Results for Hilly Area Dasymetric Mapping
5. Discussion
6. Concluding Remarks
Author Contributions
Funding
Acknowledgments
Conflicts of Interest
References
- Azar, D.; Engstrom, R.; Graesser, J.; Comenetz, J. Generation of fine-scale population layers using multi-resolution satellite imagery and geospatial data. Remote Sens. Environ. 2013, 130, 219–232. [Google Scholar] [CrossRef]
- Dmowska, A.; Stepinski, T.F. High resolution Dasymetric model of U.S demographics with application to spatial distribution of racial diversity. Appl. Geogr. 2014, 53, 417–426. [Google Scholar] [CrossRef]
- Jia, P.; Qiu, Y.; Gaughan, A.E. A fine-scale spatial population distribution on the High-resolution Gridded Population Surface and application in Alachua County, Florida. Appl. Geogr. 2014, 50, 99–107. [Google Scholar] [CrossRef]
- Cockx, K.; Canters, F. Incorporating spatial non-stationarity to improve Dasymetric mapping of population. Appl. Geogr. 2015, 63, 220–230. [Google Scholar] [CrossRef]
- Weber, E.M.; Seaman, V.Y.; Stewart, R.N.; Bird, T.J.; Tatem, A.J.; McKee, J.J.; Bhaduri, B.L.; Moehl, J.J.; Reith, A.E. Census-independent population mapping in northern Nigeria. Remote Sens. Environ. 2018, 204, 786–798. [Google Scholar] [CrossRef]
- Garcia, R.A.C.; Oliveira, S.C.; Zêzere, J.L. Assessing population exposure for landslide risk analysis using dasymetric cartography. Nat. Hazards Earth Syst. Sci. 2016, 16, 2769–2782. [Google Scholar] [CrossRef]
- Fuchs, S.; Keiler, M.; Zischg, A. A spatiotemporal multi-hazard exposure assessment based on property data. Nat. Hazards Earth Syst. Sci. 2015, 15, 2127–2142. [Google Scholar] [CrossRef]
- Fuchs, S.; Sokratov, S.A.; Keiler, M.; Shnyparkov, A. Spatiotemporal dynamics: The need for an innovative approach in mountain hazard risk management. Nat. Hazards 2013, 68, 1217–1241. [Google Scholar] [CrossRef]
- Freire, S.; Aubrecht, C.; Wegscheider, S. Advancing tsunami risk assessment by improving spatio-temporal population exposure and evacuation modeling. Nat. Hazards 2013, 68, 1311–1324. [Google Scholar] [CrossRef]
- Freire, S.; Aubrecht, C. Integrating population dynamics into mapping human exposure to seismic hazard. Nat. Hazards Earth Syst. Sci. 2012, 12, 3533–3543. [Google Scholar] [CrossRef]
- Calka, B.; Da Costa, N.J.; Bielecka, E. Fine scale population density data and its application in risk assessment. Geomat. Nat. Hazards Risk 2017, 8, 1440–1455. [Google Scholar] [CrossRef]
- Calka, B.; Bielecka, E.; Zdunkiewicz, K. Redistribution population data across a regular spatial grid according to buildings characteristics. Geod. Cartogr. 2016, 65, 149–162. [Google Scholar] [CrossRef]
- De Silva, W.I. A Population Projection of Sri Lanka for the New Millennium, 2001–2101: Trends and Implications; IHP Publishers: Colombo, Sri Lanka, 2007; p. 5. [Google Scholar]
- Department of Census and Statistics—Sri Lanka. Available online: http://www.webcitation.org/75ejkY9Iu (accessed on 23 January 2019).
- Emmanuel, R. Assessment of Impact of Land Cover Changes on Urban Bioclimate: The Case of Colombo, Sri Lanka. Archit. Sci. Rev. 2003, 46, 151–158. [Google Scholar] [CrossRef]
- Emmanuel, R.; Rosenlund, H.; Johansson, E. Urban shading—A design option for the tropics? A study in Colombo, Sri Lanka. Int. J. Climatol. 2007, 27, 1995–2004. [Google Scholar]
- Senanayake, I.P.; Welivitiya, W.D.D.P.; Nadeeka, P.M. Remote sensing-based analysis of urban heat islands with vegetation cover in Colombo city, Sri Lanka using Landsat-7 ETM+ data. Urban Clim. 2013, 5, 19–35. [Google Scholar] [CrossRef]
- Senanayake, I.P.; Welivitiya, W.D.D.P.; Nadeeka, P.M. Urban green spaces analysis for development planning in Colombo, Sri Lanka, utilizing THEOS satellite imagery—A remote sensing and GIS approach. Urban For. Urban Green. 2013, 12, 307–314. [Google Scholar] [CrossRef]
- Hettiarachchi, M.; Wickramasinghe, D.; Mapa, R.; Morrison, T. The eco-social transformation of urban wetlands: A case study of Colombo, Sri Lanka. Landsc. Urban Plan. 2014, 132, 55–68. [Google Scholar] [CrossRef]
- Johansson, E.; Emmanuel, R. The influence of urban design on outdoor thermal comfort in the hot, humid city of Colombo, Sri Lanka. Int. J. Biometeorol. 2006, 51, 119–133. [Google Scholar] [CrossRef]
- Perera, N.G.R.; Emmanuel, R. A ‘Local Climate Zone’ based approach to urban planning in Colombo, Sri Lanka. Urban Clim. 2016, 23, 188–203. [Google Scholar] [CrossRef]
- Wright, J.K. A Method of Mapping Densities of Population: With Cape Cod as an Example. Geogr. Rev. 1936, 26, 103–110. [Google Scholar] [CrossRef]
- Fisher, P.F.; Langford, M. Modeling Sensitivity to Accuracy in Classified Imagery: A Study of Areal Interpolation by Dasymetric Mapping. Prof. Geogr. 1996, 48, 299–309. [Google Scholar] [CrossRef]
- Creamer, M.C. Isolines in Population Density Mapping. Prof. Geogr. 1958, 10, 14–15. [Google Scholar] [CrossRef]
- Haaland, C.M.; Heath, M.T. Mapping of population density. Demography. 1974, 11, 321–336. [Google Scholar] [CrossRef]
- Lin, Z.; Oguchi, T.; Duan, F. Topographic and climate influences on population and soil in East to Southeast Asia: A GIS approach. Geogr. Rev. Jpn. 1999, 72, 181–192. [Google Scholar] [CrossRef]
- Ural, S.; Hussain, E.; Shan, J. Building population mapping with aerial imagery and GIS data. Int. J. Appl. Earth Obs. Geoinf. 2011, 13, 841–852. [Google Scholar] [CrossRef]
- Alahmadi, M.; Atkinson, P.; Martin, D. Estimating the spatial distribution of the population of Riyadh, Saudi Arabia using remotely sensed built land cover and height data. Comput. Environ. Urban Syst. 2013, 41, 167–176. [Google Scholar] [CrossRef]
- Patel, N.N.; Angiuli, E.; Gamba, P.; Gaughan, A.; Lisini, G.; Stevens, F.R.; Tatem, A.J.; Trianni, G. Multitemporal settlement and population mapping from Landsatusing Google Earth, Engine. Int. J. Appl. Earth Obs. Geoinf. 2015, 35, 199–208. [Google Scholar] [CrossRef]
- Zoraghein, H.; Leyk, S.; Ruther, M.; Buttenfield, B.P. Exploiting temporal information in parcel data to refine small area population estimates. Comput. Environ. Urban Syst. 2016, 58, 19–28. [Google Scholar] [CrossRef]
- Yao, Y.; Liu, X.; Li, X.; Zhang, J.; Liang, Z.; Mai, K.; Zhang, Y. Mapping fine-scale population distributions at the building level by integrating multisource geospatial big data. Int. J. Geogr. Inf. Sci. 2017, 31, 1220–1244. [Google Scholar] [CrossRef]
- GHSL—Global Human Settlement Layer. Available online: http://www.webcitation.org/76PdvAt5G (accessed on 23 February 2019).
- Eicher, C.L.; Brewer, C.A. Dasymetric Mapping and Areal Interpolation: Implementation and Evaluation. Cartogr. Geogr. Inf. Sci. 2001, 28, 125–138. [Google Scholar] [CrossRef]
- Zandbergen, P.A. Dasymetric Mapping Using High Resolution Address Point Datasets. Trans. GIS 2011, 15, 5–27. [Google Scholar] [CrossRef]
- Bozheva, A.M.; Petrov, A.N.; Sugumaran, R. The Effect of Spatial Resolution of Remotely Sensed Data in Dasymetric Mapping of Residential Areas. GISci. Remote Sens. 2005, 42, 113–130. [Google Scholar] [CrossRef]
- Zandbergen, P.A.; Ignizio, D.A. Comparison of Dasymetric Mapping Techniques for Small-Area Population Estimates. Cartogr. Geogr. Inf. Sci. 2010, 37, 199–214. [Google Scholar] [CrossRef]
- Brehme, C.E.; McCarron, P.; Tetreault, H. A Dasymetric Map of Maine Lobster Trap Distribution Using Local Knowledge. Prof. Geogr. 2015, 67, 98–109. [Google Scholar] [CrossRef]
- Lloyd, C.T. High resolution global gridded data for use in population studies. Int. Arch. Photogramm. Remote Sens. Spat. Inf. Sci. 2017, 4, 117–120. [Google Scholar] [CrossRef]
- Lung, T.; Ngochoch, J.K.; Lübker, T.; Schaab, G. Human population distribution modelling at regional level using very high-resolution satellite imagery. Appl. Geogr. 2013, 41, 36–45. [Google Scholar] [CrossRef]
- Linard, C. Modelling changing population distributions: An example of the Kenyan Coast, 1979–2009. Int. J. Digit. Earth 2017, 10, 1017–1029. [Google Scholar] [CrossRef]
- Su, M.; Lin, M.; Hsieh, H.; Tsai, B.; Lin, C. Multi-layer multi-class Dasymetric mapping to estimate population distribution. Sci. Total Environ. 2010, 408, 4807–4816. [Google Scholar] [CrossRef]
- Department of Surveying of Sri Lanka. Sri Lankan Topological Maps; Department of Survey: Colombo, Sri Lanka, 2003.
- Department of Surveying of Sri Lanka. Sri Lankan Topological Maps; Department of Survey: Colombo, Sri Lanka, 2010.
- Jenks, G.F. Optimal data classification for choropleth maps. In Occasional Paper 2; Department of Geography, University of Kansas: Lawrence, KS, USA, 1977. [Google Scholar]
- Willmott, C.J.; Matsuura, K. Advantages of the mean absolute error (MAE) over the root mean square error (RMSE) in assessing average model performance. Clim. Res. 2005, 30, 79–82. [Google Scholar] [CrossRef]
- Schroeder, J.P. Hybrid areal interpolation of census counts from 2000 blocks to 2010 geographies. Comput. Environ. Urban Syst. 2017, 62, 53–63. [Google Scholar] [CrossRef]
- Jain, D.; Tiwari, G. Population disaggregation to capture short trips—Vishakhapatnam, India. Comput. Environ. Urban Syst. 2017, 62, 7–18. [Google Scholar] [CrossRef]
- Wei, C.; Taubenbock, H.; Blaschke, T. Measuring urban agglomeration using a city-scale Dasymetric population map: A study in the Pearl River Delta, China. Habitat Int. 2017, 59, 32–43. [Google Scholar] [CrossRef]
- Goodchild, M.F.; Anselin, L.; Deichmann, U. A framework for the areal interpolation of socioeconomic data. Environ. Plan. 1993, 25, 383–397. [Google Scholar] [CrossRef]
- Holt, J.B.; Lo, C.P.; Hodler, T.W. Dasymetric Estimation of Population Density and Areal Interpolation of Census Data. Cartogr. Geogr. Inf. Sci. 2004, 31, 103–121. [Google Scholar] [CrossRef]
- Langford, M. Obtaining population estimates in non-census reporting zones: An evaluation of the 3-class dasymetric method. Comput. Environ. Urban Syst. 2006, 30, 161–180. [Google Scholar] [CrossRef]
- Tobler, W.R. Smooth pycnophylactic interpolation for geographical regions. J. Am. Stat. Assoc. 1979, 74, 519–530. [Google Scholar] [CrossRef]
- Song, G.; Yu, M.; Liu, S.; Zhang, S. A dynamic model for population mapping: A methodology integrating a Monte Carlo simulation with vegetation-adjusted night-time light images. Int. J. Remote Sens. 2015, 36, 4054–4068. [Google Scholar] [CrossRef]


| Ancillary Classes | % of Area | Weighting 1 (%) | Weighting 2 (%) | Weighting 3 (%) |
|---|---|---|---|---|
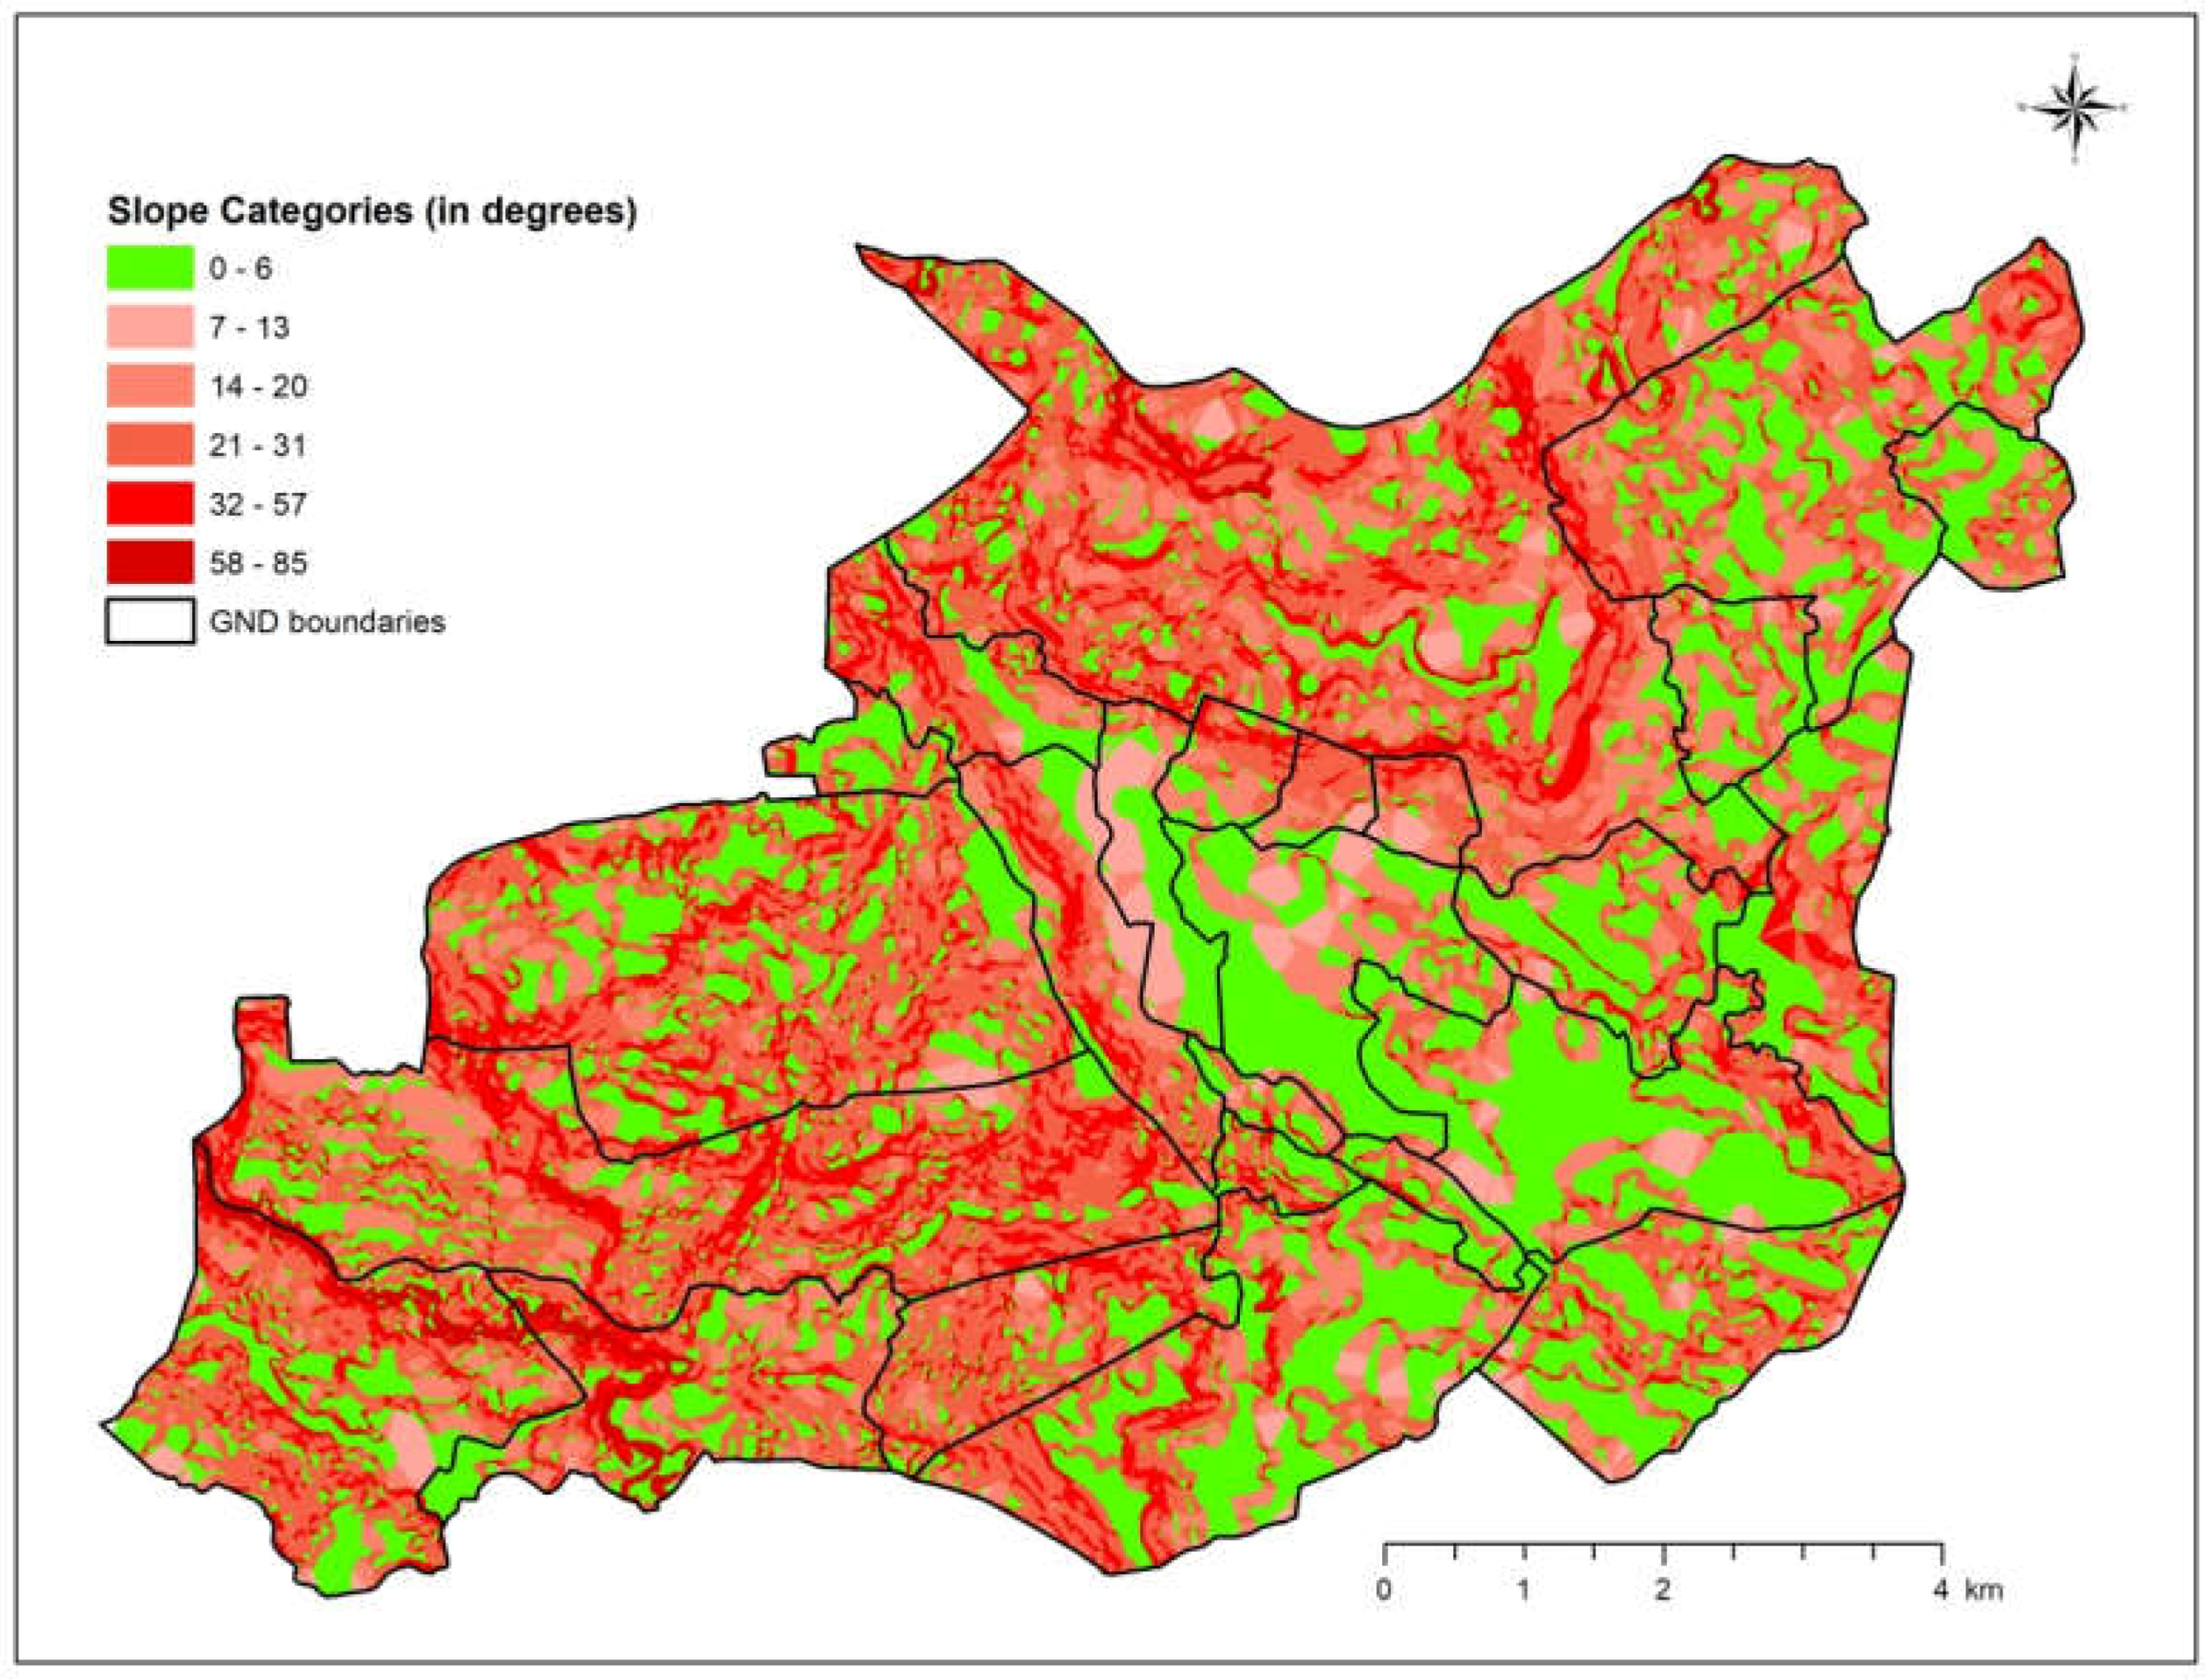
| Slope | ||||
| 0–6 | 31.16 | 70 | 75 | 80 |
| 7–13 | 3.15 | 20 | 17 | 15 |
| 14–20 | 15.36 | 10 | 8 | 5 |
| 21–31 | 36.59 | 0 | 0 | 0 |
| 32–57 | 11.79 | 0 | 0 | 0 |
| 58–85 | 1.95 | 0 | 0 | 0 |
| RMSE | - | 624 | 611 | 551 |
| MAE | - | 480 | 420 | 353 |
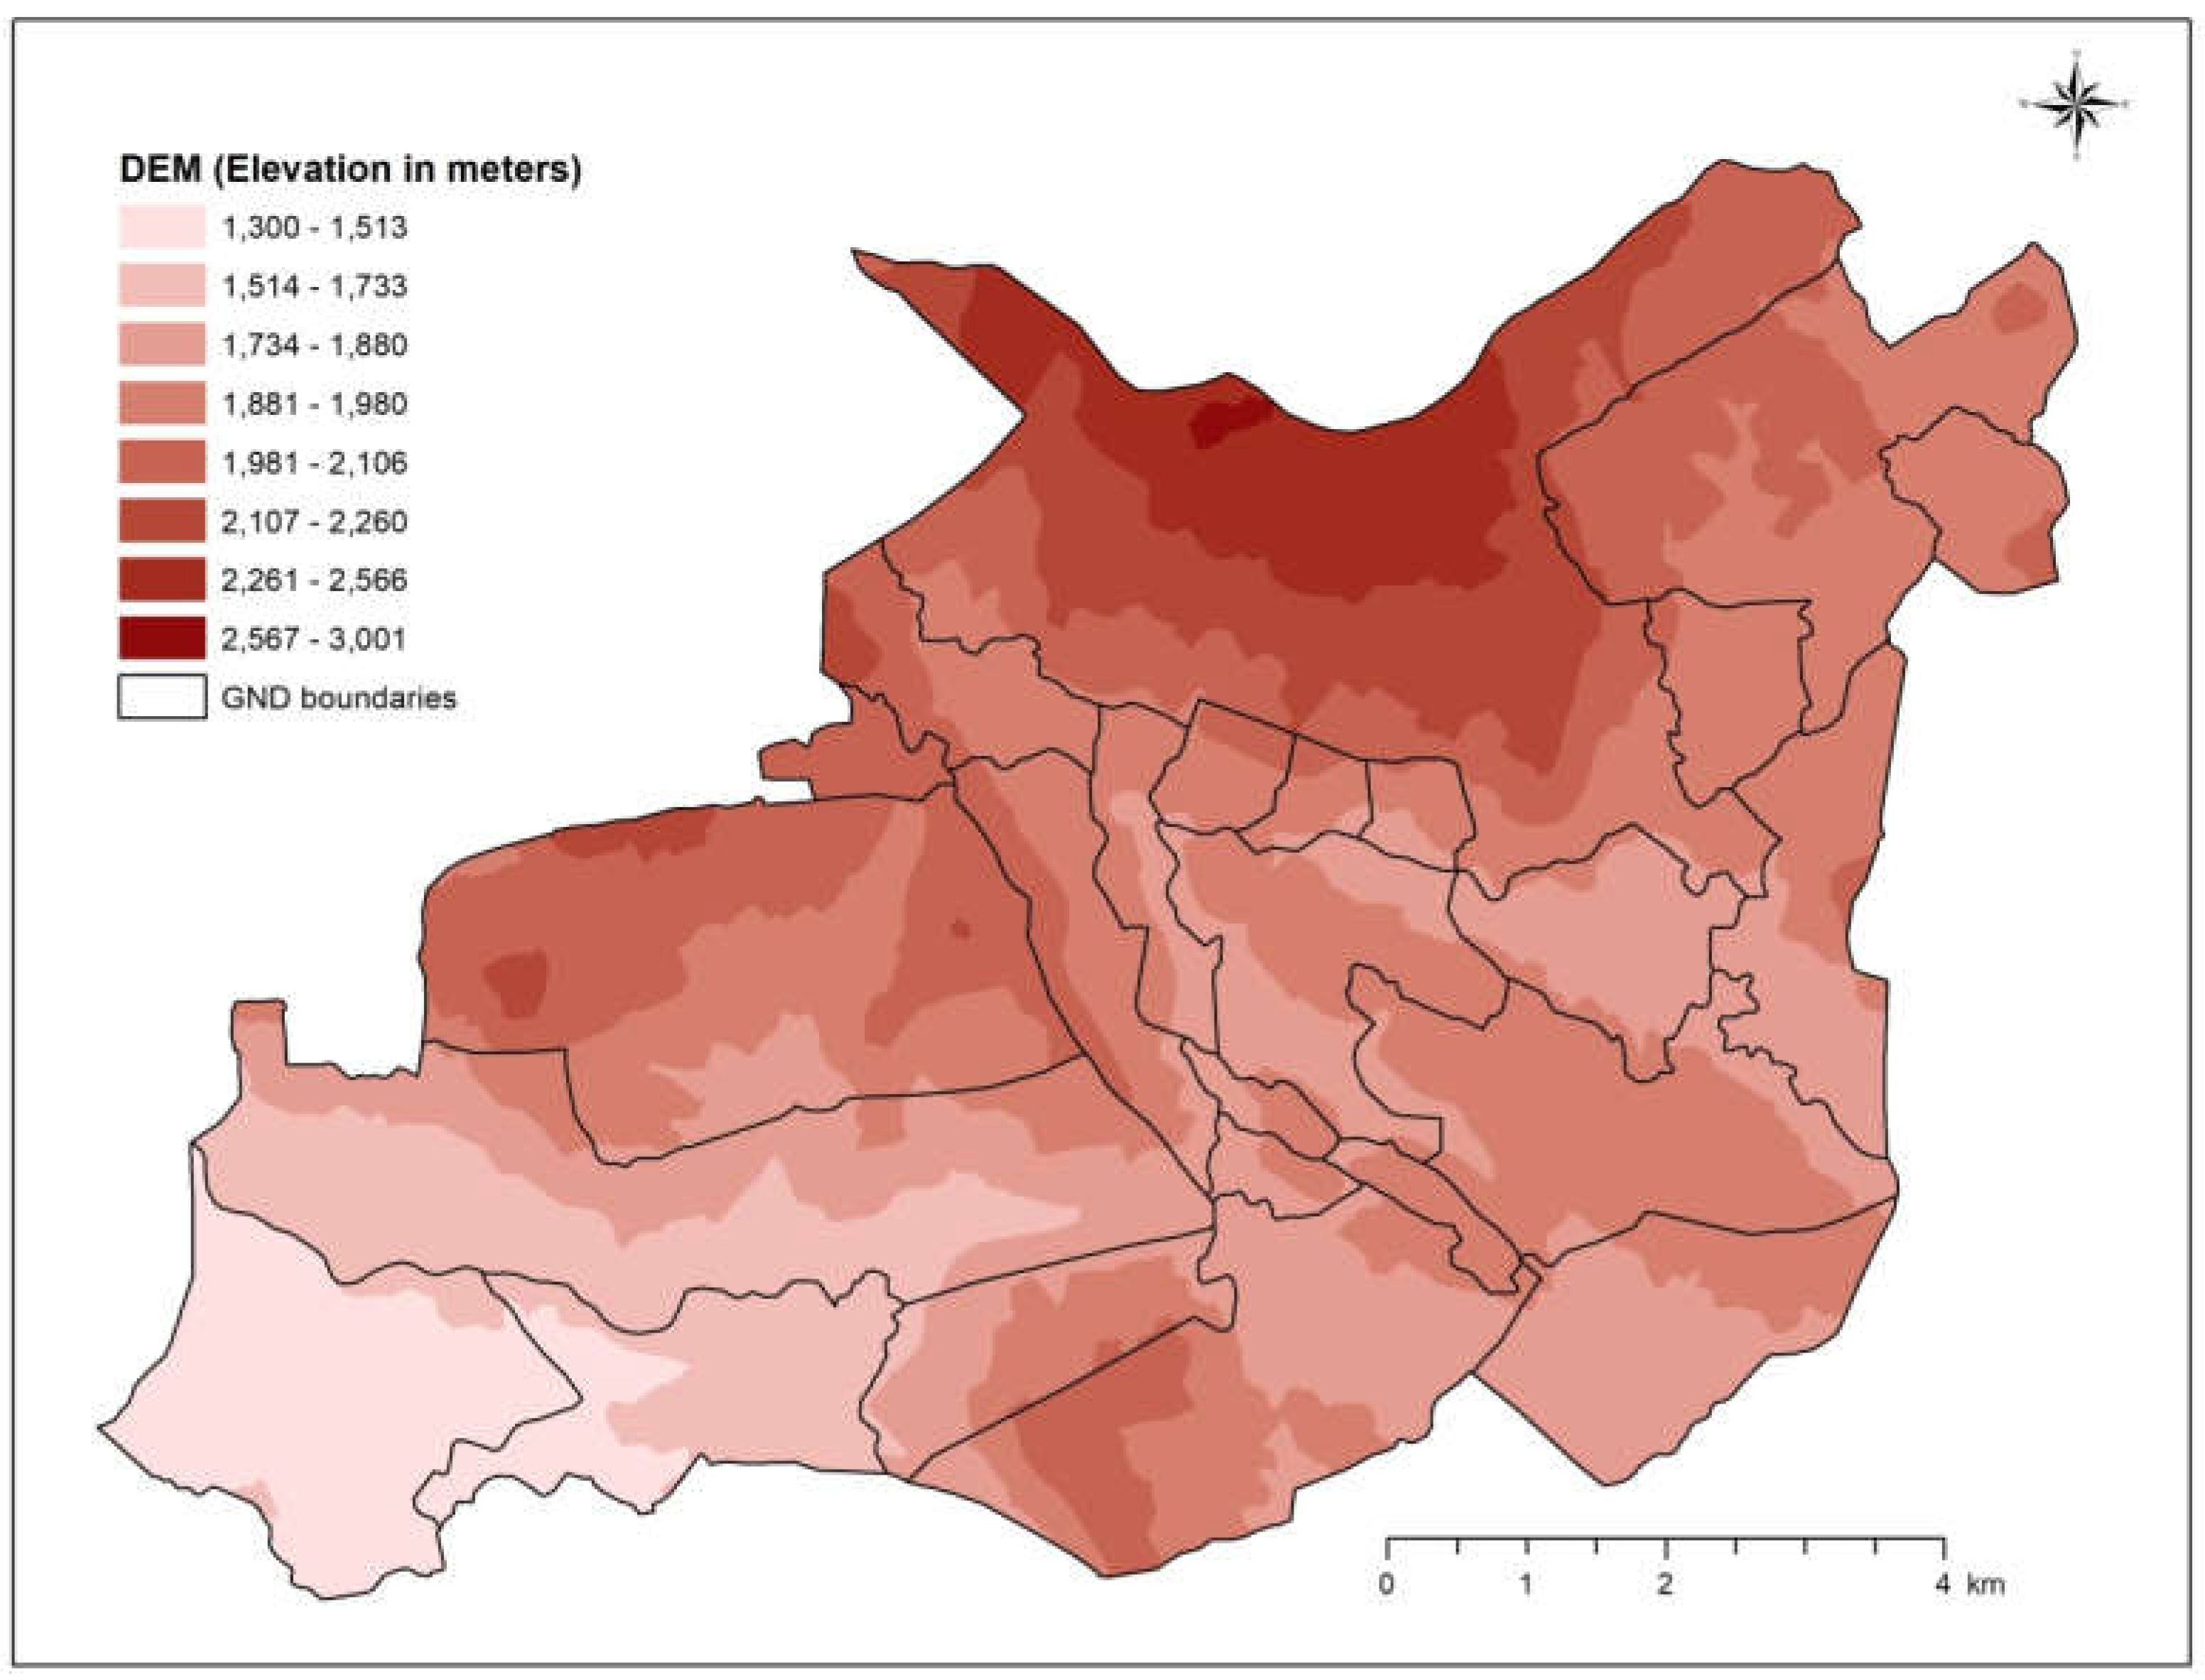
| Elevation | ||||
| 1300–1513 | 7.27 | 70 | 75 | 65 |
| 1514–1733 | 8.64 | 20 | 17 | 18 |
| 1734–1880 | 20.83 | 8 | 5 | 10 |
| 1881–1980 | 32.81 | 2 | 3 | 7 |
| 1981–2106 | 18.12 | 0 | 0 | 0 |
| 2107–2260 | 7.50 | 0 | 0 | 0 |
| 2261–2566 | 4.71 | 0 | 0 | 0 |
| 2567–3001 | 0.12 | 0 | 0 | 0 |
| RMSE | - | 991 | 913 | 1042 |
| MAE | - | 682 | 667 | 730 |
| Land use and land cover | ||||
| Home Gardens | 11.14 | 70 | 80 | 75 |
| Other Plantations | 4.11 | 20 | 15 | 17 |
| Tea | 32.07 | 8 | 4 | 5 |
| Rubber | 0.58 | 2 | 1 | 3 |
| Ela (Stream) | 0.48 | 0 | 0 | 0 |
| Lake | 0.54 | 0 | 0 | 0 |
| Tank (working) | 0.005 | 0 | 0 | 0 |
| Water Bodies | 0.08 | 0 | 0 | 0 |
| Jeep or Cart Tracks | 6.60 | 0 | 0 | 0 |
| Main Roads (A) | 1.06 | 0 | 0 | 0 |
| Main Roads (B) | 1.12 | 0 | 0 | 0 |
| Minor Roads | 0.73 | 0 | 0 | 0 |
| Rock | 0.21 | 0 | 0 | 0 |
| Paddy | 0.67 | 0 | 0 | 0 |
| Forest | 35.00 | 0 | 0 | 0 |
| Scrubs | 5.604 | 0 | 0 | 0 |
| RMSE | - | 875 | 809 | 842 |
| MAE | - | 527 | 491 | 509 |
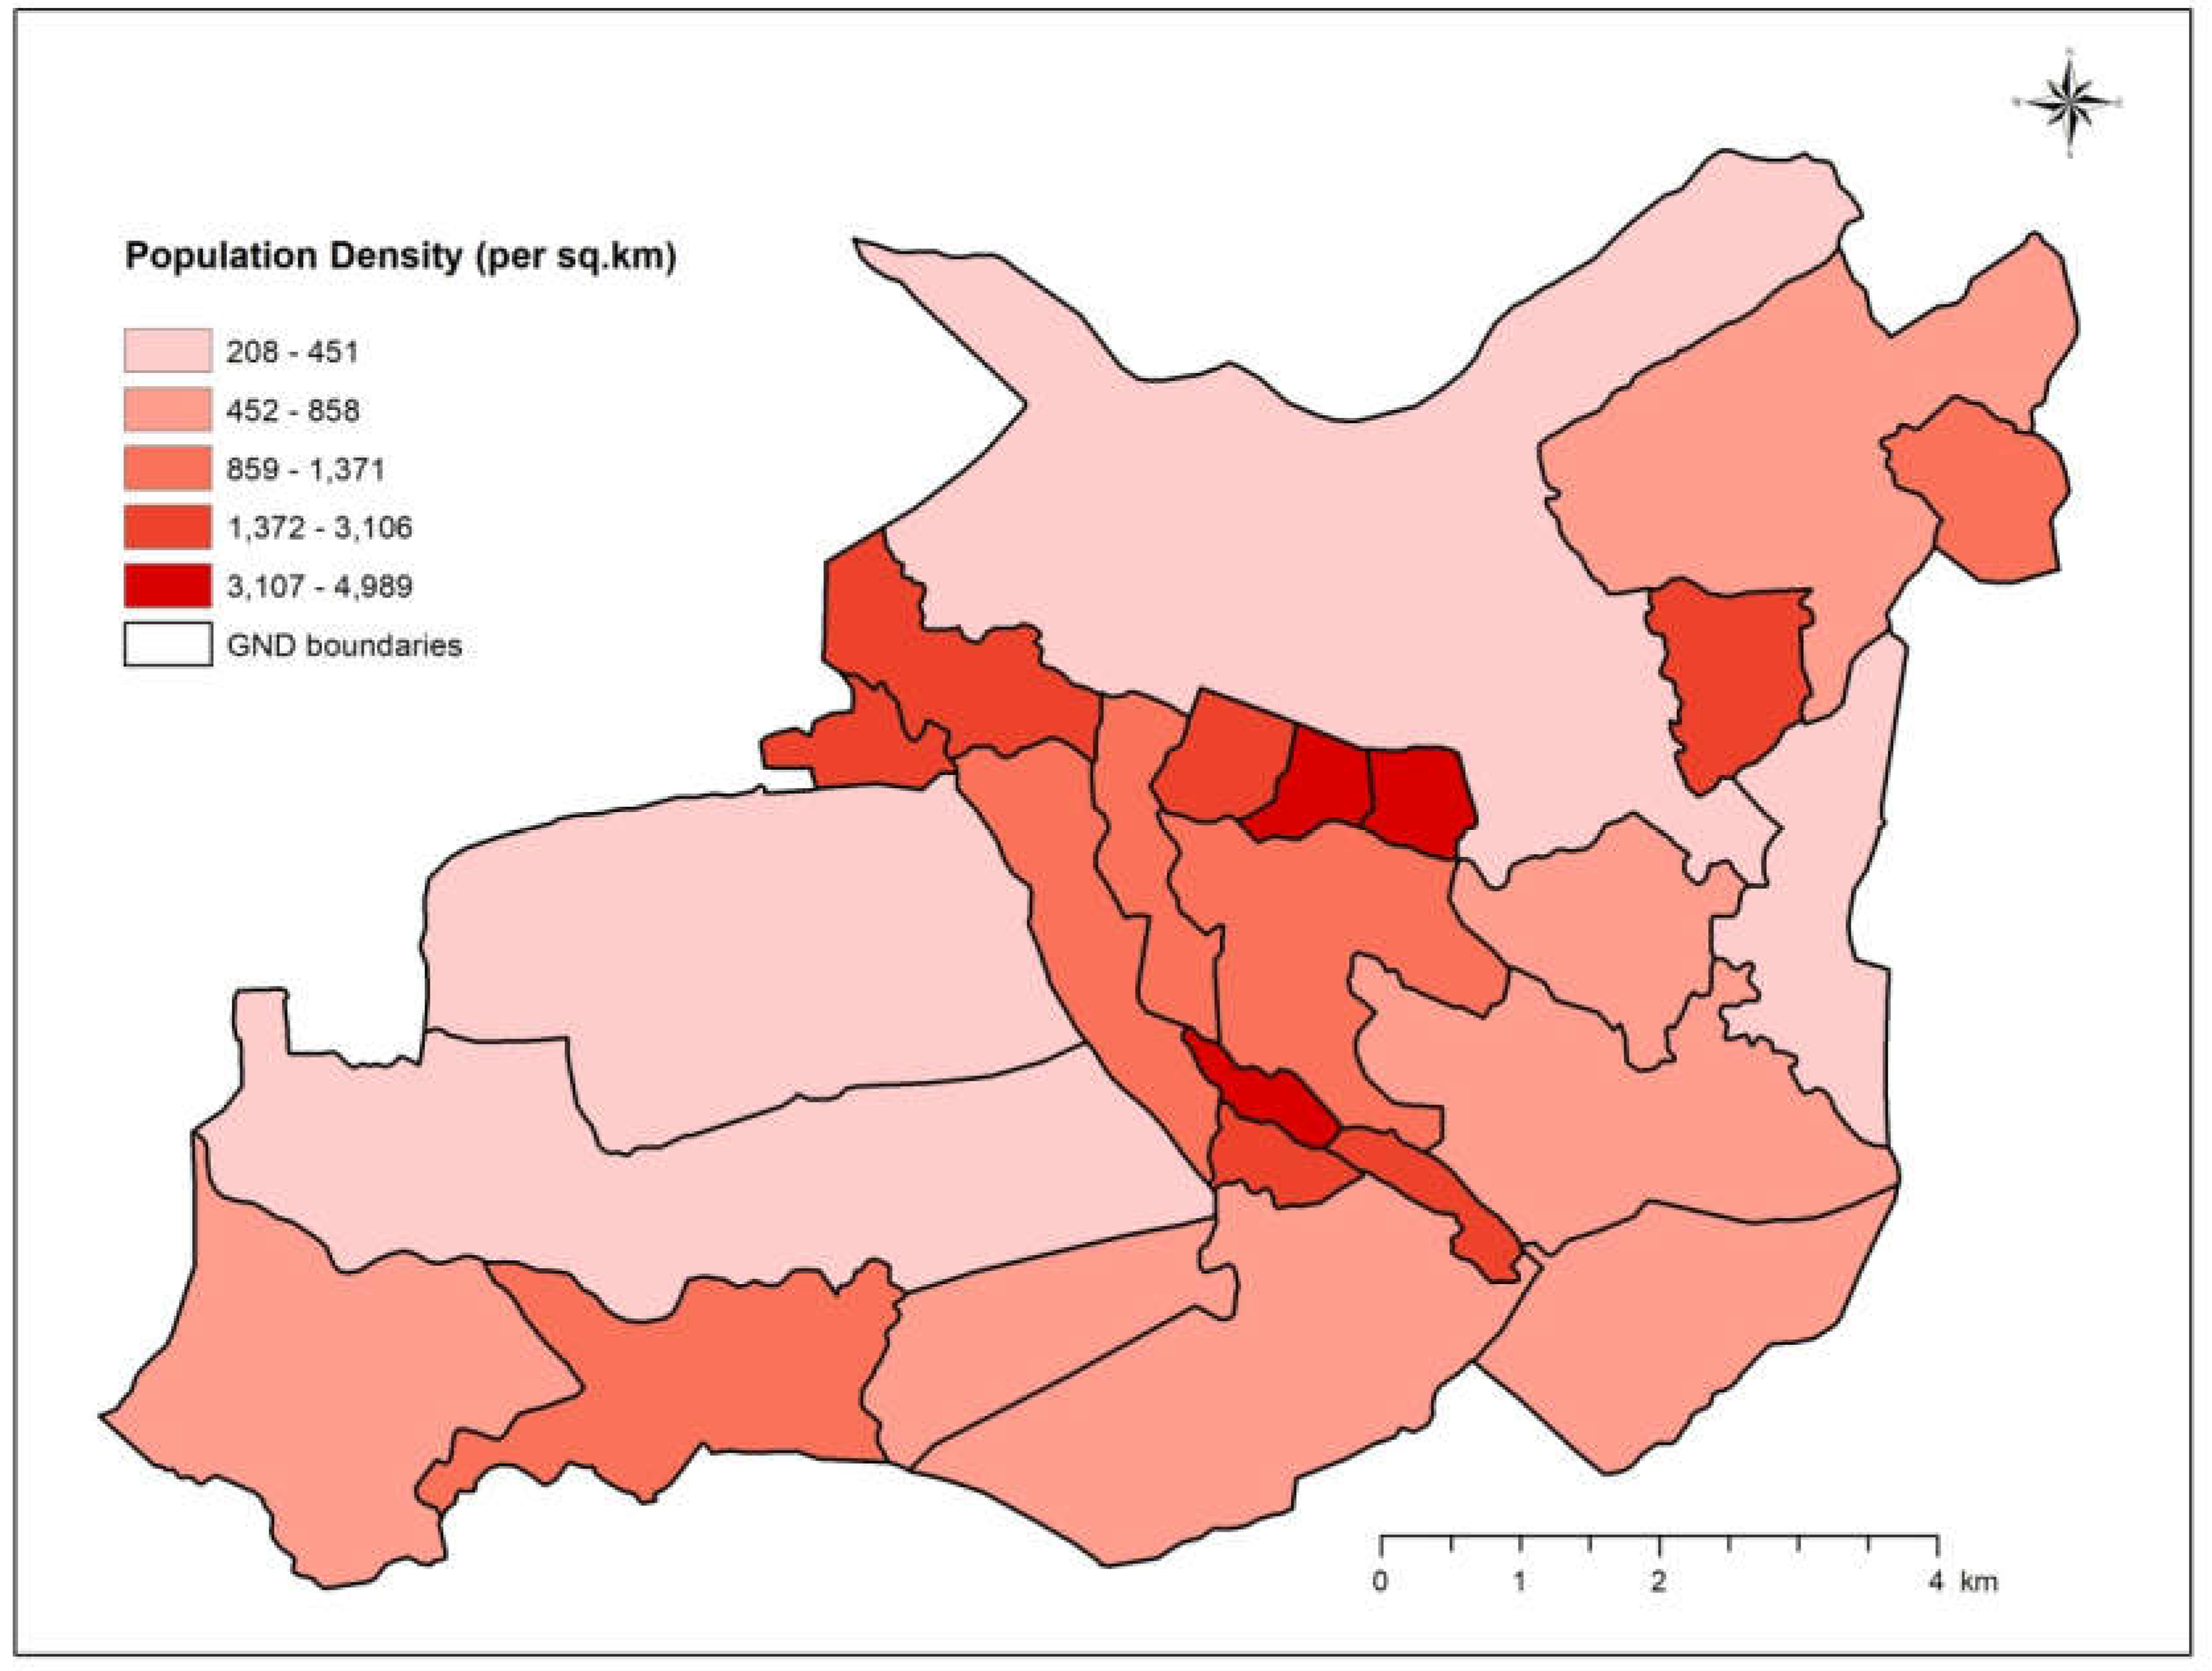
| No. | Name of GND | Total Population | Area (km2) | Population Density | Incorrectly Placed People | |||||||
|---|---|---|---|---|---|---|---|---|---|---|---|---|
| Altitude | % of Total | Land Use | % of Total | Slope | % of Total | Combined | % of Total | |||||
| 1 | Bambarakele | 3143 | 1.6060 | 1957 | 2011 | 64 | 901 | 29 | 1950 | 62 | 1115 | 35 |
| 2 | Bangalahatha | 3333 | 9.3361 | 357 | 935 | 28 | 940 | 28 | 2058 | 62 | 1620 | 49 |
| 3 | Bulu Ela | 1751 | 2.0408 | 858 | 941 | 54 | 901 | 51 | 510 | 29 | 451 | 26 |
| 4 | Galpalama | 1222 | 2.7095 | 451 | 638 | 52 | 710 | 58 | 411 | 34 | 391 | 32 |
| 5 | Hawaeliya East | 2273 | 0.5024 | 4524 | 998 | 44 | 1094 | 48 | 1001 | 44 | 987 | 43 |
| 6 | Hawaeliya North | 2216 | 0.4663 | 4752 | 991 | 45 | 1001 | 45 | 1027 | 46 | 1051 | 47 |
| 7 | Hawaeliya West | 2072 | 0.6671 | 3106 | 1131 | 55 | 950 | 46 | 811 | 39 | 751 | 36 |
| 8 | Kalapura | 3465 | 8.9075 | 389 | 1169 | 34 | 809 | 23 | 1850 | 53 | 1771 | 51 |
| 9 | Kalukele | 1093 | 0.4545 | 2405 | 548 | 50 | 610 | 56 | 508 | 46 | 464 | 42 |
| 10 | Kandapola | 1426 | 1.1500 | 1240 | 748 | 52 | 790 | 55 | 470 | 33 | 466 | 33 |
| 11 | Kandapola Central | 2853 | 1.2502 | 2282 | 1235 | 43 | 1101 | 39 | 780 | 27 | 687 | 24 |
| 12 | Kelegala | 1829 | 0.3666 | 4989 | 721 | 39 | 1010 | 55 | 560 | 31 | 556 | 30 |
| 13 | Kirimetiya | 3967 | 5.9209 | 670 | 1301 | 33 | 950 | 24 | 1480 | 37 | 1220 | 31 |
| 14 | Magastota | 1408 | 0.5050 | 2788 | 571 | 41 | 710 | 50 | 440 | 31 | 315 | 22 |
| 15 | Nanuoya | 3860 | 3.4744 | 1111 | 938 | 24 | 1191 | 31 | 2010 | 52 | 1109 | 29 |
| 16 | Nuwaraeliya | 1290 | 1.2034 | 1072 | 679 | 53 | 886 | 69 | 85 | 07 | 68 | 5 |
| 17 | Nuwaraeliya Central | 4292 | 3.1306 | 1371 | 861 | 20 | 1792 | 42 | 430 | 10 | 387 | 9 |
| 18 | Nuwaraeliya West | 2481 | 2.0555 | 1207 | 1008 | 41 | 816 | 33 | 1150 | 46 | 1035 | 42 |
| 19 | Park | 4463 | 6.1559 | 725 | 2875 | 64 | 2058 | 46 | 1915 | 43 | 1939 | 43 |
| 20 | Pedro | 3316 | 15.9423 | 208 | 2471 | 75 | 2080 | 63 | 1964 | 59 | 1940 | 59 |
| 21 | Sandathenna | 2816 | 4.7090 | 598 | 948 | 34 | 1968 | 70 | 612 | 22 | 514 | 18 |
| 22 | Seethaeliya | 1815 | 3.2940 | 551 | 859 | 47 | 1066 | 59 | 710 | 39 | 629 | 35 |
| 23 | Shanthipura | 1408 | 0.6205 | 2269 | 962 | 68 | 797 | 57 | 545 | 39 | 448 | 32 |
| 24 | Summerset | 3522 | 5.2567 | 670 | 1178 | 33 | 1162 | 33 | 1910 | 54 | 1687 | 48 |
| 25 | Windicorner | 1667 | 2.2930 | 727 | 962 | 58 | 661 | 40 | 985 | 59 | 791 | 47 |
| Total | 62,981 | 84.06 | - | 27,679 | 44 | 26,954 | 43 | 26,172 | 42 | 22,392 | 36 | |
| Errors | Dasymetric Approaches | |||
|---|---|---|---|---|
| Combined | Slope Angle | Land Use | Altitude | |
| RMSE | 442.26 | 551.21 | 809.00 | 913.11 |
| MAE | 294.54 | 352.78 | 590.57 | 666.57 |
| Standard deviation | 393.61 | 501.61 | 728.10 | 834.89 |
| Standard error | 11.01 | 14.54 | 21.30 | 24.07 |
© 2019 by the authors. Licensee MDPI, Basel, Switzerland. This article is an open access article distributed under the terms and conditions of the Creative Commons Attribution (CC BY) license (http://creativecommons.org/licenses/by/4.0/).
Share and Cite
Karunarathne, A.; Lee, G. Estimating Hilly Areas Population Using a Dasymetric Mapping Approach: A Case of Sri Lanka’s Highest Mountain Range. ISPRS Int. J. Geo-Inf. 2019, 8, 166. https://doi.org/10.3390/ijgi8040166
Karunarathne A, Lee G. Estimating Hilly Areas Population Using a Dasymetric Mapping Approach: A Case of Sri Lanka’s Highest Mountain Range. ISPRS International Journal of Geo-Information. 2019; 8(4):166. https://doi.org/10.3390/ijgi8040166
Chicago/Turabian StyleKarunarathne, Ananda, and Gunhak Lee. 2019. "Estimating Hilly Areas Population Using a Dasymetric Mapping Approach: A Case of Sri Lanka’s Highest Mountain Range" ISPRS International Journal of Geo-Information 8, no. 4: 166. https://doi.org/10.3390/ijgi8040166
APA StyleKarunarathne, A., & Lee, G. (2019). Estimating Hilly Areas Population Using a Dasymetric Mapping Approach: A Case of Sri Lanka’s Highest Mountain Range. ISPRS International Journal of Geo-Information, 8(4), 166. https://doi.org/10.3390/ijgi8040166