Article

Applicability of Remote Sensing-Based Vegetation Water Content in Modeling Lightning-Caused Forest Fire Occurrences

1
Department of Geomatics Engineering, Schulich School of Engineering, University of Calgary, 2500 University Dr. NW, Calgary, AB T2N 1N4, Canada
2
Spatial Sciences Discipline, School of Earth and Planetary Sciences, Curtin University, Kent St, Bentley, WA 6102, Australia
*
Author to whom correspondence should be addressed.
ISPRS Int. J. Geo-Inf. 2019, 8(3), 143; https://doi.org/10.3390/ijgi8030143
Submission received: 21 February 2019 / Revised: 11 March 2019 / Accepted: 15 March 2019 / Published: 18 March 2019
(This article belongs to the Special Issue Natural Hazards and Geospatial Information)

Abstract

:
In this study, our aim was to model forest fire occurrences caused by lightning using the variable of vegetation water content over six fire-dominant forested natural subregions in Northern Alberta, Canada. We used eight-day composites of surface reflectance data at 500-m spatial resolution, along with historical lightning-caused fire occurrences during the 2005–2016 period, derived from a Moderate Resolution Imaging Spectroradiometer. First, we calculated the normalized difference water index (NDWI) as an indicator of vegetation/fuel water content over the six natural subregions of interest. Then, we generated the subregion-specific annual dynamic median NDWI during the 2005–2012 period, which was assembled into a distinct pattern every year. We plotted the historical lightning-caused fires onto the generated patterns, and used the concept of cumulative frequency to model lightning-caused fire occurrences. Then, we applied this concept to model the cumulative frequencies of lightning-caused fires using the median NDWI values in each natural subregion. By finding the best subregion-specific function (i.e., R2 values over 0.98 for each subregion), we evaluated their performance using an independent subregion-specific lightning-caused fire dataset acquired during the 2013–2016 period. Our analyses revealed strong relationships (i.e., R2 values in the range of 0.92 to 0.98) between the observed and modeled cumulative frequencies of lightning-caused fires at the natural subregion level throughout the validation years. Finally, our results demonstrate the applicability of the proposed method in modeling lightning-caused fire occurrences over forested regions.

1. Introduction

Human beings consider forest fires to be critical natural hazards, which damage the ecosystem and impact the economy throughout the world, including in Canada. During the last 25 years, Canada has experienced an average of 8300 fire occurrences that have burnt 2.3 million hectares of forested land every year [1]. Furthermore, Canada spends between $500 million and $1 billion to suppress forest fires every year [1]. In fact, the three most influential factors causing fires are (i) source of ignition (i.e., either lightning strikes or human activities); (ii) fuel condition; and (iii) weather regime [2]. Of the ignition sources, lightning-caused fires are relatively less frequent in Canada, but with higher impact compared to human-caused occurrences. For example, lightning-caused fires constitute ~45% of total fires on a national level, but account for ~80% of the total burnt area [3,4]. However, in Canada, the boreal forest occupies a significant proportion of forested land, where lightning-caused fires play a vital role in the natural succession of ecosystem functions [5]. Therefore, it is worthwhile to study lightning-caused forest fire occurrences in Canada to formulate fire management strategies that are better and more effective.
In recent decades, researchers have put significant efforts into studying/modeling lightning-caused fire events. For example, Wotton and Martell [6] modeled lightning-caused fires in Ontario, Canada at 20-km spatial resolution over the 1992–2003 period. They used eight input variables, such as: (i) weather, i.e., relative humidity and wind speed; (ii) fire weather indices, i.e., fine fuel moisture code, duff moisture code, drought code, initial spread index, and head fire intensity; and (iii) probability of sustained ignition, to derive the coefficients for a logistic regression model. However, validation showed a relatively weak relationship (R2 = 0.44) between the modeled and observed values. In another study conducted over the Daxinganling Mountains of Northeastern China, Chen et al. [7] predicted lightning-caused fire occurrences at 1-km spatial resolution during the 2005–2010 period. In this case, they used several datasets, including: (i) historical fire data, i.e., number of lightning strikes and lightning current intensity; (ii) meteorological data, i.e., rainfall, temperature, relative humidity, and wind speed; (iii) topographical elements, i.e., elevation, slope, and aspect; and (iv) fuel type, i.e., larch forest, Scots pine forests, mixed forest with larch, birch and oak trees, mixed forest with Scots pine, birch and oak trees, and grass. Combining the obtained information at the level of grid cells and using 70% of the historical lightning-caused fires as model training, Chen et al. generated a fire risk map comprised of five classes: very low to very high. They reported that the variables of rainfall, number of lightning strikes, and lightning current intensity were the most significant predictors. Furthermore, for the study conducted over a mountainous area in China, Liu et al. [8] generated a lightning-caused fire risk map with five risk classes at 0.5° spatial resolution based on: (i) three remote sensing-derived dynamic indices, i.e., temperature condition, vegetation condition, and water condition; and (ii) two static indices, i.e., topography and lightning density during the 2000–2006 period. Overlaying the observed lightning-caused fires during the same time period on the derived fire risk map revealed that ~69% of the fires fell under the top three classes, i.e., relatively high, high, and extremely high. In addition, over Alberta, Canada, Cha et al. [9] analyzed the spatial and temporal patterns of lightning strikes based on landscape properties, i.e., elevation, slope, soil type, and land use to generate a lightning hazard map during the 2010–2014 period. Upon analyzing the lightning strikes’ temporal distribution, i.e., occurring hours and months, they identified two thematic maps. The first one consisted of 10 classes based on elevation, slope, and soil type map, whereas the second consisted of 15 classes based on land-use map. To find their association with the lightning strikes, they generated a lightning hazard map based on the similarities between those landscape properties at the lightning strike points during the 2010–2014 period. However, at the validation phase, this hazard map captured only 47% of the observed lightning strikes in high-risk areas during the 2015–2016 period. Furthermore, in case of the forested areas in Alberta, Canada, Abdollahi et al. [10] attempted to model the potential spatial pattern of lightning-caused fires at 3-km spatial resolution during the 1961–2000 period. Then, they overlaid the lightning-caused fire spots over the gridded study area map, and generated a static fire danger (SFD) map by considering the lightning-caused fire pixels as high danger locations. Despite taking such a big area around each observed fire spot (i.e., 9 km2), their generated SFD map only captured ~38% of the fires when compared to an independent validation dataset during the 2001–2014 period.
In general, the literature suggests that three issues are associated with the study of lightning-caused fires. (i) First, the developed models/maps showed reasonable results during the calibration phase; however, they exhibited poor performance during the model validation phase. This challenge might be related to lightning strike locations being random and highly dependent on atmospheric conditions [11,12]. (ii) Second, these models require many input variables for development. (iii) Finally, the use of a large cell size affected the retrieval of a distinct spatial pattern for lightning-caused fires. In addition, the vegetation/fuel condition might be useful to predict fire occurrences, as reported by Krawchuk et al. [13]. Therefore, previous studies have suggested that remote sensing indices could be used to delineate vegetation conditions, such as the normalized difference water index (NDWI: a measure of vegetation wetness), and normalized difference vegetation index (NDVI: a measure of vegetation greenness). Between these two indices, the NDWI has been widely used in fire-related studies, such as forest fire vulnerability mapping [14], fire danger condition [10], fire risk prediction [15,16], fire behavior prediction [17], post-fire evaluation and vegetation response [18,19], and the beginning of the fire season [20,21]. In addition, it has been applied to the study of vegetation growth stages, such as coniferous needle flushing [22], understory grass green stage [23], and deciduous leaf out [24], which might be associated with fire occurrences. Other studies have employed NDVI to study/model fire occurrences [25,26]. However, compared to NDVI (calculated using red and near-infrared wavelengths), NDWI (using shortwave and near-infrared wavelengths) might depict the canopy moisture conditions much better [27]. Therefore, the use of NDWI for modeling lightning-caused forest fires deserves further investigation.
Considering the above-mentioned issues, our overall aim was to model lightning-caused fire occurrences using remote sensing-derived NDWI values in 21 natural subregions in the Canadian province of Alberta (Figure 1). We established three steps while executing our goal. First, we calculated the median NDWI value over each subregion at an eight-day time-scale for the 2005–2016 period. Second, we created a unique NDWI profile for each subregion using calculated value averages from the first step of the calibration dataset, i.e., 2005–2012. Finally, we modeled lightning-caused fires by plotting the observed fires onto the outcomes of previous steps in the calibration dataset, followed by validation using an independent dataset during the 2013–2016 period.

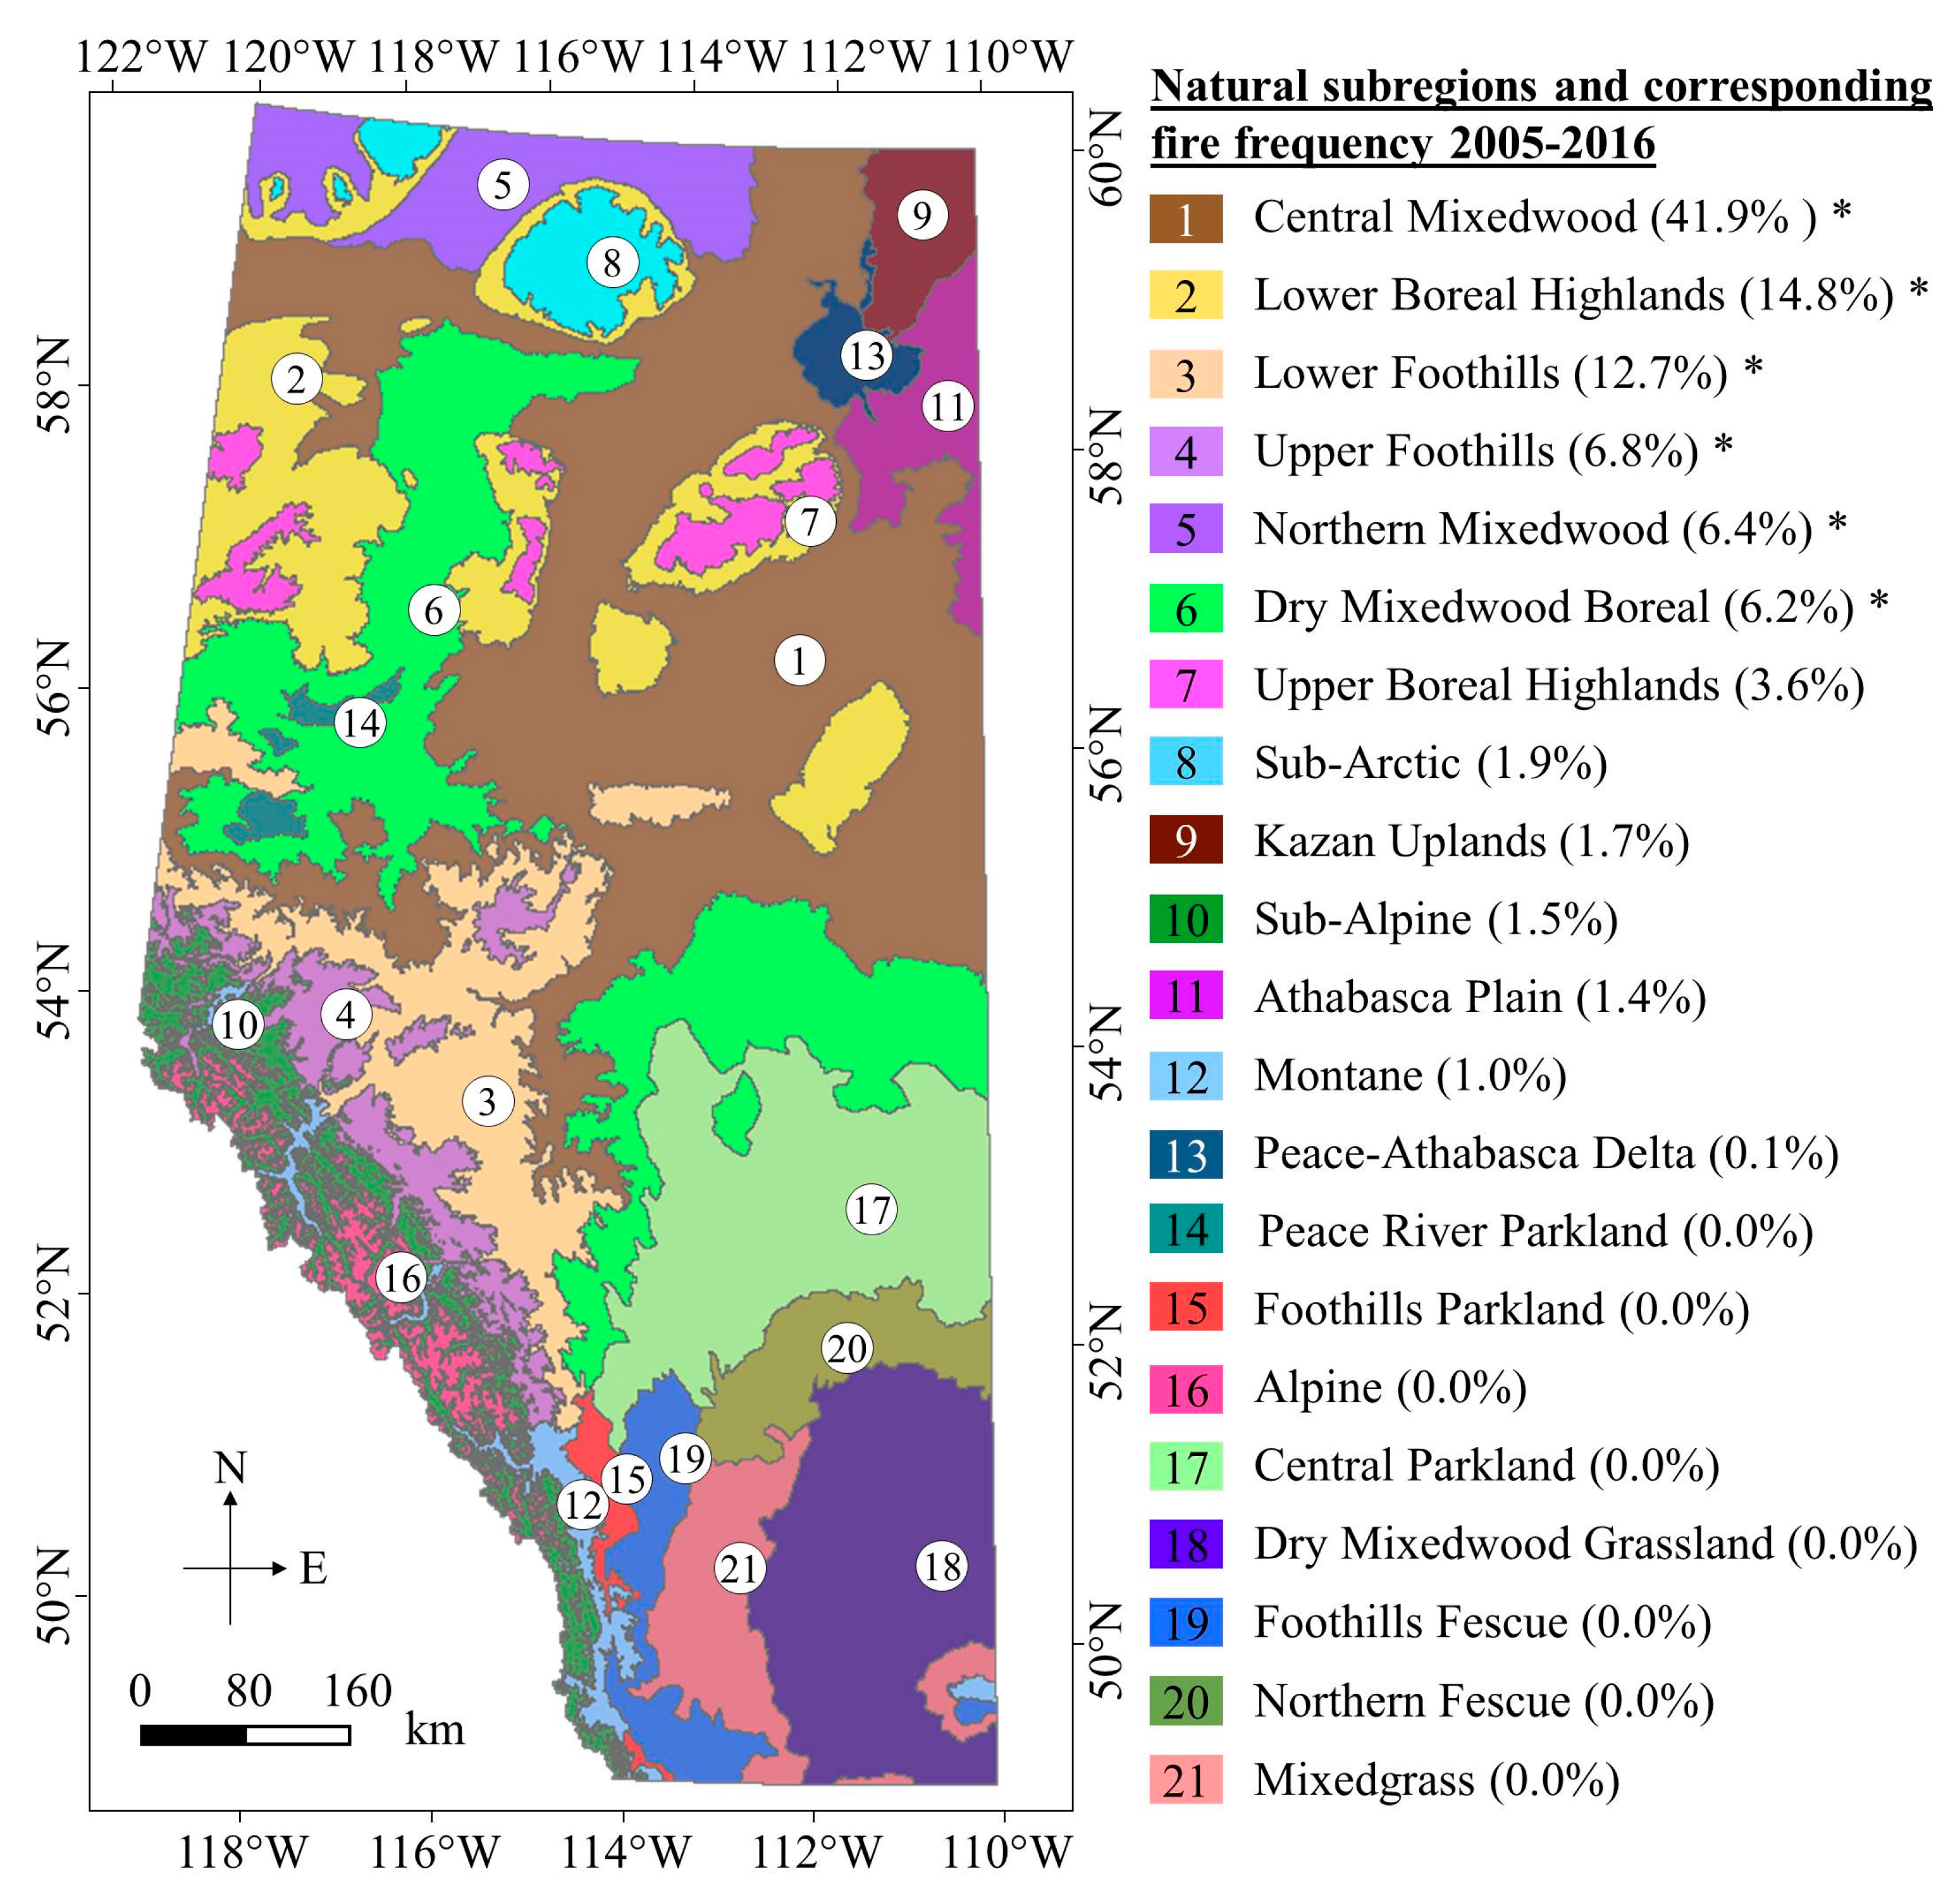
2. Study Area and Data Requirements
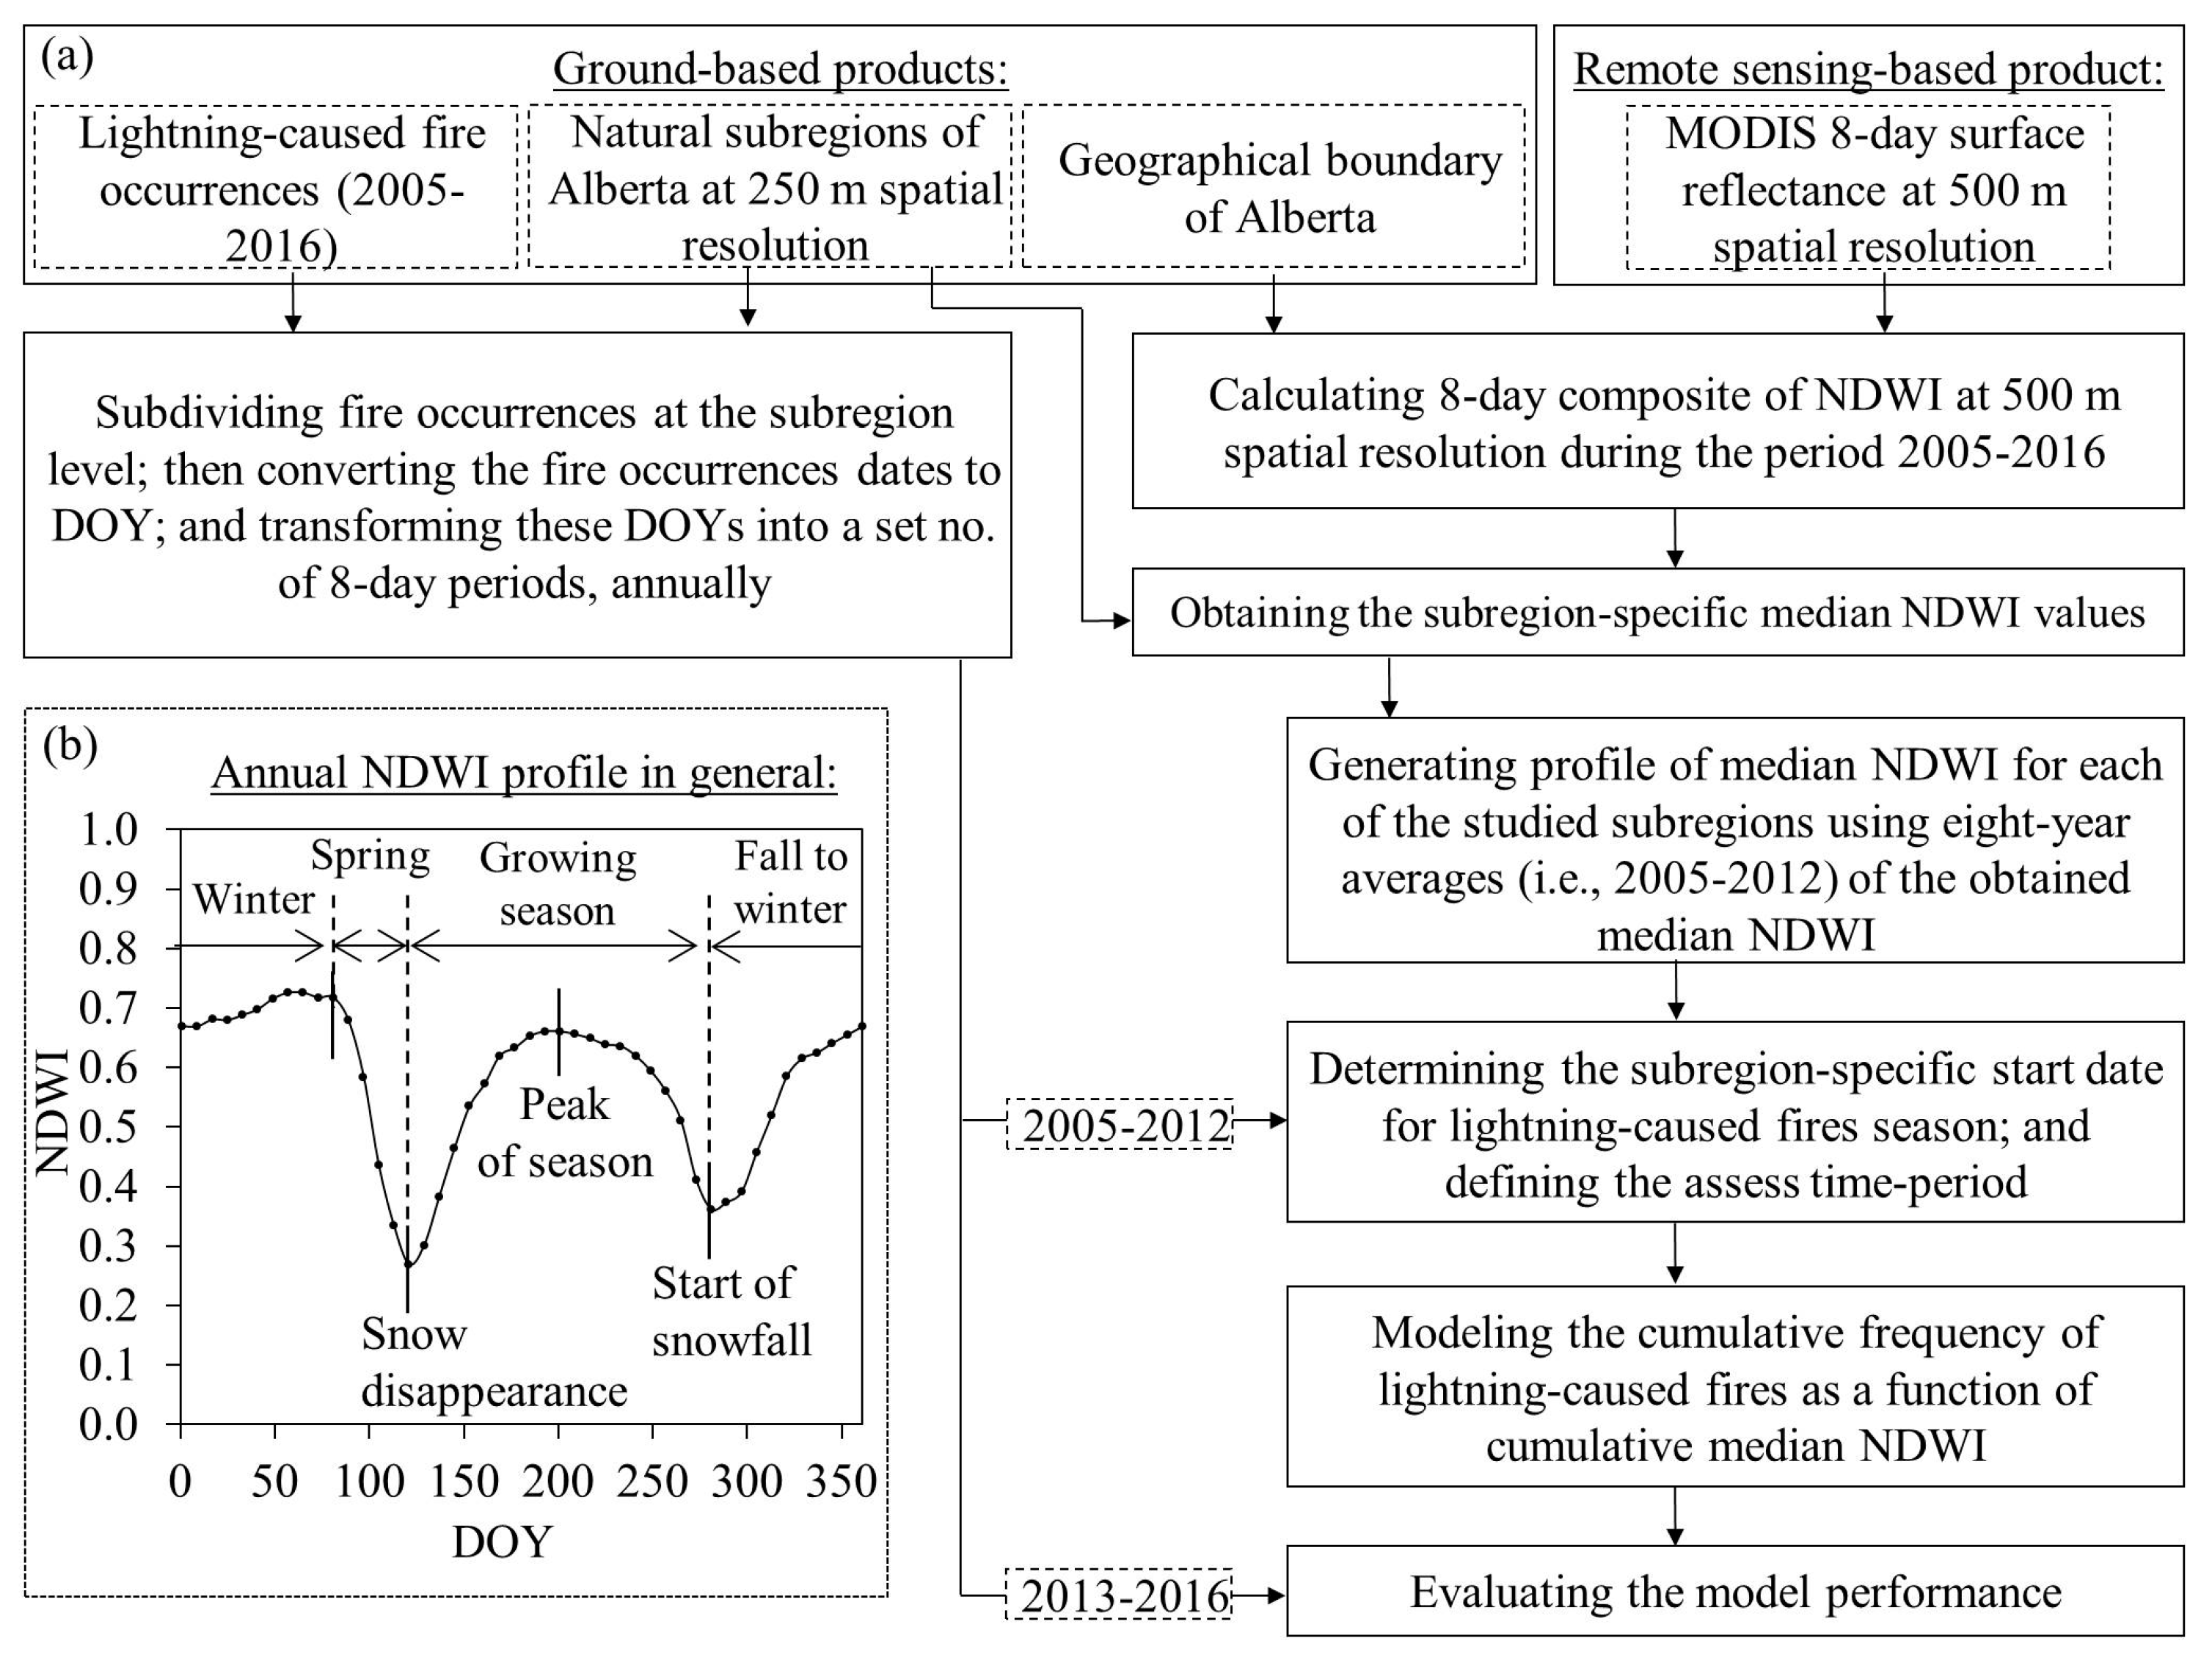
We considered the province of Alberta (between 49–60° N latitude and 110–120° W longitude) in the central-west region of Canada. The province is categorized as subarctic, humid continental climate, semi-arid, and tundra region based on Köppen climate classification [28], with an annual mean temperature and precipitation variation from −7.1 to 6 °C, and 260 to 1710 mm [29], respectively. Topographically, the region is variable, i.e., ranging from 150 to 3650 m above mean sea level. In terms of vegetation coverage, the province exhibits primarily boreal forest composed of deciduous and coniferous tress, grasslands, parklands, etc. [29]. On the basis of climate, topography, geology, and vegetation, the province was divided into 21 natural subregions (see Figure 1 for their geographical extent). Among those, we selected six subregions, each of which not only experienced at least 5% the total number of lightning-caused fire incidences during the 2005–2016 period, but also constituted ~89% of the total lightning-caused fires across the province during the 2005–2016 period. These subregions included: (i) Central Mixedwood; (ii) Lower Boreal Highlands; (iii) Lower Foothills; (iv) Upper Foothills; (v) Northern Mixedwood; and (vi) Dry Mixedwood Boreal. Table 1 shows information on the dominant vegetation type and the percentage of fire occurrences caused by lightning strikes in each subregion of interest during the 2005–2016 period.
In this study, we used three different types of datasets: (i) Terra Moderate Resolution Imaging Spectroradiometer (MODIS)-derived eight-day composites of surface reflectance; (ii) ground-based historical lightning-caused fire occurrences, which had the approximate latitude and longitude information for every fire point of initiation; and (iii) geographic information system (GIS)-based layers. Table 2 provides a brief description of these datasets.

3. Methods

Figure 2 shows a schematic diagram of the method applied in this study, which consisted of three components: (i) the preprocessing of lightning-caused fire occurrences; (ii) the preprocessing of the satellite data; and (iii) model development and validation. Each of these components is briefly described in the following subsections.

3.1. Preprocessing of Lightning-Caused Fire Occurrences

In this phase, we first converted the dates of fire occurrences into the day of year (i.e., DOY: ranging from 1 to 365/366 based on normal/leap year). We then transformed the calculated DOY values into a set number of eight-day periods using Equation (1) [20], where such conversion would align the timing of the lightning-caused fire occurrence with the employed remote sensing-derived index (i.e., NDWI).
P = ( DOY 1 8 ) + 1
where P is the period in which each fire occurrence is recorded. In this study, the P varied from one to 46 for each year when rounded to integer values. Upon transforming these datasets, we clipped both the calibration and validation fire datasets by the Alberta natural subregion GIS layer to get the subregion-specific fire occurrences. Finally, we calculated the relative frequency of fire occurrences for each year during the 2005–2016 period.

3.2. Preprocessing Satellite Data

Upon downloading the eight-day composites of surface reflectance images, we extracted the bands centered at 0.860 μm, i.e., the near-infrared (NIR) wavelength, and 2.130 μm, i.e., the shortwave-infrared (SWIR) wavelength, which were later used to calculate the annul time series of NDWI images using Equation (2). Although it would be possible to use other shortwave infrared spectral bands, we opted to use the 2.130-μm wavelength in this study. This was because it agreed with the ‘snow disappearance’ timing at the beginning of the fire/growing season over the same study area [20].
NDWI = ρ NIR ρ SWIR ρ NIR + ρ SWIR
where ρ is surface reflectance value for NIR and SWIR spectral bands. Upon generating the NDWI images for the study area, we split the annul time series of NDWI images using the Alberta natural subregion GIS layer that facilitated the study of NDWI at a subregion level. Finally, we divided these datasets into two groups: (i) a 2005–2012 dataset for model development; and (ii) a 2013–2016 dataset for model validation.

3.3. Model Development and Validation
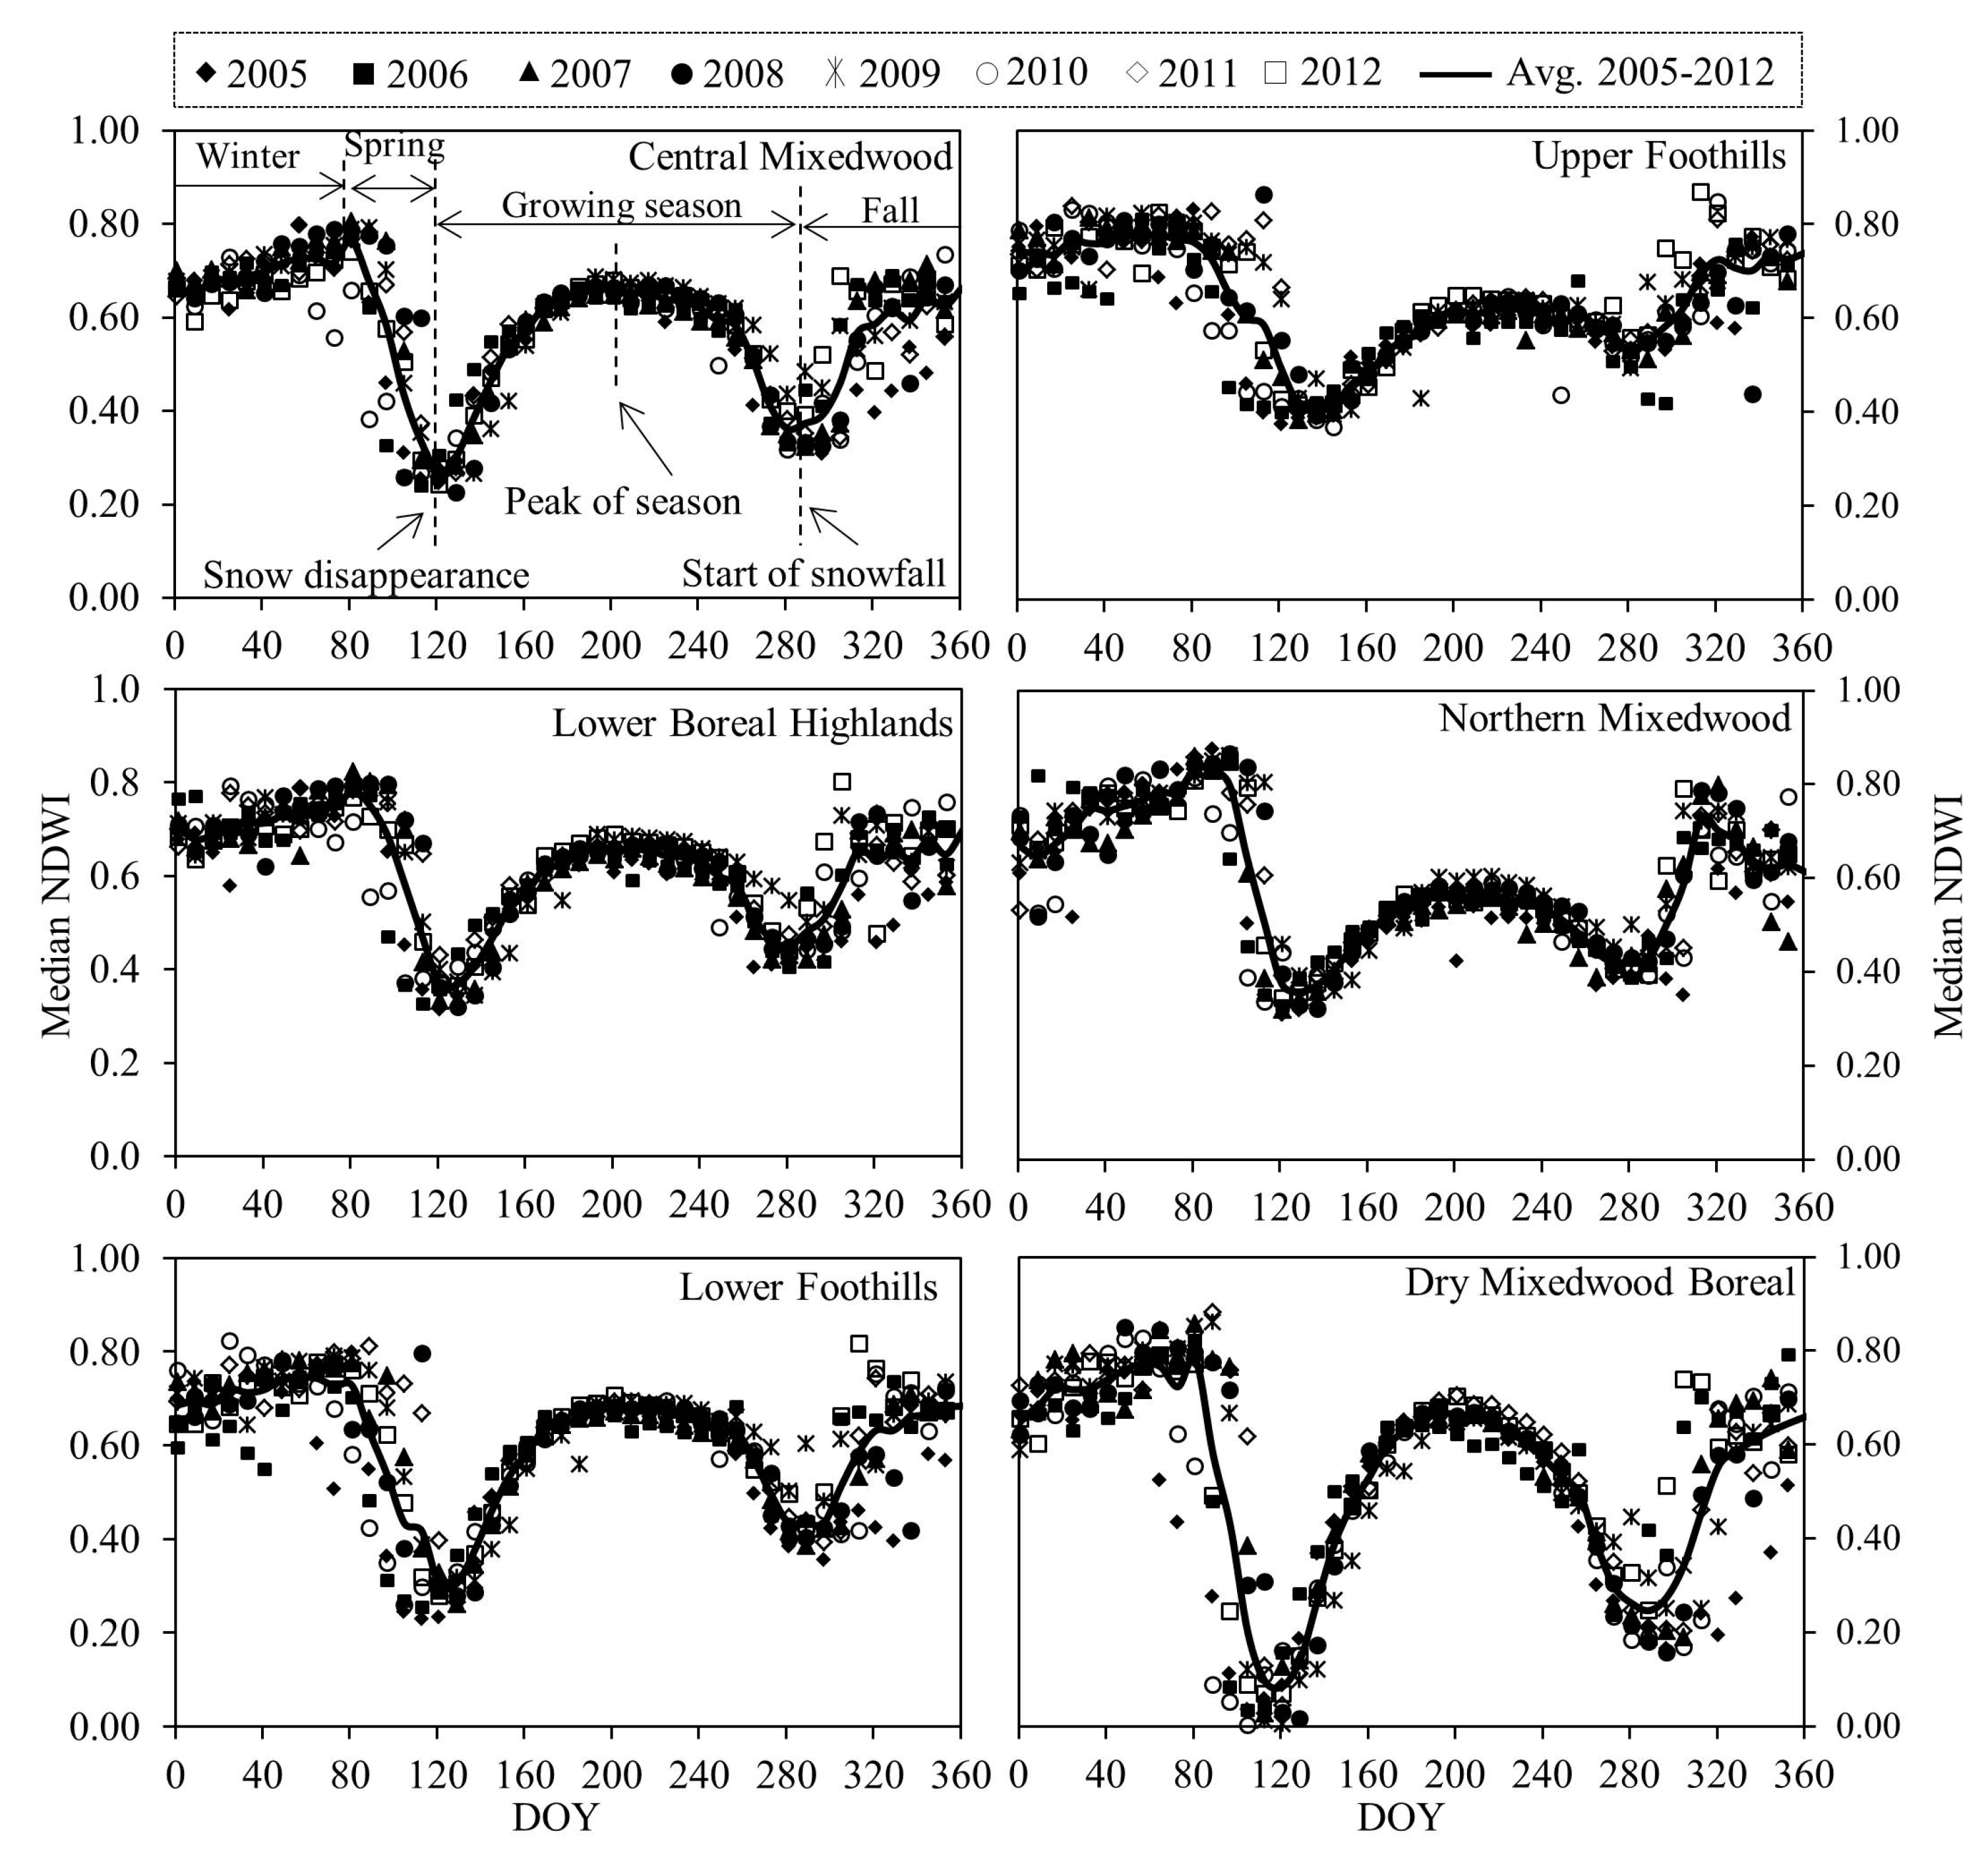
In this phase, we assumed that the annual NDWI time series over each subregion depicts a distinct pattern similar to other literature reports [20]. According to this assumption, the NDWI value remains almost constant at its maximum values during the winter time, and then starts to drastically decrease at the onset of the spring until it reaches a minimum annual value known as the snow disappearance time period (see panel b in Figure 2). Then, the NDWI value begins to increase gradually due to progress in the growing season until it reaches its maximum value at the peak of the growing season. Then, the NDWI experiences a moderate decrease until snowfall commences, after which the NDWI increases and continues until the end of the year.
In order to evaluate the above-mentioned assumption, we calculated the subregion-specific median NDWI values at eight-day intervals for each year during the 2005–2012 period over the selected six natural subregions of interest. We used median NDWI values that would be unaffected either because of their very small or extremely large values [30]. Then, we calculated the subregion-specific patterns by averaging the NDWI values at each eight-day time-period, and plotted them—along with the relative frequencies of the lightning-caused fires that occurred during the same time period—over the six natural subregions of interest individually. Based on these patterns, we determined the subregion-specific start date for lightning-caused fire seasons using median NDWI values. We observed a temporal pattern in lightning-caused fire occurrences within the eight-day time period during the growing season in the six natural subregions individually. However, these patterns were highly variable from one year to another. Therefore, we used the concept of cumulative frequency values for the variables of interest, which has been widely applied in the remote sensing literature [31,32,33,34,35]. In this case, we calculated the cumulative frequency (i.e., by summing up the extracted/calculated values at eight-day intervals) for both the lightning-caused fires and NDWI values. The results showed that in all six natural subregions, >98% of lightning-caused fires commenced with the snow disappearing date (i.e., start of the fire season) until the next snowfall. Furthermore, ~90% of lightning-caused fires occurred during the period from the snow disappearing date until the growing season’s peak. Consequently, we established the relationship between these two cumulative frequencies for the six natural subregions individually during the entire growing season.
Upon obtaining the subregion-specific relationships, we evaluated their performances using an independent validation dataset (see Table 2 for details). We modeled the cumulative frequency of lightning-caused fire occurrences using cumulative median NDWI values in every year during the validation phase, i.e., 2013–2016, by employing the obtained subregion-specific function as illustrated in the last paragraph. In order to assess the model’s accuracy, we used linear regression analysis and root mean square error.

4. Results

4.1. Annual Dynamic of NDWI Values

Figure 3 shows the subregion-specific eight-day median values of NDWI dynamics for every year during the 2005–2012 period. We found that the annual patterns were similar for all the subregions compared throughout the years. Due to these similarities, we calculated an average annual pattern of the eight-day NDWI values for the six natural subregions of interest individually. Based on these patterns, we identified the critical stages: (i) winter time, when the mean NDWI values were the highest in that given year; (ii) the onset of spring, when the mean NDWI values began to fall; (iii) the snow disappearance date, when the median’s annual minimum for NDWI values occurred; (iv) the growing season, when the median NDWI values had a symmetrical hump and there were clearly less values than in the winter time; (v) the peak of the growing season, where median NDWI values reached their maximum during the fire season; (vi) the commencement of snowfall, when the median NDWI values had another minimum after the growing season, but not as low as its annual minimum at the onset of spring; and (vii) the fall season, when NDWI values increased again.

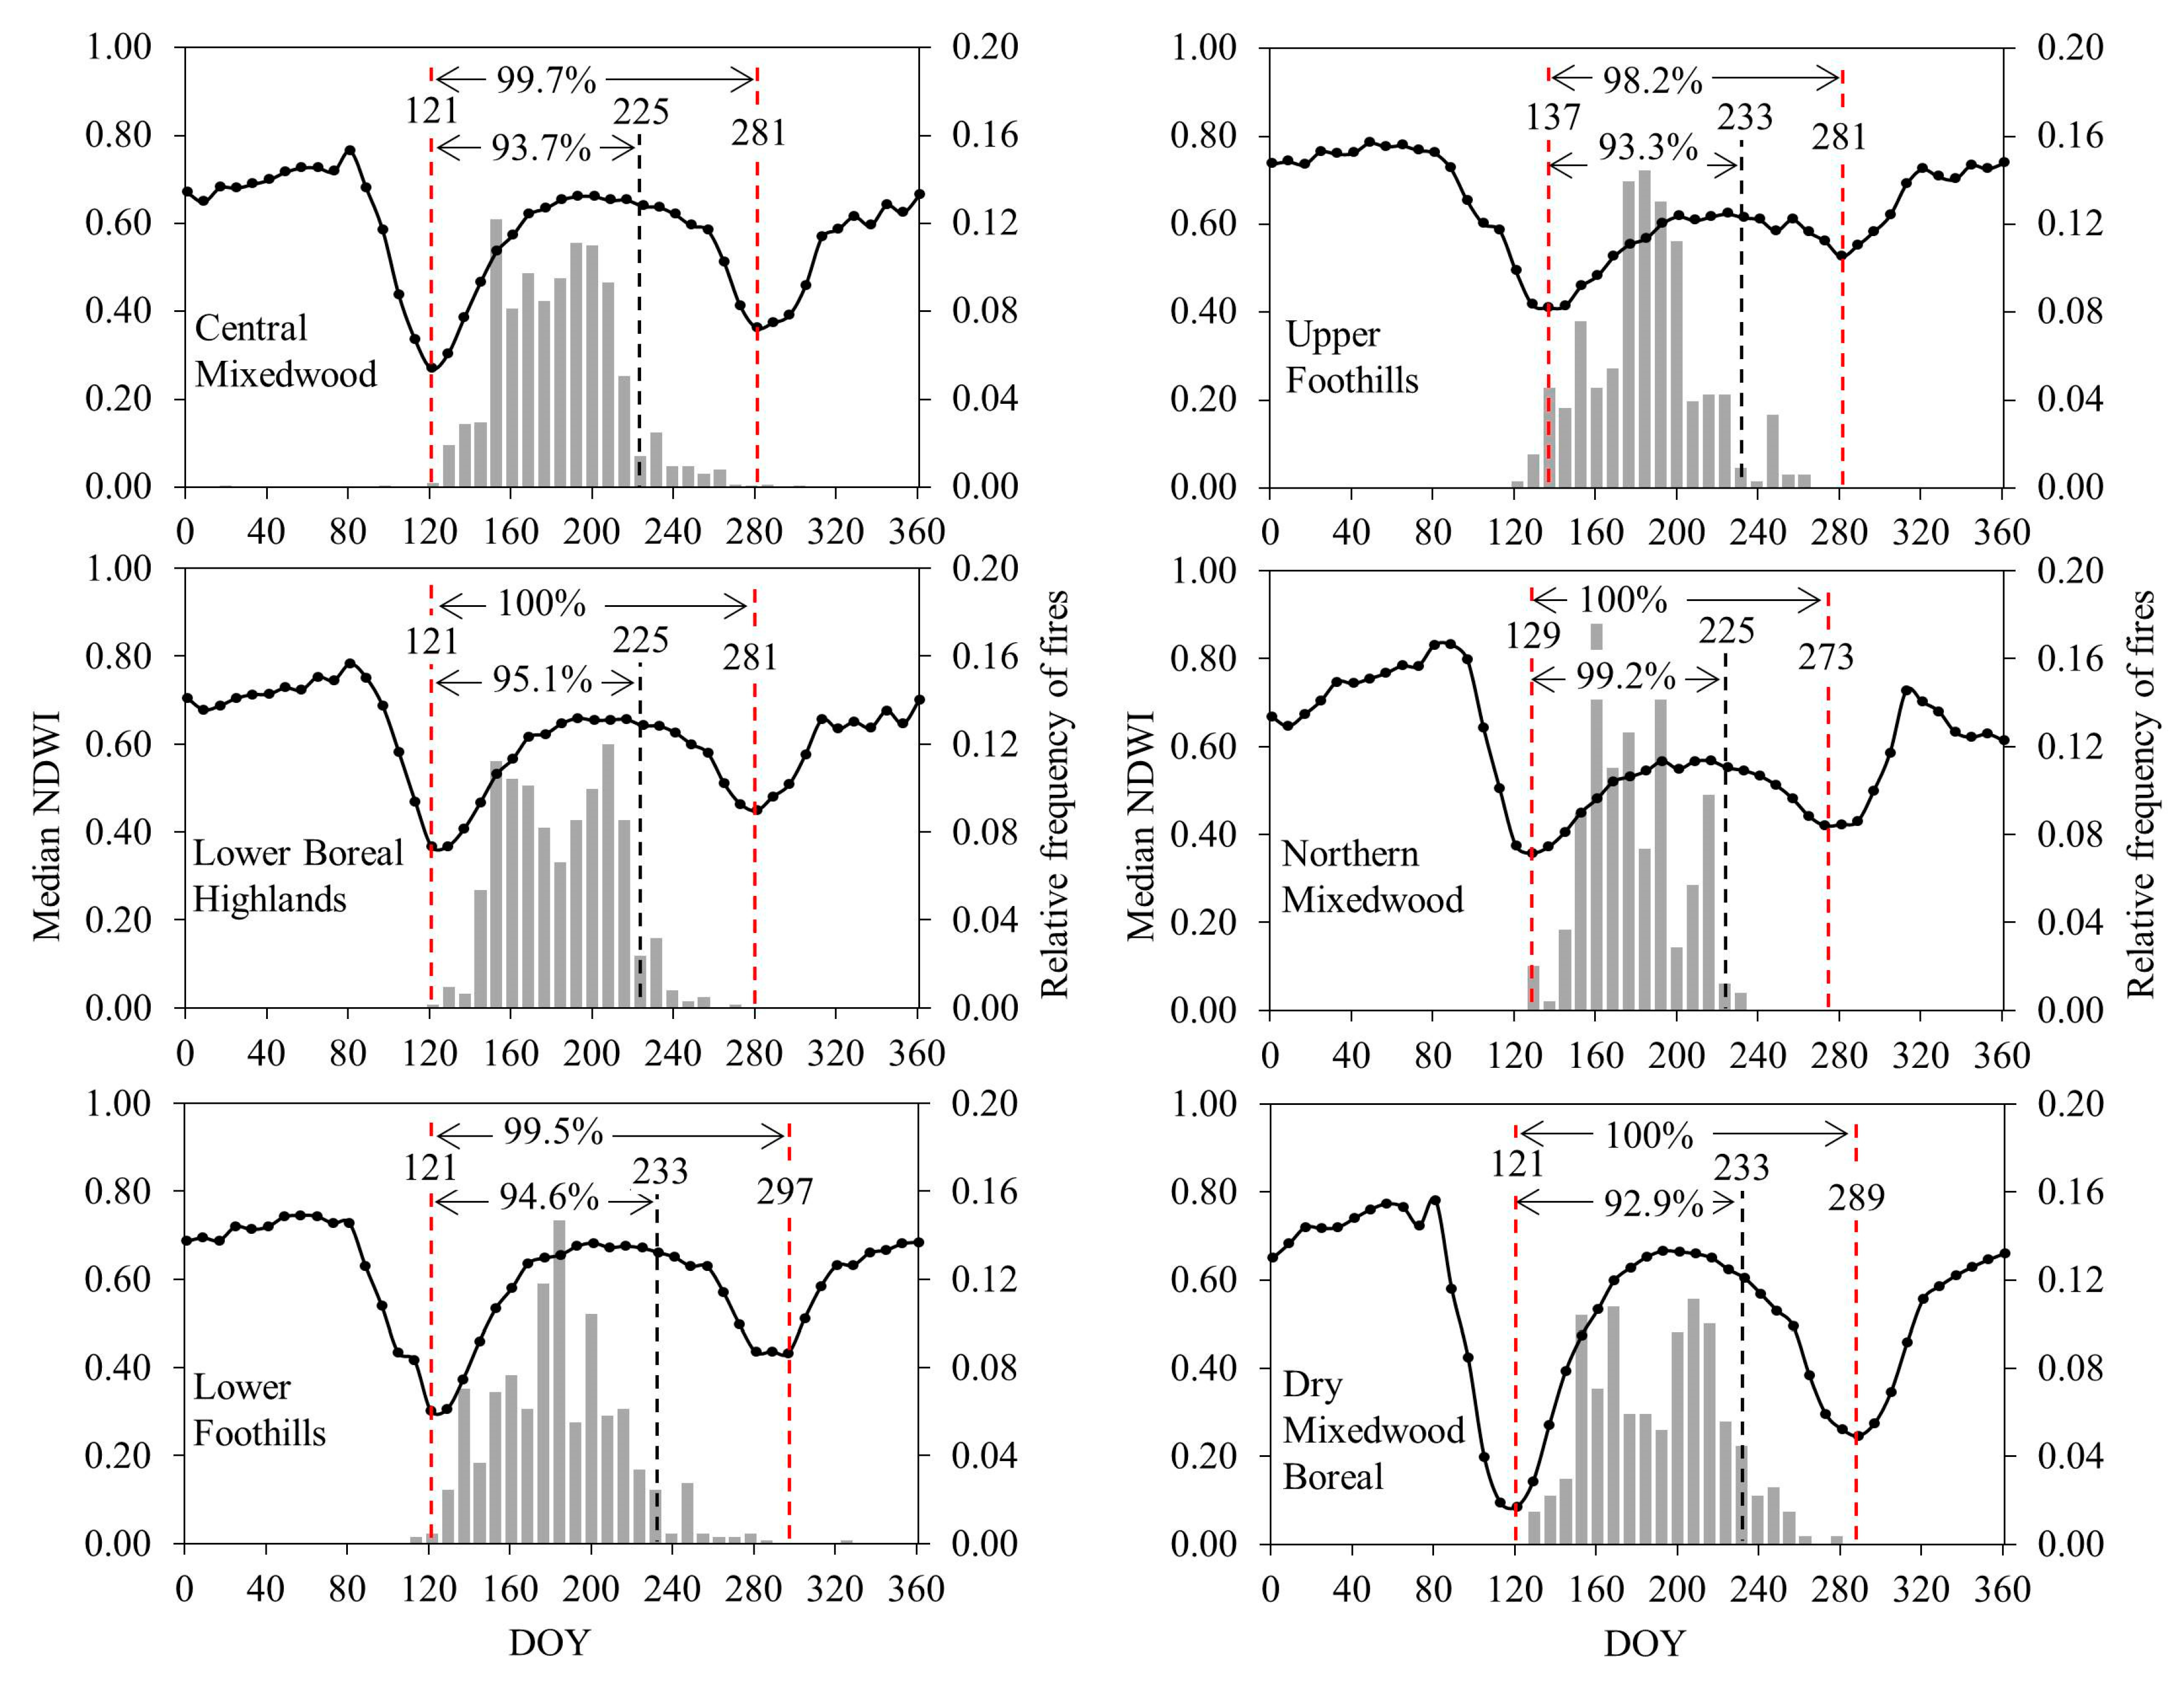
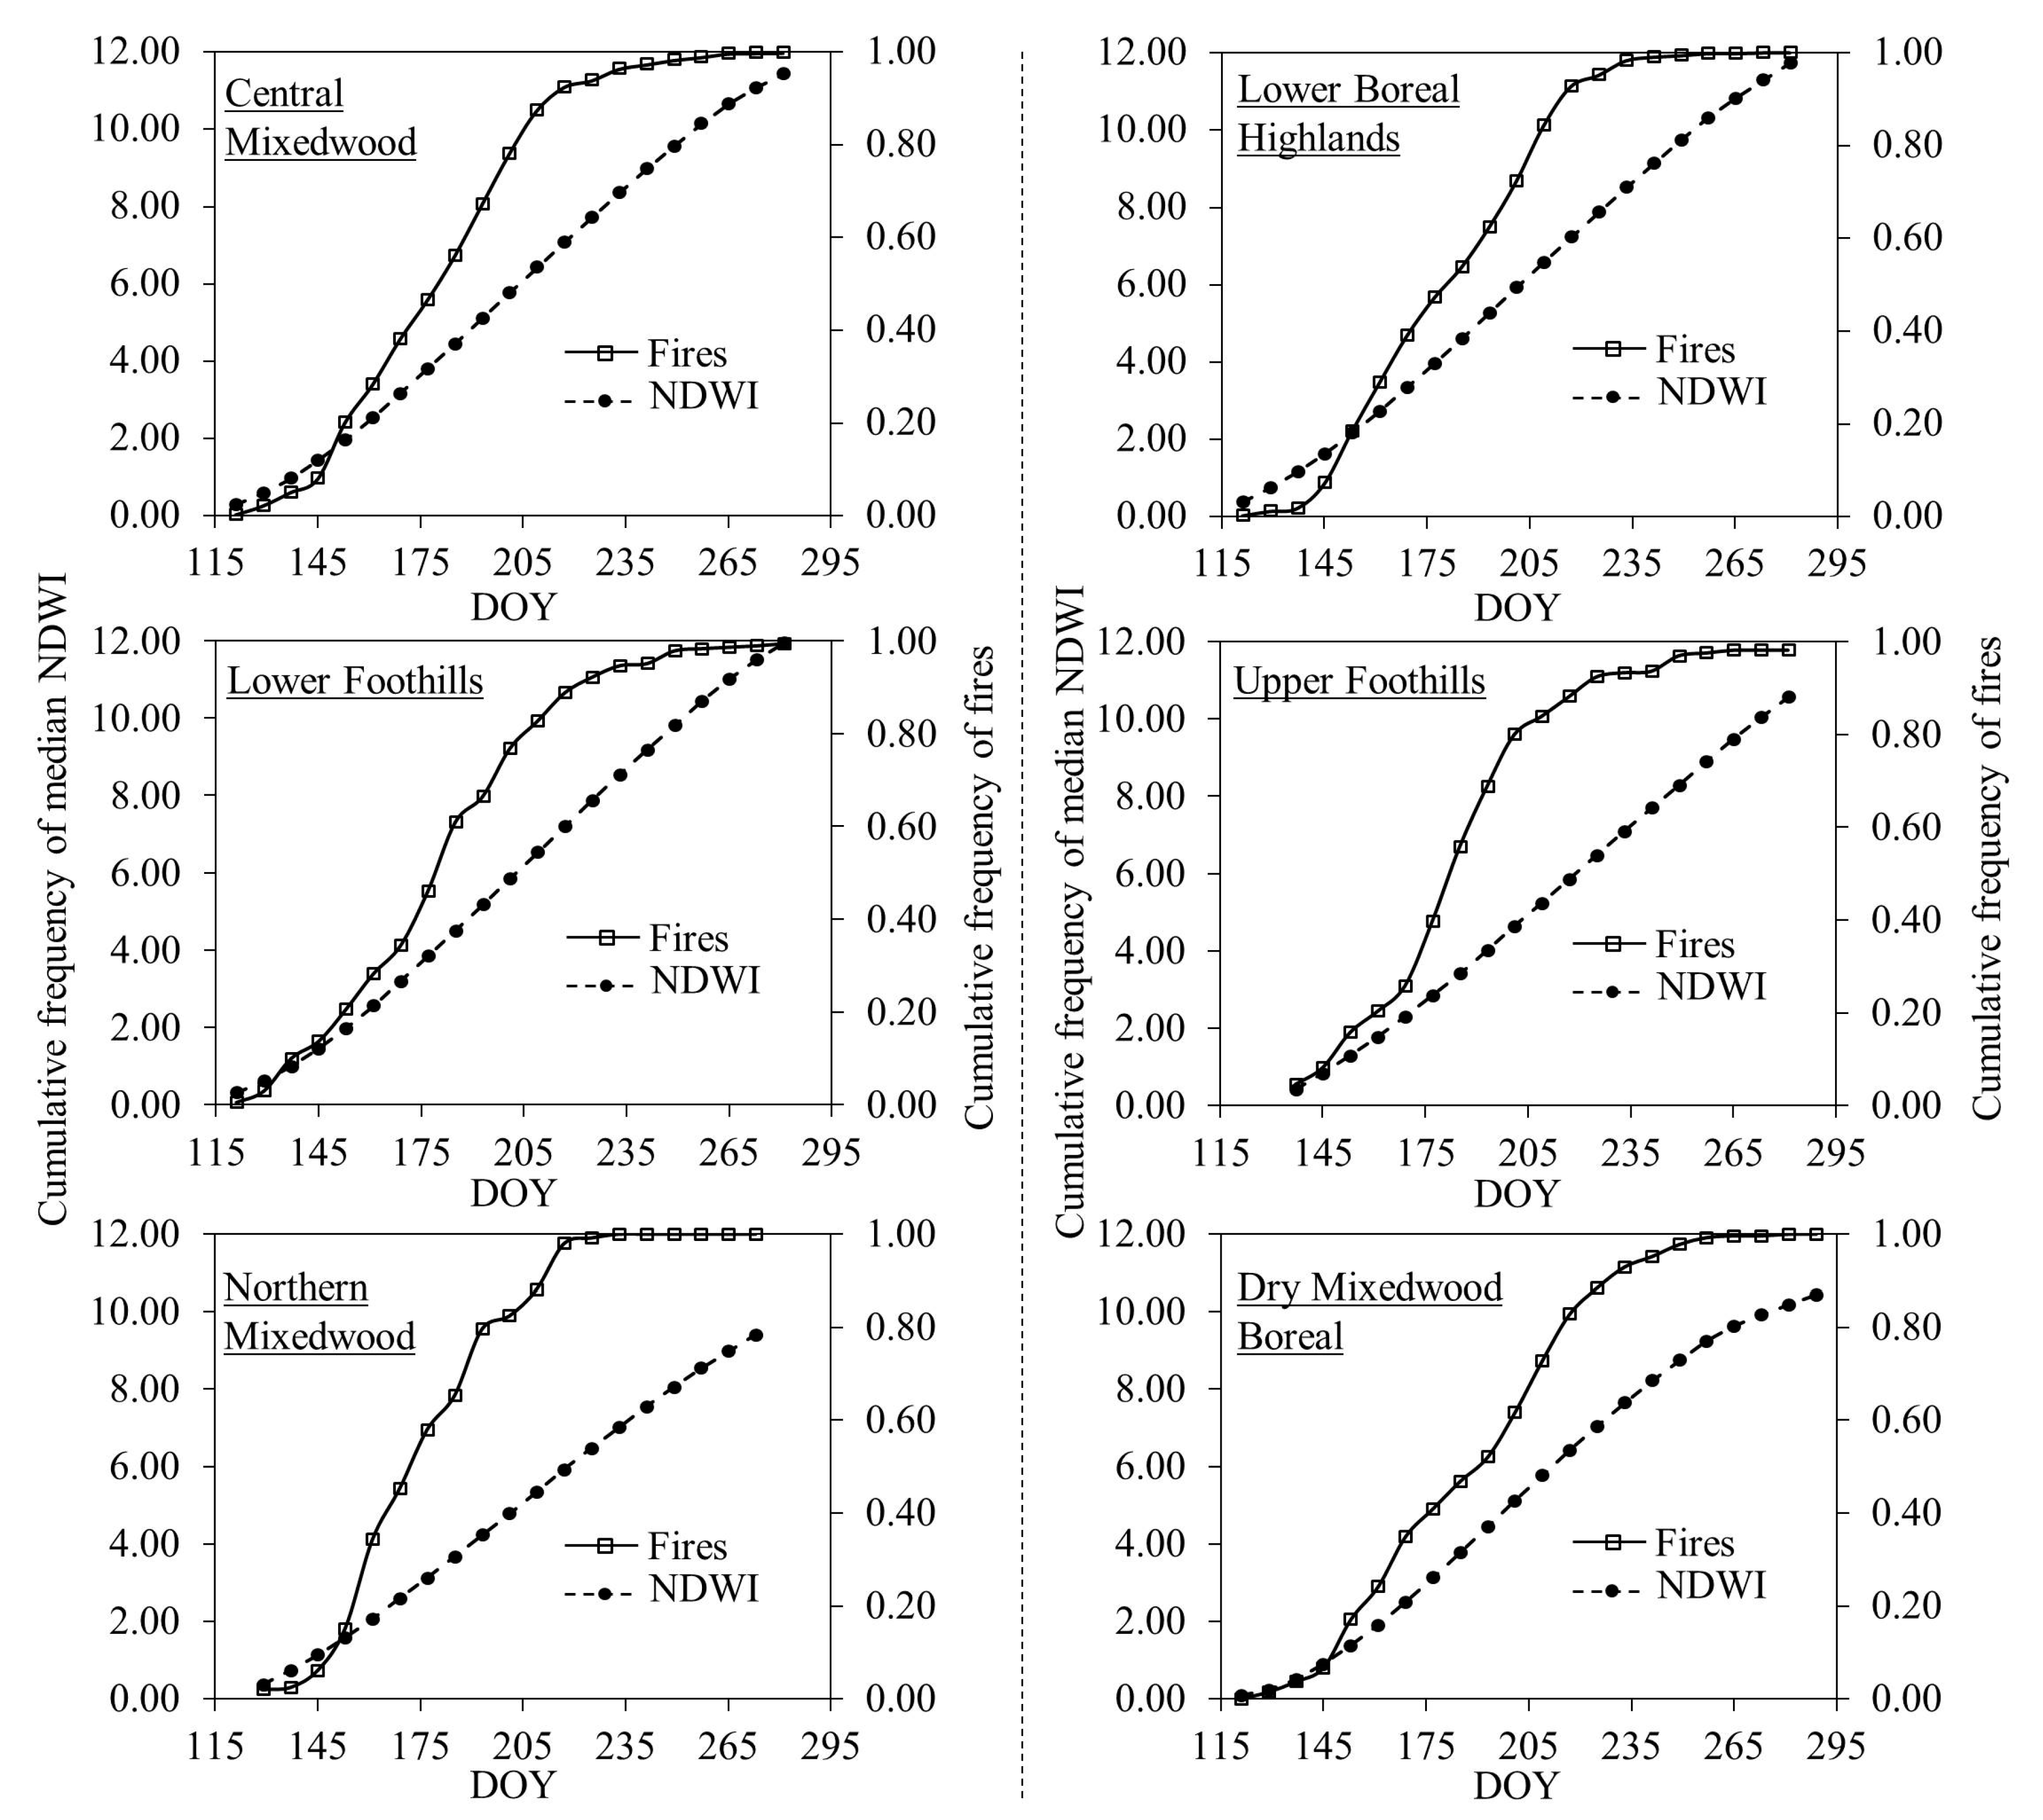
4.2. Subregion-Specific Lightning-Caused Fire Season Dynamic

Figure 4 shows the subregion-specific lightning-caused fires’ relative frequency distribution (i.e., at eight-day time-period during the 2005–2012 period), and the annual profile of median NDWI, as described in the previous subsection. We noticed that very little fire (i.e., less than 2%) occurred before the snow disappearance stage.

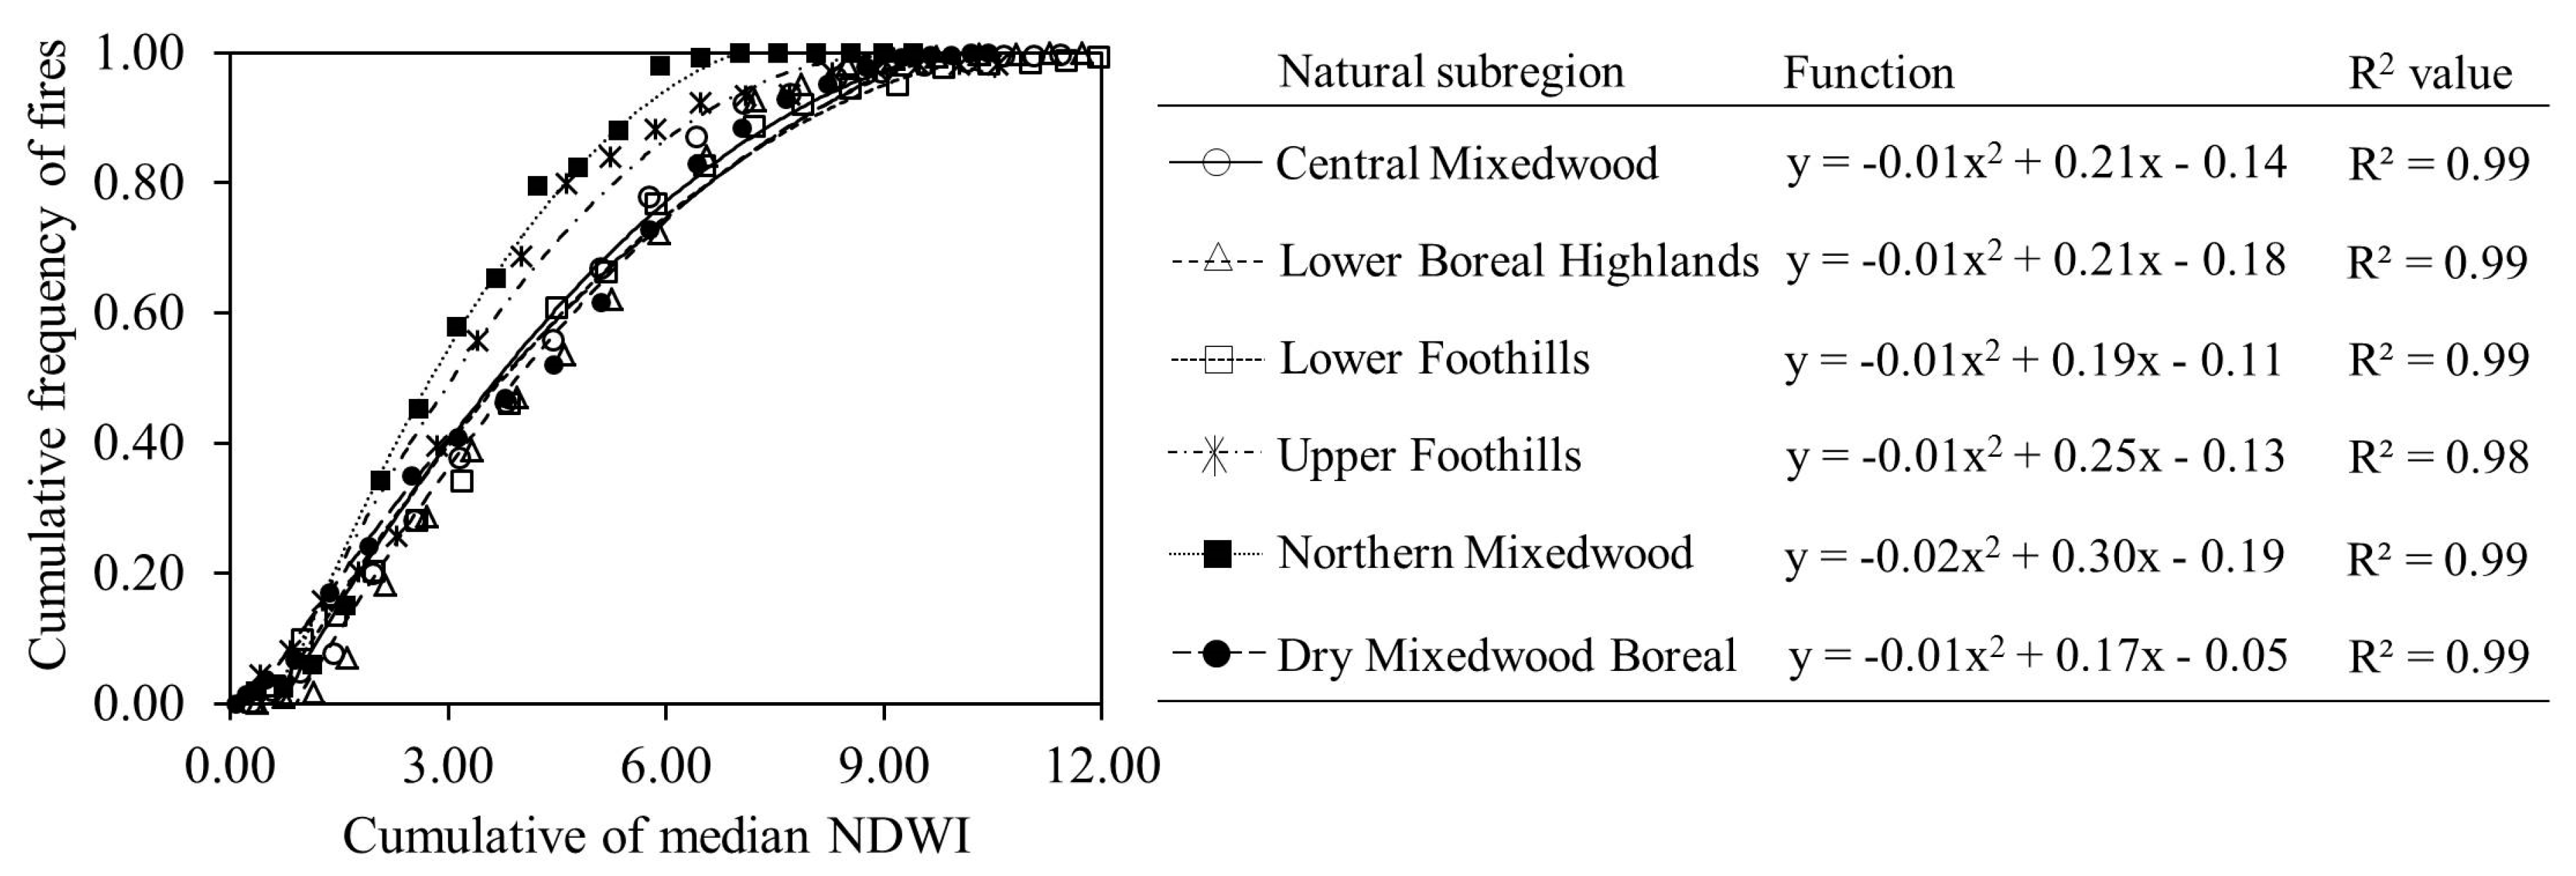
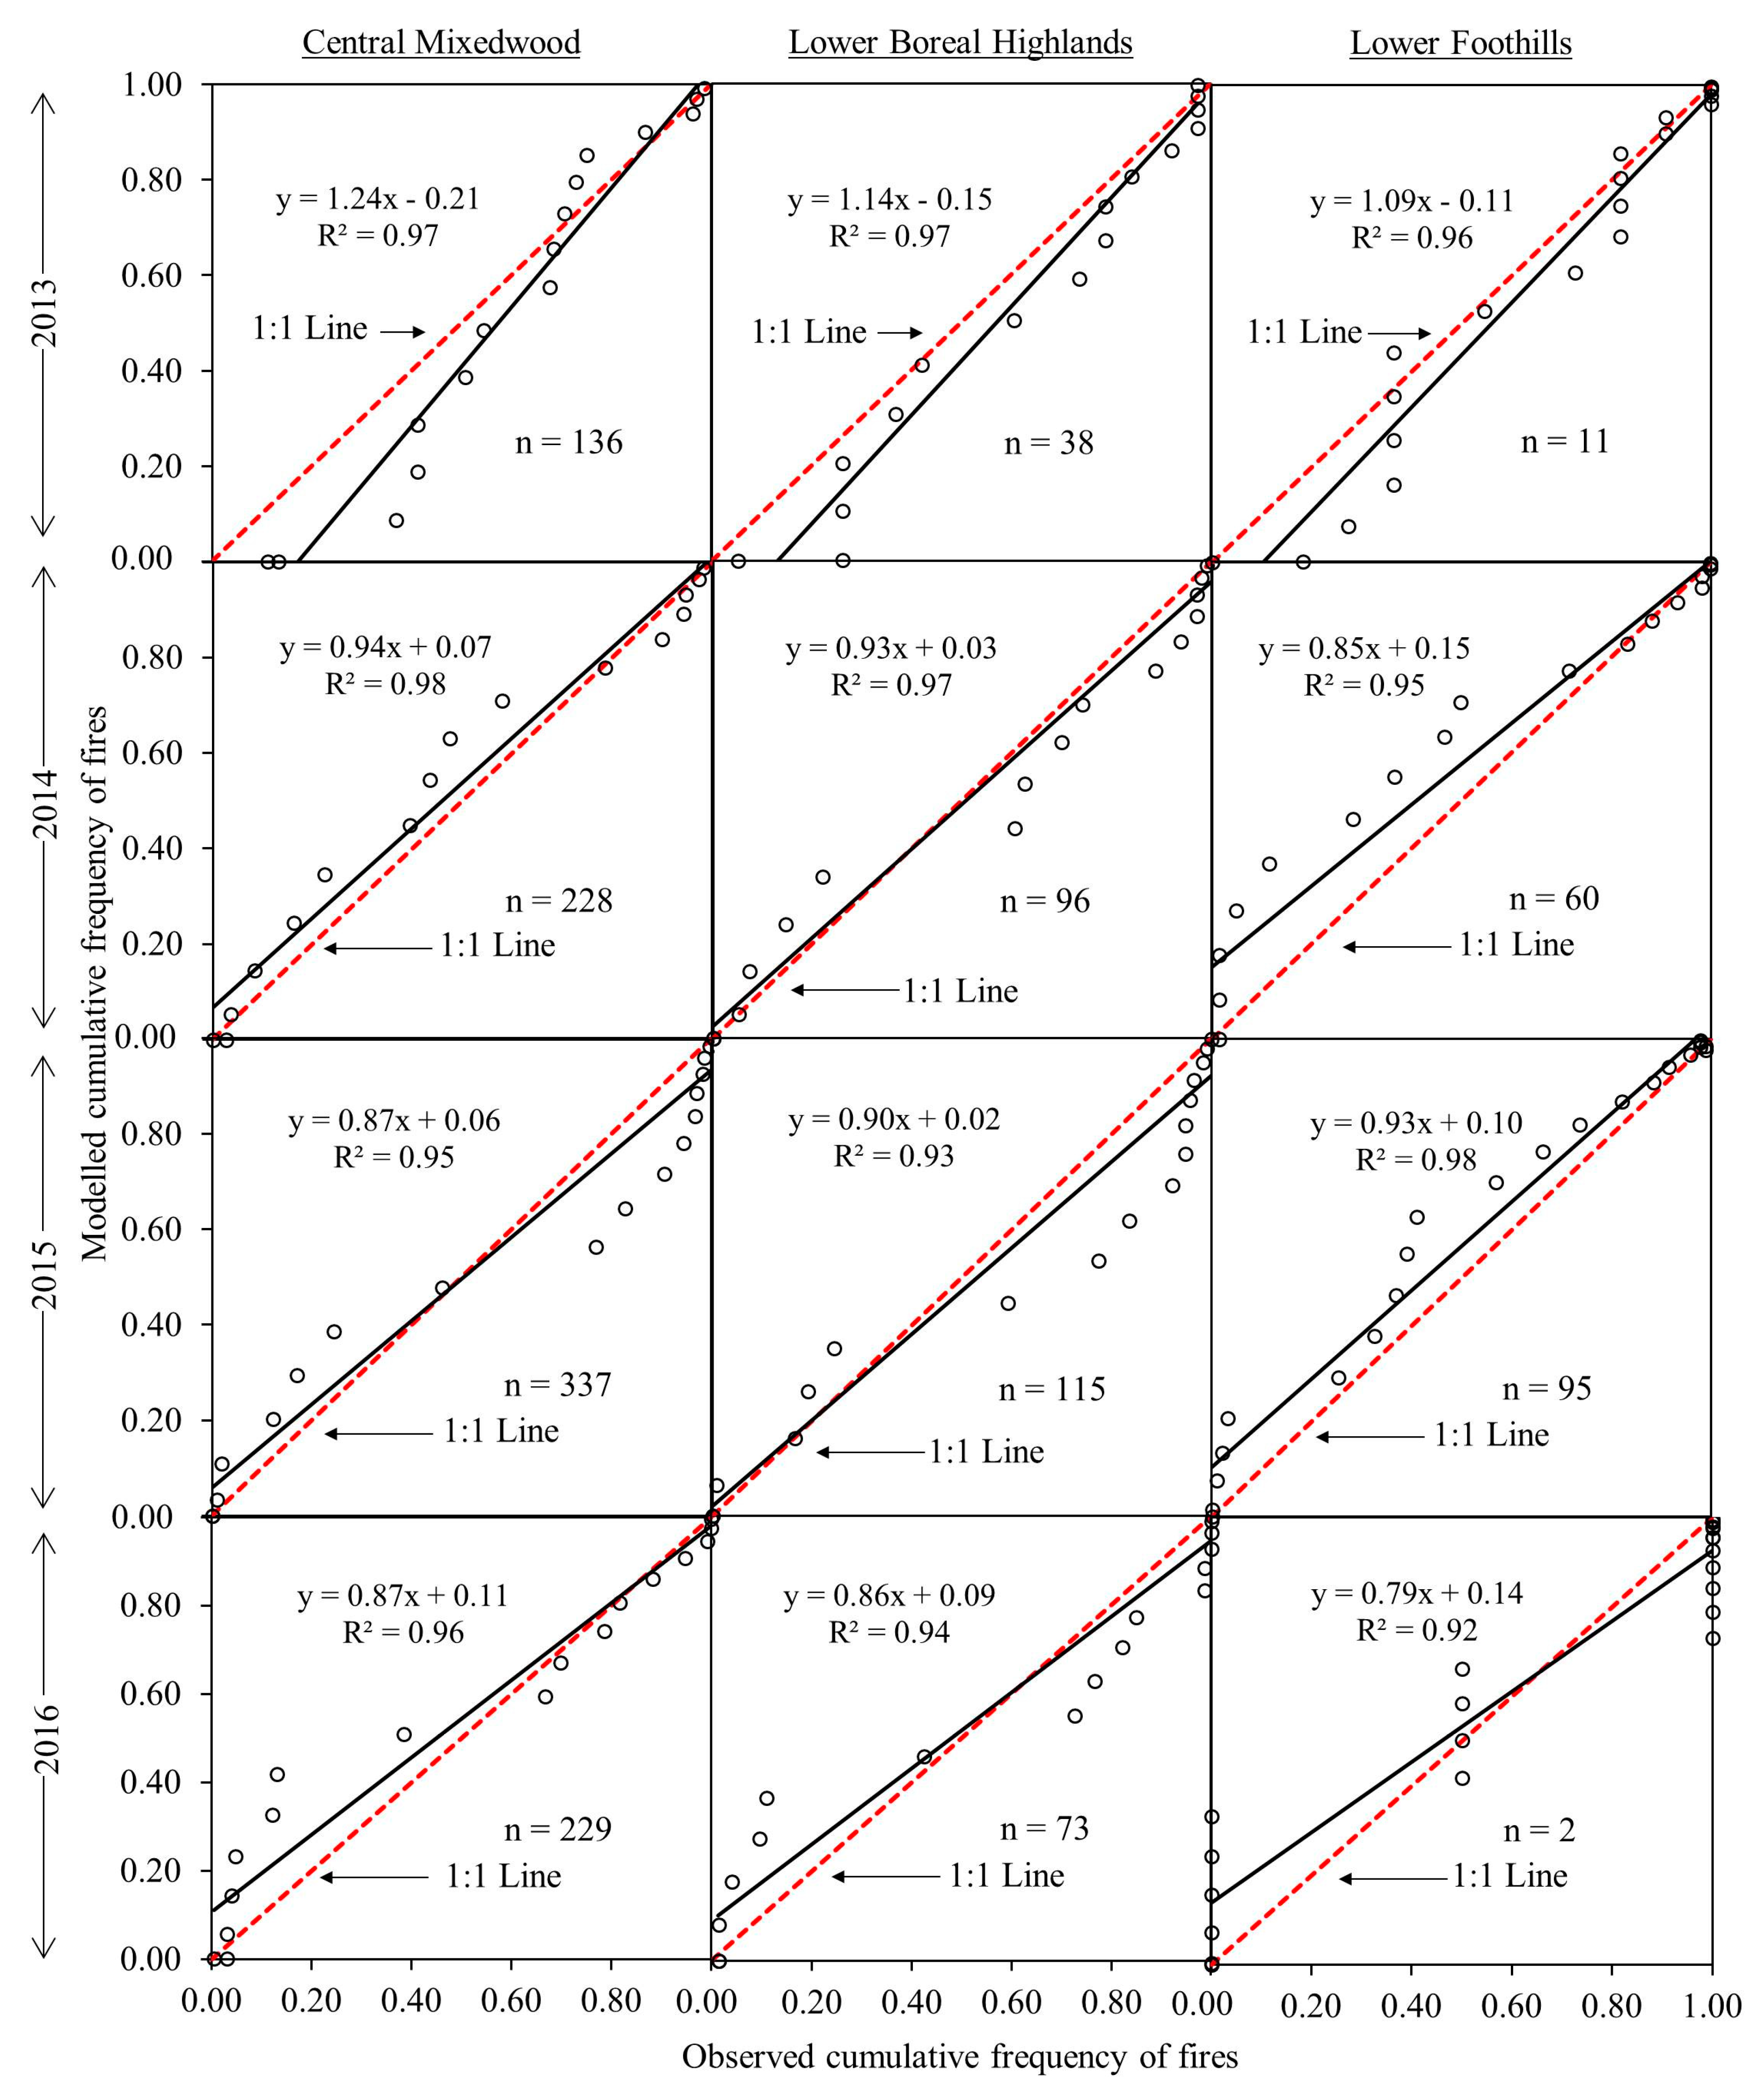
4.3. Model Development and Validation

During the model development phase, we plotted the cumulative values of median NDWI and lightning-caused fire frequency against DOY, over the six natural subregions individually, during the entire growing season spanning between snow disappearing in the spring and snowfall in the autumn, as shown in Figure 5. It revealed that both of the cumulative values of median NDWI and lightning-caused fire frequencies behaved similarly with some variations from one subregion to another. Due to having such distinct patterns, we then applied polynomial regression analysis to define the relationships amongst them (Figure 6). Our analysis showed that strong relationships (i.e., R2 values in the range 0.98 to 0.99 over the subregions) existed between the variables of interest.
During the model validation phase, we employed the relations shown in Figure 6 in an independent validation dataset that was available and collected during the 2013–2016 period, as shown in Figure 7. The analysis demonstrated the relations between the observed and modeled cumulative frequencies of lightning-caused fires over the three natural subregions of ‘Central Mixedwood’, ‘Lower Boreal Highlands’, and ‘Lower Foothills’. The remaining three subregions did not experience significant amounts of lightning-caused fires, and thus we were unable to use them for validation purposes. We found that strong relationships existed over all the three subregions of interest. For example: the R2, slope, and intercept values were in the ranges of: (i) 0.95 to 0.98, 0.87 to 1.24, and −0.21 to 0.11, respectively, for Central Mixedwood; (ii) 0.93 to 0.97, 0.86 to 1.14, and −0.15 to 0.09, respectively, for Lower Boreal Highlands; and (iii) 0.92 to 0.98, 0.79 to 1.09, and −0.11 to 0.15, respectively, for Lower Foothills.

5. Discussion

Figure 3 shows that the annual NDWI profiles for each subregion depicted a specific pattern in the context of several key stages, e.g., snow disappearance date, peak of growing season, and commencement of snowfall. In fact, our observed patterns were similar to those reported by other studies. For example, (i) Sekhon et al. [20] studied the NDWI profile to determine the snow disappearance stage over the Central Mixedwood subregion in Alberta, Canada during the 2006–2008 period; (ii) Delbart et al. [21] employed NDWI changes for detecting vegetation phenology over the broadleaf forest area in Central Siberia during the 1999–2000 period; (iii) Sekhon et al. [22] analyzed the NDWI profile to define the date of coniferous needle flushing (CNF) occurrence in boreal forested areas in Alberta, Canada during the 2006–2008 period; and (iv) Qi et al. [36] considered NDWI changes when monitoring the live fuel moisture in northern Utah, USA during the 2010–2011 period. Although each subregion showed a unique pattern in this study, the timing of each critical stage differed slightly from one subregion to another one. Furthermore, differences in the magnitude of NDWI values were observed among subregions. Such differences might be related to the growth stages and conditions of forest that would highly depend on the abiotic (e.g., temperature, soil water content, and nutrients in the soil in particular) and biotic (e.g., interspecies and intraspecies competitions, and demand for species-specific optimal growth, etc.) conditions [36,37,38], which would potentially differ from one subregion to another.
As shown in Figure 4, most of the lightning-caused fires (i.e., >98%) in all of the natural subregions happened during the growing season (i.e., from snow disappearance date in spring to the start of snowfall in autumn). The reason for such a trend might be related to the extensive availability of fuels, and the occurrence of the lightning storms as a fire ignition source in the region [7,39,40]. Even though we observed that a significant proportion of the fires took place during the growing season, we also observed a small amount of fires (i.e., <2%) before the growing season started, which could be related to dead branches, peat, or duff beneath the trees that remained from the previous year, and were initially ignited by lightning strikes in late winter [41,42,43]. In addition, after the snow disappeared, we observed that the number of lightning-caused fires increased to a great extent, along with a rise in the periodical NDWI values as the growing/fire season progressed. In fact, we found that at least 92% of the lightning-caused fires in all the six natural subregions occurred between the time of snow disappearance and around the peak of the growing season (i.e., late July to early August). Note that Tymstra et al. [44] also reported similar findings, i.e., lightning-caused fires contributed to >90% of the total burn area in Alberta during the months of June through August, over the 1961–2002 period. Once snow melts, plants start to grow in the spring, and require a significant amount of water from soil. However, their roots are not yet active and warm enough to absorb enough water from soil, causing water stress for plants, and rendering plants/forests more flammable [36,45]. As the growing season progresses, the air temperature/evapotranspiration increases. However, the water deficit (if it takes place) may not support such evapotranspiration demands, which enhance fuel’s flammability [46,47]. At the end of the peak of the growing season, all six natural subregions experienced much less lightning-caused fires, which could be related to both the understory and overstory being fully developed by the peak of the growing season, thereby reducing fuel flammability [44]. In addition, the weather—in particular temperature regimes—plays an important role in influencing the vegetation phenology [22,23,24]. For example, we observed that temperatures start to increase in the spring, and this trend continues until it reaches a peak during the growing season (see Figure 6 as an example). Then, temperatures commence a downward trend that continues until autumn. Of note, both the vegetation index (e.g., enhanced vegetation index: EVI calculated using blue, red, and near-infrared wavelengths) and NDWI values exhibit decreasing trends due to the temperature drop after the peak is achieved during the growing season (Figure 8). This is the case as plants sense autumn approaching. During this temperature decline phase, before approaching autumn, plants have enough moisture/water content, which was initially transferred from the soil to the plants during the first part of the growing season. Such moisture/water content in plants might explain why the number of lightning-caused fires were less compared to the period from the snow disappearance date to the peak of the growing season [44].
Our findings regarding the relationship between observed and modeled lightning-caused fires are promising. However, to the best of our knowledge, our study is the first of its kind, and therefore, comparative analysis of our data with previously published findings was not possible. The results showed that the concept of using cumulative frequency to model lightning-caused fire occurrences was a good approach, which was described in the literature. For example, Bhuyan et al. [31] found a strong and positive interannual association between annual tree-ring growth and cumulative NDVI, at 69 study sites across the world, during the 2001–2010 period. Swain et al. [32] found the R2 values were in the range of 0.60 to 0.98 between cumulative NDVI and cumulative surface temperature in different farms during the growing seasons of 2002 and 2007 in Nebraska. Cihlar et al. [35] found a high correlation (i.e., R2 = 0.92) between cumulative NDVI and cumulative actual evapotranspiration at a 15-day time scale over Canada during the 1986 growing season. During model development and validation, we observed some variability associated with the observed R2, slope, and intercept values among the subregions. These variations might be related to one or more of the following reasons. (i) The existing differences in subregion-specific landscape properties, in particular those related to climate, geology, topography, and vegetation [29], could affect the spatial and temporal patterns of lightning strikes [9]. (ii) It is known that the randomness of lightning strike locations highly depends on atmospheric conditions [11,12]. (iii) The local weather condition right after the lightning strikes in each natural subregion would influence the lightning-caused fire ignition and its distribution on a subregion level [6]. Nonetheless, our results agree with the notion that lightning-caused fire occurrences depend of the fuel/vegetation moisture content to a great extent [13,48].
Despite our findings demonstrating strong relations between observed and modeled lightning-caused fires, other factors are worth investigating for potential further advancements. These include: (i) the incorporation of topographical elements (i.e., elevation, slope, and aspect); (ii) the integration of other sources of ignition, i.e., human-caused fires; (iii) the incorporation of weather variables (i.e., relative humidity and precipitation, among others); and (iv) the assimilation of other remote sensing-based forest fire forecasting systems that have been previously developed (e.g., [10,49,50,51]), where enhancing the spatial resolution (i.e., from 500 m to 250 m) would be critical.

6. Conclusions

In the scope of this paper, we proposed a simple yet effective protocol for modeling lightning-caused fire occurrences using MODIS-derived eight-day composites of NDWI, which is an indicator of vegetation/fuel moisture conditions. We implemented the developed protocol over the forested regions at the natural subregion-level in the Canadian province of Alberta. While developing the model, we plotted the cumulative frequencies of median NDWI values (i.e., approximately between 0–12) and lightning-caused fires (i.e., between 0–1) from the snow disappearance stage to the start of snowfall in autumn, i.e., the entire growing season, at the natural subregion level during the 2005–2012 period. In this case, we found strong relationships (i.e., 0.98 ≤ R2 ≤ 0.99) between the variables of interest in all the six natural subregions. Upon obtaining the above relationships, we applied them in modeling the lightning-caused fire cumulative frequencies, which were evaluated against ground-based information at the natural subregion level during the 2013–2016 period. In this case, our analysis demonstrated strong relationships (i.e., 0.92 ≤ R2 ≤ 0.98) between the observed and modeled cumulative frequencies of lightning-caused fires. Overall, our proposed method was able to model lightning-caused fire occurrences using a single remote sensing-based vegetation/fuel-related variable, and demonstrated a good performance in both the calibration and validation phases. Finally, our developed method can effectively enhance forest fire management activities, because having knowledge about the critical time period of lightning-caused fires and the corresponding vegetation stages would give fire managers a better opportunity to mobilize forest fire suppression resources to reduce damages. Despite our method exhibiting excellent performance, we strongly recommend that it be evaluated before being applied to other ecoregions in Canada or elsewhere in the world.

Author Contributions

Masoud Abdollahi and Quazi K. Hassan conceived and designed the study; Masoud Abdollahi, Quazi K. Hassan, and Ashraf Dewan developed the method; Masoud Abdollahi and Quazi K. Hassan were responsible for data downloading and preprocessing; Masoud Abdollahi, Quazi K. Hassan, and Ashraf Dewan were involved in manuscript writing; and Quazi K. Hassan supervised the whole study.

Acknowledgments

We would like to thank the following organizations: (i) NASA for making the MODIS data available to the public; and (ii) Alberta Forest Service, Government of Alberta for providing ground-based historical fire spots data and GIS layers.

Conflicts of Interest

The authors declare no conflict of interest.

References

  1. Natural Resources Canada Facts about Wildland Fires in Canada. Available online: http://www.nrcan.gc.ca/forests/fire-insects-disturbances/fire/13143 (accessed on 10 December 2015).
  2. Fang, L.; Yang, J.; Zu, J.; Li, G.; Zhang, J. Quantifying influences and relative importance of fire weather, topography, and vegetation on fire size and fire severity in a Chinese boreal forest landscape. For. Ecol. Manag. 2015, 356, 2–12. [Google Scholar] [CrossRef]
  3. Wang, Y.; Anderson, K.R. An evaluation of spatial and temporal patterns of lightning- and human-caused forest fires in Alberta, Canada, 1980–2007. Int. J. Wildland Fire 2010, 19, 1059–1072. [Google Scholar] [CrossRef]
  4. Li, C.; Liu, J.; Lafortezza, R.; Chen, J. Managing Forest Landscapes under Global Change Scenarios. In Landscape Ecology in Forest Management and Conservation: Challenges and Solutions for Global Change; Springer: Berlin, Germany, 2011; pp. 3–21. [Google Scholar]
  5. Kasischke, E.S.; Turetsky, M.R. Recent changes in the fire regime across the North American boreal region—Spatial and temporal patterns of burning across Canada and Alaska. Geophys. Res. Lett. 2006, 33. [Google Scholar] [CrossRef]
  6. Wotton, B.M.; Martell, D.L. A lightning fire occurrence model for Ontario. Can. J. For. Res. 2005, 35, 1389–1401. [Google Scholar] [CrossRef]
  7. Chen, F.; Du, Y.; Niu, S.; Zhao, J. Modeling forest lightning fire occurrence in the Daxinganling Mountains of Northeastern China with MAXENT. Forests 2015, 6, 1422–1438. [Google Scholar] [CrossRef]
  8. Liu, W.; Wang, S.; Zhou, Y.; Wang, L.; Zhu, J.; Wang, F. Lightning-caused forest fire risk rating assessment based on case-based reasoning: A case study in DaXingAn Mountains of China. Nat. Hazards. 2016, 81, 347–363. [Google Scholar] [CrossRef]
  9. Cha, D.H.; Wang, X.; Kim, J.W. Assessing lightning and wildfire hazard by land properties and cloud to ground lightning data with association rule mining in Alberta, Canada. Sensors 2017, 17, 2413. [Google Scholar] [CrossRef] [PubMed]
  10. Abdollahi, M.; Islam, T.; Gupta, A.; Hassan, Q. An advanced forest fire danger forecasting system: Integration of remote sensing and historical sources of ignition data. Remote Sens. 2018, 10, 923. [Google Scholar] [CrossRef]
  11. Abatzoglou, J.T.; Kolden, C.A.; Balch, J.K.; Bradley, B.A. Controls on interannual variability in lightning-caused fire activity in the western US. Environ. Res. Lett. 2016, 11, 045005. [Google Scholar] [CrossRef] [Green Version]
  12. Podur, J.; Martell, D.L.; Csillag, F. Spatial patterns of lightning-caused forest fires in Ontario, 1976–1998. Ecol. Modell. 2003, 164, 1–20. [Google Scholar] [CrossRef]
  13. Krawchuk, M.A.; Cumming, S.G.; Flannigan, M.D.; Wein, R.W. Biotic and abiotic regulation of lightning fire inititation in the mixedwood boreal forest. Ecology 2006, 87, 458–468. [Google Scholar] [CrossRef] [PubMed]
  14. Nurdiana, A.; Risdiyanto, I. Indicator determination of forest and land fires vulnerability using Landsat-5 TM data (Case Study: Jambi Province). Procedia Environ. Sci. 2015, 24, 141–151. [Google Scholar] [CrossRef]
  15. Zhang, J.H.; Yao, F.M.; Liu, C.; Yang, L.M.; Boken, V.K. Detection, emission estimation and risk prediction of forest fires in China using satellite sensors and simulation models in the past three decades-An overview. Int. J. Environ. Res. Public Health 2011, 8, 3156–3178. [Google Scholar] [CrossRef]
  16. Verbesselt, J.; Somers, B.; Lhermitte, S.; Jonckheere, I.; van Aardt, J.; Coppin, P. Monitoring herbaceous fuel moisture content with SPOT VEGETATION time-series for fire risk prediction in savanna ecosystems. Remote Sens. Environ. 2007, 108, 357–368. [Google Scholar] [CrossRef]
  17. Dasgupta, S.; Qu, J.J.; Hao, X. Moisture estimations for fire behavior predictions. Remote Sens. Environ. 2007, 108, 138–150. [Google Scholar] [CrossRef]
  18. Hoscilo, A.; Tansey, K.J.; Page, S.E. Post-fire vegetation response as a proxy to quantify the magnitude of burn severity in tropical peatland. Int. J. Remote Sens. 2013, 34, 412–433. [Google Scholar] [CrossRef]
  19. Jaya, I.N.S.; Purnama, E.S.; Arianti, I.; Boonyanuphap, J. Forest fire risk assessment model and post-fire evaluation using remote sensing and GIS: A case study in Riau, west Kalimantan and east Kalimantan provinces, Indonesia. In Proceedings of the The Forest Restoration and Rehabilitation Training Course and Workshop in the Viiki Tropical Resources Institute (VITRI) of the University of Helsinki, Helsinki, Finland, 13–19 May 2007; pp. 1–24. [Google Scholar]
  20. Sekhon, N.S.; Hassan, Q.K.; Sleep, R.W. Evaluating potential of MODIS-based indices in determining “snow gone” stage over forest-dominant regions. Remote Sens. 2010, 2, 1348–1363. [Google Scholar] [CrossRef]
  21. Delbart, N.; Kergoat, L.; Le Toan, T.; Lhermitte, J.; Picard, G. Determination of phenological dates in boreal regions using normalized difference water index. Remote Sens. Environ. 2005, 97, 26–38. [Google Scholar] [CrossRef]
  22. Sekhon, N.S.; Hassan, Q.K.; Kamal, M.M. Remote sensing-based determination of conifer needle flushing phenology over boreal-dominant regions. In Remote Sensing Applications in Environmental Research; Srivastava, P.K., Mukherjee, S., Gupta, M., Islam, T., Eds.; Society of Earth Scientists Series; Springer International Publishing: Cham, Switzerland, 2014. [Google Scholar]
  23. Hassan, Q.K.; Rahman, K.M. Remote sensing-based determination of understory grass greening stage over boreal forest. J. Appl. Remote Sens. 2013, 7, 073578. [Google Scholar] [CrossRef]
  24. Hassan, Q.K.; Rahman, K.M. Applicability of remote sensing-based surface temperature regimes in determining deciduous phenology over boreal forest. J. Plant. Ecol. 2013, 6, 84–91. [Google Scholar] [CrossRef]
  25. Bajocco, S.; Koutsias, N.; Ricotta, C. Linking fire ignitions hotspots and fuel phenology: The importance of being seasonal. Ecol. Indic. 2017, 82, 433–440. [Google Scholar] [CrossRef]
  26. Bajocco, S.; Guglietta, D.; Ricotta, C. Modelling fire occurrence at regional scale: Does vegetation phenology matter? Eur. J. Remote Sens. 2015, 48, 763–775. [Google Scholar] [CrossRef]
  27. Bowyer, P.; Danson, F.M. Sensitivity of spectral reflectance to variation in live fuel moisture content at leaf and canopy level. Remote Sens. Environ. 2004, 92, 297–308. [Google Scholar] [CrossRef]
  28. Belda, M.; Holtanová, E.; Halenka, T.; Kalvová, J. Climate classification revisited: From Köppen to Trewartha. Clim. Res. 2014, 59, 1–13. [Google Scholar] [CrossRef]
  29. Downing, D.J.; Pettapiece, W.W. Natural Regions and Subregions of Alberta; Government of Alberta: Edmonton, AB, Canada, 2006.
  30. Manikandan, S. Measures of central tendency: Median and mode. J. Pharmacol. Pharmacother. 2011, 2, 214. [Google Scholar] [CrossRef] [PubMed]
  31. Bhuyan, U.; Zang, C.; Vicente-Serrano, S.M.; Menzel, A. Exploring relationships among tree-ring growth, climate variability, and seasonal leaf activity on varying timescales and spatial resolutions. Remote Sens. 2017, 9, 526. [Google Scholar] [CrossRef]
  32. Swain, S.; Wardlow, B.D.; Narumalani, S.; Tadesse, T.; Callahan, K. Assessment of vegetation response to drought in Nebraska using Terra-MODIS land surface temperature and normalized difference vegetation index. GISci. Remote Sens. 2013, 48, 432–455. [Google Scholar] [CrossRef]
  33. McLaurin, M.K.; Turvey, C.G. Applicability of the normalized difference vegetation index in index-based crop insurance design. Weather Clim. Soc. 2011, 4, 271–284. [Google Scholar] [CrossRef]
  34. Wall, L.; Larocque, D.; Léger, P.M. The early explanatory power of NDVI in crop yield modelling. Int. J. Remote Sens. 2008, 29, 2211–2225. [Google Scholar] [CrossRef]
  35. Cihlar, J.; Laurent, L.S.; Dyer, J.A. Relation between the normalized difference vegetation index and ecological variables. Remote Sens. Environ. 1991, 35, 279–298. [Google Scholar] [CrossRef]
  36. Qi, Y.; Dennison, P.E.; Spencer, J.; Riano, D. Monitoring live fuel moisture using soil moisture and remote sensing proxies. Fire Ecol. 2012, 8, 71–87. [Google Scholar] [CrossRef]
  37. Vandegehuchte, M.L.; de la Peña, E.; Bonte, D. Relative importance of biotic and abiotic soil components to plant growth and insect herbivore population dynamics. PLoS ONE 2010, 5, e12937. [Google Scholar] [CrossRef] [PubMed]
  38. Hassan, Q.K.; Bourque, C.P.A. Potential species distribution of balsam fir based on the integration of biophysical variables derived with remote sensing and process-based methods. Remote Sens. 2009, 1, 393–407. [Google Scholar] [CrossRef]
  39. Hassan, Q.K.; Bourque, C.P.A.; Meng, F.R. Estimation of daytime net ecosystem CO2 exchange over balsam fir forests in eastern Canada: Combining averaged tower-based flux measurements with remotely sensed MODIS data. Can. J. Remote Sens. 2006, 32, 405–416. [Google Scholar] [CrossRef]
  40. Dupilka, M.L.; Reuter, G.W. Composite soundings associated with severe and tornadic thunderstorms in Central Alberta. Atmos. Ocean. 2011, 49, 269–278. [Google Scholar] [CrossRef]
  41. Brimelow, J.C.; Reuter, G.W.; Poolman, E.R. Modeling maximum hail size in Alberta thunderstorms. Weather Forecast 2002, 17, 1048–1062. [Google Scholar] [CrossRef]
  42. Negi, M.S.; Kumar, A. Assessment of increasing threat of forest fires in Uttarakhand, Using Remote Sensing and Gis Techniques. Glob. J. Adv. Res. 2016, 3, 457–468. [Google Scholar]
  43. Bond, W.J.; Keeley, J.E. Fire as a global ‘herbivore’: The ecology and evolution of flammable ecosystems. Trends Ecol. Evol. 2005, 20, 387–394. [Google Scholar] [CrossRef] [PubMed]
  44. Tymstra, C.; Wang, D.; Rogeau, M.P. Alberta Wildfire Regime Analysis; Alberta Department of Sustainable Resource Development, Forest Protection Division, Wildfire Policy and Business Planning Branch: Edmonton, AB, Canada, 2005.
  45. Government of Alberta. Flat Top Complex Wildfire Review Committee Flat Top Complex: Final Report from the Flat Top Complex Wildfire Review Committee; Government of Alberta: Edmonton, AB, Canada, 2012.
  46. Westerling, A.L.; Hidalgo, H.G.; Cayan, D.R.; Swetnam, T.W. Warming and earlier spring increase Western U.S. forest wildfire activity. Science 2006, 313, 940–943. [Google Scholar] [CrossRef]
  47. Martell, D.L.; Otukol, S.; Stocks, B.J. A logistic model for predicting daily people-caused forest fire occurrence in Ontario. Can. J. For. Res. 1987, 17, 394–401. [Google Scholar] [CrossRef]
  48. Kilinc, M.; Beringer, J. The spatial and temporal distribution of lightning strikes and their relationship with vegetation type, elevation, and fire scars in the northern Territory. J. Clim. 2007, 20, 1161–1173. [Google Scholar] [CrossRef]
  49. Chowdhury, E.H.; Hassan, Q.K. Use of remote sensing-derived variables in developing a forest fire danger forecasting system. Nat. Hazards. 2013, 67, 321–334. [Google Scholar] [CrossRef] [Green Version]
  50. Chowdhury, E.H.; Hassan, Q.K. Development of a new daily-scale forest fire danger forecasting system using remote sensing data. Remote Sens. 2015, 7, 2431–2448. [Google Scholar] [CrossRef]
  51. Akther, M.S.; Hassan, Q.K. Remote sensing-based assessment of fire danger conditions over boreal forest. IEEE J. Sel. Top. Appl. Earth Obs. Remote Sens. 2011, 4, 992–999. [Google Scholar] [CrossRef]
Figure 1. Geographic extent of the 21 natural subregions of Alberta, which are categorized based on climate, geology, topography, and vegetation. The parentheses values in the legend represent the subregion-specific relative frequencies for all of the lightning-caused fire events during the 2005–2016 period.
Ijgi 08 00143 g001
Figure 2. Schematic diagram illustrating the proposed method in this study (a); and the pattern for annual NDWI profile modified according to Sekhon et al. [20] (b).
Ijgi 08 00143 g002
Figure 3. Median NDWI patterns for the six natural subregions individually for every year during the calibration time-period (i.e., 2005–2012).
Ijgi 08 00143 g003
Figure 4. Lightning-caused fires’ relative frequency distribution (i.e., at eight-day time-period during the 2005–2012 period) over the annual profile of median NDWI values in six natural subregions. The three vertical dotted lines show the stages of snow disappearance (left red-dashed line), around the peak of growing season (middle black-dashed line), and snowfall (right red-dashed line). In addition, the percent values show the amount of lightning-caused fire occurrences that happened between the snow disappearance, as well as (i) around the peak of the growing season and (ii) snowfall stages.
Ijgi 08 00143 g004
Figure 5. Dynamics of cumulative values of median NDWI and lightning-caused fire frequencies against day of year (DOY) for all six natural subregions during the entire growing season spanning between snow disappearing in spring and snowfall in autumn.
Ijgi 08 00143 g005
Figure 6. Relationships between subregion-specific cumulative values of median NDWI and lightning-caused fire frequencies in all six natural subregions during the 2005–2012 period.
Ijgi 08 00143 g006
Figure 7. Comparison between the observed and modeled cumulative frequency of lightning-caused fire occurrences during the years 2013–2016 in the selected natural subregions. The solid and dash lines represent regression and a 1:1 line, respectively. n indicates the total observed subregion-specific lightning-caused fire occurrences in that particular year.
Ijgi 08 00143 g007
Figure 8. Annual NDWI and EVI profiles along with surface temperature at the eight-day temporal resolution over two natural subregions (i.e., Central Mixedwood and Lower Boreal Highlands) in our study area during 2008.
Ijgi 08 00143 g008
Table 1. Description of the dominant vegetation type and the percentage of fire occurrences caused by lightning strikes in each subregion of interest.
Natural SubregionDominant Vegetation Type% of Fires Caused by Lightning Strikes during 2005–2016
Central MixedwoodAspen42
Lower Boreal HighlandsLodgepole pine and jack pine15
Lower FoothillsA mixed of aspen–lodgepole pine–white spruce13
Upper FoothillsLodgepole pine 7
Northern MixedwoodA mixed of aspen, white spruce, and black spruce 6
Dry Mixedwood BorealA combination of cultivated areas and aspen forests6
Table 2. Description of the data used in this study.
Data TypeSourcePeriodSpecificationUtilization
Remote sensingNASA2005–2016Eight-day composite of surface reflectance (i.e., MOD09A1) at 500-m spatial resolutionEmployed to generate subregion-specific NDWI over our study area of interest
GroundAlberta Forest Service, Govt. of Alberta2005–2012Historical lightning-caused fire dataset consisting of 3905 fires Used as calibration dataset for model development
2013–2016Historical lightning-caused fire dataset consisting of 1826 firesEmployed as validation dataset for model validation
GIS layersAlberta Forest Service, Govt. of Alberta2006Geographical boundary of AlbertaUsed to clip the calculated NDWI
Natural subregions of Alberta at 250-m spatial resolutionUsed to subdivide lightning-caused fire occurrences at the subregion level

