Article

Simulating Spatio-Temporal Patterns of Terrorism Incidents on the Indochina Peninsula with GIS and the Random Forest Method

1
Institute of Geographical Sciences and Natural Resources Research, Chinese Academy of Sciences, 11A Datun Road, Chaoyang District, Beijing 100101, China
2
College of Resource and Environment, University of Chinese Academy of Sciences, NO.19 Yuquan Road, Shijingshan District, Beijing 100049, China
3
Key Laboratory of Carrying Capacity Assessment for Resource and Environment, Ministry of Land & Resources, Beijing 100101, China
*
Author to whom correspondence should be addressed.
ISPRS Int. J. Geo-Inf. 2019, 8(3), 133; https://doi.org/10.3390/ijgi8030133
Submission received: 10 January 2019 / Revised: 27 February 2019 / Accepted: 4 March 2019 / Published: 7 March 2019
(This article belongs to the Special Issue GIS for Safety & Security Management)

Abstract

:
In recent years, various types of terrorist attacks have occurred which have caused worldwide catastrophes. The ability to proactively detect and even predict a potential terrorist risk is critically important for government agencies to react in a timely manner. In this study, a method of geospatial statistics was used to analyse the spatio-temporal evolution of terrorist attacks on the Indochina Peninsula. The machine learning random forest (RF) method was adopted to predict the potential risk of terrorist attacks on the Indochina Peninsula on a spatial scale with 15 driving factors. The RF model performed well with AUC values of 0.839 [95% confidence interval of 0.833–0.844]. The map of the potential distribution of terrorist attack risk was obtained with a 0.05×0.05-degree (approximately 5×5 km) resolution. The results indicate that Thailand is the most dangerous area for terrorist attacks, especially southern Thailand, Bangkok and its surrounding cities. Middle Cambodia and the northern and southern parts of Myanmar are also high-risk areas. Other areas are relatively low risk. This study provides the hotspots for terrorist attacks on a more fine-grained geographical unit. Meanwhile, it shows that machine learning algorithms (e.g., RF) combined with GIS have great potential for simulating the risk of terrorist attacks.

1. Introduction

Terrorism is a global problem that has drawn substantial attention, especially after the events of 9/11 in the USA in 2001 [1,2,3]. According to the GTD (Global Terrorism Database), more than 98,773 terrorist attacks were reported between 2001 and 2016, which resulted in approximately 238,808 deaths [4]. These incidents are spatially aggregated in the Middle East, South Asia, and North Africa, which are considered geopolitically vulnerable regions [5,6,7]. However, some traditionally ‘quiet’ regions, including Southeast Asia and the Sub-Saharan regions, have become potential hotspots in recent years [8,9,10,11,12]. The Indochina Peninsula is one of the three peninsulas in South Asia, and is an important component of Southeast Asia. However, the Indochina Peninsula has been impacted by terrorist attacks in recent years [13]. In 2016, there were a total of 13,488 terrorist attacks in the world, among which 4573 occurred in Asia, which accounted for 24% of the international total. There were 1078 terrorist attacks in Southeast Asia. From 2001 to 2016, the number of terrorist attacks on the Indochina Peninsula increased from 29 to 400 [4]. Therefore, it is of great significance to understand the spatio-temporal evolution of terrorist attacks on the Indochina Peninsula and to predict areas that are potentially at risk. Thus, this study focuses on the Indochina Peninsula as its research area.
Knowledge about the spatio-temporal characteristics of terrorist events is essential to reduce the loss of life and property. However, the driving forces of terrorism and the principles of their interaction are complex [14]. These complexities make it difficult to systematically simulate the dynamics of terrorist attacks and to predict them with conventional mathematical or semi-experienced statistical approaches. Several studies have focused on these issues. Since geographic information techniques could be used as efficient tools for describing the characteristics of various terrorist events, Braithwaite and Li presented a study to detect transnational terrorism hotspots at the country level by using spatial autocorrelation. They also assessed empirically the impact of these hotspots on future patterns of terrorist incidents. Braithwaite and Li found in a pooled time-series analysis of 112 countries from 1975 to 1997, that when a country is located within a hot spot neighbourhood, a large increase in the number of terrorist attacks is likely to occur in the proceeding time period [15]. Guo conducted an in-depth analysis of the spatio-temporal clusters of terrorist events with prospective scanning statistical algorithms. This method was shown to be capable of predicting potential outbreaks of terrorist incidents at a relatively early stage [16]. To analyse and forecast the conditional probability of bombing attacks (CPBAs), Li et al. developed a model that is based on time-series methods. The results show that the CPBA increased dramatically at the end of 2011. This was mainly caused by some social unrest, such as America’s troop withdrawal from Afghanistan and Iraq. In addition, the integrated time-series and intervention model was used to forecast the monthly CPBA in 2014 and 2064. The average relative error compared with the real data for 2014 was 3.5% [17]. Sachan and Roy showed a terrorist group prediction model (TGPM) to predict which terrorist group would be involved in a given attack by learning the similarities among terrorist incidents that occurred during various terrorist attacks. The TGPM model was validated by experimental results [18].
However, it was soon recognized that these models cannot capture the varying effects and complex interactions of terrorist attack predictors. This realization led to the introduction of machine learning techniques, such as the random forest method, which is an analytical trend that continues to be used in the present day [19]. Mo et al. focused on the prediction of terrorist events with data from the Global Terrorism Database (GTD) using data mining techniques. Support vector machine (SVM), naive Bayes (NB) and logistic regression (LR) methods were adopted in their papers. A detailed comparison of the classification performance of each method is presented, where classifier LR with seven optimal feature subsets reached a classification precision of 78.41%, which validates the feasibility of applying machine learning to the field of terrorism studies [20]. Zhou el al. predicted the terrorist attacks on a global monthly time scale with wavelet neural networks without features during the period between February 1968 and January 2007. The simulation results show that the model is capable of producing reasonable accuracy within several steps [21]. Muhammad and Kazi focused on analysing a GTD incident data set from that is specific to Pakistan from the year 1970 to 2014 by using a supervised learning method, which includes the ensemble classifier, the Bayesian classifier and the decision tree classifier. The future terrorist attacks were predicted according to the city, attack type, target type, claim mode, weapon type and motive of attack through classification techniques without features [22]. The approach that was presented by Brandt et al. is only based on conflict event data for the Israel-Palestine conflict without driving factors. Using Bayesian models that distinguish between high and low intensity conflicts, the analysis generates predictions for the year 2010 based on data from 1996 to 2009 [23]. Dong predicted the terrorist attacks in 2010–2016 in India by using a BP neural network and the terrorist attack data from the time period 1995–2009 by considering only economic factors [24]. Hartman et al. predicted the 2010 local violence in Liberia by using 2008 data and four features [25].
The above studies were conducted at the national scale. Other studies have attempted to predict where conflict is likely to break out. Weidmann and Ward generated predictions at the municipality level for the conflict in Bosnia by considering only population, ethnic composition, border locations and elevation [26]. Ding et al. used machine learning to predict global terrorist attacks at the pixel scale (approximately 10×10 km) with ten features. They found that the RF algorithm performs better than other machine learning algorithms in predicting the places where terror events might occur in 2015, with a success rate of 96.6% [27].
As for the prediction of terrorist attack risks, most of the current studies are based on the national scale, and few of them are predicted on a more detailed spatial scale. At the same time, the driving factors of terrorist attacks considered in the current research are not comprehensive enough. To solve these two problems, the main research objectives of this paper are to predict the risk of terrorist attacks on the Indochina Peninsula at a relatively fine geographical spatial scale with more comprehensive factors. To achieve this goal, this study mainly focus on the following: (1) reviewing the literature on conflict drivers to construct a more comprehensive feature dimension, (2) processing all of the data into raster data with 0.05×0.05 degrees (approximately 5×5 km), and conflict prediction was conducted on a relatively fine geospatial scale, and (3) applying a machine learning algorithm, namely the random forest method, to spatial scale prediction.

2. Materials and Methods

In this study, the geospatial statistics method was used to analyse the spatio-temporal evolution of terrorist attacks on the Indochina Peninsula. On this basis, a machine learning approach, the RF algorithm, was proposed to predict potential terrorist threats at the spatial scale. The main steps to achieving the goal are as follows:
Step 1: Extracting the terrorist attacks on the Indochina Peninsula from the GTD and using the ArcGIS software to spread terrorist attacks on the map;
Step 2: The “Kernel Density” function in ArcGIS and OriginLab were used to analyse the evolution of terrorist attacks from a time and space perspective;
Step 3: Preparation of spatial geographic data and corresponding raster data of the terrorist attack;
Step 4: Construction of the RF algorithm to predict terrorist attacks at the spatial scale on the Indochina Peninsula.
The system architecture that is used for predicting terrorist attacks is shown in Figure 1.

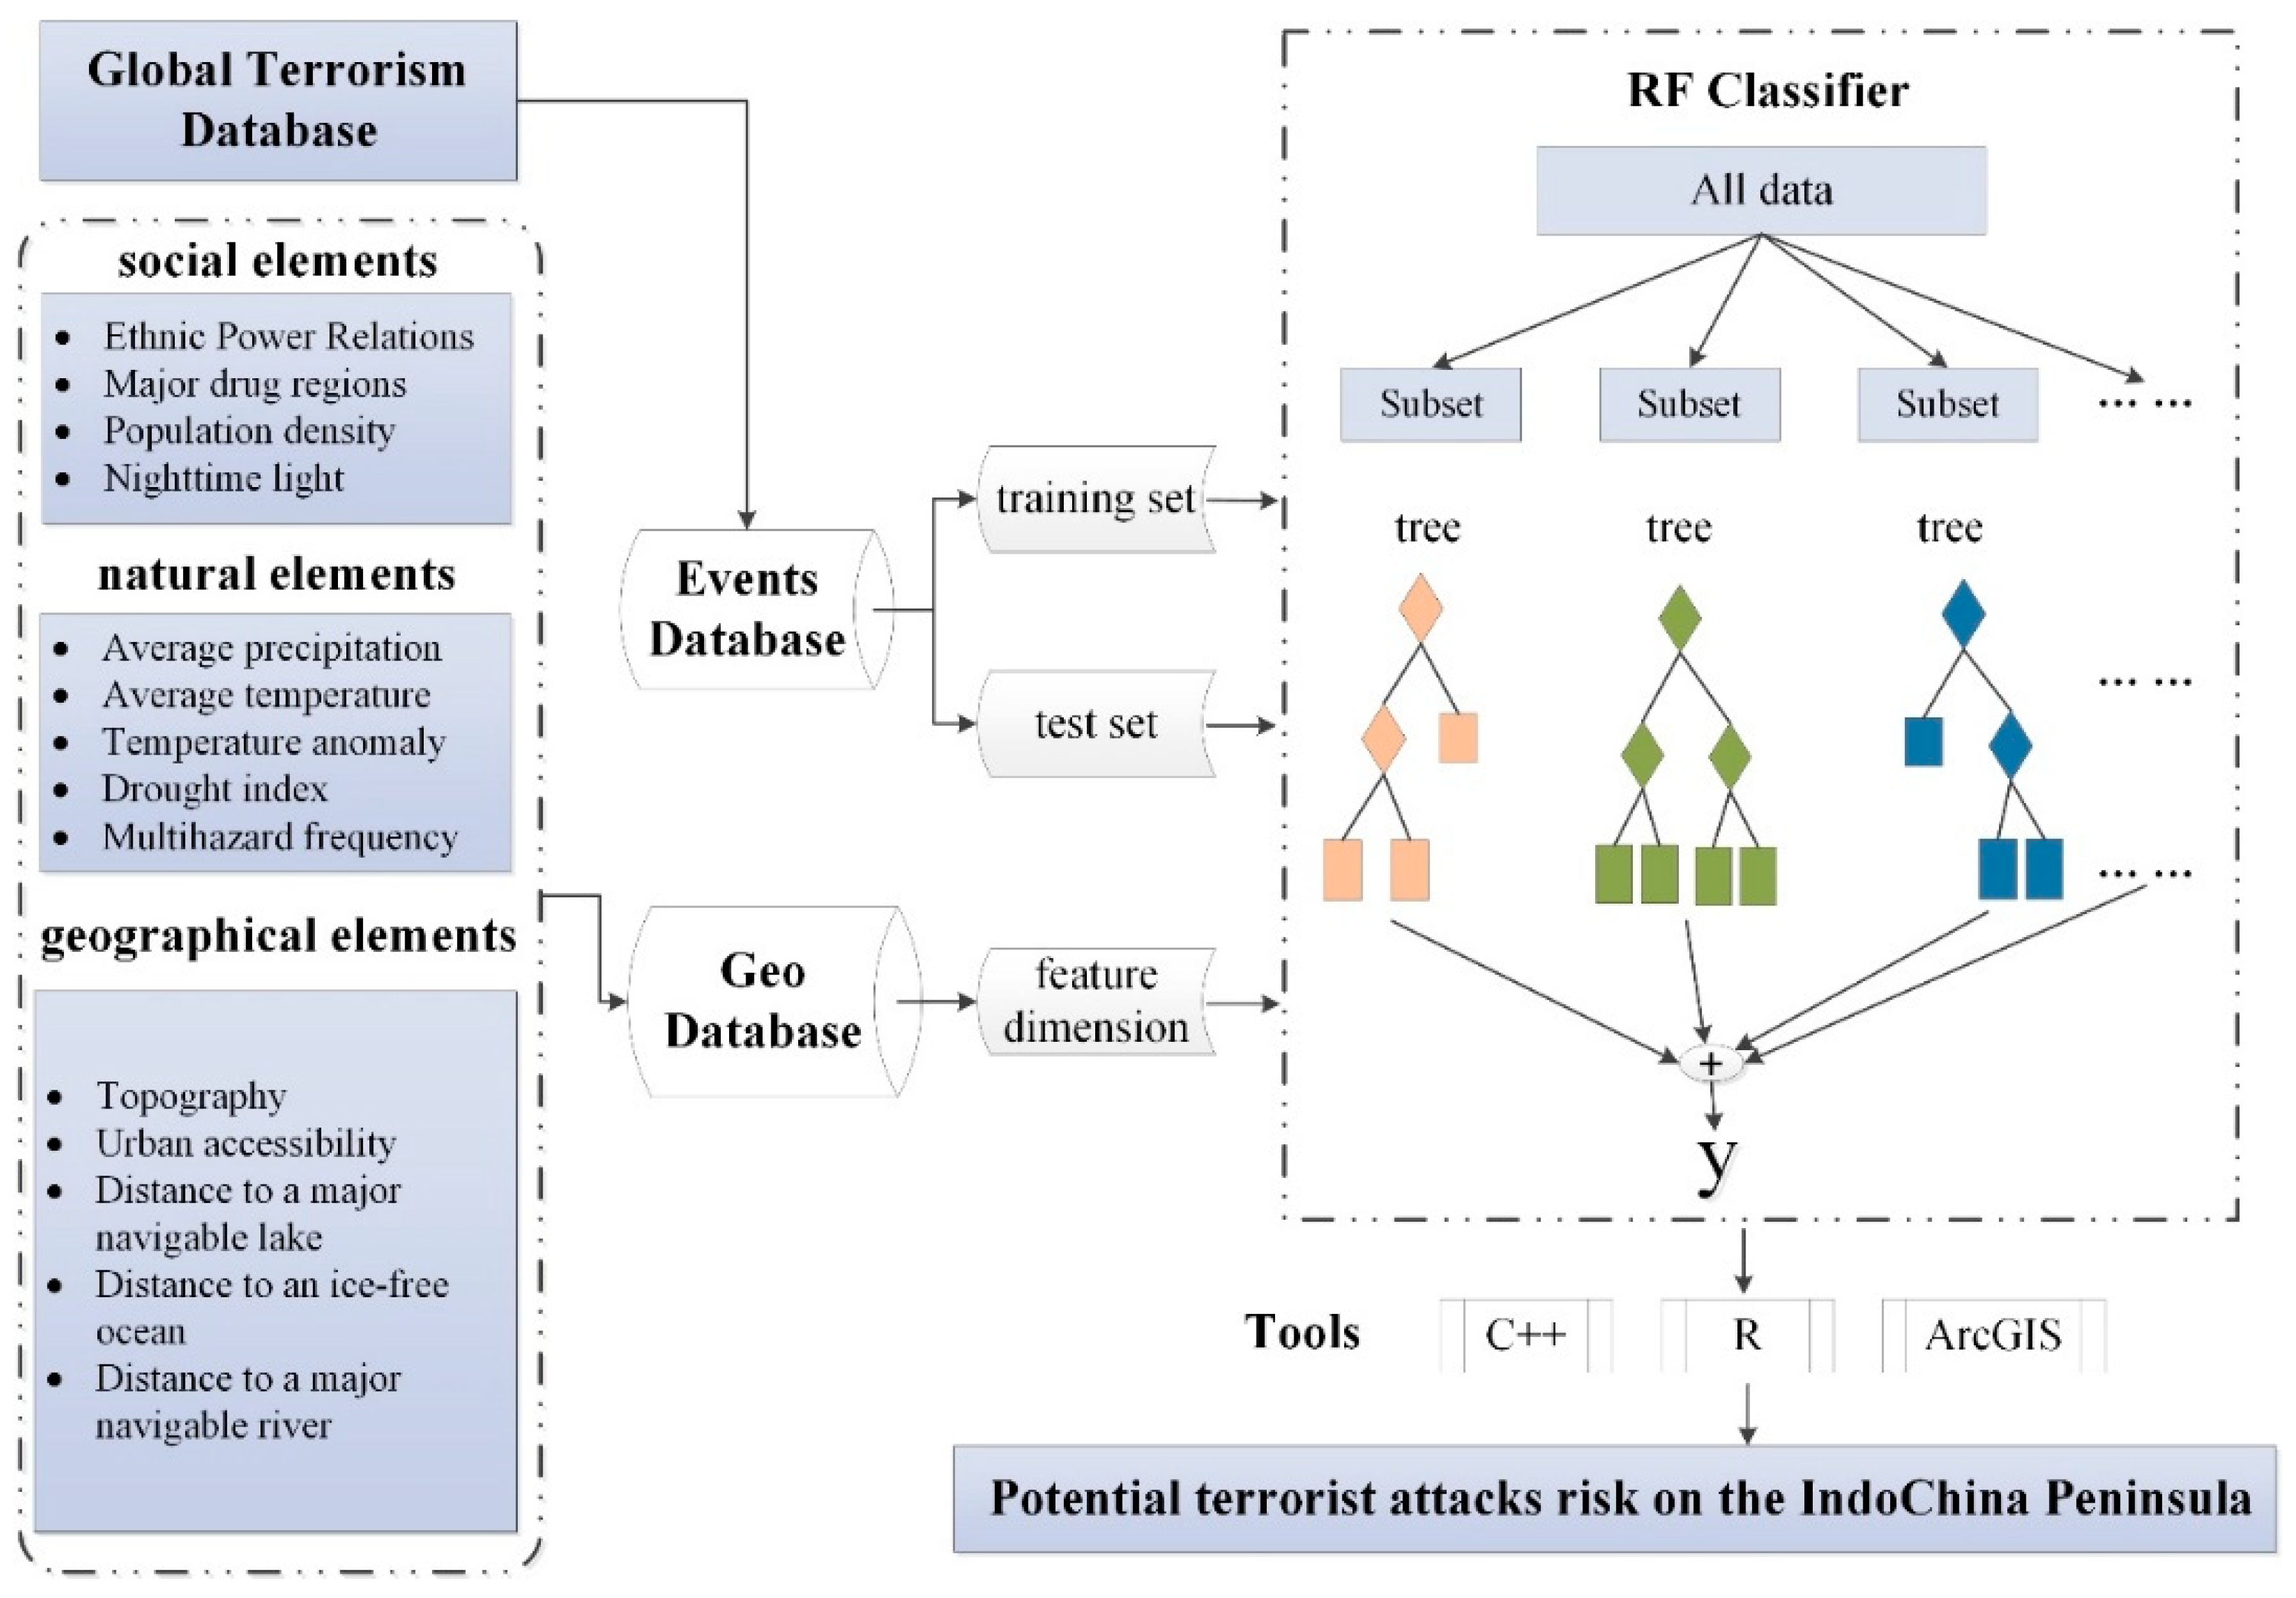
2.1. Feature Selection

Terrorist attacks are a very complex social phenomenon that are driven by many factors, including social, natural, and geographical elements [28]. In addition to religious and political influences, some scholars have explored other drivers of terrorist attacks. We classified these driving factors as shown in the table below.
Table 1 shows that, among social elements, research studies have focused on the impact of geographical, economic factors and population density on violence. Of the natural elements, natural resources (including water resources and land resources) and climate resources (including temperature and precipitation) are the main factors that scholars pay attention to. For geographical elements, location, topography and the river system (can also be understood as water resources in natural elements) are considered to have an impact on terrorist attacks.
Among the above factors, geopolitics is a special factor. Geopolitical relations vary from region to region, so geopolitical indicators are different. The geopolitical relations on the Indochina Peninsula were relatively stable from a macro perspective. After the end of the Cold War, the United States had a limited influence on the Indochina Peninsula, and Russia was inactive in this region at the time. The hostility between Southeast Asian countries also turned into friendship. The establishment of the Greater ASEAN promoted the development of regional economic integration. The Indochina Peninsula and neighbouring countries established a good relationship. However, there are three geopolitical destabilizing factors on the Indochina Peninsula [46], namely (1) poverty in the context of economic globalization that may prompt poor countries to adopt a more extreme opposition, (2) the instability of the state power in the Indochina Peninsula has caused geopolitical vulnerability, and (3) cross-border ethnic issues in the context of non-traditional security, resource possession and plundering, ecological security issues, water use, security issues, and drug abuse have constituted a new threat to geopolitical development and are hidden factors of the geopolitical security threat to the Indochina Peninsula. Therefore, for the Indochina Peninsula, geopolitics can be expressed by indicators such as socioeconomic, national vulnerability, ethnic distribution, and resources.
Based on the current research results and considering the availability of data, 15 driving factors were selected in this study, which are shown in Table 2.
The original data of the features have different data formats and resolutions. To ensure that the data have the same resolution, coordinate system, and dimensions, ArcGIS software was used to re-process data to maintain consistency. The geospatial data with 0.05×0.05 degrees (approximately 5×5 km) were obtained.

2.2. The Events Dataset (GTD)

The terrorist event data that were used in this study were extracted from the GTD. The GTD defines a terrorist attack as the threatened or actual use of illegal force and violence by a non-state actor to attain a political, economic, religious, or social goal through fear, coercion, or intimidation [4]. It is an open-source publicly available database containing information on worldwide terrorist incidents that occurred between 1970 and 2016 (http://www.start.umd.edu/gtd/). The database is based on a hard-copy dataset that was originally collected by the Pinkerton Global Intelligence Service (PGIS). Each record in the GTD database includes the date of the incident and several other attributes, such as weapons used, target characteristics, outcome of attack, location and group responsible, when this information is available [48]. The geospatial data were the raster data with 0.05-degree. However, the original terrorist event data was the point data. To achieve consistency between these two datasets, the terrorist attack data were converted into raster data with the same spatial resolution as geographic data. If a terrorist attack occurred in a pixel with 0.05-degree, this pixel was considered to be a high-risk area with an assignment of 1 and, if not, a value of 0.

2.3. Kernel Density Estimation

Kernel density estimate is one way to convert a set of points into a raster. In this process, at every point in the point set, the contents of what is effectively a small tile (called a kernel) containing a predefined pattern are added to the grid cells surrounding the point in question (i.e., the kernel is centred on the tile cell containing the point and then is added to the tile). This is a local map algebra operation. The usual kernel density estimate f h ^ ( x ) of a univariate density f based on a random sample X 1 ,   X 2 , , X n of size n is as follows [49]:
f h ^ ( x ) = 1 n h i = 1 n K ( x X i h )
where h is window width; f ^ h ( x ) is precisely the kernel estimate evaluated at x with window width h ; x X i is the distance between point x to point X i ; and K is the Kernel function which is described in Silverman [50].
In this study, the kernel density estimate was used to analyse the spatio-temporal variation of terrorist attacks on the Indochina Peninsula. It can identify the geographical distribution of hotspots based on the frequency of terrorist attacks at each location. The X n in Equation (1) refers to the terrorist attack frequency at the n-th position, which was obtained from the GTD. The window width is 50 km and the cell size of output raster data is 0.05-degree in this study. The “Kernel Density” tool in ArcGIS software can achieve this function and obtain the geographical distribution of hotspots in terrorist attacks.

2.4. RF Algorithm

To build relationships between terrorist events and social, natural, and geographic variables at the spatial scale, C++, R and ArcGIS were used to construct the RF algorithm applied to spatial scale prediction based on the “Random Forest” package within the R environment
RF is an ensemble learning technique that was developed by Breiman based on the combination of a large set of decision trees [51,52,53]. Each tree is trained by selecting a random set of variables and a random sample from the training dataset [54,55]. Three training parameters need to be defined in the RF algorithm: ntree, the number of bootstrap samples used for the original data (the default number of trees, 500, was used in this study because values larger than 500 were unable to significantly improve the performance of the RF algorithm); mtry, the number of different predictors tested at each node; and nodesize, the minimal size of the terminal nodes of the trees below which leaves are not further subdivided.
To use the RF method, a sample dataset is needed. Pixels with value 1 where terrorist attacks had occurred from 1970 to 2016 were all selected, and the same numbers of pixels where terrorist attacks did not occur were randomly selected from the remaining pixels. Finally, 730 sample points were obtained. To train and verify the performance of the RF model, 75% of sample points (548) were randomly selected as training data, and the remaining points (182) were used as validation data. The driving factors corresponding to sample pixels were regarded as the feature dimensions for the RF algorithm. We performed 100 simulations to avoid the randomness of the results. To avoid over-fitting, the 10-fold cross-validation method was used in this study. In addition, the AUC value was used to verify the accuracy of the simulation.

3. Results

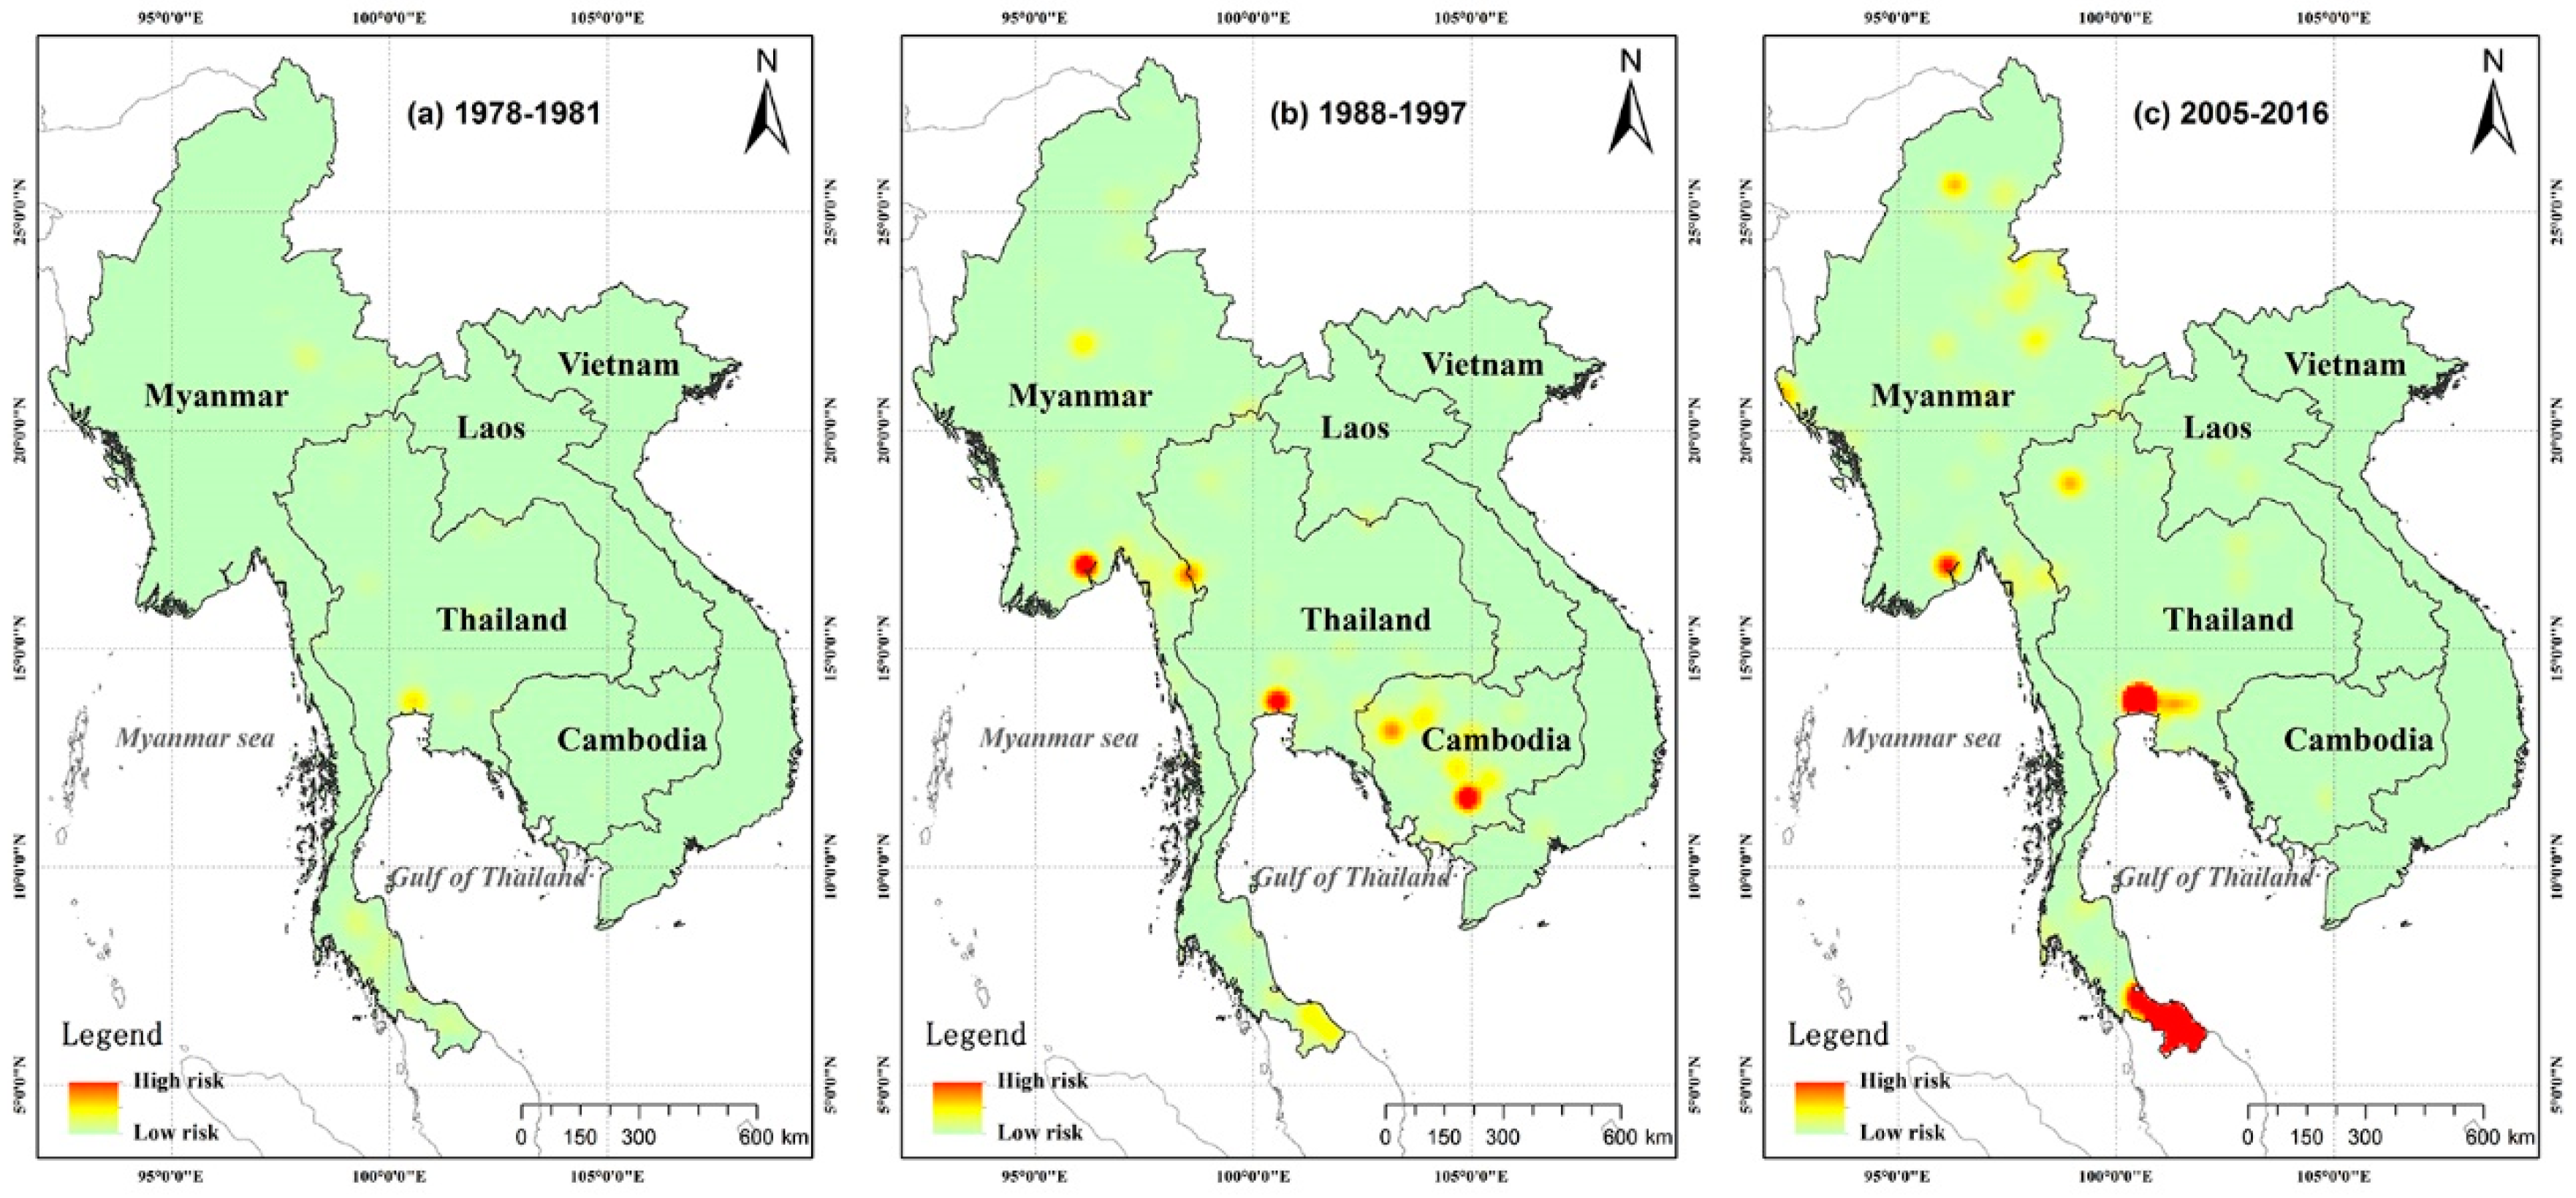
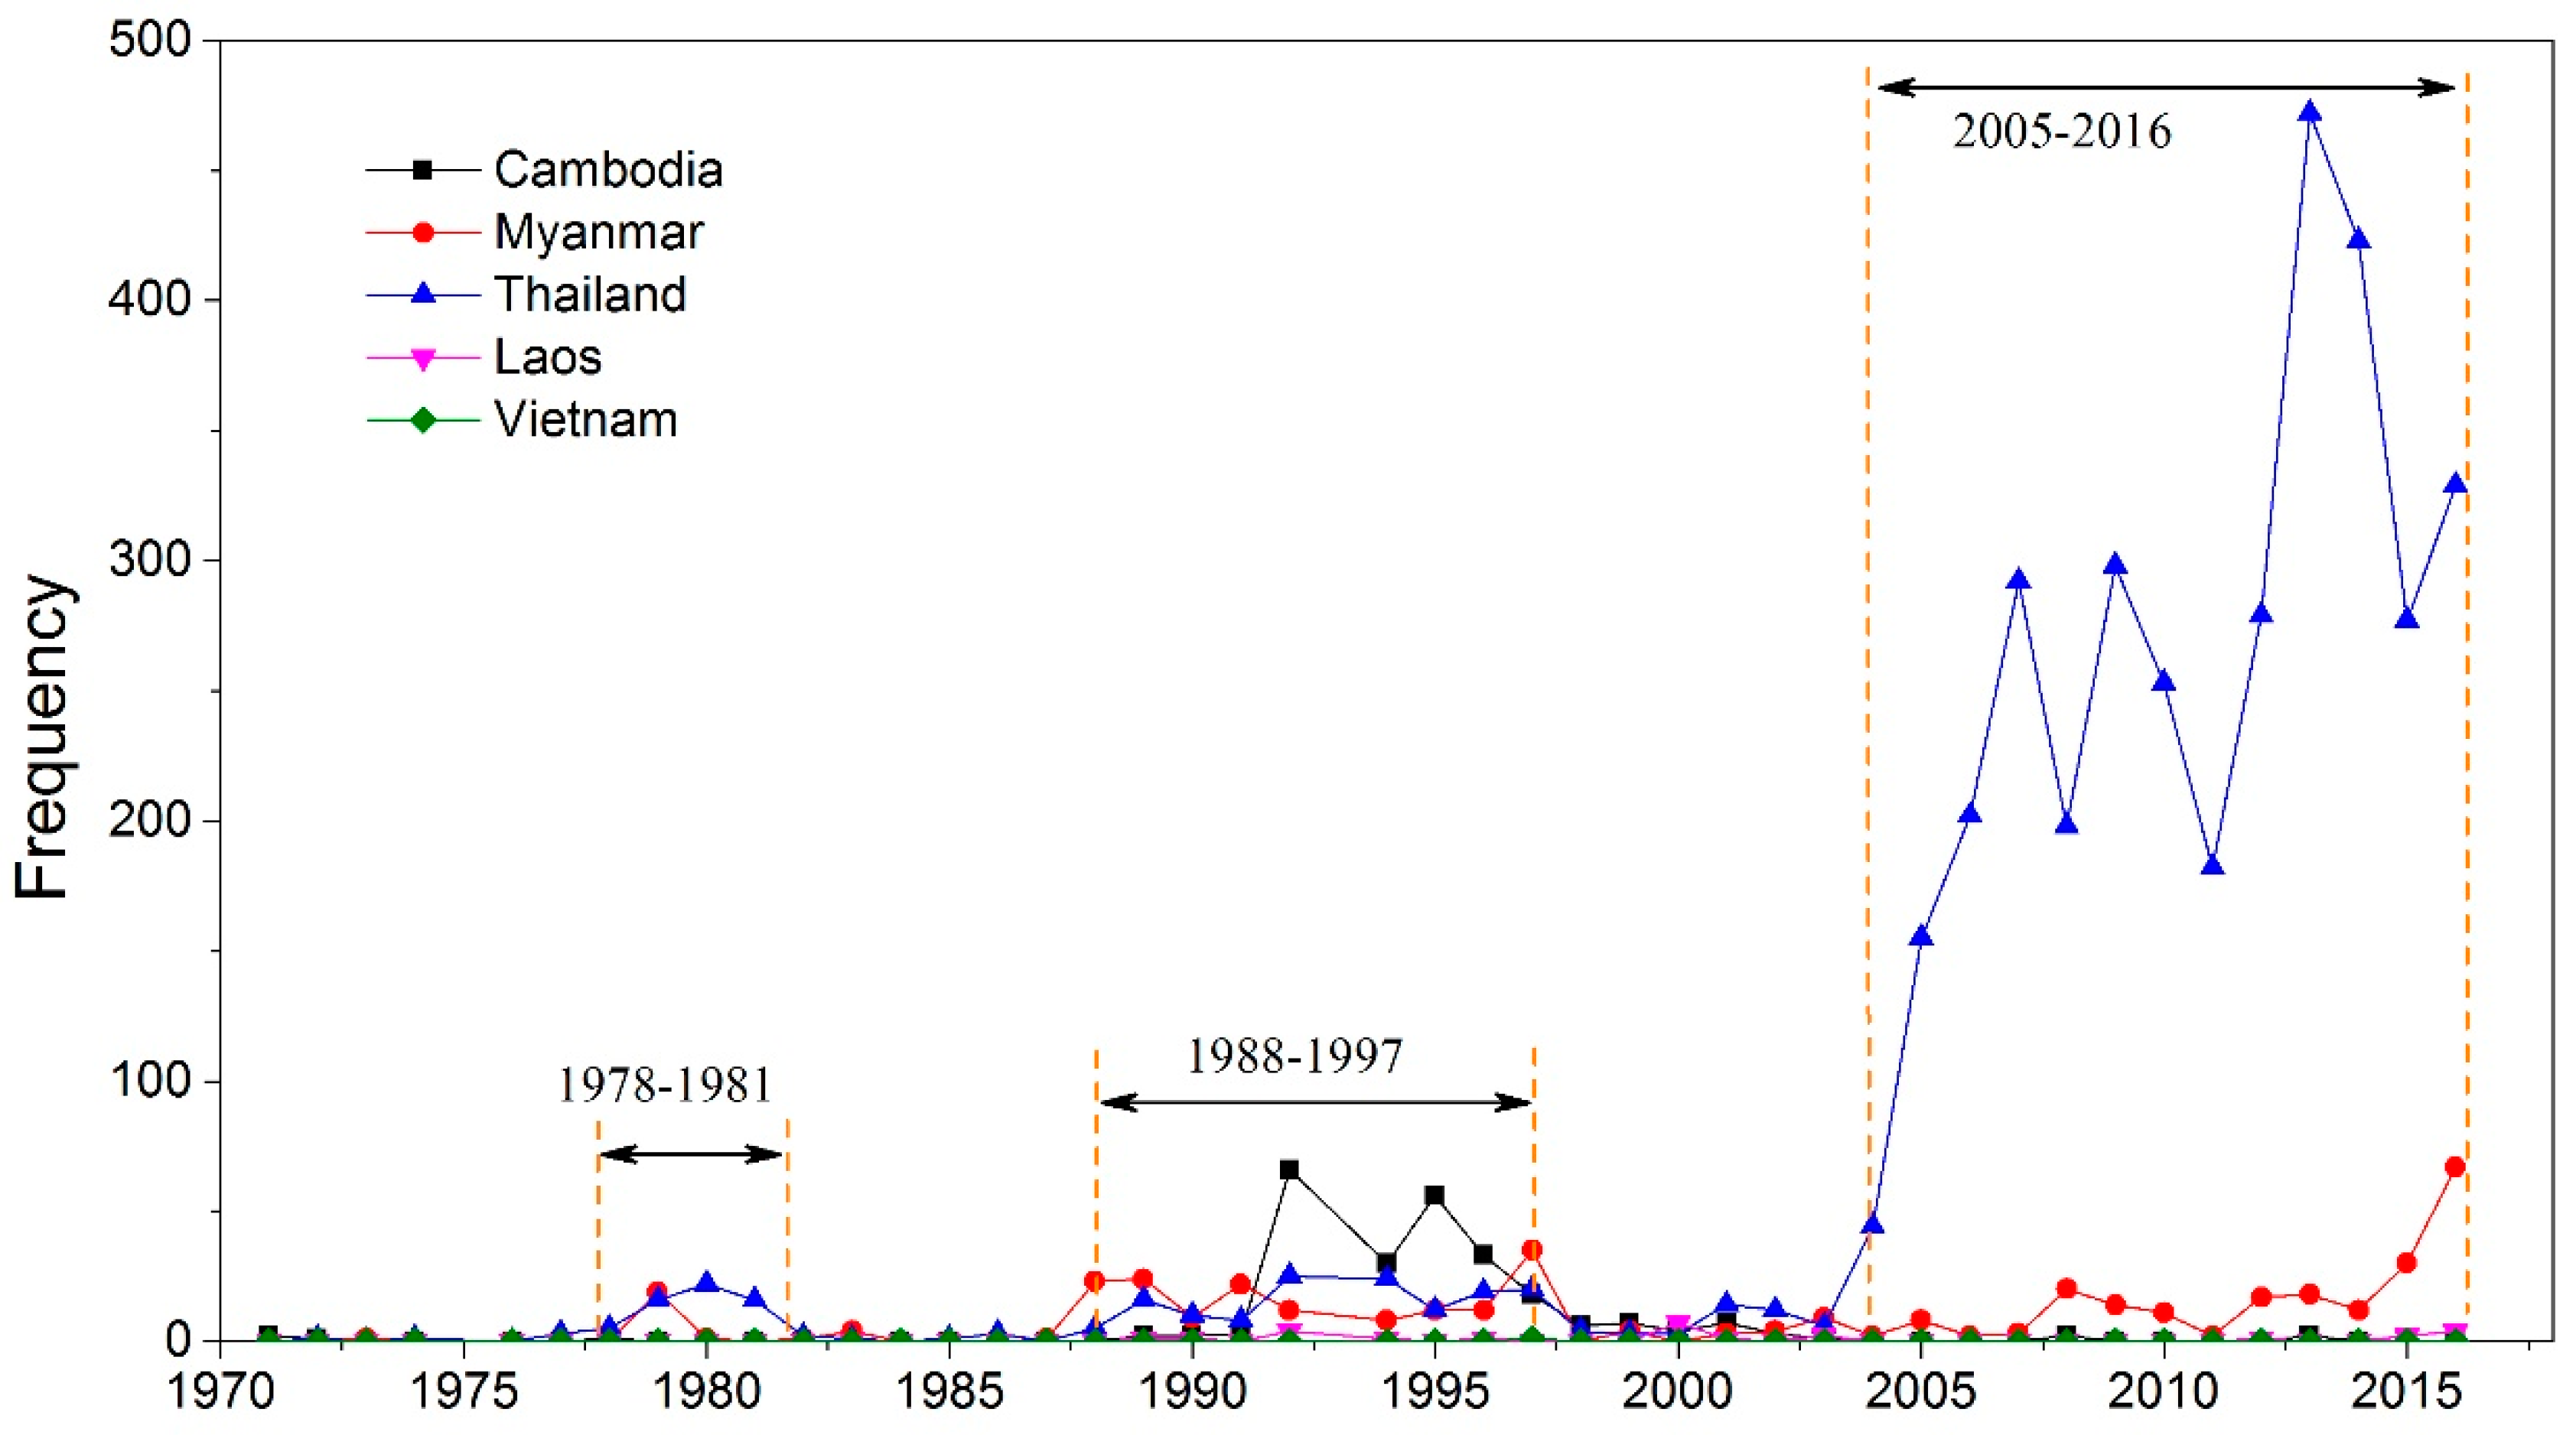
3.1. Spatio-Temporal Variation of Terrorist Attacks on the Indochina Peninsula

Terrorist attacks occurring on the Indochina Peninsula between 1970 and 2016 were extracted from the GTD. On the Indochina Peninsula, 4348 terrorist attacks occurred, causing 4302 deaths. To analyse the spatio-temporal evolution of the terrorist incidents on the Indochina Peninsula, the terrorist attack data were spread to the map from the perspective of time and space with kernel density estimation, as shown in Figure 2.
Figure 2a shows that terrorist attacks were evenly distributed geographically over the past 37 years, except in Laos and Vietnam. Compared with the other three countries on the Indochina Peninsula, terrorist attacks have occurred less in Laos and Vietnam. Considering the frequency of terrorist attacks, hotspot areas were obtained with the “Kernel Density” tool in ArcGIS software. Figure 2b shows five hot spot areas on the Indochina Peninsula. Yangon, the former capital of Myanmar, is one of the high incidences of terrorist attacks. The border between Thailand and Myanmar, which is mainly located in Karen State in Myanmar and Tak in Thailand, is also a hot spot for terrorist attacks on the Indochina Peninsula. The central part of Cambodia, Kandal, and Phnom Penh, which is the capital of Cambodia, include additional hotspots. Further to these three hotspots, Thailand has two more areas where terrorist attacks occur frequently. Pattani, Narathiwat, Yala and Satun of Thailand, the four neighbouring provinces bordering Malaysia, are predominantly a Malay Muslim settlement, which is one of the hotspots on the Indochina Peninsula. Another hotspot is in Bangkok, which is the capital of Thailand. Of these five hotspots, four are near national borders or junctions between two countries.
To reflect the spatiotemporal variation characteristics of terrorist attacks on the Indochina Peninsula, we conducted a statistical analysis using the time and space scales, as shown in the figures below.
Figure 3 shows that on the Indochina Peninsula, three peaks can be found in the frequency of terrorist attacks: from 1978 to 1981, from 1988 to 1997 and from 2005 to 2016. Combined with Figure 4, we can see that from 1978 to 1981, terrorist hotspots were not obvious compared to the other two periods, which were mainly located in Thailand and Myanmar. During the period 1988–1997, the frequency of terrorist attacks increased, and the hotspots of the terrorist attacks were mainly distributed in Myanmar, Thailand and Cambodia, which formed three major hotspots around Yangon, Bangkok, Phnom Penh and their surrounding areas. In addition, western Cambodia, and the border between Thailand and Myanmar were also hotspots. From 2005 to 2016, the frequency of terrorist attacks on the Indochina peninsula increased significantly, especially in Thailand. The spatial distribution of terrorist attacks changed significantly over time. In Cambodia, the number of terrorist attacks decreased significantly, and the areas around Phnom Penh are no longer hotspots for terrorist attacks. In Thailand, southern provinces, which border with Malaysia, have become new hotspots for terrorist attacks. Meanwhile, the number of terrorist attacks in Bangkok continues to increase and expand to its surrounding regions. In Myanmar, Yangon was still a hot spot for terrorist attacks. In addition, hotspots in the northern part of the country gradually began to appear.

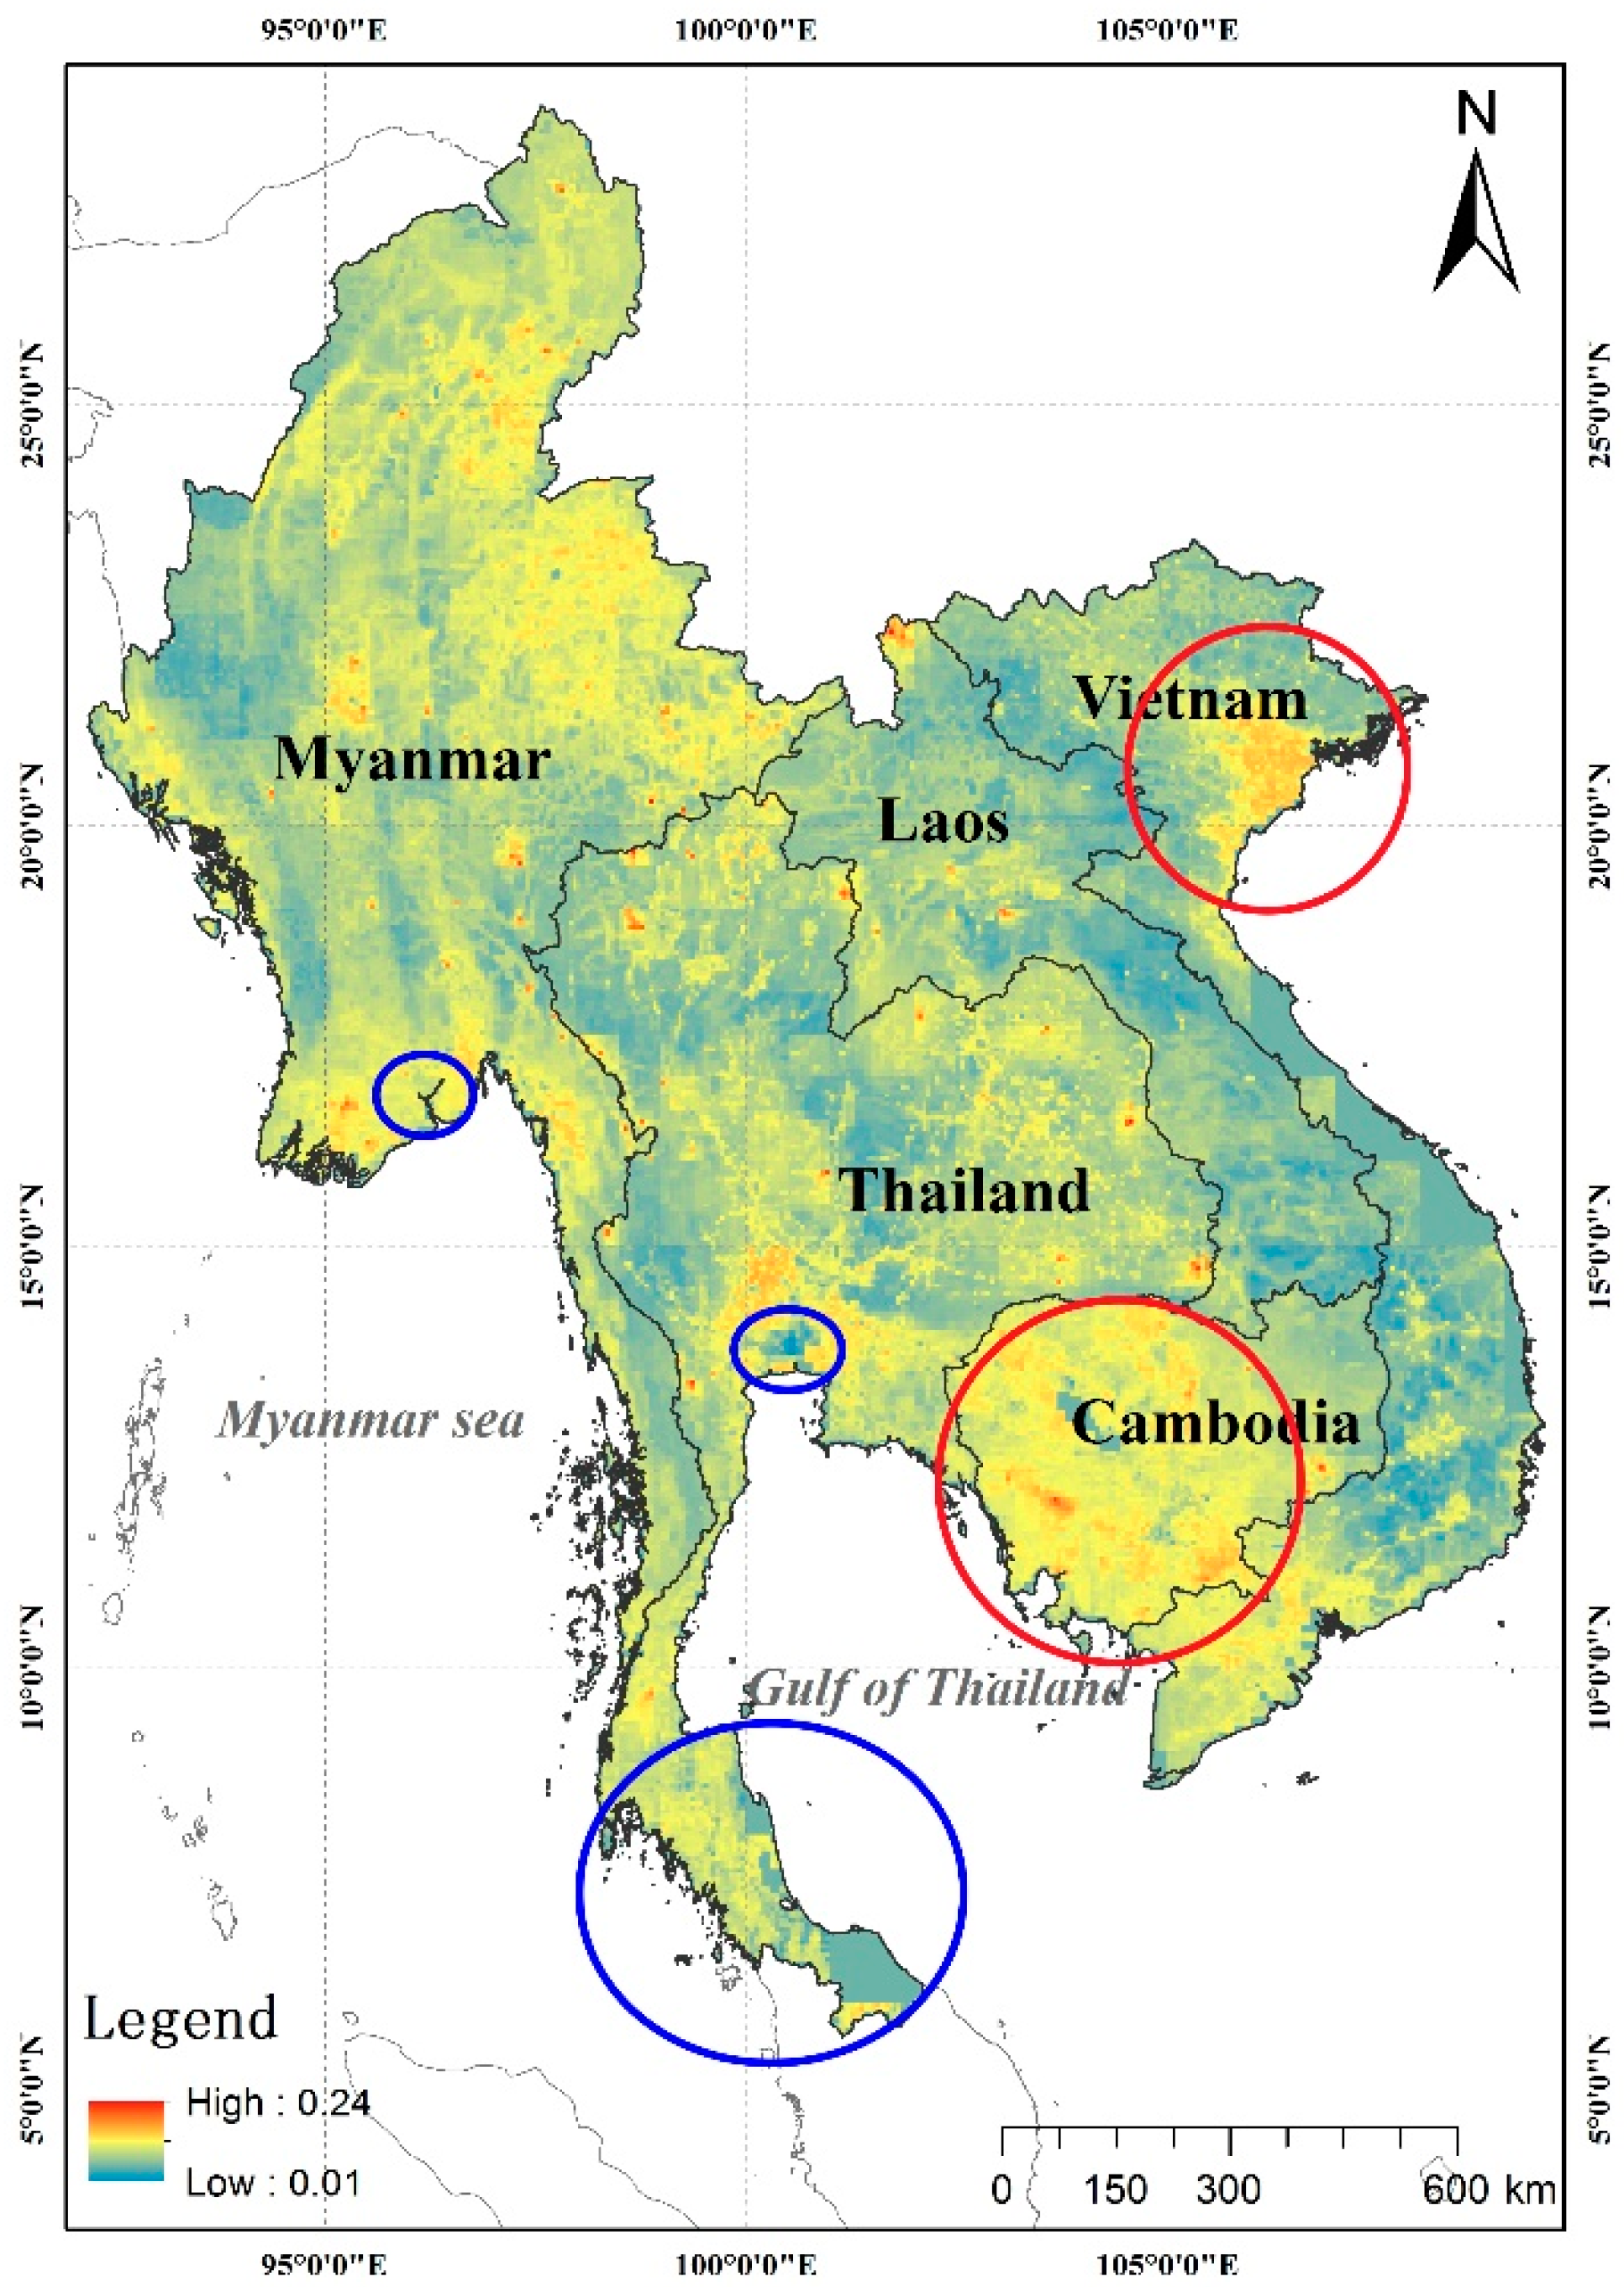
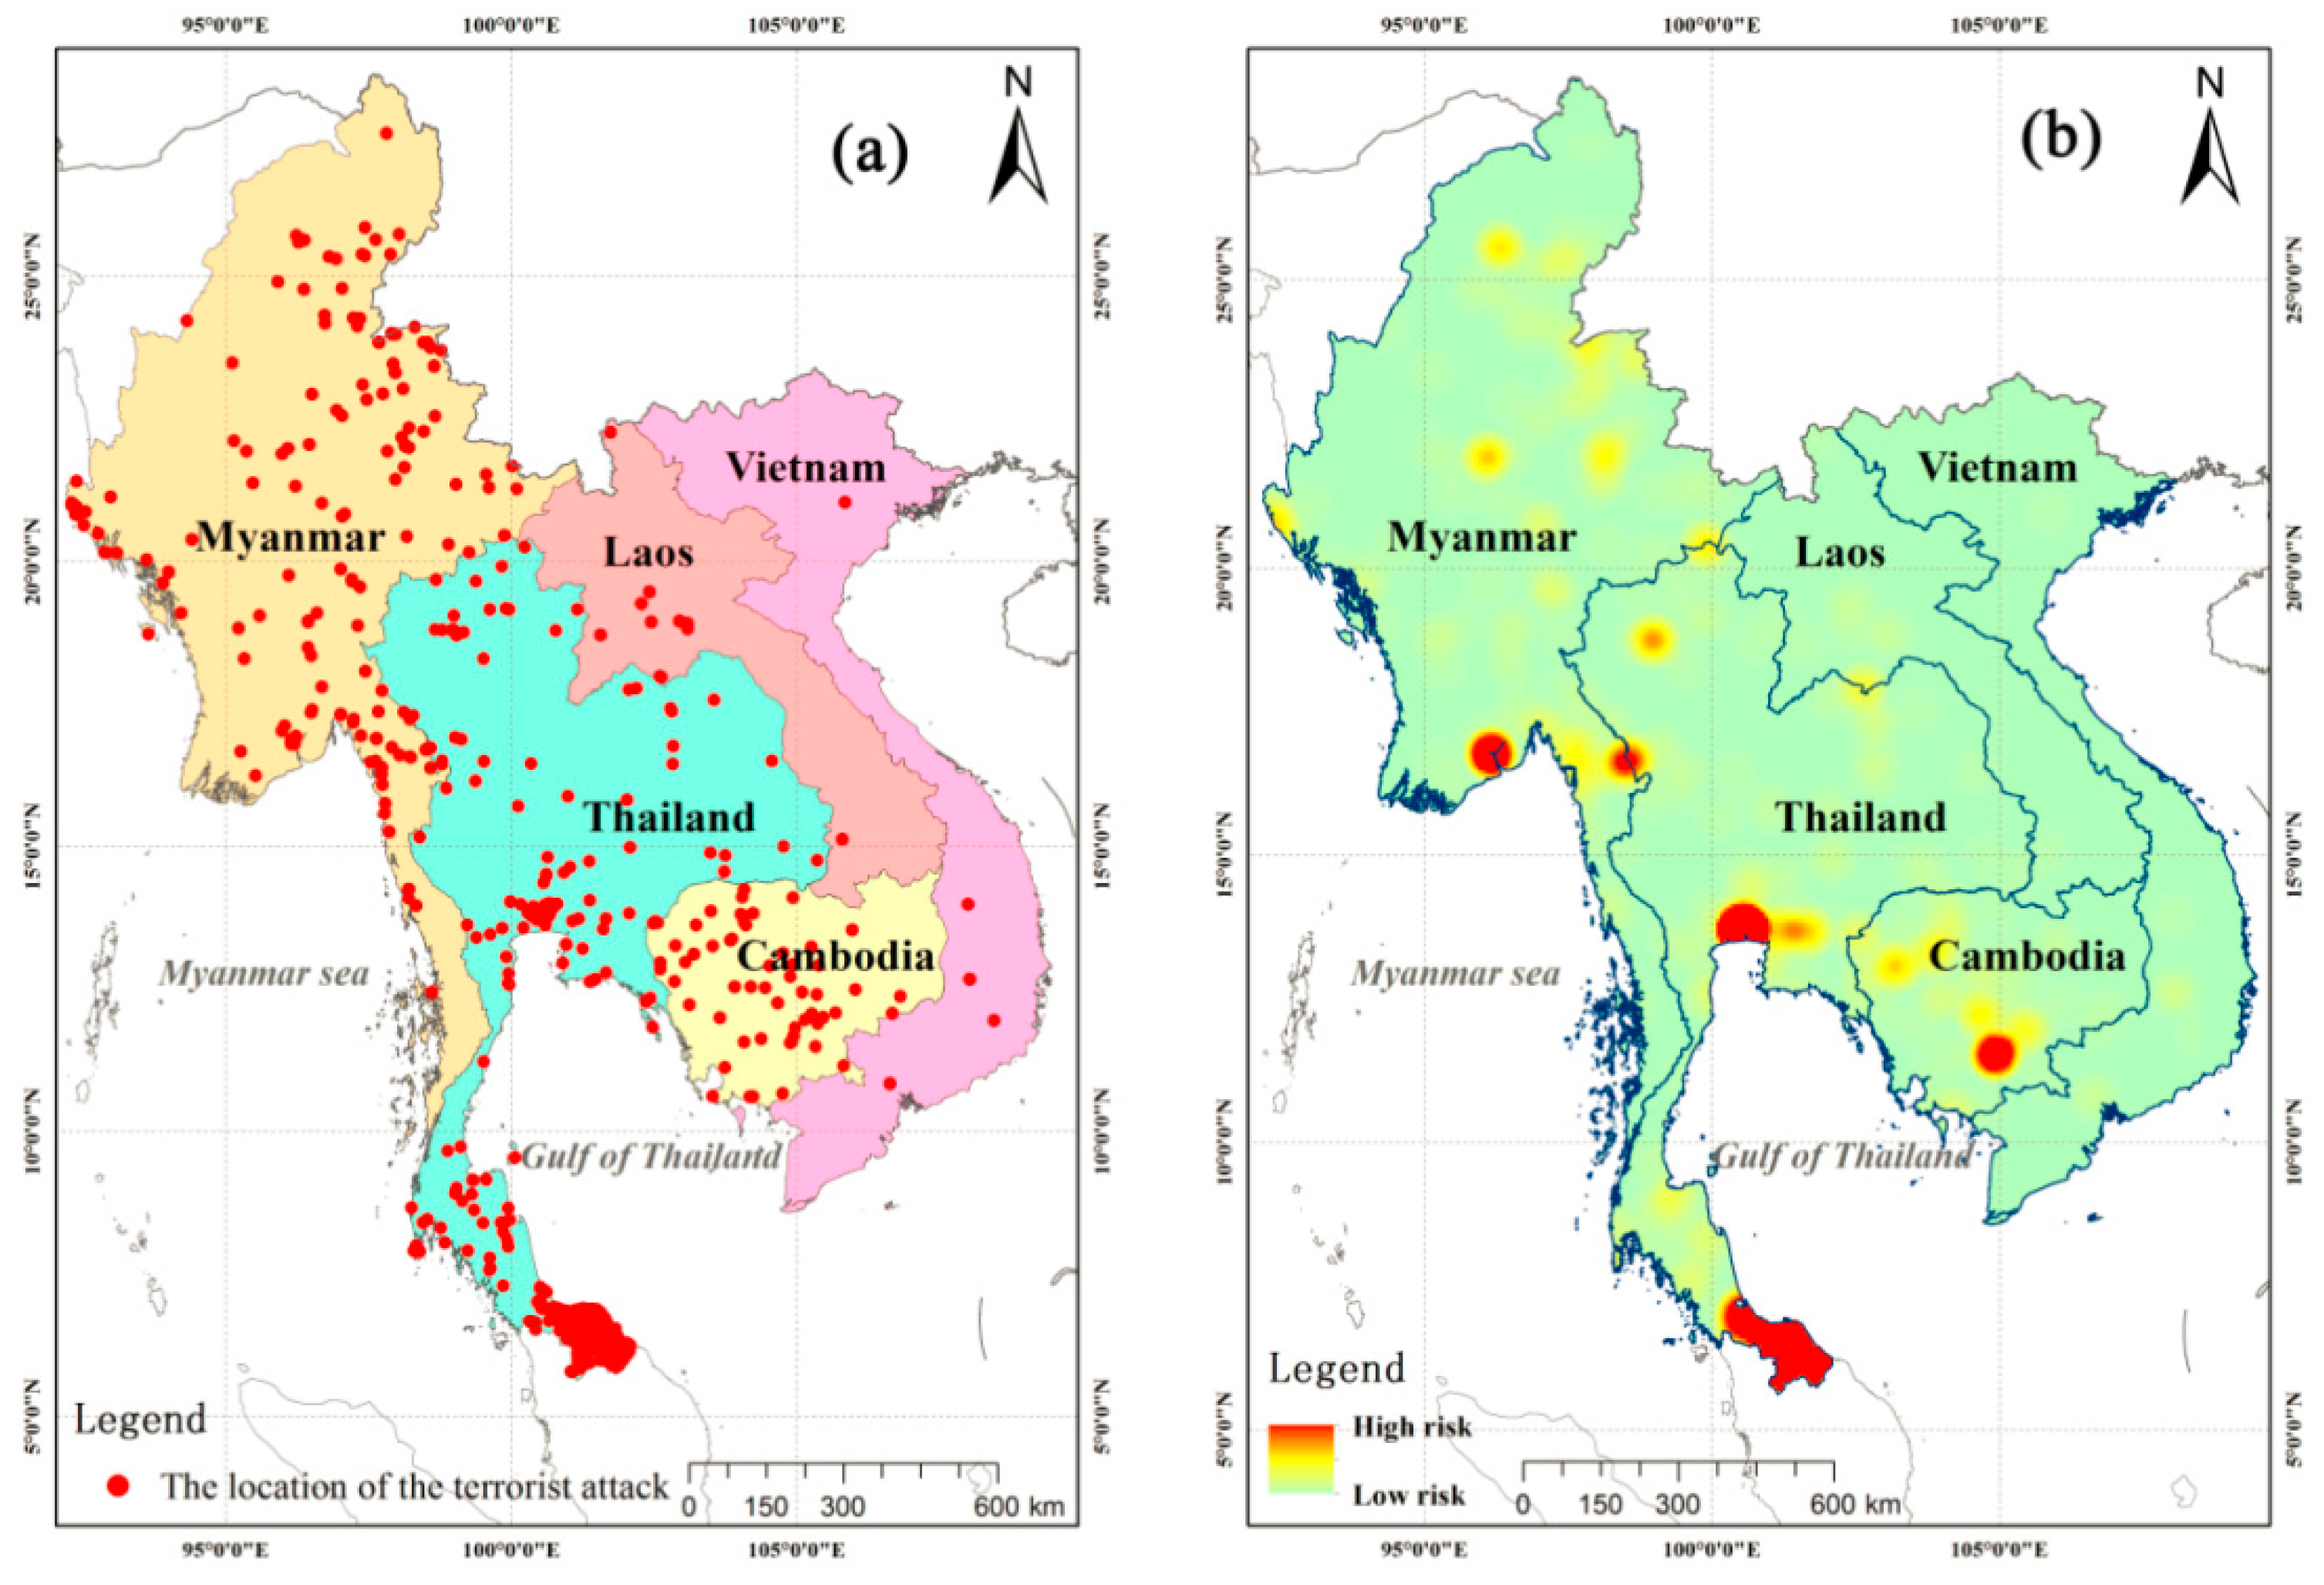
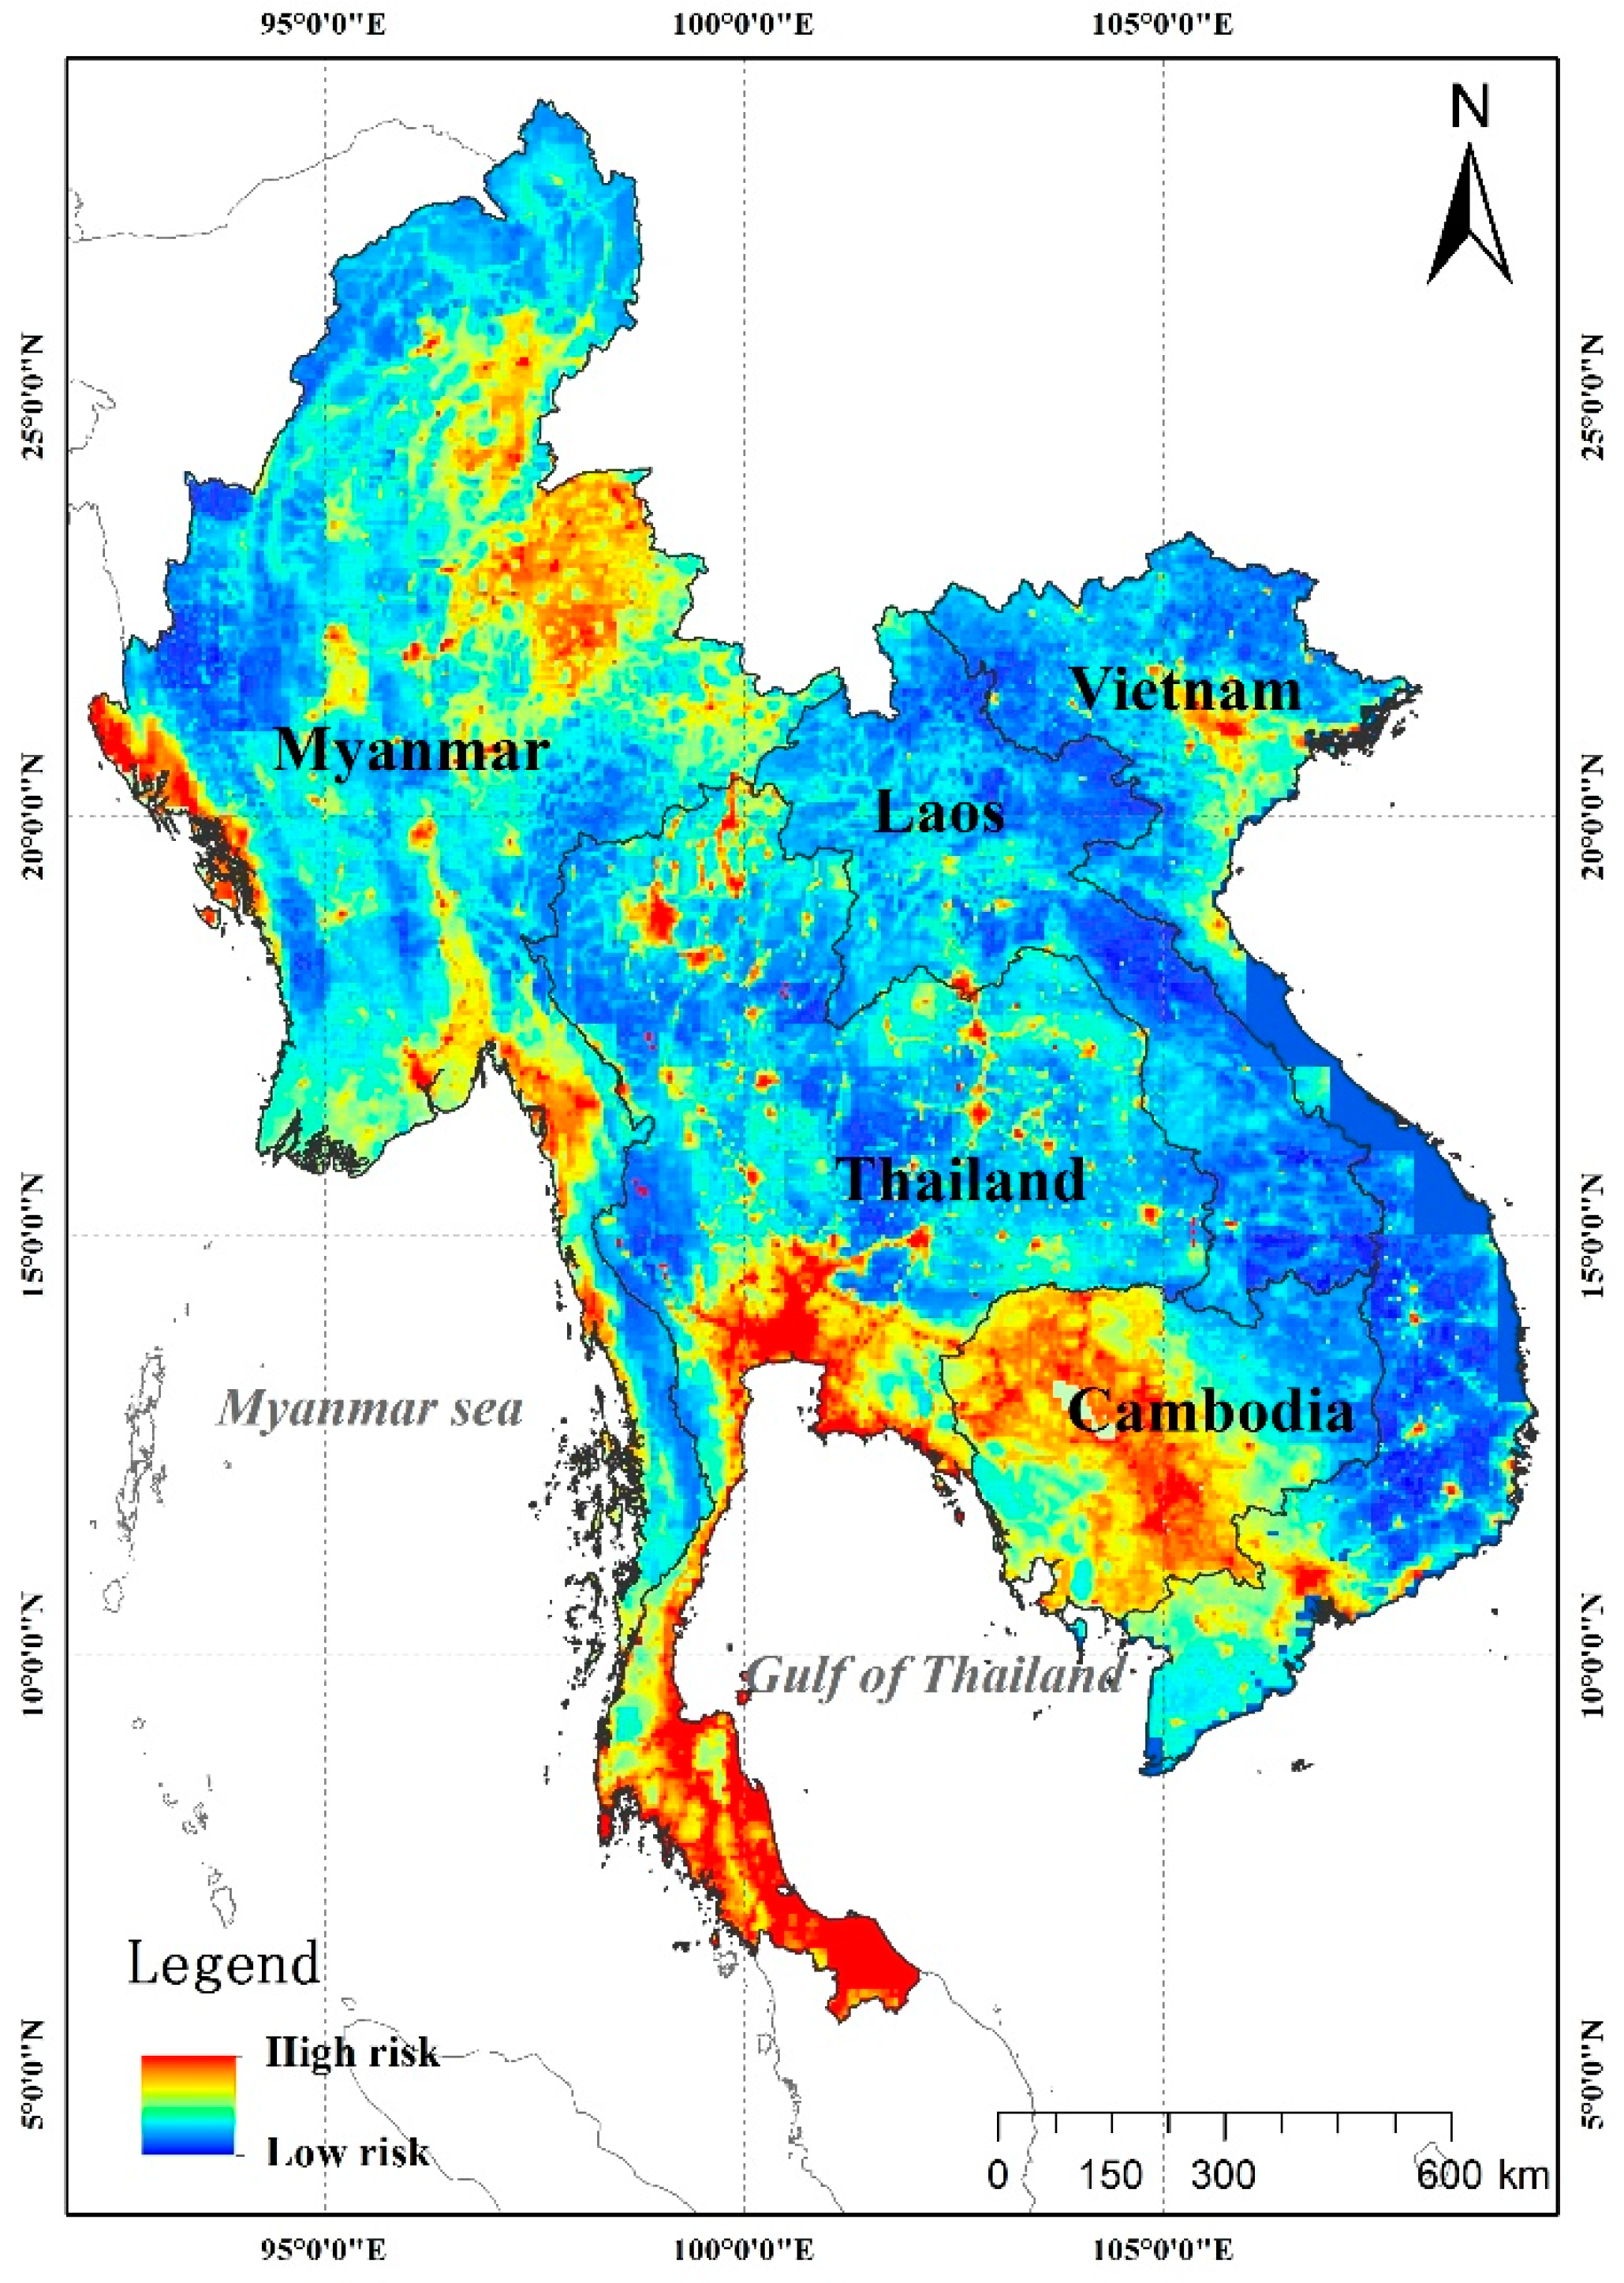
3.2. Predicting Potential Risk Areas for Terrorist Attacks in Indochina Peninsula

To simulate the risk of terrorist attacks on the Indochina Peninsula, the RF model was used with 15 factors; 730 pixels which include 365 occurrence pixels and 365 non-occurrence pixels were chosen to build the RF model. To train and verify the performance of RF model, 75% of the sample points (548) were randomly selected as training data, and the remaining points (182) were used as the validation data. The potential risk area distribution of terrorist attacks is shown in Figure 5.
Figure 5 shows that there are obvious geographical differences in the risk of terrorist attack on the Indochina Peninsula. Thailand is a high-risk area for terrorist attacks, especially in the southern part of Thailand, which is bordered by Malaysia. In addition, northern Thailand, Bangkok and its surrounding cities are also high-risk areas. Therefore, the Thai government should strengthen efforts to combat terrorist attacks in these areas. In Cambodia, a belt running from northwest to southeast is a high-risk area for terrorist attacks. Most regions of Laos and Vietnam are low-risk areas for terrorist attacks, except for northern Laos, southern Vietnam and northeast Vietnam. In Myanmar, the risk of terrorist attacks in the northern and southern regions is higher than that in the central regions. However, in the central region, there are sporadic high-risk areas. Overall, most regions of the Indochina Peninsula are low-risk areas for terrorist attacks. High-risk areas are mainly located at the junction of the two countries.
In this study, 10-fold cross-validation method was used at avoiding over-fitting. During the training process, the RF model obtained high performances with 10-fold cross validation values of 0.837 (95% confidence interval of 0.834–0.84). In addition, the fitted RF model also achieved AUC values of 0.839 (95% confidence interval of 0.833–0.844) when the model was applied to validation samples.

4. Discussion

4.1. Uncertainty Analysis

To analyse the influence of samples on model prediction, uncertainty was generated based on standard deviation values calculated for each 0.05×0.05-degree unit. Figure 6 was produced based on 100 prediction results, which shows that the uncertainty around the terrorist attack risk ranges from 0.01 to 0.24.
Figure 6 shows that the uncertainty of the prediction result was low. The relatively high uncertainty was in the high-risk areas of Cambodia and Vietnam (the areas circled in red in Figure 6). The uncertainty of high-risk areas in Thailand and Myanmar (the areas circled in blue in Figure 6) were relatively low. This shows that Thailand and Myanmar governments should strengthen their prevention efforts compared with that of Cambodia and Vietnam.

4.2. Feature Analysis

Based on the “caret” package installed in R language, the importance of each feature was measured. The result revealed that urban accessibility has the highest contribution to results, with a value of 13.19%, followed by topography (9.49%), average precipitation (8.41%), night-time light (8.26%), distance to a major navigable river (8.24%), distance to a major navigable lake (8.19%), population density (8.15%), and average temperature (8.03%). The overall contribution of the remaining drivers is 28.04%.
The Fragile States Index (FSI) has little effect on the simulation results, because it has national-scale data, and the FSI value of each country on the Indochina Peninsula is similar. From these data, we can see that socioeconomic differences, population distribution and resource status are more important factors for terrorist attacks on the Indochina Peninsula.

4.3. Comparison with Related Research

Recent years have seen the emergence of a series of articles that attempt to predict future conflicts. Compared with relevant studies, we have the following two innovations: (1) we adopted as many driving factors as possible and (2) the simulation was carried out on a spatial scale of 5×5 km. Some of the current research is predicated solely on the terrorist attack data itself and does not consider the drivers of terrorist attacks [21,22,23]. Dong predicted the terrorist attacks in 2010–2016 in India while only considering economic factors, which include the prices, interest rates, tourism, and unemployment, etc. [24]. Hartman et al. predicted the 2010 local violence in Liberia using 2008 data and four features, including social stability, ethnic diversity, regional characteristics and government ability [25]. In addition, the above studies were conducted at the national scale. Weidmann and Ward generated predictions at the municipal level for the conflict in Bosnia by only considering the population, ethnic composition, border locations and elevation [26]. In this study, 15 driving factors, covering society, nature and geography, were adopted.
There are few studies on the risk of terrorist attacks on the Indochina Peninsula. The Institute for Economics & Peace produced maps of the Global Terrorism Index since 2012. The results show that the terrorism indexes of Thailand and Myanmar were on the rise. Little has changed in the remaining countries [56]. Conlon pointed that southern Thailand is the hotspot of violence in Thailand [57]. The results in this study are consistent with those of the macro level analyses, and this article provides hotspots of terrorist attacks on a more fine-grained geographical unit.

4.4. Limitation Analysis

In this study, although we have added as many drivers as possible to the model compared with that of other research, there are limitations to simulating a terrorist attack. Due to the difficulty in obtaining some elements, they cannot be loaded into the model for simulation, which leads to the uncertainty of simulation results. In addition, the simulation is only carried out on the spatial scale, without considering the impact on the time scale. Different terrorist attacks are related to each other on the time scale. If the time scale is considered, the study can only be carried out at the national scale, because the number of terrorist attacks that occurred in the pixel is discontinuous at the time scale, and there is no long time series driving factors data for terrorist attacks on corresponding pixels. This represents a bottleneck for the current state of conflict prediction. How to couple the time and space scales is a difficult problem that needs to be solved.

5. Conclusions

In this study, the machine learning algorithm was coupled with a geo-information system to simulate the risk distribution of terrorist attacks at the pixel scale. Before the simulation, a spatio-temporal variation of terrorist attacks on the Indochina Peninsula was analysed by using the kernel density method. It was found that there are three peaks in the number of terrorist attacks on the Indochina Peninsula for the time series: 1978–1981, 1988–1997, and 2005–2016. There are five hotspots on the Indochina Peninsula with the spatial distribution: Yangon, Phnom Penh and its surrounding cities, Karen State and Tak, and four neighbouring provinces in Thailand bordering Malaysia, Bangkok and its nearby cities.
To simulate the risk distribution of terrorist attacks at the pixel scale, 15 driving factors were prepared at the spatial scale. In addition, the machine learning method was built at the spatial scale coupled with the geo-information system to simulate the risk distribution with the geospatial dataset and terrorist attacks events dataset. The potential terrorist attacks risk areas indicate that Thailand is the most dangerous area for terrorist attacks, especially in southern Thailand, Bangkok and its surrounding cities. The middle of Cambodia and northern and southern parts of Myanmar are also high-risk areas. Other areas are relatively low risk. This study provides hotspots of terrorist attacks on a more fine-grained geographical unit. In addition, it shows that the Geo-Information System can be used well in the simulation of terrorist attacks. The results of this study provide some valuable references for the early prevention and emergency disposal of terrorist attacks. First, defence and safeguards must be strengthened for important areas, such as landmark buildings, government agencies and large shopping malls, which all become easy targets for terrorists and are thus vulnerable to terrorism attacks. Second, manpower and material resources could be reasonably allocated based on the ranks of terrorist risks to respond quickly after the attack has happened, thereby minimizing the loss of life and property.

Author Contributions

Mengmeng Hao and Dong Jiang conceived and designed the study; Mengmeng Hao, Fangyu Ding and Jingying Fu analyzed the data; Fangyu Ding, Jingying Fu and Shuai Chen contributed materials and analysis tools; and Mengmeng Hao wrote the paper.

Funding

The paper was funded by Chinese Academy of Sciences (Grant No.KGFZD-135-17-009 and Grant No. ZDRW-ZS-2016-6).

Conflicts of Interest

The authors declare no conflict of interest.

References

  1. Schleussner, C.F.; Donges, J.F.; Donner, R.V.; Schellnhuber, H.J. Armed-conflict risks enhanced by climate-related disasters in ethnically fractionalized countries. Proc. Natl. Acad. Sci. USA 2016, 113, 9216–9221. [Google Scholar] [CrossRef] [PubMed] [Green Version]
  2. Barnes, V.A.; Treiber, F.A.; Ludwig, D.A. African-American adolescents’ stress responses after the 9/11/01 terrorist attacks. J. Adolesc. Health 2005, 36, 201–207. [Google Scholar] [CrossRef] [PubMed] [Green Version]
  3. Martens, A.; Sainudiin, R.; Sibley, C.G.; Schimel, J.; Webber, D. Terrorist attacks escalate in frequency and fatalities preceding highly lethal attacks. PLoS ONE 2014, 9, e93732. [Google Scholar] [CrossRef] [PubMed]
  4. START. Global Terrorism Database. 2016. Available online: https://www.start.umd.edu/gtd (accessed on 7 June 2018).
  5. Swahn, M.H.; Mahendra, R.R.; Paulozzi, L.J.; Winston, R.L.; Shelley, G.A.; Taliano, J.; Frazier, L.; Saul, J.R. Violent attacks on Middle Easterners in the United States during the month following the September 11, 2001 terrorist attacks. Inj. Prev. J. Int. Soc. Child Adolesc. Inj. Prev. 2003, 9, 187. [Google Scholar] [CrossRef]
  6. Li, Z.; Sun, D.; Chen, H.; Huang, S.Y. Identifying the socio-spatial dynamics of terrorist attacks in the Middle East. In Proceedings of the 2016 IEEE Conference on Intelligence and Security Informatics (ISI), Tucson, AZ, USA, 28–30 September 2016. [Google Scholar]
  7. Kang, W.; Julak, L.; Yongtae, C. Attack Patterns and Trajectories of Terrorist Groups in East and South Asia. Korean J. Def. Anal. 2014, 26, 209–224. [Google Scholar]
  8. Jones, S. Briefing for the New President: The Terrorist Threat in Indonesia and Southeast Asia. Ann. Am. Acad. Political Soc. Sci. 2008, 618, 69–78. [Google Scholar] [CrossRef]
  9. Febrica, S. Securitizing Terrorism in Southeast Asia: Accounting for the Varying Responses of Singapore and Indonesia. Asian Surv. 2010, 50, 569–590. [Google Scholar] [CrossRef]
  10. Gunaratna, R. Terrorism in South-East Asia. Available online: https://www.researchgate.net/publication/266355761_Terrorism_in_South-East_Asia (accessed on 12 July 2018).
  11. Bertram, S. Sub Saharan African Terrorist Groups’ use of the Internet. Discret. Math. Appl. 2014, 5, 1167–1175. [Google Scholar] [CrossRef]
  12. Price, G.; Elu, J. Do Remittances Finance Terrorism in Sub-Saharan Africa? Social Science Electronic Publishing: Rochester, NY, USA, 2011. [Google Scholar]
  13. Shiraishi, M. East-West Economic Corridor: Lao Bao—Dansavanh Border; Palgrave Macmillan: Hampshire, UK, 2013. [Google Scholar]
  14. Mandel, D.R. Are risk assessments of a terrorist attack coherent? J. Exp. Psychol. Appl. 2005, 11, 277–288. [Google Scholar] [CrossRef] [PubMed]
  15. Braithwaite, A.; Li, Q. Transnational Terrorism Hot Spots: Identification and Impact Evaluation. Confl. Manag. Peace Sci. 2007, 24, 281–296. [Google Scholar] [CrossRef]
  16. Guo, D. Early Detection of Terrorism Outbreaks Using Prospective Space–Time Scan Statistics. Prof. Geogr. 2013, 65, 676–691. [Google Scholar] [CrossRef]
  17. Li, S.; Zhuang, J.; Shen, S. Dynamic forecasting conditional probability of bombing attacks based on time-series and intervention analysis. Risk Anal. 2016, 37, 1287–1297. [Google Scholar] [CrossRef] [PubMed]
  18. Sachan, A.; Roy, D. TGPM: Terrorist Group Prediction Model for Counter Terrorism. Int. J. Comput. Appl. 2012, 44, 49–52. [Google Scholar] [CrossRef]
  19. Cederman, L.E.; Weidmann, N.B. Predicting armed conflict: Time to adjust our expectations? Science 2017, 355, 474. [Google Scholar] [CrossRef] [PubMed]
  20. Mo, H.; Meng, X.; Li, J.; Zhao, S. Terrorist event prediction based on revealing data. In Proceedings of the 2017 IEEE 2nd International Conference on Big Data Analysis (ICBDA), Beijing, China, 10–12 March 2017. [Google Scholar]
  21. Zhou, B.; Shi, A.; Cai, F.; Zhang, Y. Wavelet Neural Networks for Nonlinear Time Series Analysis. Int. J. Knowl. Manag. 2004, 10, 430–435. [Google Scholar]
  22. Muhammad, H.; Kazi, H. Use of Predictive Modeling for Prediction of Future Terrorist Attacks in Pakistan. Int. J. Comput. Appl. 2016, 179, 8–16. [Google Scholar] [CrossRef]
  23. Brandt, P.; Freeman, J.R.; Schrodt, P.A. Real Time, Time Series Forecasting of Inter- and Intra-State Political Conflict. Confl. Manag. Peace Sci. 2011, 28, 41–63. [Google Scholar] [CrossRef]
  24. Dong, Q. Machine Learning and Conflict Prediction: A Cross-Disciplinary Approach. World Econ. Politics 2017, 2, 56. [Google Scholar]
  25. Hartman, A.; Blair, R.; Blattman, C. Predicting Local Violence: Evidence from a Panel Survey in Liberia. Soc. Sci. Electron. Publ. 2017, 54, 298–312. [Google Scholar]
  26. Weidmann, N.B.; Ward, M.D. Predicting Conflict in Space and Time. J. Confl. Resolut. 2010, 54, 883–900. [Google Scholar] [CrossRef]
  27. Ding, F.; Ge, Q.; Jiang, D.; Fu, J.; Hao, M. Understanding the dynamics of terrorism events with multiple-discipline datasets and machine learning approach. PLoS ONE 2017, 12, e0179057. [Google Scholar] [CrossRef] [PubMed]
  28. Scheffran, J.; Brzoska, M.; Kominek, J.; Link, P.M.; Schilling, J. Climate change and violent conflict. Science 2012, 336, 869–871. [Google Scholar] [CrossRef] [PubMed]
  29. Hauge, W.; Ellingsen, T. Beyond Environmental Scarcity: Causal Pathways to Conflict. J. Peace Res. 1998, 35, 299–317. [Google Scholar] [CrossRef]
  30. Binningsbø, H.M.; Soysa, I.D.; Gleditsch, N.P. Green giant or straw man? Environmental pressure and civil conflict, 1961–1999. Popul. Environ. 2007, 28, 337–353. [Google Scholar] [CrossRef]
  31. Buhaug, H.; Rød, J.K. Local Determinants of African Civil Wars 1970–2001. Political Geogr. 2006, 25, 315–335. [Google Scholar] [CrossRef]
  32. Urdal, H. People vs. Malthus: Population Pressure, Environmental Degradation, and Armed Conflict Revisited. J. Peace Res. 2005, 42, 417–434. [Google Scholar] [CrossRef]
  33. Raleigh, C.; Urdal, H. Climate change, environmental degradation and armed conflict. Political Geogr. 2007, 26, 674–694. [Google Scholar] [CrossRef]
  34. Hendrix, C.S.; Glaser, S.M. Trends and Triggers: Climate Change and Civil Conflict in Sub-Saharan Africa. Political Geogr. 2007, 26, 695–715. [Google Scholar] [CrossRef]
  35. Theisen, O.M. Blood and Soil? Resource Scarcity and Internal Armed Conflict Revisited. J. Peace Res. 2008, 45, 801–818. [Google Scholar] [CrossRef]
  36. Lujala, P. The spoils of nature: Armed civil conflict and rebel access to natural resources. J. Peace Res. 2010, 47, 15–28. [Google Scholar] [CrossRef]
  37. Gizelis, T.I.; Wooden, A.E. Water resources, institutions, & intrastate conflict. Political Geogr. 2010, 29, 444–453. [Google Scholar]
  38. Østby, G.; Urdal, H.; Tadjoeddin, M.Z.; Murshed, S.M.; Strand, H. Population Pressure, Horizontal Inequality and Political Violence: A Disaggregated Study of Indonesian Provinces, 1990–2003. J. Dev. Stud. 2011, 47, 377–398. [Google Scholar] [CrossRef]
  39. Sekhri, S.; Storeygard, A. Dowry Deaths: Consumption Smoothing in Response to Climate Variability in India. Va. Econ. Online Papers 2012, 407, 131. [Google Scholar]
  40. Mares, D. Climate change and crime: Monthly temperature and precipitation anomalies and crime rates in St. Louis, MO 1990–2009. Crime Law Soc. Chang. 2013, 59, 185–208. [Google Scholar] [CrossRef]
  41. Blakeslee, D.S.; Fishman, R. Rainfall Shocks and Property Crimes in Agrarian Societies: Evidence from India; Social Science Electronic Publishing: Rochester, NY, USA, 2013. [Google Scholar]
  42. Kawsar, R. Spatio-Temporal Analyses of the Relationship between Armed Conflict and Climate Change in the Eastern Africa. Master’s Thesis, Westfälische Wilhelms-Universität, Münster, Germany, 28 February 2013. [Google Scholar]
  43. Hsiang, S.M.; Marshall, B.; Edward, M. Quantifying the influence of climate on human conflict. Science 2013, 341, 1212. [Google Scholar] [CrossRef] [PubMed]
  44. Linke, A.M.; Witmer, F.D.W.; Holland, E.C.; O’Loughlin, J. Mountainous Terrain and Civil Wars: Geospatial Analysis of Conflict Dynamics in the Post-Soviet Caucasus. Ann. Assoc. Am. Geogr. 2016, 107, 520–535. [Google Scholar] [CrossRef]
  45. Brochmann, M.; Hensel, P.R. Peaceful Management of International River Claims. Int. Negot. 2009, 14, 393–418. [Google Scholar] [CrossRef] [Green Version]
  46. Yue, H. Development trend of geopolitics on Indochina Peninsula. Soc. Sci. Yunnan 2008, 2, 27–30. [Google Scholar]
  47. Wimmer, A.; Cederman, L.-E.; Min, B. Ethnic Politics and Armed Conflict: A Configurational Analysis of a New Global Data Set. Am. Sociol. Rev. 2009, 74, 316–337. [Google Scholar] [CrossRef] [Green Version]
  48. Manuel, C.; Torres, M.R.; Ramon, H.; Fowler, J.H. Violent extremist group ecologies under stress. Sci. Rep. 2013, 3, 1544. [Google Scholar]
  49. Sheather, S.J.; Jones, M.C. A Reliable Data-Based Bandwidth Selection Method for Kernel Density Estimation. J. R. Stat. Soc. 1991, 53, 683–690. [Google Scholar] [CrossRef]
  50. Silverman, B.W. Density Estimation for Statistics and Data Analysis; Chapman and Hall: London, UK, 1986. [Google Scholar]
  51. Dehnad, K. Density Estimation for Statistics and Data Analysis. Technometrics 1986, 29, 495. [Google Scholar] [CrossRef]
  52. Breiman, L. Random Forest. Mach. Learn. 2001, 45, 5–32. [Google Scholar] [CrossRef]
  53. Parmar, C.; Grossmann, P.; Bussink, J.; Lambin, P.; Aerts, H.J.W.L. Machine Learning methods for Quantitative Radiomic Biomarkers. Sci. Rep. 2015, 5, 13087. [Google Scholar] [CrossRef] [PubMed] [Green Version]
  54. Palmer, D.; O’Boyle, N.M.; Glen, R.; Mitchell, J.B.O. Random Forest Models To Predict Aqueous Solubility. J. Chem. Inf. Model. 2007, 47, 150. [Google Scholar] [CrossRef] [PubMed]
  55. Vincenzi, S.; Zucchetta, M.; Franzoi, P.; Pellizzato, M.; Pranovi, F.; Leo, G.A.D.; Torricelli, P. Application of a Random Forest algorithm to predict spatial distribution of the potential yield of Ruditapes philippinarum in the Venice lagoon, Italy. Ecol. Model. 2011, 222, 1471–1478. [Google Scholar] [CrossRef]
  56. Hyslop, D.; Morgan, T. Measuring Terrorism with the Global Terrorism Index. Contrib. Confl. Manag. Peace Econ. Dev. 2014, 22, 97–114. [Google Scholar]
  57. Conlon, K.T. Ethnic Violence in Southern Thailand: The Anomaly of Satun; Monterey California Naval Postgraduate School: Monterey, CA, USA, 2012. [Google Scholar]
Figure 1. The system architecture that is used for predicting terrorist attacks. The figure shows how to use the RF model to simulate a terrorist attack. Multiple element types were introduced into an RF classifier that was used to predict potential terrorist threats. Therefore, data preparation, which was mainly done by using ArcGIS software, was very important. The C++, R (https://www.r-project.org/) and ArcGIS were used to achieve the RF algorithm.
Ijgi 08 00133 g001
Figure 2. The spatial distribution (a) and hotspots (b) of terrorist attacks on the Indochina Peninsula. Figure 2a was obtained through location information of terrorist attacks using ArcGIS software (http://www.esri.com/sofware/arcgis). It reflects the distribution of terrorist attacks from a spatial perspective. Figure 2b was obtained by using the “Kernel Density” tool in ArcGIS software. The value of legend is from 1 to 4577. To increase the legibility of the figure, we replaced 0 and 4577 with low risk and high risk, respectively. It reflects the frequency of terrorist attacks in the same place from a time perspective.
Ijgi 08 00133 g002
Figure 3. The frequency of terrorist attacks in each country. OriginLab was used for drawing (https://www.originlab.com/). Overall, there are three peaks on the Indochina Peninsula.
Ijgi 08 00133 g003
Figure 4. The spatial changes in the hotspots of the terrorist attacks on the Indochina Peninsula in three peaks. The figure was obtained by the “Kernel Density” tool in ArcGIS software. The original values of the legend in panels (ac) were different. These three pictures were drawn with a unified standard of the legend to increase the legibility. It reflects the spatial migration of terrorist attacks in different periods.
Ijgi 08 00133 g004
Figure 5. The spatial distribution of potential terrorist attack risk. The value of the result ranges from 0 to 1, which reflects the risk of terrorist attack. The legend was represented by the low risk and high risk. The red zone indicates high risk of a terrorist attack, while the blue area indicates low risk of a terrorist attack.
Ijgi 08 00133 g005
Figure 6. Quantification of the uncertainty of machine learning model in predicting terrorist attack risk.
Ijgi 08 00133 g006
Table 1. Research on the driving factors of terrorist attacks.
ReferencesStudy Area and Time SpanThe Model or MethodThe Main Findings
The social elements
Hauge and Ellingsen [29]Global; 1980–1992LogitPopulation growth, water scarcity and deforestation all increase the probability of conflicts. Economic and political influences on conflicts outweigh other factors.
Binningsbø et al. [30]Global; 1961–1999LogitConsumption reduces the risk of conflicts.
Buhaug and Rød [31]Africa; 1970–2001LogitPopulation density has an impact on internal conflicts.
Urdal [32]Global; 1950–2000LogitPopulation pressure and land pressure will increase the probability of conflicts.
Raleigh and Urdal [33]Global; 1990–2004LogitThe interaction of factors such as population density increase; soil degradation and water shortage will increase the risk of conflicts, but the impact will be small in underdeveloped countries.
The natural elements
Hendrix and Glaser [34]Sub-Saharan Africa; 1981–1999LogitDrought increases conflicts risk.
Theisen [35]Global; 1979–2001LogitLand degradation increases risk; water shortages and drought have an impact on conflicts.
Lujala [36]Global; 1946–2003Kaplan–Meier Survival EstimatesNatural resources have an impact on the duration of conflicts. When armed conflicts occur in resource-rich areas, the duration of conflict will be doubled.
Gizelis and Wooden [37]98 countries; 1981–2000Simultaneous equation modelWater shortages increase the risk of conflicts.
Østby et al. [38]Indonesia; 1990–2003LogitThere is a negative correlation between land resources and conflicts.
Sekhri and Storeygard [39]India; 2002–2007Regression analysisLess rain will increase violence in the country.
Mares [40]The United States; 1990–2009Regression analysisTemperature anomalies increase the frequency of conflicts.
Blakeslee and Fishman [41]India; 1971–2000Parallel regressions and Poisson regressionAbnormal rainfall increases violence and crime.
Kawsar [42]East Africa; 1991–2000Point process models and Spatial Autoregressive (SAR)Climate change increases the risk of armed conflict.
Schleussner et al. [1]Global; 1980–2010ECAClimate change, especially climate-related natural disasters, increases the risk of conflict in ethnically divided countries.
Scheffran et al. [28]-----Perspective in “Science”Climate variability may have been more associated with low-level violence.
Hsiang et al. [43]-------Rsearch article summary in “Sciences”There is a clear link between climate and conflict.
The geographical elements
Linke el al. [44]Caucasus;
1990–2012
Spatial analysisTopography can influence conflict behaviour.
Brochmann and Hensel [45]Americas, Western Europe, and the Middle East;
1900–2001
ProbitConflicts over shared river systems have been associated with low-level violence.
Table 2. The feature selected in this study.
FeatureSourcePublisherThe Meaning of the Feature
The social elements
Fragile States IndexGlobal Fragile States Index The Fund for Peace
(http://www.fundforpeace.org/fsi/)
The index aims to assess states’ vulnerability to conflict or collapse.
Ethnic distribution GeoEPR, the Ethnic Power Relations dataset Center for Comparative and International Studies (CIS), International Conflict Research
(https://icr.ethz.ch/data/epr/geoepr/)
The GeoEPR dataset provides geo-spatial information about every politically relevant ethnic group. It includes a coding of type of ethnic marker distinguishing group members based on religion, language, race, etc. It reflects ethnic distribution and religious background [47].
Major drug regionsWorld drug reportDivision for Policy Analysis and Public Affairs, United Nations Office on Drugs and Crime
(https://www.unov.org/unov/en/unodc.html)
These data reflect the degree of social stability.
Population densityAdjusted population density, V4.10NASA Socioeconomic Data and Applications Center (SEDAC)
(https://neo.sci.gsfc.nasa.gov/view.php?datasetId=SEDAC_POP)
These data reflect the degree of population concentration and the pressure of population on land.
Night-time lightVersion 4 DMSP-OLS night-time lights time series The Earth Observation Group, NOAA
(http://ngdc.noaa.gov/eog/index.html)
The night-time light data reflects the region’s economic development.
The natural elements
Average precipitationG-Econ 4.0Yale University
(http://gecon.yale.edu/)
These data reflect spatial differences in climate (precipitation and temperature).
Average temperature
Temperature anomaly Land surface temperature anomaly NASA Earth Observations (NEO)
(https://earthobservatory.nasa.gov/global-maps/MOD_LSTAD_M)
These data can reflect weather anomalies.
Drought indexDrought index of the world Numerical Terradynamic Simulation Group, University of Montana (http://files.ntsg.umt.edu/) It can reflect the drought conditions in the region, and it can also reflect abnormal precipitation.
Multi-hazard frequency Global Multi-hazard Frequency and Distribution, v1NASA Socioeconomic Data and Applications Center (SEDAC)
(http://sedac.ciesin.columbia.edu/data/set/ndh-multihazard-frequency-distribution)
These data provide insight into the frequency and distribution of multi-hazard events, which include cyclones, droughts, earthquakes, floods, landslides, and volcanoes.
The geographical elements
topographyASTER Global DEMNASA Earth Observations (NEO)
(https://gdex.cr.usgs.gov/gdex/)
It reflects the spatial difference of topography.
Urban accessibilityGlobal urbanisation and accessibility mapJoint Research Centre, European Commission (https://ec.europa.eu/info/departments/joint-research-centre_en) It reflects the accessibility and sophistication of a region.
distance to a major navigable lakeG-Econ 4.0Yale University
(http://gecon.yale.edu/)
These data reflect the abundance of water resources in a region and in the surrounding water network.
distance to an ice-free ocean
distance to a major navigable lake

