Article

A Fusion Visualization Method for Disaster Information Based on Self-Explanatory Symbols and Photorealistic Scene Cooperation

1
Faculty of Geosciences and Environmental Engineering, Southwest Jiaotong University, Chengdu 610031, China
2
School of Civil Engineering and Architecture, Southwest Petroleum University, Chengdu 610500, China
3
Department of Information and Communication Engineering, Academy of Army Armored Forces, Beijing 100072, China
*
Authors to whom correspondence should be addressed.
ISPRS Int. J. Geo-Inf. 2019, 8(3), 104; https://doi.org/10.3390/ijgi8030104
Submission received: 2 January 2019 / Revised: 16 February 2019 / Accepted: 23 February 2019 / Published: 27 February 2019

Abstract

:
Scientific and appropriate visualizations increase the effectiveness and readability of disaster information. However, existing fusion visualization methods for disaster scenes have some deficiencies, such as the low efficiency of scene visualization and difficulties with disaster information recognition and sharing. In this paper, a fusion visualization method for disaster information, based on self-explanatory symbols and photorealistic scene cooperation, was proposed. The self-explanatory symbol and photorealistic scene cooperation method, the construction of spatial semantic rules, and fusion visualization with spatial semantic constraints were discussed in detail. Finally, a debris flow disaster was selected for experimental analysis. The experimental results show that the proposed method can effectively realize the fusion visualization of disaster information, effectively express disaster information, maintain high-efficiency visualization, and provide decision-making information support to users involved in the disaster process.

1. Introduction

China is a disaster-prone country. There are more than one million casualties caused by sudden natural disasters each year, and the comprehensive economic losses have reached hundreds of billions of CNY (USD is equivalent to 6.78 CNY) [1]. In China, natural disasters are characterized by their different types (e.g., landslide, flood, debris flow, etc.), their wide geographical distribution, their high frequency of occurrence, the heavy losses they incur, and their serious social impact [1,2]. The Sendai Framework for Disaster Risk Reduction 2015–2030 (SFDRR) and National Comprehensive Disaster Prevention and Mitigation Plan of China (2016–2020) highlight the need to strengthen scientific and technological support capacity for disaster prevention and mitigation, to improve the effectiveness of disaster simulation, and to enhance people’s awareness of disaster prevention and mitigation [3,4,5,6]. It can be seen that strengthening research on scientific issues pertaining to disaster prevention and mitigation plays an extremely important role in enhancing disaster emergency decision-making and formulating comprehensive prevention strategies. However, disaster management is a very complex process, which mainly includes four stages—prevention, preparedness, response, and recovery [7,8,9,10,11]. Emergency response, especially, requires instantaneity or near instantaneity and involves lots of users with different professional backgrounds. How to clarify scene objects, improve the effective scientific visualization of disaster information, and increase the effectiveness and readability of disaster information transmission in short emergency response time have all become scientific problems that urgently need solving [12,13,14,15,16,17]. The paper “Strong Ground Motion Prediction Using Virtual Earthquakes”, published in the journal Science in January 2014, highlighted that constructing a virtual environment can provide a new approach to disaster emergency decision-making [12]—decision makers can practice formulating emergency response plans, emergency rescue, and evacuation. Therefore, constructing a virtual geographical environment (VGE) to both realize the fusion visualization and sharing of disaster knowledge and assist in disaster analysis and emergency decision-making is a fundamental trend in current disaster prevention and mitigation [18,19,20,21].
The first decision to make before creating a VGE is to choose an appropriate method to represent scene objects [22,23]. The choice of visualization will have an impact on all the later phases of development, efficiency, cognition, and usability. Visualization is characterized by a continuum, and there are multiple visual expression modes between realistic and abstract expressions. Therefore, it is necessary to choose an appropriate visual expression mode considering the application requirements and technical limitations [23,24,25].
The existing research on visual expression mainly includes two aspects. Some studies have focused on photorealistic rendering (e.g., urban planning, tourist location, and flight simulation), which requires scene objects to be highly lifelike, thus enriching the quantity and quality of visual information [17,26,27]. However, it is difficult to obtain high-resolution and high-precision data in short response times during a disaster emergency process. More often, users prefer to focus on the disaster information that is transmitted by scene objects rather than pursue the highly realistic experience of disaster scenes, because disaster information can be useful in assisting decision-making, analysis and exploration. Furthermore, a more highly realistic disaster scene requires high-performance computer hardware and software; this is prone to generating excessive visual noise, which causes the information of disaster scenes to be overloaded, thus making users face complex information processing tasks [28,29]. Other studies have emphasized the method of visualization based on visual variables (e.g., color, motion, direction, and size); the users are attracted to, then guided to focus on, the area of interest by designing symbols and adding annotations [30,31,32,33,34]. Nevertheless, symbols are less capable of facilitating mental mapping than photorealistic expression, and it is difficult to promote risk awareness. Alternatively, a disaster scene involves so many scene objects (e.g., terrain, simulation, and thematic information) that the visualization of a single symbol cannot fully express the disaster information on the macro scale, and the direct overlay of symbols and scenes may lead to poor scene modeling and incorrect spatial semantic relationships.
This paper proposes a fusion visualization method for disaster information based on self-explanatory symbols and photorealistic scene cooperation. The aim is to promote visualization and cognitive efficiency of the scene, with a certain degree of realism. We mainly focus on the choices of visualization methods for different disaster scene objects (e.g., when self-explanatory symbols or photorealistic expressions are used), dynamic fusion construction of disaster scene based on a series of objects, and revealing the advantages of self-explanatory symbols and photorealistic scene cooperation in maintaining the balance between the effectiveness of disaster information transmission and the efficiency of scene rendering. Specifically, we address the following problems:
① How to select reasonable visualization methods for different scene objects and realize their cooperation;
② How to dynamically construct a disaster scene based on different scene objects;
③ How to evaluate the advantages of self-explanatory symbols and photorealistic scene cooperation method compared with the traditional single visualization method.
The remainder of this paper is organized as follows: Section 2 introduces the idea of scene division and describes the method of the self-explanatory symbol and photorealistic scene cooperation. Using a debris flow disaster as an example, Section 3 describes the development of a prototype system and experimental analysis. Section 4 presents the conclusions of this study and provides a brief discussion of future work.

2. Methodology

2.1. Disaster Scene Division and Semantic Description

Disaster scenes involve many objects, and the spatial relationship of these objects is complicated, so it is necessary to divide the disaster scene from the top to the bottom and give a semantic description. Geographic ontology can conceptualize and clearly define scene objects and express their relationship in a unified and formal way [35]. Taking a debris flow disaster as an example, a debris flow disaster scene is divided into three parts from the conceptual level, including a basic geographic scene, a simulation information scene and a thematic information scene, which are gained via a literature review, expert research and reference to national or industry standards [36,37,38,39]. Each element contains the corresponding data, which is clearly defined. Then, geographic ontology is used to describe the concept of each element and its spatial semantic relationship. Finally, web ontology language (OWL) is used to express the structure of the debris flow scene in a formal way. Figure 1 shows the concept hierarchy of the geographical ontology in a debris flow disaster scene.

2.2. Fusion Visualization of Self-Explanatory Symbols and Photorealistic Scene Cooperation

2.2.1. Continuous Hierarchy of Non-Photorealistic and Photorealistic Expression

Visualization is characterized by a continuum. According to the degree of abstraction of the real world, one side is a non-photorealistic visualization and another side is a photorealistic visualization, as shown in Figure 2. There is no single correct means of visualization when abstracting the real world, and the combination of different visualization methods may give very surprising results. In the process of expressing disaster information, rich semantic information is better than photorealistic visualization, and the combination of non-photorealistic visualizations (such as language, symbols, and color) and photorealistic visualization can reveal more disaster semantic information while ensuring a certain degree of realism.

2.2.2. Self-Explanatory Symbols and Photorealistic Scene Cooperation

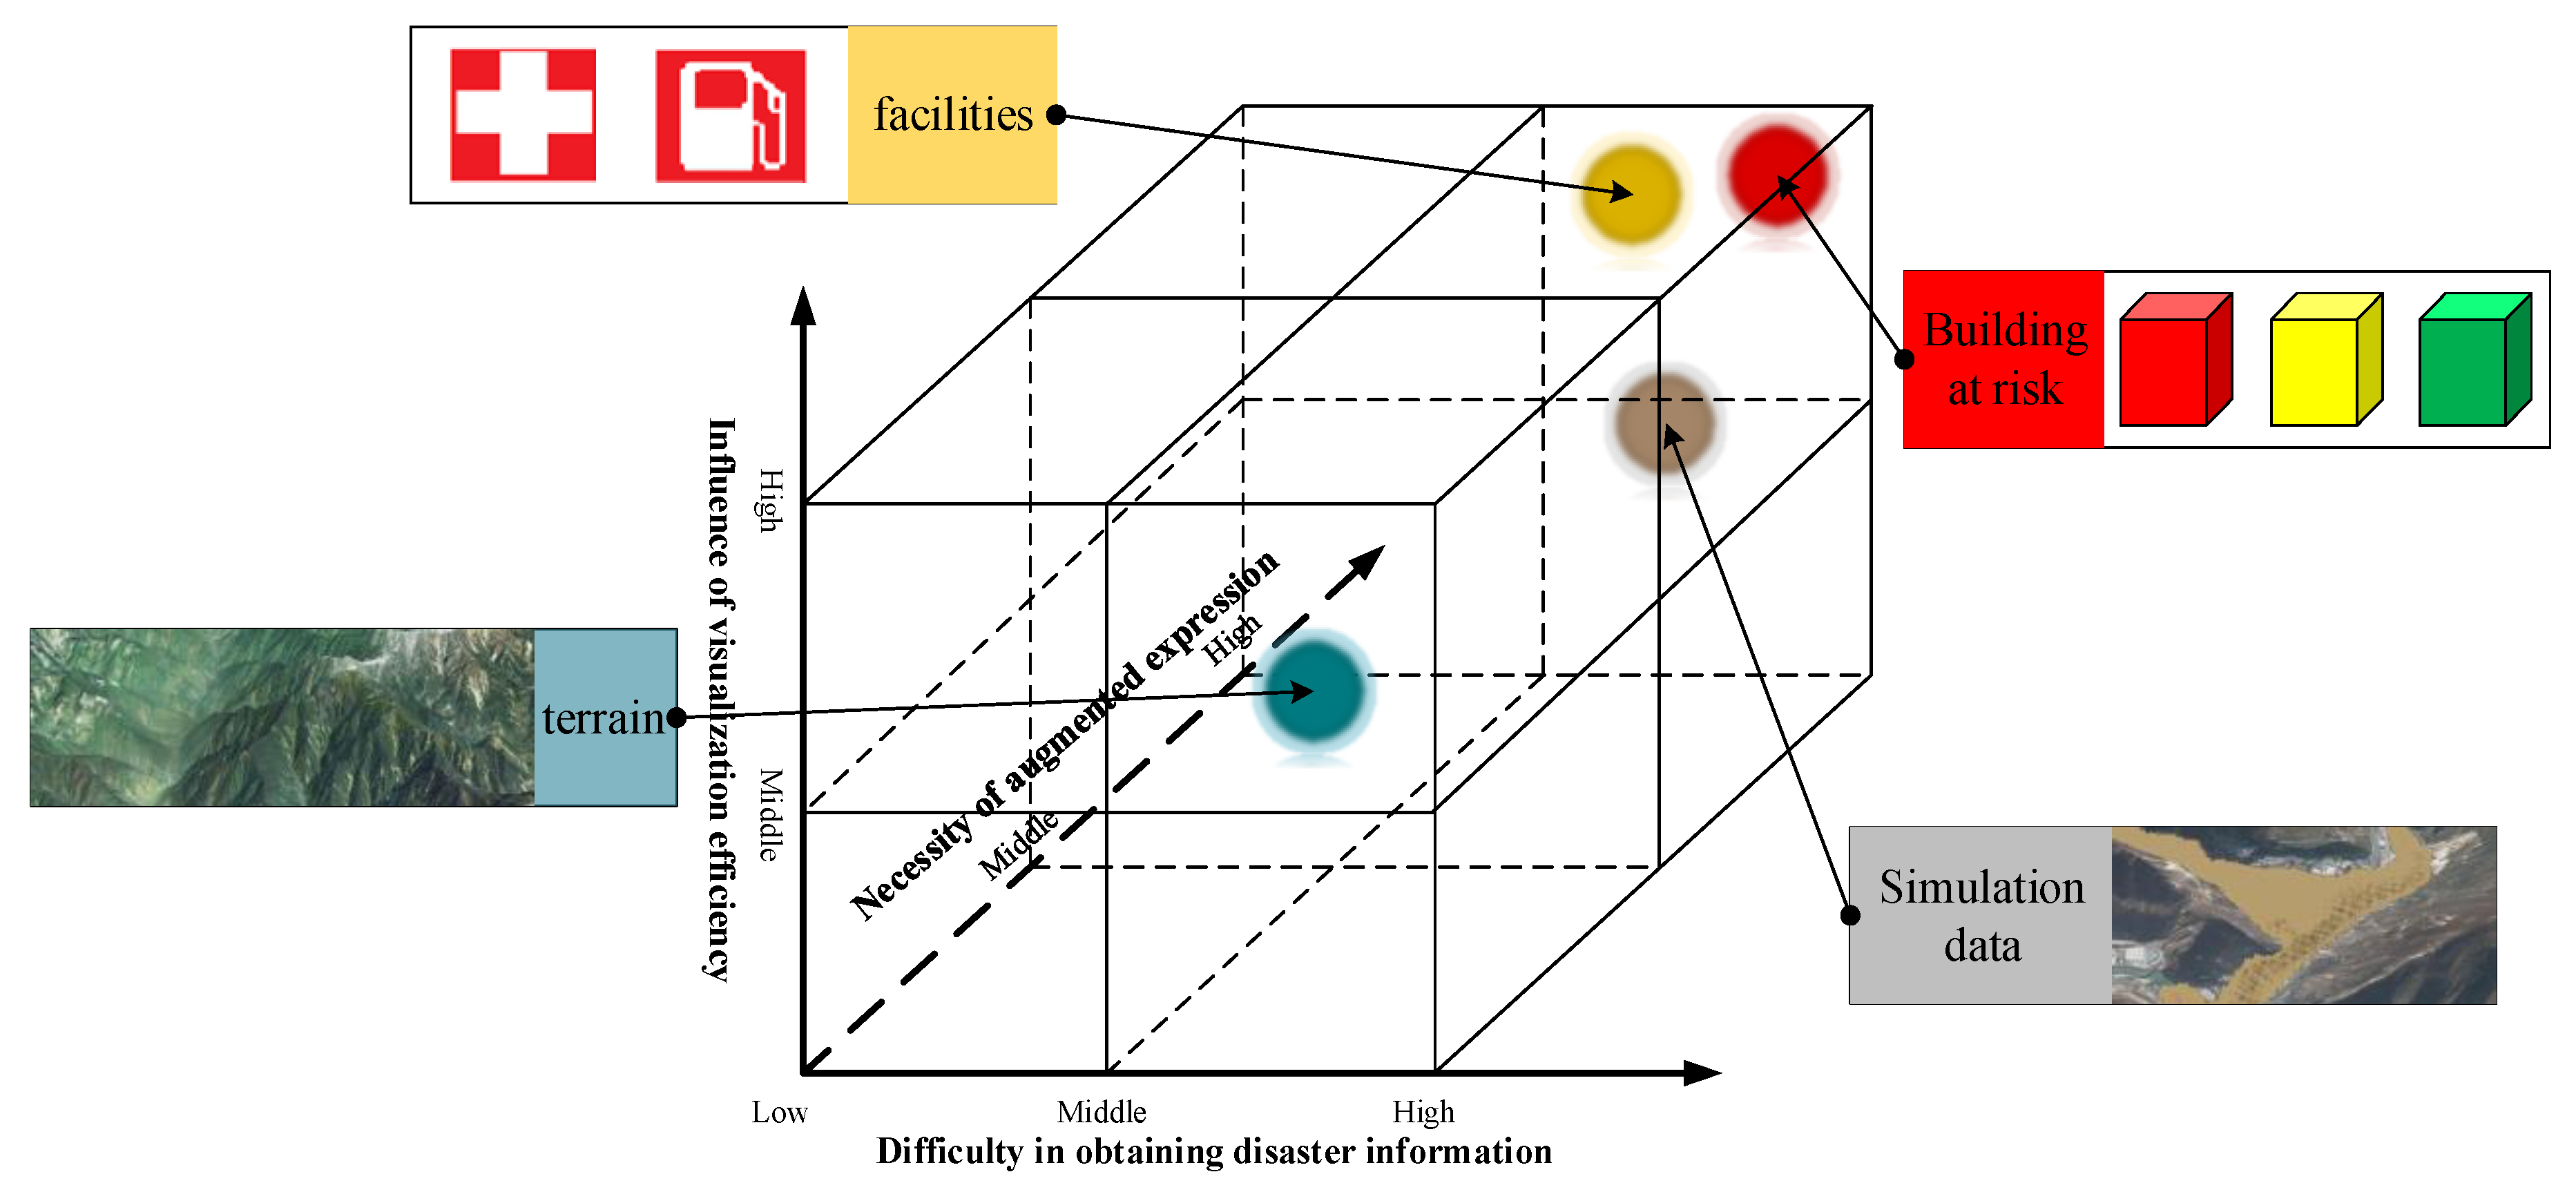
To illustrate the principles of the self-explanatory symbol and photorealistic scene cooperation, a cube model is designed based on three indicators: The difficulty in obtaining disaster information, the influence of visualization efficiency, and the necessity of augmented expression. Every disaster object can be placed in this cube. Figure 3 shows the structure of the cube model of the self-explanatory symbol and photorealistic scene cooperation.
(1) The difficulty in obtaining disaster information. This indicator mainly refers to the difficulty and rapidity of obtaining disaster information in an emergency.
(2) The influence of visualization efficiency. This indicator mainly refers to the influence of disaster information objects on the rendering frame rate.
(3) The necessity of augmented expression. Semantic information is more important than photorealistic expression in the emergency state. Therefore, some disaster information behind the surface needs to be augmented expression.
When visualizing disaster information, we need to consider the difficulty of disaster information acquisition first. If the acquisition is difficult, then it is necessary to replace it with other simple models or symbols. Second, the visualization efficiency and augmented expression need to be considered. Photorealistic expression may lead to a lack of semantic information and a low rendering rate. Therefore, the combination of language, symbols, and photorealistic expression of disaster evolution can make the disaster scene easy to read and understand.
Digital elevation models (DEMs) and remote sensing images can be quickly obtained by unmanned aerial vehicles (UAVs) after a disaster occurs, and these data are characterized by high efficiency and high resolution. The construction of a virtual 3-dimensional (3D) scene using the level of detail (LOD) not only has a sense of reality and high rendering efficiency but also contributes to perception of the entire disaster scene on a large scale. Aiming to assist scientific decision-making, it is necessary to access disaster simulation information to predict the trend of the disaster during the emergency response process. Decision-makers are more concerned about disaster information (e.g., range, evolution time, inundation) behind the evolution process than they are with having photorealistic expression of the disaster. Hence, feature visualization is adopted to display the disaster process, augment the transmission of disaster information, and maintain a certain degree of realism, because real disaster evolution processes can facilitate mental mapping.
Because social statistic data (such as population and property data) can be easily obtained and have a low impact on the scene visualization efficiency, these data can be expressed in the form of language after spatialization. Residential buildings and roads at risk are always the focus of decision-makers, rescuers, and the public after a disaster occurs. However, it is difficult to obtain these data and achieve a high degree of realism in reproduction, and photorealistic scene objects tend to lack semantic information. Using a simplified LOD model with emergency color to visualize such objects, the effective and augmented transmission of disaster information can be realized with a guarantee of certain realism. Dangerous and important facilities are widely distributed, so a symbol is a better method to present their geographical location and augment the ability of disaster information transmission.

2.2.3. Fusion of Scene Objects with Spatial Semantic Constraints

During the construction process of a disaster scene, different scene objects are modeled and the relationship between different scene objects are considered, then the 3D disaster scene can be quickly constructed through a combination of different objects [40]. Based on this, this paper proposes a method of disaster object fusion with spatial semantic constraints, as shown in Figure 4. To guide the fusion process and render the objects in the correct spatial position and direction, and seamlessly integrate the objects with each other, the spatial semantic rules—which include spatial location, attribute category, and spatial topology—are proposed.
(1) Spatial location
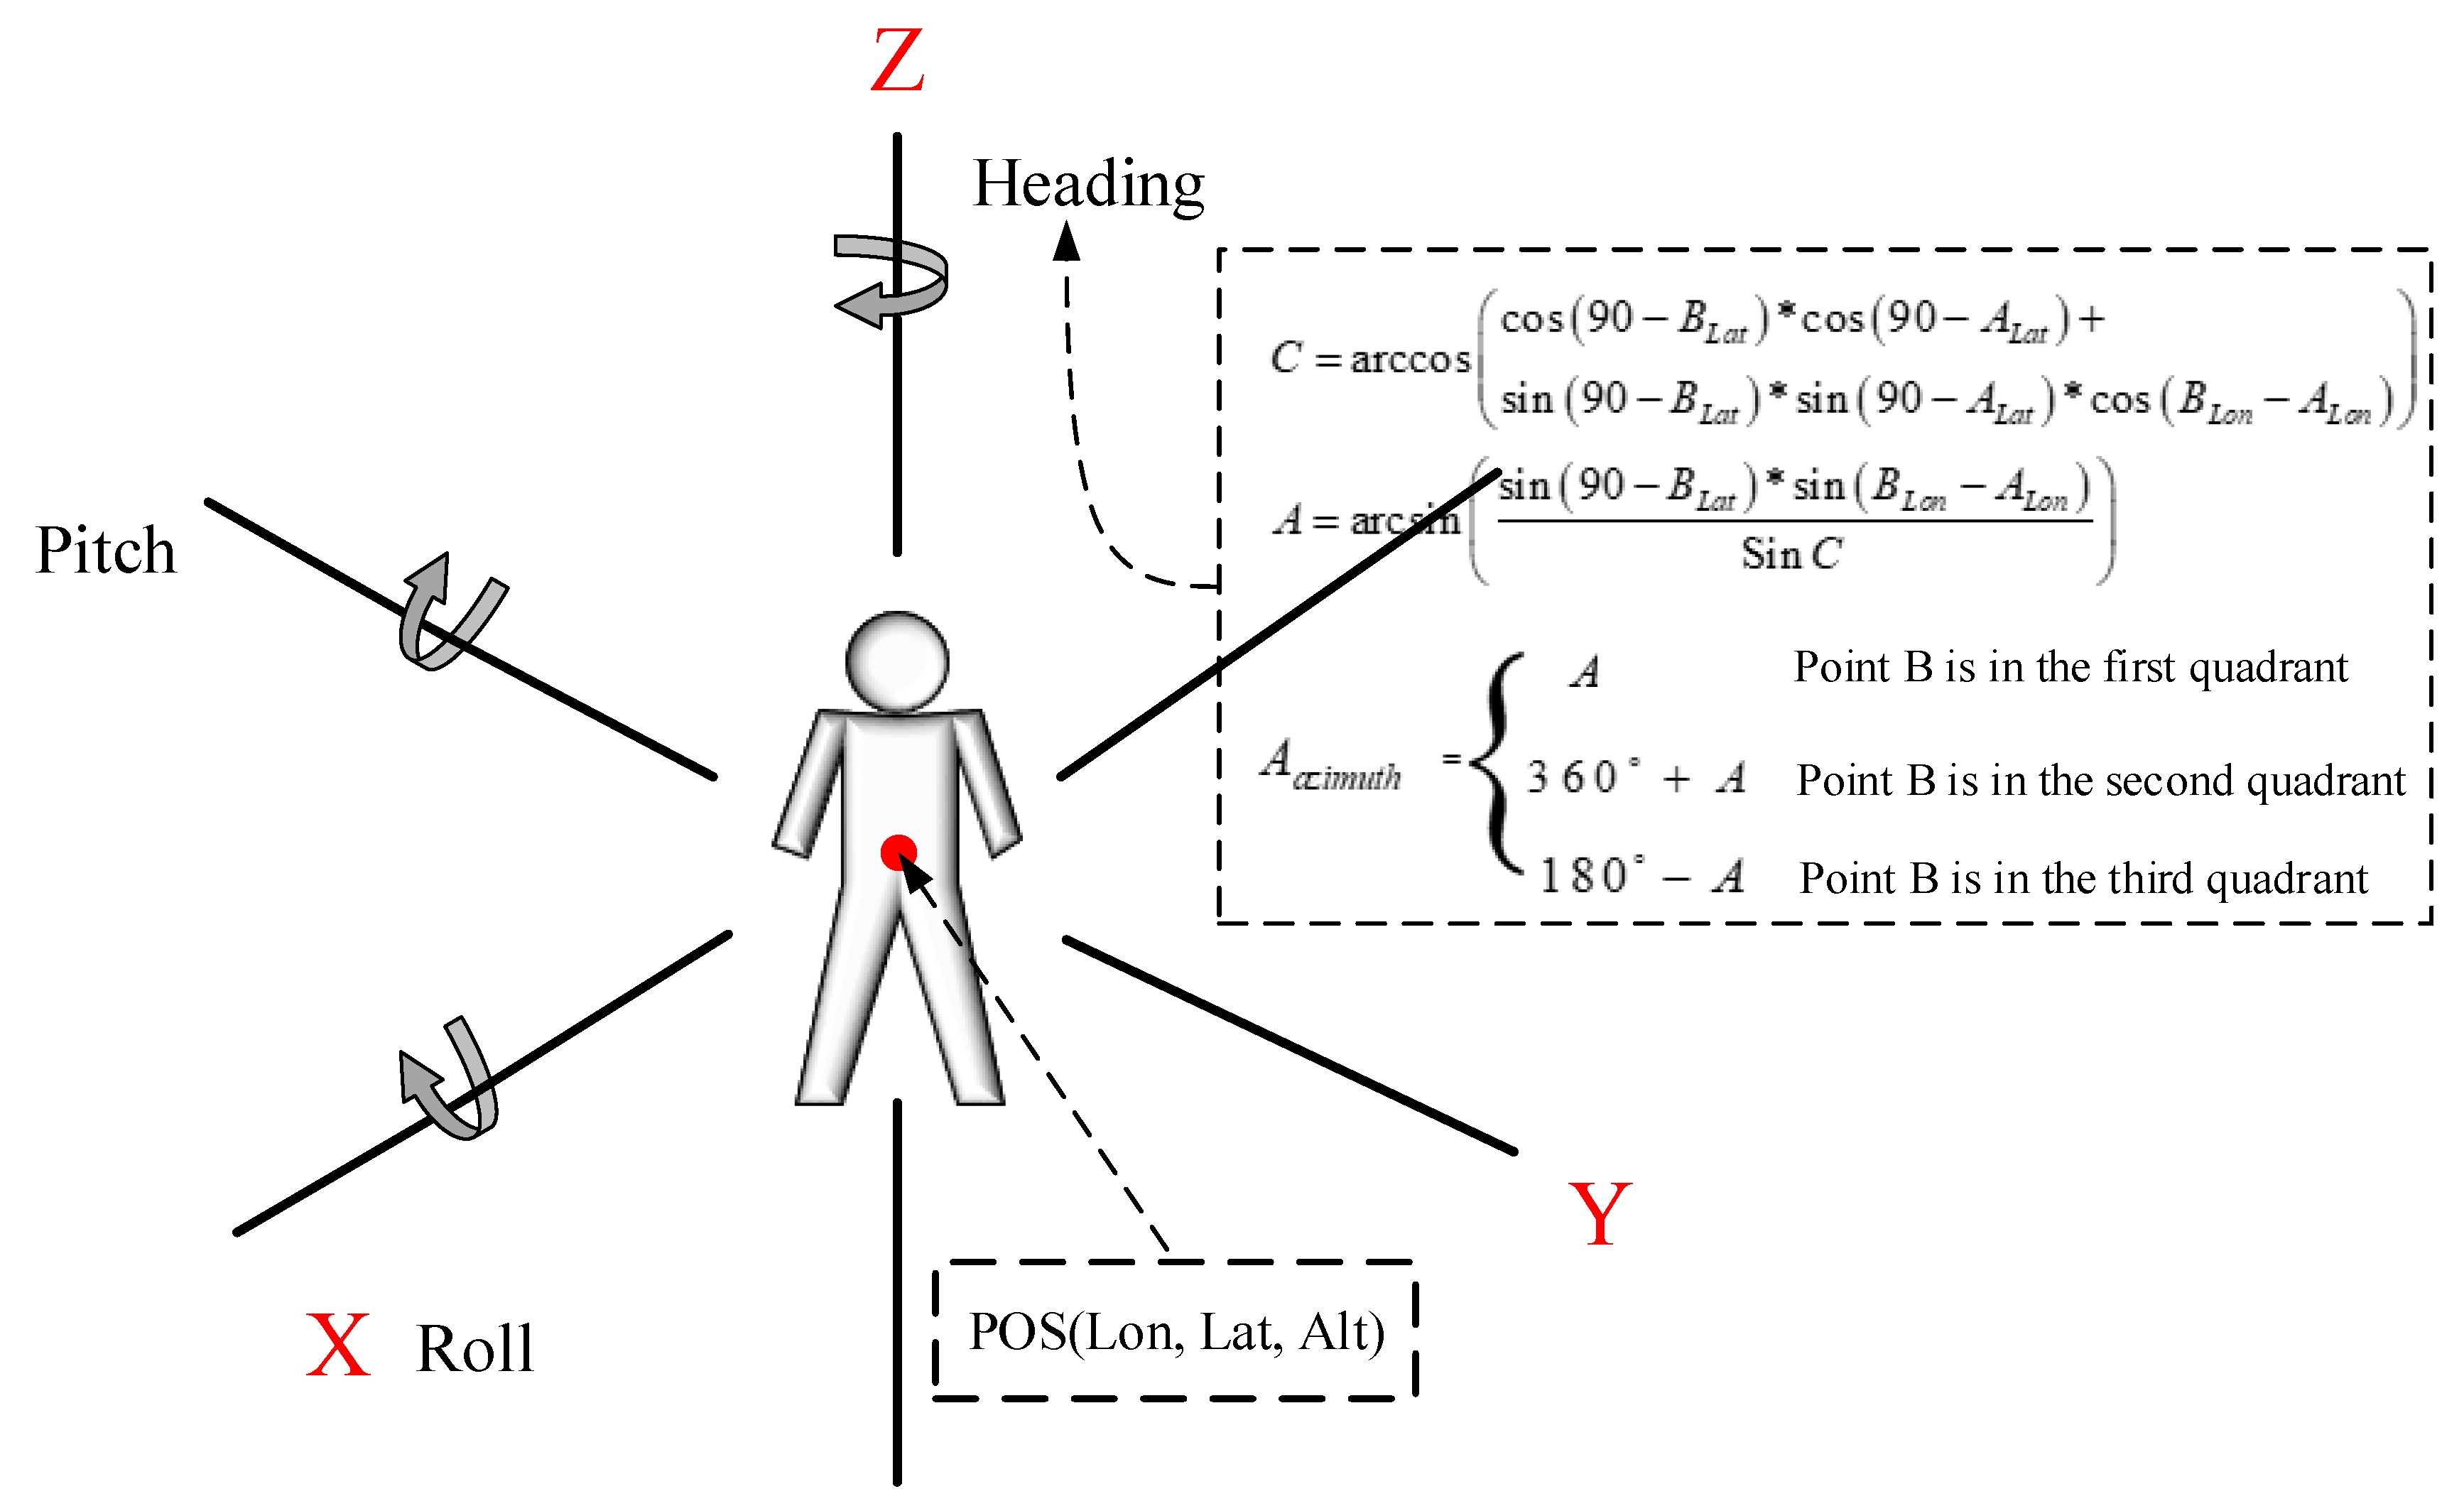
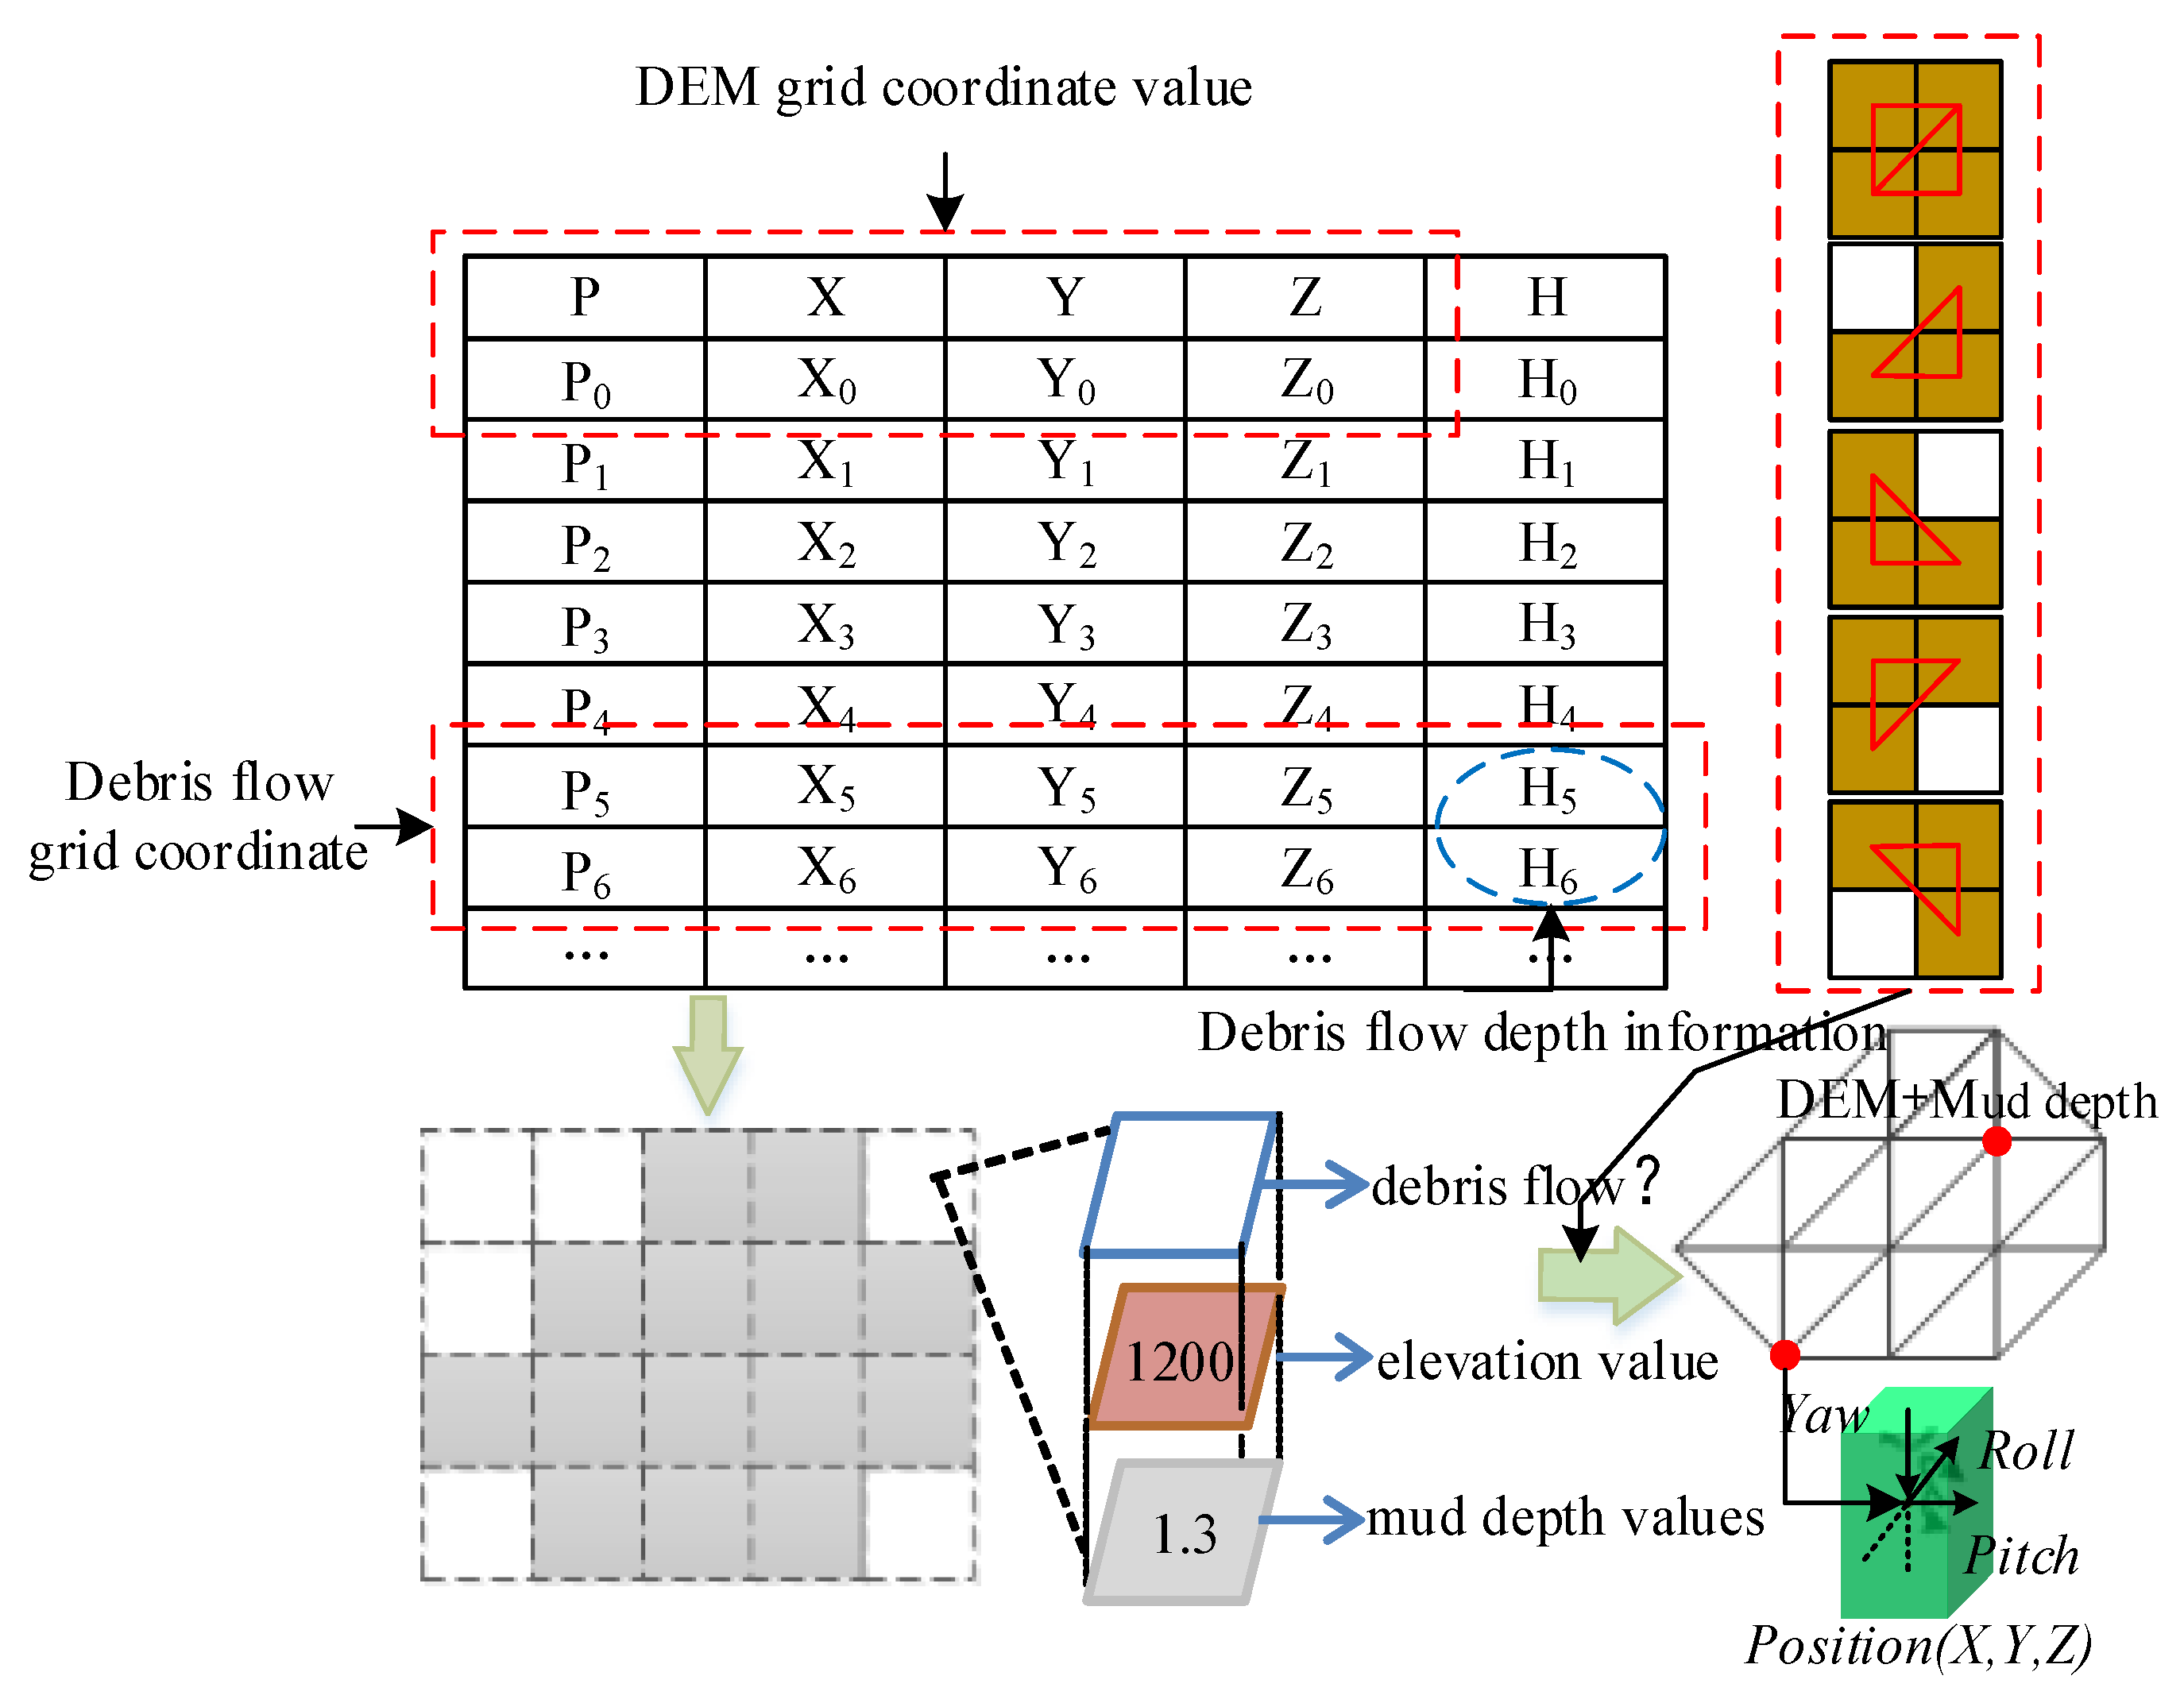
Spatial location mainly includes spatial position and orientation, as shown in Figure 5. Spatial location processes the registration of geographic locations and orientation between different disaster elements. Spatial position includes the plan and elevation; the elevation can be specified in the object construction as the plan position, and it can also be calculated in real-time according to its plane position and the terrain model. Spatial orientation includes heading, pitch, and roll, which are used to match the orientation relationship between objects. Because all of the models are surface models, there is no need to consider the pitch and roll angle; only the heading angle is necessary.
(2) Attribute category
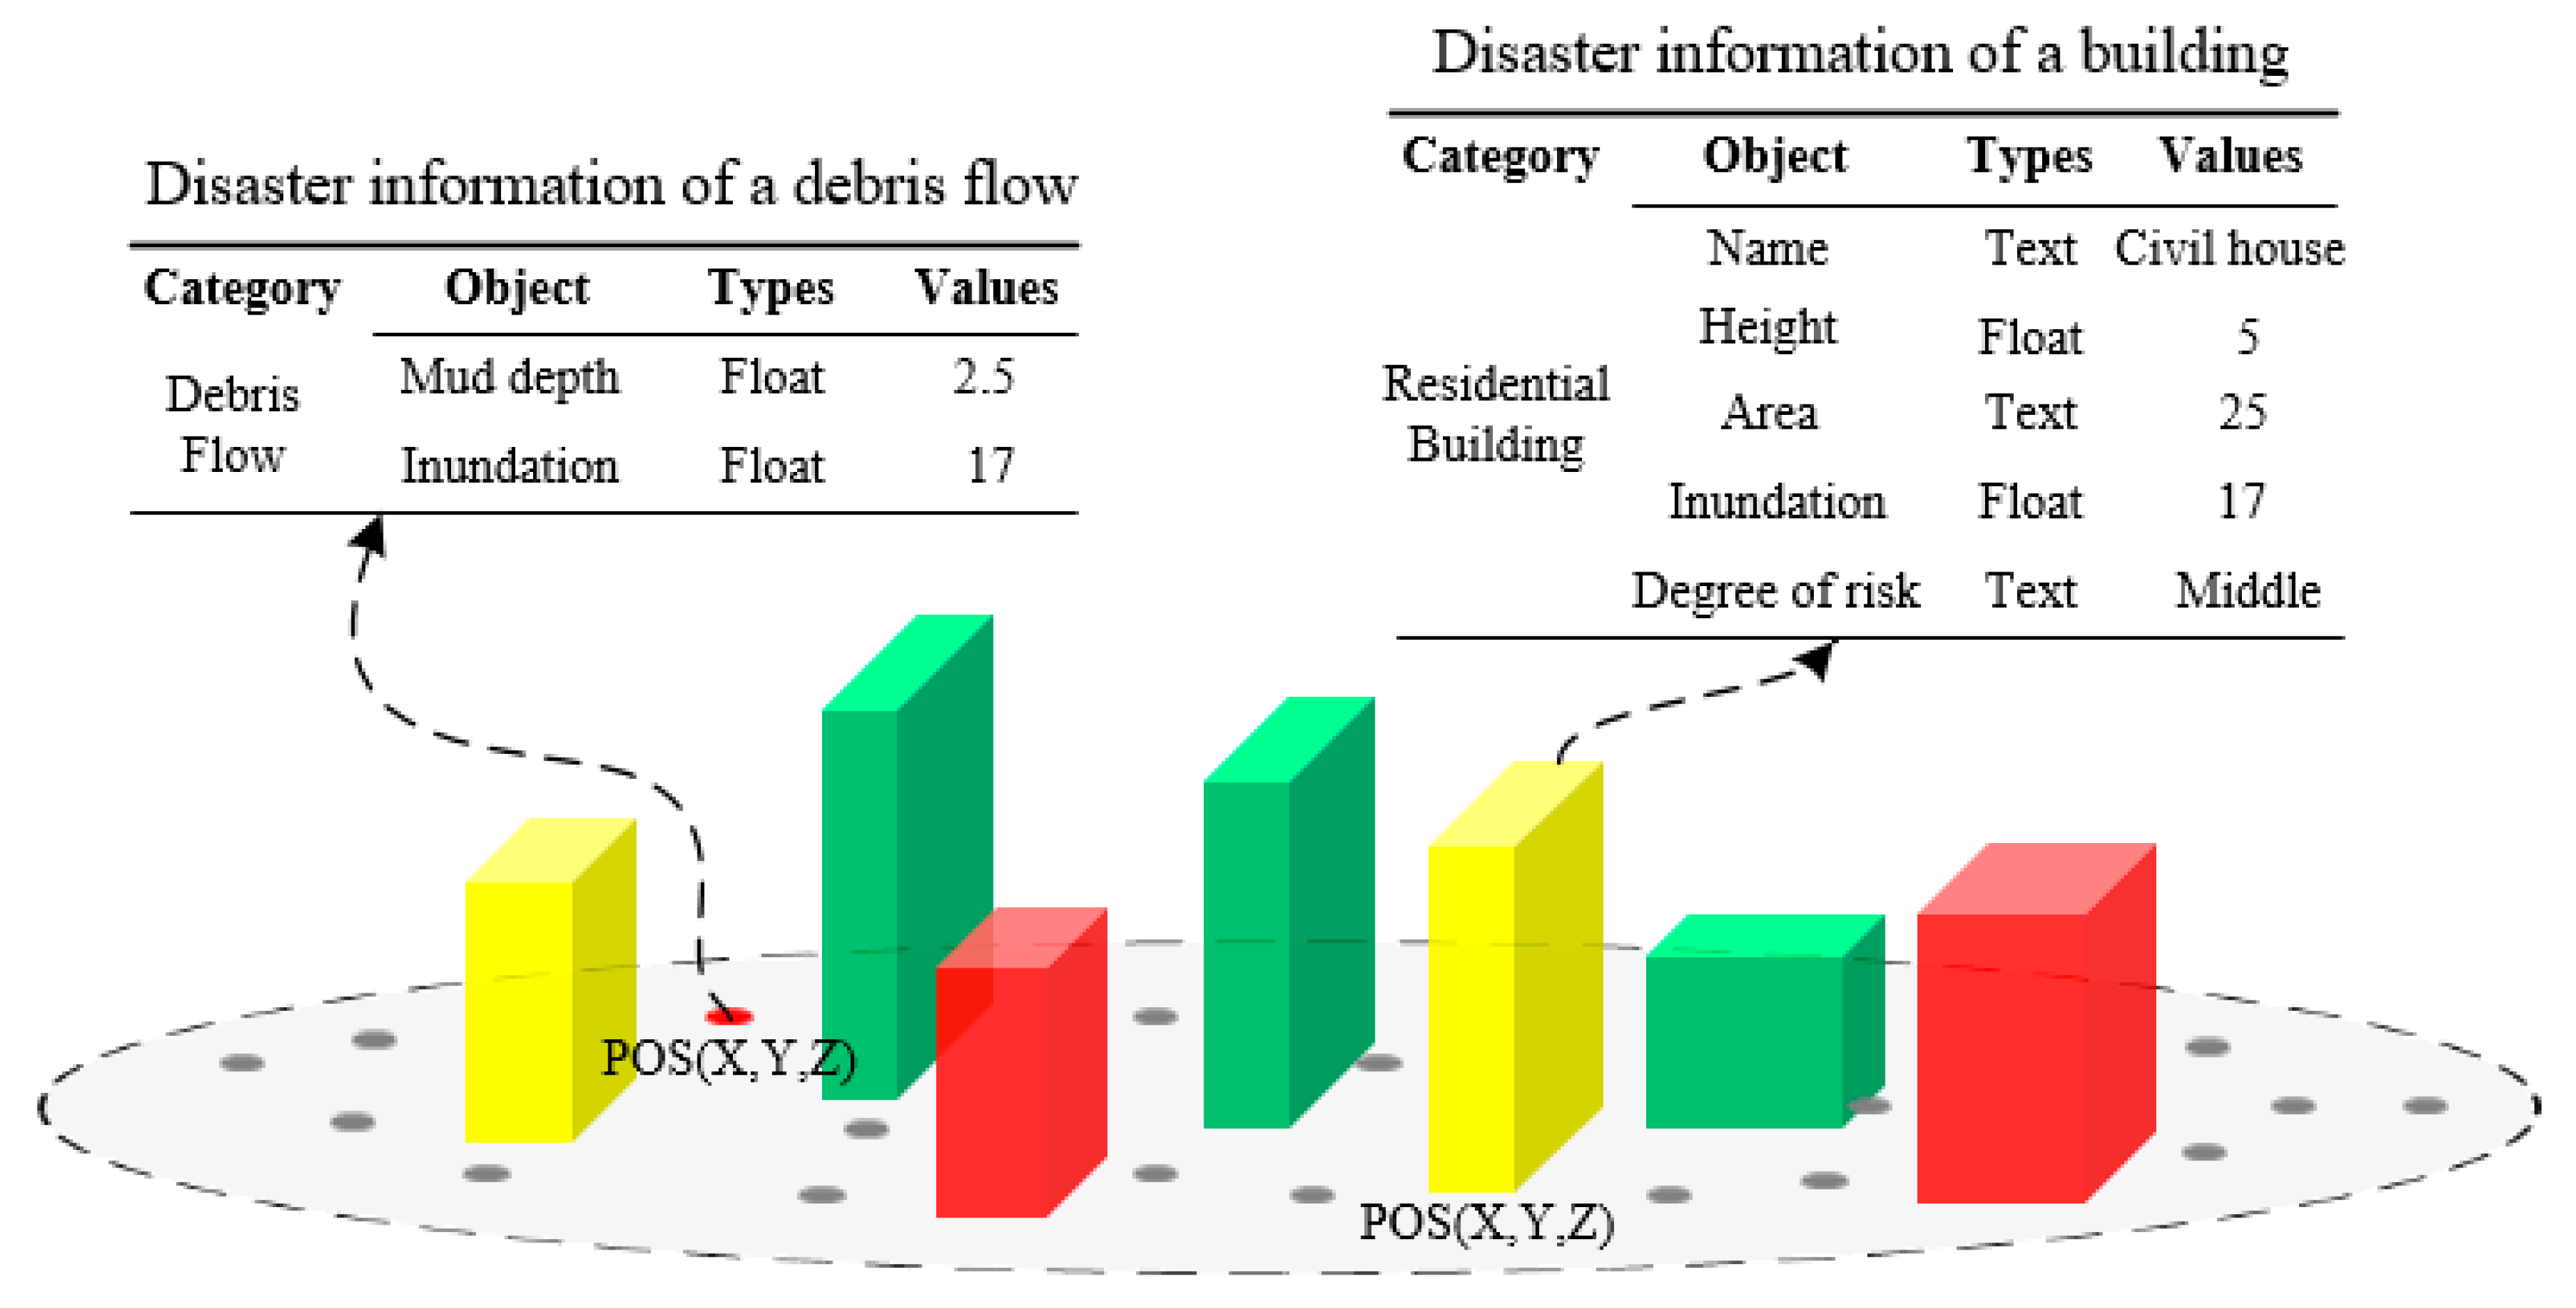
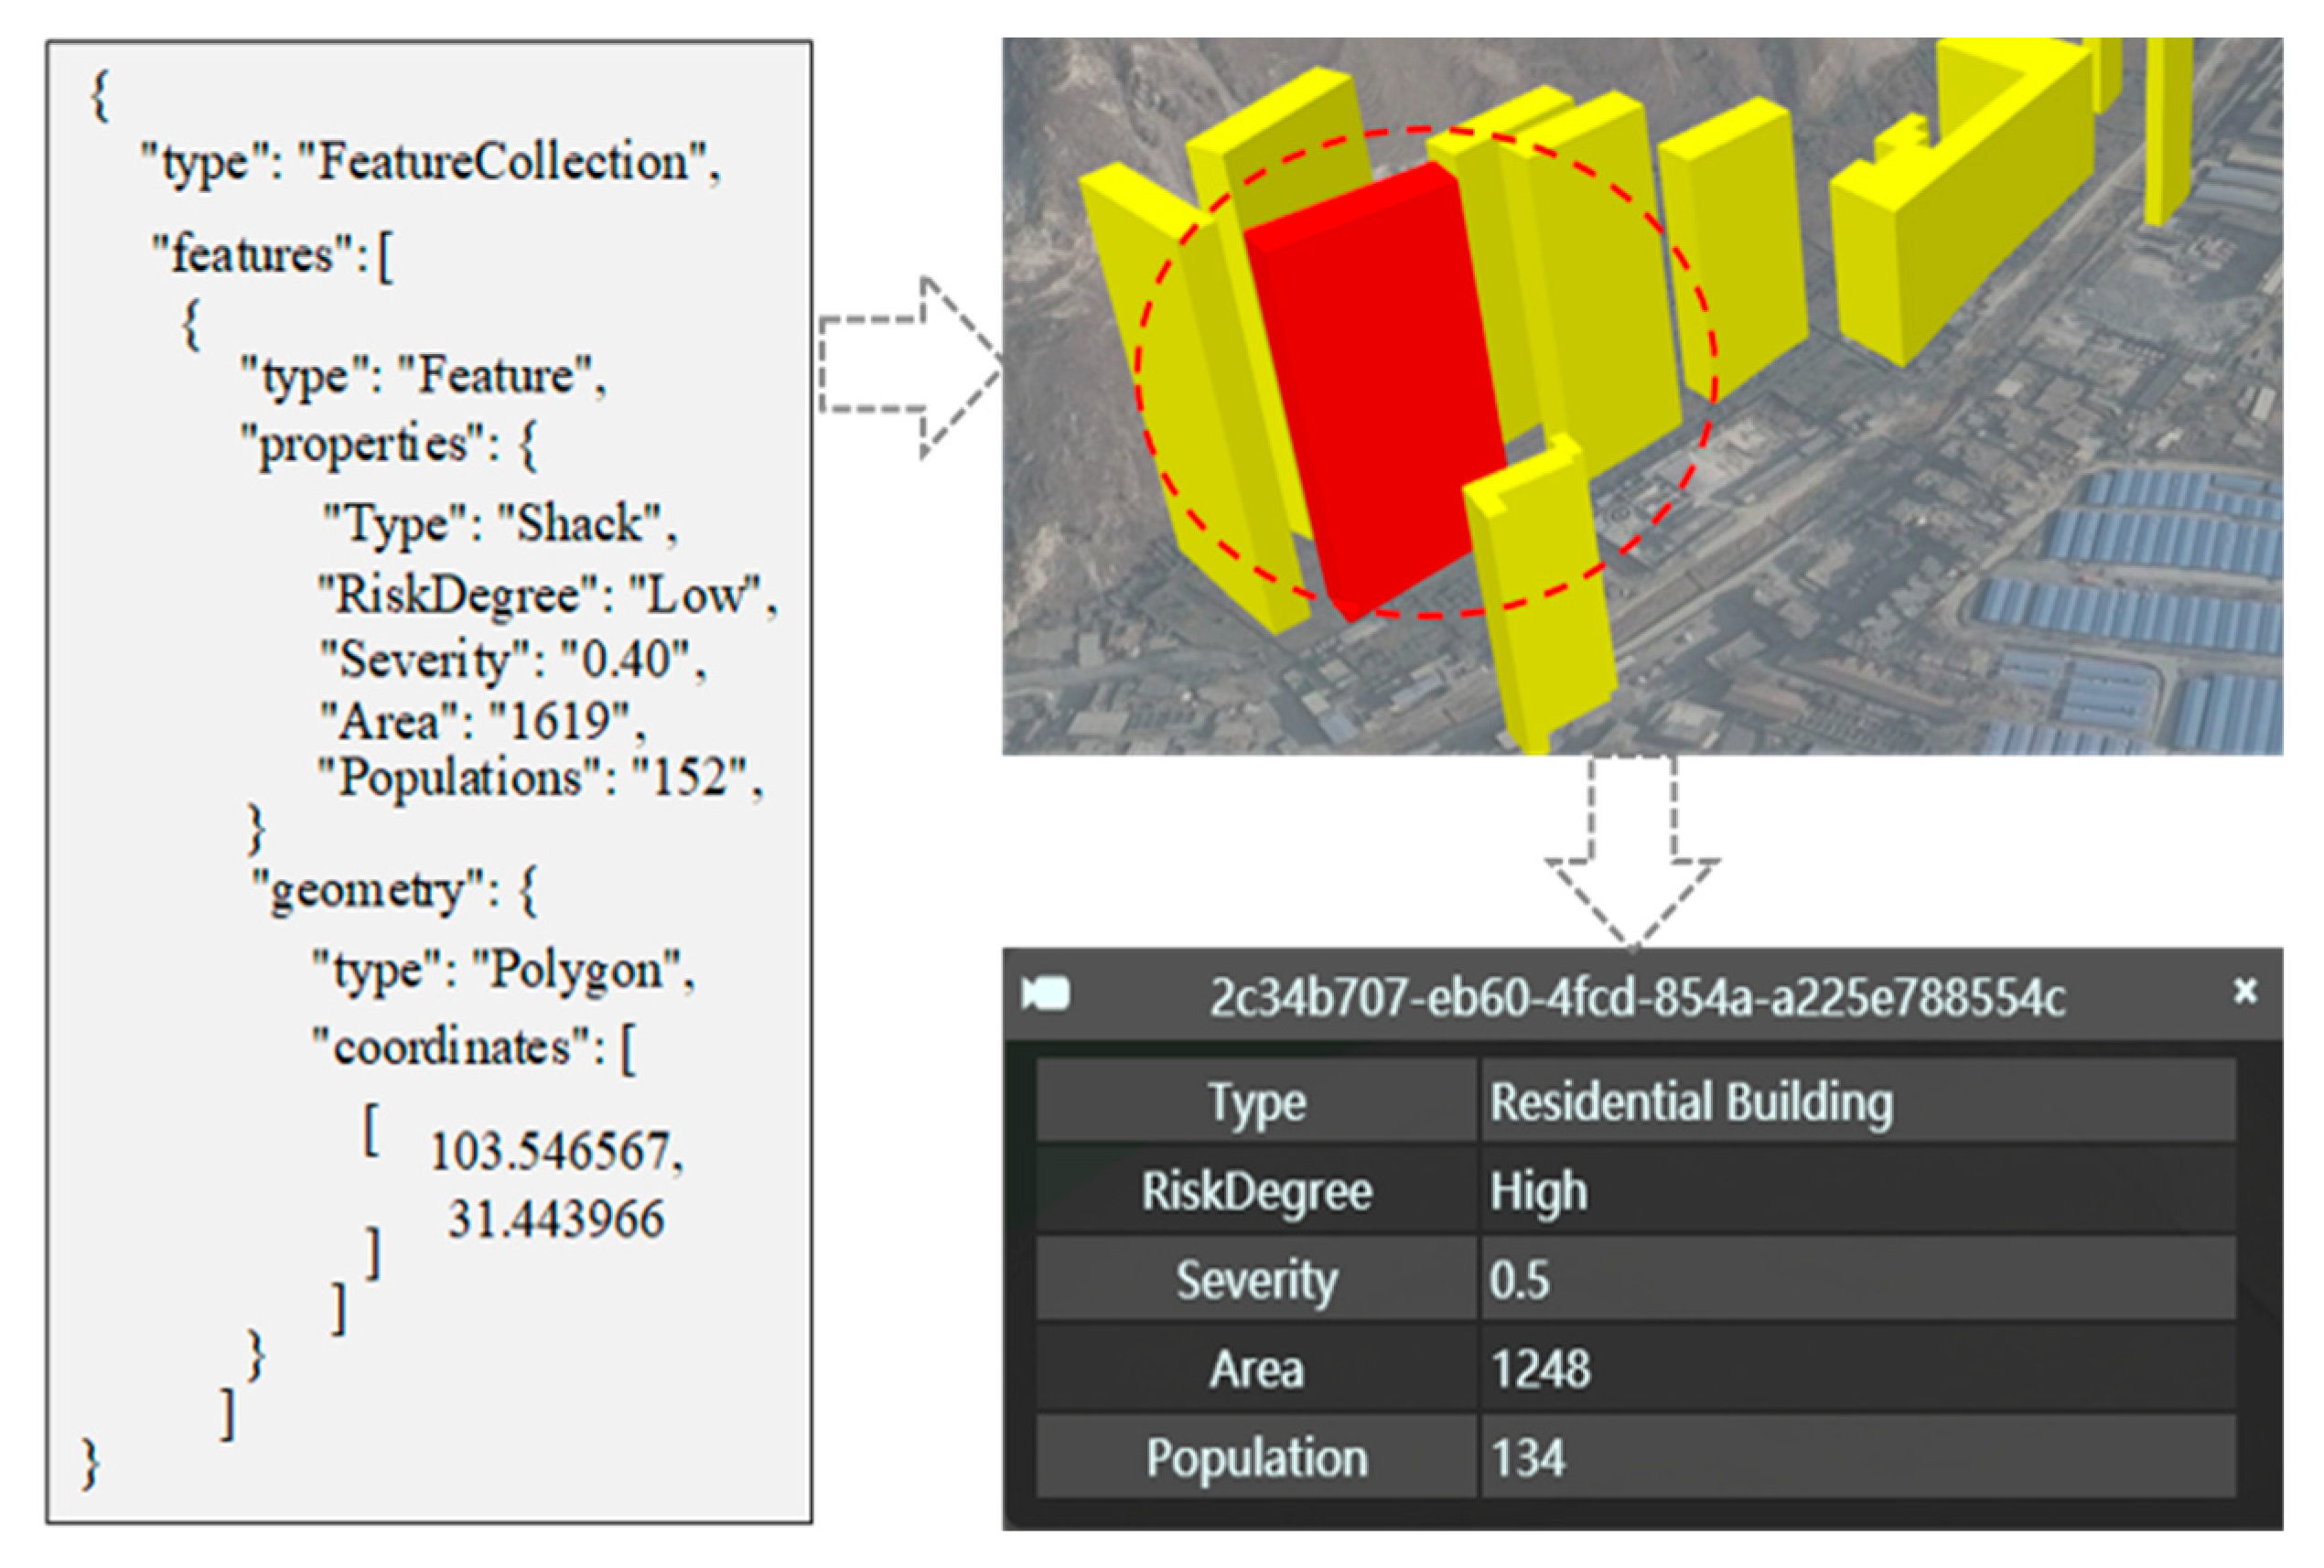
The attribute category regards the non-spatial disaster information as an attribute of the disaster object based on semantic relations. Considerable non-spatial disaster information (e.g., degree of risk, population at risk, inundation, etc.) is classified and stored in the database. This information is then used to achieve fusion of these data and disaster objects according to their spatial locations and semantic relationships. In the case of debris flow, we can query the debris flow velocity, depth, and evolution time during the debris flow evolution process. An example of the fusion of disaster information with an attribute category constraint is shown in Figure 6.
(3) Spatial topology
The spatial topological relationship in a 3D space is more complicated than in a 2-dimensional (2D) space, and it is necessary not only to consider the relationship of 3D and 3D, but also to consider the relationship of 3D and 2D models, and of 3D and 1D models, in the spatial topological relationships. Therefore, this paper considers three spatial topological relationships, which include adjacent, disjoint, and overlap, as shown in Formula (1).
R ( A , B ) = T ( A , B ) + D ( A , B ) + O ( A , B )
In the above formula, R denotes the spatial topological relationship between models A and B. T denotes that model A is adjacent to model B, which means that two models have the same surface, but the interiors do not intersect (such as the debris flow surface and terrain surface). D indicates that model A is separate from model B; that is, they do not have a common point (like two different buildings). O specifies the order of the joint between models. In addition, this paper uses the 2D coordinates of an object and a 3D terrain model to calculate the 3D coordinates at the corresponding level in real time and to solve problems of model suspension and deep burial.

2.2.4. Disaster Scene Cognition and Visualization Efficiency Evaluation

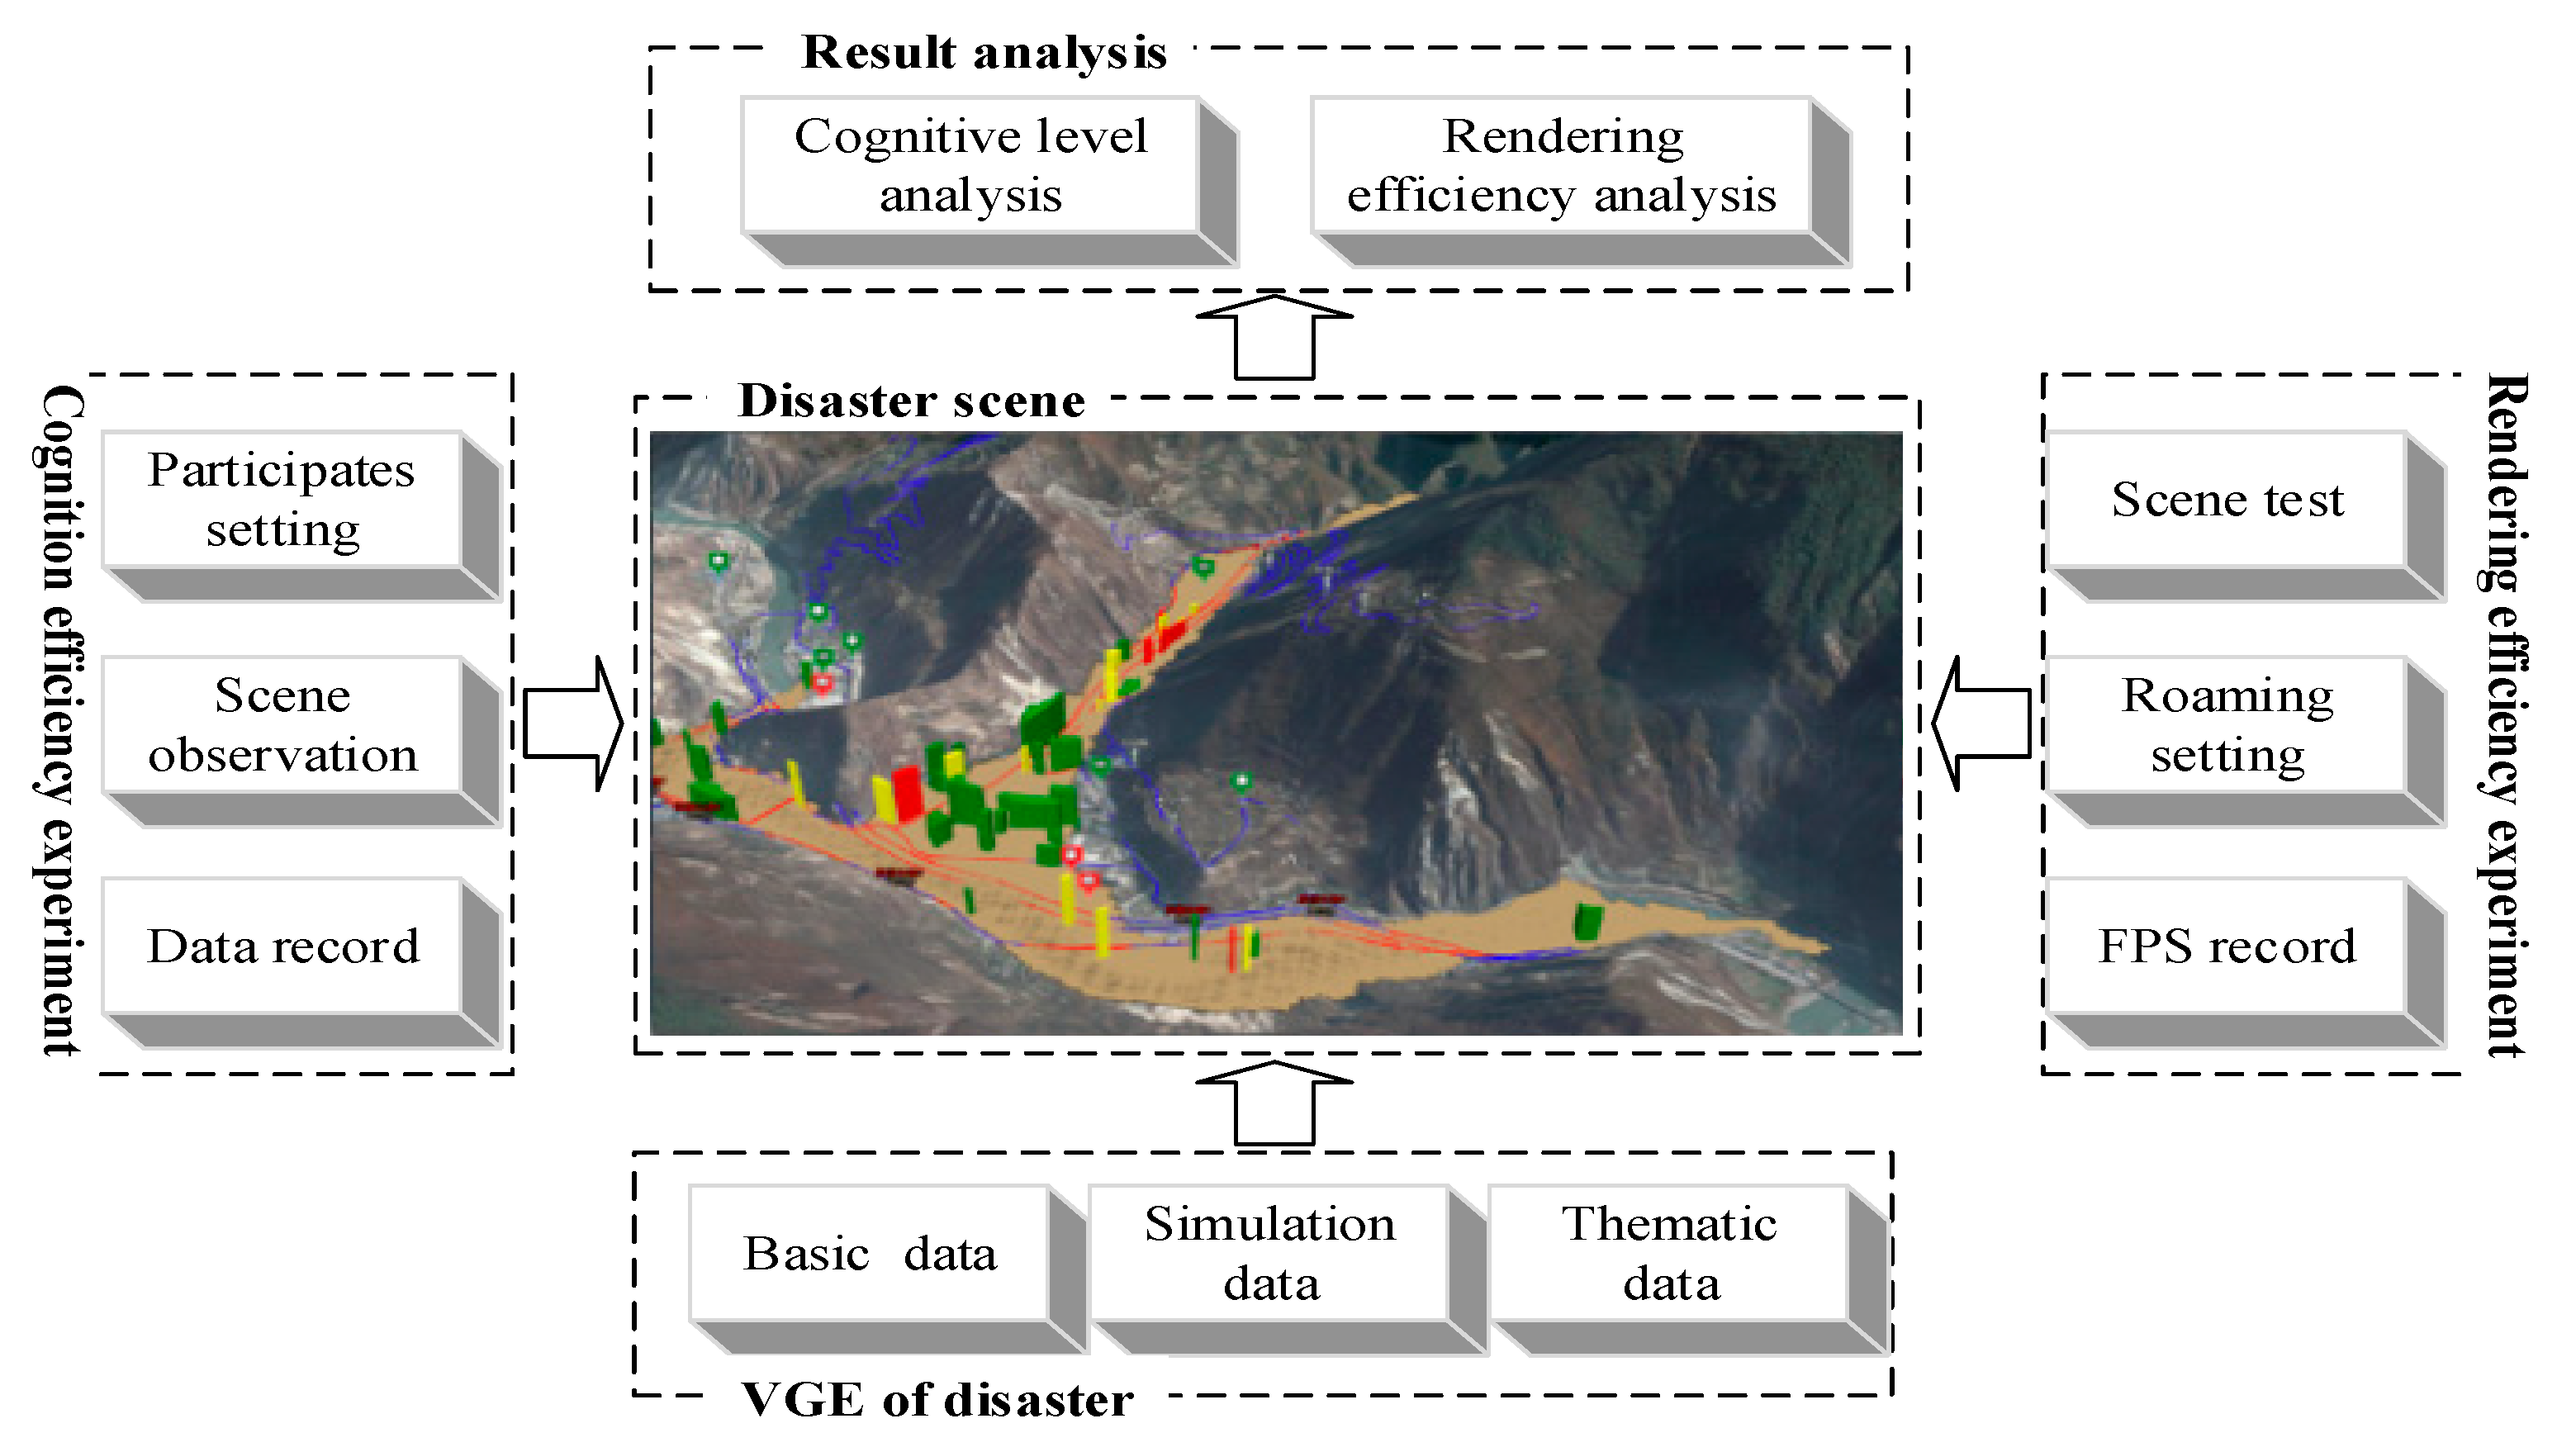
There are many types of research on geographical cognition, especially in the field of cartography, and these studies attempt to improve the researcher’s ability to understand maps by changing the color, size, and shape of symbols [41,42,43,44]. This paper proposes cognition and visualization efficiency to evaluate the advantages of self-explanatory symbols and photorealistic scene cooperation. Figure 7 shows the design of cognition and visualization efficiency of disaster scene experiments.
(1) Construction of the VGE of a disaster
The VGE of a disaster is the basis of the experiment. We achieve the rapid construction of the VGE under multisource disaster information based on spatial semantic constraints by modeling the virtual terrain scene, residential building and road models, simulation data, and thematic data.
(2) Cognition of the disaster scene experiment
First, two groups of participants with the same background knowledge and the same number of people are chosen. The participants observe the same disaster scene constructed by two different visualization methods and answer the preset questions. Finally, the answer accuracy and finish time are analyzed from two groups.
(3) Rendering efficiency of the disaster scene experiment
We use the roaming method to test the influence of different visualization methods on the rendering frame rate; the same roaming route, roaming height, and roaming time are set for two different disaster scenes.

3. System Implementation and Experimental Analysis

3.1. Study Area and Data Processing

In this paper, the debris flow in Qipan gully, Wenchuan county (30°45′ N~31°43′ N, 102°51′ E~103°44′ E), Sichuan Province, China, was selected as the study area in which to perform the experimental analysis. The resolution of image data from the study area was 1 m, and the resolution of DEM from the study area was 10 m. Simulation data of debris flow were provided by Yin et al. [45], and the thematic data were provided by the Sichuan Bureau of Surveying, Mapping, and Geoinformation. Disaster data classification and processing are shown in Table 1.

3.2. Prototype System Implementation and Fusion Visualization of the Disaster Information

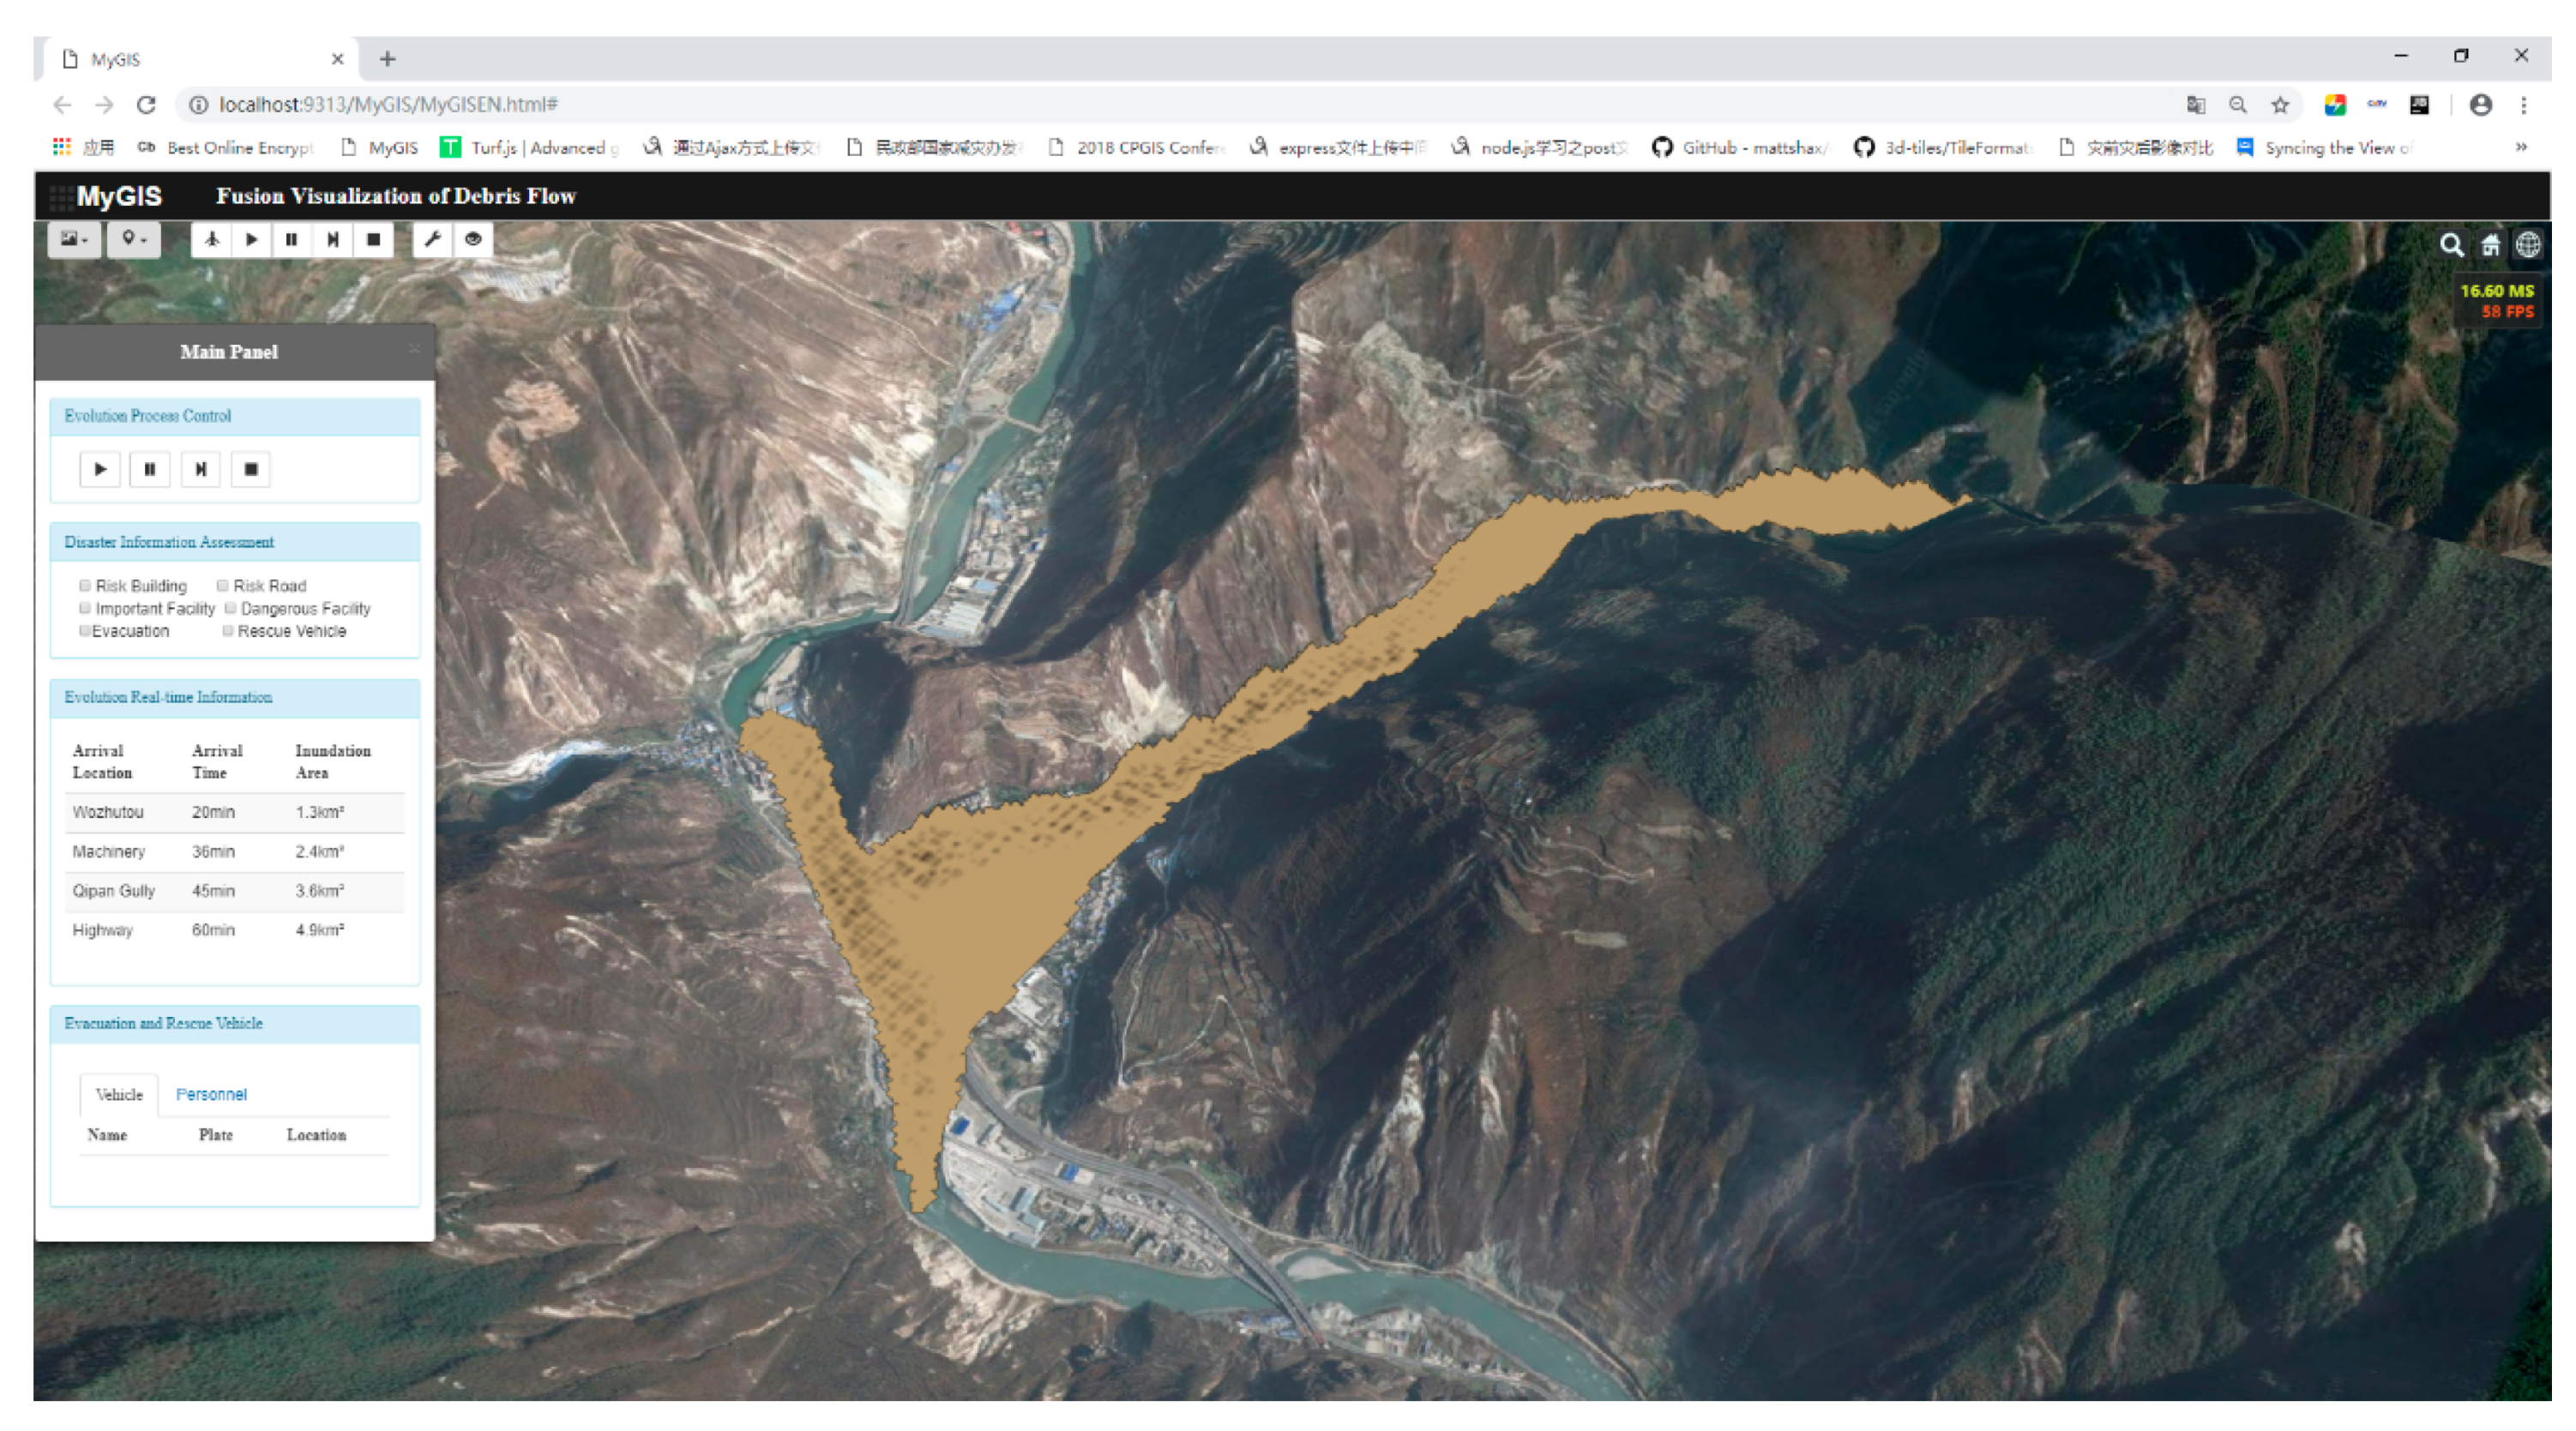
Based on the above, the OWL language was used to describe the semantics and the relationship of scene objects. The plugin-free browser/server (B/S) prototype system was implemented using Node.js v6.11.2, HTML5, CSS, JavaScript, and the Cesium open-source library. The interface of the prototype system is shown in Figure 8. The system was mainly used to achieve efficient fusion visualization of the debris flow disaster information and to test the influence of the proposed method on the cognition and rendering efficiency. The prototype system was run and tested on ThinkPad T440. The processor was an Intel(R) Core(TM) i7-4510U CPU @ 2.00 GHz, with 8 GB memory and NVIDIA GeForce GT720M’s graphics card. The browser was Google Chrome 70.0.3538.110.
Based on the prototype system platform, the DEM was overlaid on the image to construct a very realistic LOD virtual 3D scene. To realistically and vividly visualize the spatial–temporal evolution process of debris flow and transmit disaster information (e.g., mud depth and inundation), the visual color of debris flow was adopted in gray, which was in line with public perception, and the mud depth value at each moment and the continuous gray ribbon exhibited one-to-one mapping. To satisfy the requirements of simplicity, intuitiveness, and more semantic information, the residential building at risk was represented by a simplified LOD model with emergency warning colors (such as red, yellow and green). The degree of risk of roads plays a significant role during the process of evacuation and rescue; therefore, red and green were used to indicate that roads were either intact or damaged. Disaster symbols with attributes were adopted to represent the location and accessibility of important facilities and dangerous facilities. Personnel evacuation and rescue were represented by more detailed personal symbol models and vehicle models, combined with roads at risk for display. Self-explanatory symbols and photorealistic scene cooperation not only enables users to quickly and intuitively understand debris flow disasters but also ensures the integrity of disaster scenes with the lack of data. Moreover, a high rendering efficiency and the effective transmission of disaster information can be maintained and then provide decision-making support for emergency management.
After defining the visualization methods of scene objects, this study used spatial semantic constraint rules, such as the spatial location, attribute category, and spatial topology, to constrain and guide the fusion of different scene objects and then achieve the construction of the debris flow disaster scenes. Based on the coordinate values of the DEM grid in WGS84, through mud depth value extraction, mesh construction, and spatial position and orientation calculations, a series of processes were used to achieve the combination and fusion of various scene objects with spatial location semantic constraints, as shown in Figure 9. Attribute category semantics constrained the expression of non-spatial information in the debris flow disaster scene. Figure 10 shows an example of attribute information fusion of residential buildings at risk. The spatial topology semantics constrained the terrain surface, the boundary of debris flow, and the bottom of the building. Additionally, the elevation of disaster symbols, road models, and residential building models were calculated in different terrain LOD levels so that the spatial topological relations of the scene objects could be correctly expressed. Figure 11 shows the fusion visualization of the debris flow disaster scene with spatial semantic constraints.

3.3. Cognition and Visualization Efficiency of the Disaster Scene Experiments

3.3.1. Cognition Efficiency of the Disaster Scene Experiments

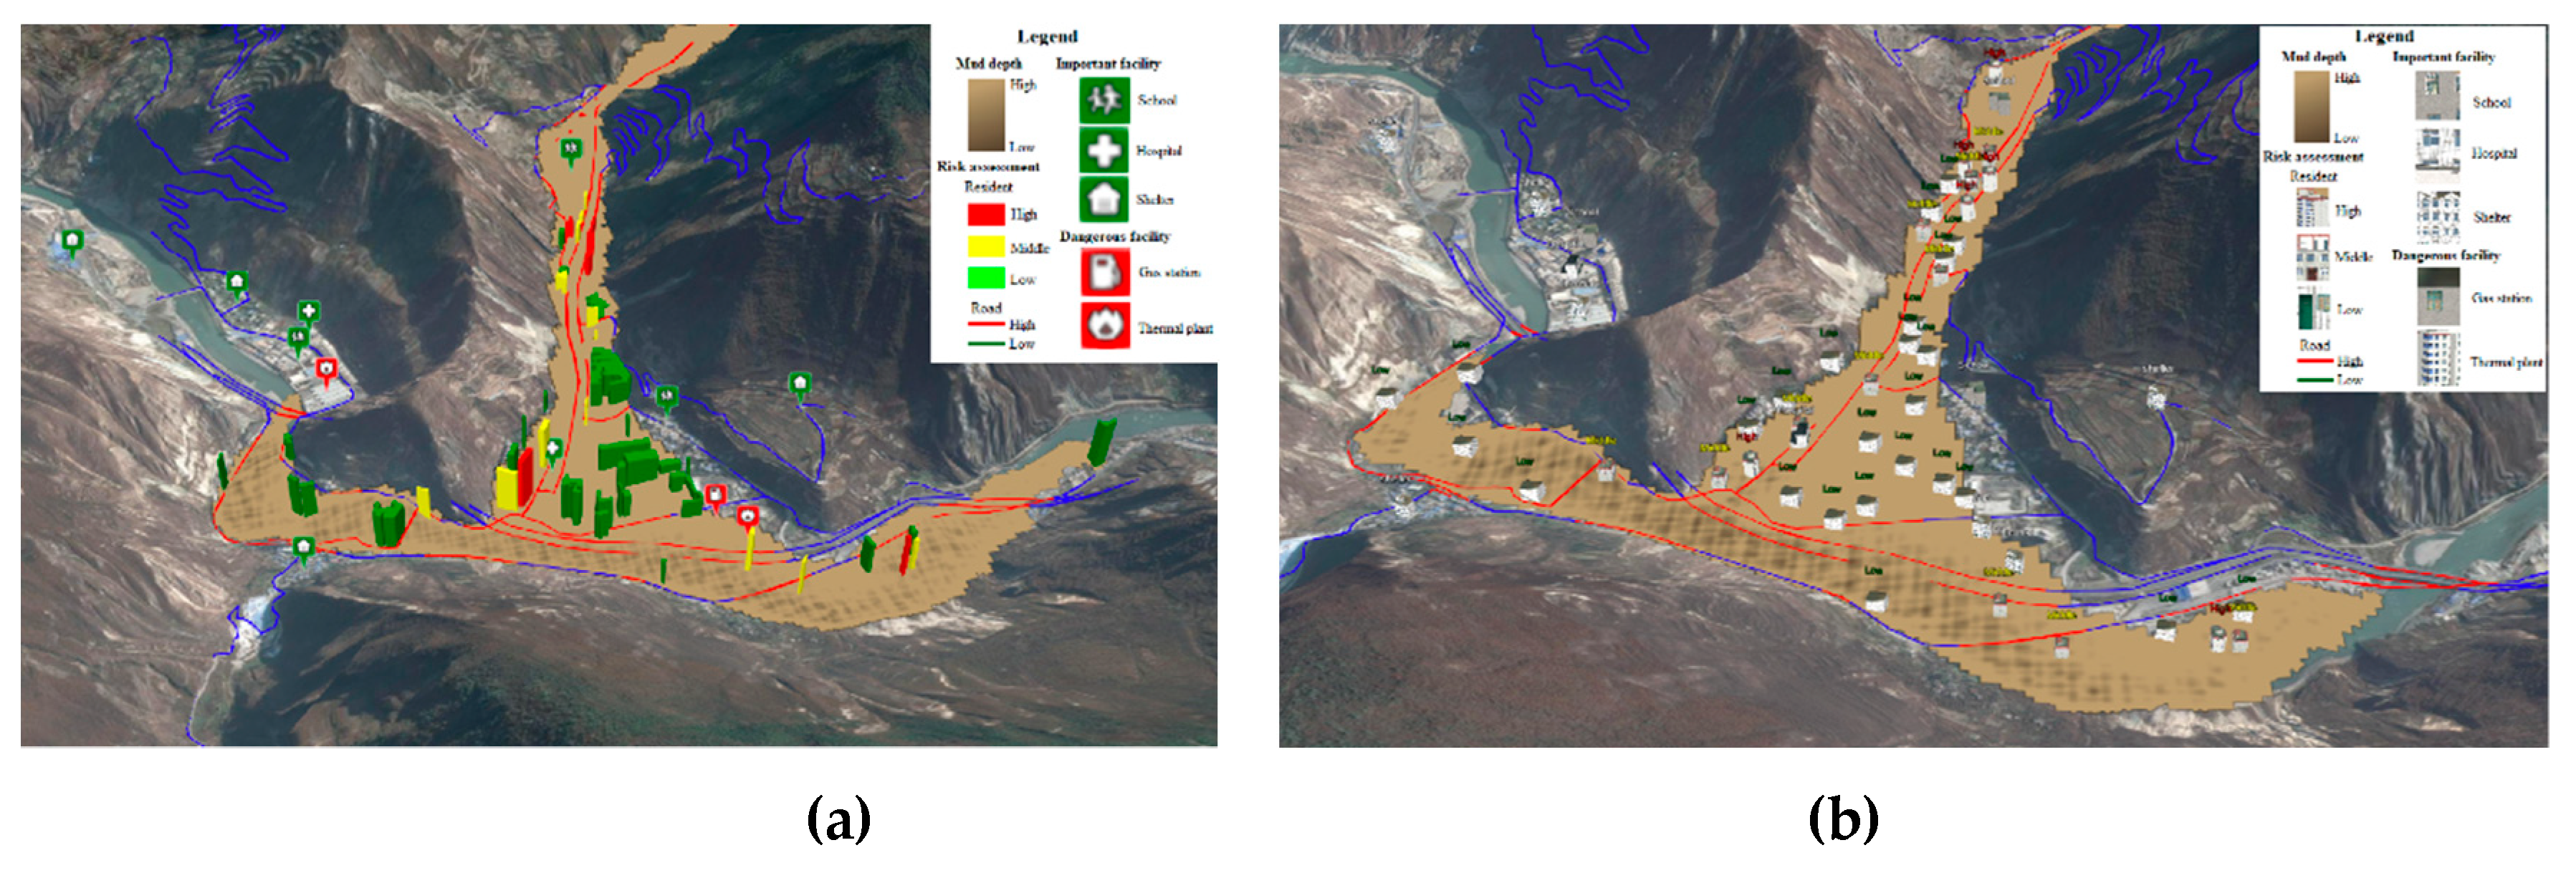
Important facilities, dangerous facilities, and residential buildings at risk were selected as identification objects in the cognitive contrast experiment of debris flow, and were represented by self-explanatory symbols and models with more detailed texture. To avoid the cognitive differences of participants caused by professional background and knowledge, we invited 30 participants, aged 22 to 30 years old, with professional backgrounds in geographic information systems (GIS)-related majors. The participants were randomly assigned to group A and group B. Group A was used to observe scene 1, which was constructed by self-explanatory symbols, photorealistic terrain scenes, and photorealistic debris flow evolution; scene 1 is shown in Figure 12a. Group B was used to observe scene 2, which was constructed by models with more detailed texture, photorealistic terrain scene, and photorealistic debris flow evolution; scene 2 is shown in Figure 12b.
(1) Implementation process
Participants observed and identified important facilities, dangerous facilities, and residential buildings at risk, and answered the following questions in turn during the observation process. Experimental scene objects are shown in Table 2:
1. What is the total number of important facilities, including the number of schools, hospitals, and shelters?
2. What is the total number of dangerous facilities, such as the number of gas stations and thermal power plants?
3. How many levels does the degree of risk of residential buildings have? Which of these risk levels has the largest number of residential buildings?
The above process started by clicking the left mouse button and ended by clicking the right mouse button and then counting stopped. The time spent identifying each object and the total time of the entire test process were automatically recorded by the system. The entire experimental process and requirements were explained to the participants in 3 minutes before the start of the test. After the experiment, participants were asked to observe the two scenes at the same time and evaluate their intuitive feelings.
(2) Evaluation criteria
This paper evaluated the experimental results from the answer accuracy and finish time, as shown in Table 3. The answer accuracy reflects the effectiveness of disaster information transmission, and the finish time reflects the participants’ cognitive efficiency when processing disaster information.
(3) Experimental results analysis
The average accuracy, finish time, and variance of the two groups were calculated according to the answer accuracy and finish time of each participant in groups A and B, as shown in Table 4.
The above results show that the average accuracy of group A participants was higher than 90%, and the average finish time was approximately 1 minute. The average accuracy of group B participants was approximately 80%, and the average completion time was approximately 3 minutes. This shows that the amount of disaster information in scene 1 was less than in scene 2 and that the self-explanatory symbol has a stronger ability to transmit information than the model with detailed texture. In addition, the average accuracy, average finish time, and variance of group A were lower than those of group B. These findings prove that the experimental results of group A were more stable and indicate that scene 1 had lower requirements for the participants’ cognitive abilities and would be more suitable for people with different knowledge backgrounds (such as the various types of users involved in disaster emergency response).
After the experiment, we asked participants to evaluate their intuitive experiences about scene 1 and scene 2. Most participants believed that scene 1 had less information than scene 2, and they were more easily attracted to the photorealistic model.

3.3.2. Rendering Efficiency of the Disaster Scene Experiment

This paper tested the visualization efficiency of scenes 1 and 2 to quantify the influence of the photorealistic expression on the rendering rate. We roamed through scene 1 and scene 2 along a certain path. The scene roaming direction was the same as the direction of the debris flow routing. The elevation of the roaming flight path was 800 m, and the flight time was 60 s.
In Figure 13, the green curve represents scene 1, in which the self-explanatory symbols were loaded. The red curve represents scene 2, in which the models with detailed texture were loaded. The frame rate represented by the green curve is higher than that of the red curve, which indicates that loading self-explanatory symbols had an obvious advantage in improving scene rendering efficiency compared with photorealistic visualization.

4. Conclusions and Future Work

Aiming to improve the low efficiency of scene visualization, disaster information recognition, and sharing difficulties, this paper proposed a fusion visualization method for disaster information based on self-explanatory symbols and photorealistic scene cooperation. First, the disaster scene was divided from the top to the bottom, and the geographic ontology was used to describe the concept of each scene object and its spatial semantic relationship. Second, a cube model was designed based on three indicators: The difficulty in obtaining disaster information, the influence of visualization efficiency, and the necessity of augmented expression. Furthermore, the cube was used to illustrate the principles of self-explanatory symbols and photorealistic scene cooperation. Third, to ensure the standardization of the scene, spatial semantic constraint rules were constructed to guide the fusion of scene objects. Finally, a debris flow disaster that occurred in Qipan gully was selected for experimental analysis. In this study, a debris flow scene based on spatial semantic constraints was constructed, and the difference among the self-explanatory symbols and photorealistic scene cooperation and photorealistic visualization on the cognition efficiency and rendering rate was tested. The experimental results show that the proposed method can efficiently realize the fusion visualization of disaster information. Additionally, this method can also effectively express disaster information and maintain high-efficiency visualization, and provide decision-making information support to users involved in the disaster process.
Despite the achievements described above, this paper has some shortcomings. For example, due to the lack of photorealistic data, only residential buildings at risk, dangerous facilities, and important facilities were used to test the influence of self-explanatory symbols and detailed models on the cognition efficiency and rendering rate. Therefore, more scene object comparisons should be considered in future work. In addition, our experiments regarding cognition efficiency of the disaster scene in this paper should be modified to utilize eye-tracking measurements in future work.

Author Contributions

Weilian Li, Jun Zhu, and Yungang Cao provided the initial idea for this study; Weilian Li, Yunhao Zhang, and Ya Hu designed and performed the experiments; Weilian Li, Bingli Xu, Lin Fu, and Pengcheng Huang recorded and analyzed the experimental results; Yakun Xie and Lingzhi Yin contributed the experimental data and provided important suggestions; Weilian Li wrote this paper.

Acknowledgments

This paper was supported by the National Key Research and Development Program of China (Grant No. 2016YFC0803105), the National Natural Science Foundation of China (Grant No. 41801297; 41871289; 41771442), and the Fundamental Research Funds for the Central Universities (Grant No. 2682018CX35).

Conflicts of Interest

The authors declare no conflicts of interest.

References

  1. Fan, Y.D.; Wu, W.; Wang, W.; Liu, M.; Wen, Q. Research progress of disaster remote sensing in China. J. Remote Sens. 2016, 20, 523–535. [Google Scholar]
  2. Zhao, Z.C. Seriously study and implement the spirit of General Secretary Xi Jinping’s important speech, comprehensively improve the ability of disaster prevention, mitigation and relief. Disast Reduct. China. 2016, 17, 11. [Google Scholar]
  3. Kelman, I. Climate change and the Sendai framework for disaster risk reduction. Int. J. Disast Risk Sci. 2015, 6, 117–127. [Google Scholar] [CrossRef]
  4. Aitsi-Selmi, A.; Egawa, S.; Sasaki, H.; Wannous, C.; Murrey, V. The Sendai framework for disaster risk reduction: Renewing the global commitment to people’s resilience, health, and well-being. Int. J. Disast Risk Sci. 2015, 6, 164–176. [Google Scholar] [CrossRef]
  5. Yodmani, S. Disaster Risk Management and Vulnerability Reduction: Protecting the Poor. In Proceedings of the Social Protection Workshop 6: Protecting Communities—Social Funds and Disaster Management, Manila, Philippines, 5–9 February 2001. [Google Scholar]
  6. Shi, P.J. Retrospect and prospect of China’s comprehensive disaster prevention, disaster mitigation and disaster relief. Disast Reduct. China 2016, 19, 16–19. [Google Scholar]
  7. Carter, W.N. Disaster Management: A Disaster Manager’s Handbook; Asian Development Bank: Mandaluyong City, Philippines, 2008. [Google Scholar]
  8. Pearce, L. Disaster management and community planning, and public participation: How to achieve sustainable hazard mitigation. Nat. Hazards 2003, 28, 211–228. [Google Scholar] [CrossRef]
  9. Center, A.D.P. Total Disaster Risk Management: Good Practices; Asian Disaster Reduction Center: Kobe, Japan, 2005. [Google Scholar]
  10. Comfort, L.K. Risk, security, and disaster management. Annu. Rev. Polit. Sci. 2005, 8, 335–356. [Google Scholar] [CrossRef]
  11. Desai, B.; Maskrey, A.; Peduzzi, P.; De Bono, A.; Herold, C. Making Development Sustainable: The Future of Disaster Risk Management, Global Assessment Report on Disaster Risk Reduction; United Nations Office for Disaster Risk Reduction (UNISDR): Genève, Switzerland, 2015. [Google Scholar]
  12. Denolle, M.A.; Dunham, E.M.; Prieto, G.A.; Beroza, G.C. Strong ground motion prediction using virtual earthquakes. Science 2014, 343, 399–404. [Google Scholar] [CrossRef] [PubMed]
  13. Cui, P. Progress and prospects in research on mountain hazards in China. Prog. Geogr. 2014, 33, 145–152. [Google Scholar]
  14. Fan, W.C.; Weng, W.G.; Wu, G.; Meng, Q.F.; Yang, L.X. Basic scientific problems of national security management. Bull. Natl. Nat. Sci. Found. China 2015, 29, 436–443. [Google Scholar]
  15. Peters, S.; Jahnke, M.; Murphy, C.E.; Meng, L.; Abdul-Rahman, A. Cartographic Enrichment of 3D City Models—State of the Art and Research Perspectives. In Advances in 3D Geoinformation. Lecture Notes in Geoinformation and Cartography; Abdul-Rahman, A., Ed.; Springer: Cham, Switzerland, 2017. [Google Scholar]
  16. Reichenbacher, T.; Swienty, O. Attention-Guiding Geovisualization. In Proceedings of the 10th AGILE International Conference on Geographic Information Science, Aalborg, Denmark, 8–11 May 2007; 2007. [Google Scholar]
  17. Döllner, J.; Kyprianidis, J.E. Approaches to Image Abstraction for Photorealistic Depictions of Virtual 3D Models. In Proceedings of the First ICA Symposium for Central and Eastern Europe, Vienna, Austria, 16–17 February 2009; Springer: Berlin/Heidelberg, Germany. [Google Scholar]
  18. Lin, H.; Chen, M.; Lu, G.N.; Zhu, Q.; Gong, J.H.; You, X.; Wen, Y.N.; Xu, B.L.; Hu, M.Y. Virtual geographic environments (VGEs): A new generation of geographic analysis tool. Earth Sci. Rev. 2013, 126, 74–84. [Google Scholar] [CrossRef]
  19. Chen, M.; Lin, H.; Kolditz, O.; Chen, C. Developing dynamic virtual geographic environments (VGEs) for geographic research. Environ. Earth Sci. 2015, 74, 6975–6980. [Google Scholar] [CrossRef] [Green Version]
  20. Kim, J.C.; Jung, H.; Kim, S.; Chung, K. Slope based intelligent 3D disaster simulation using physics engine. Wirel. Pers. Commun. 2016, 86, 183–199. [Google Scholar] [CrossRef]
  21. Lin, H.; Chen, M. Managing and sharing geographic knowledge in virtual geographic environments (VGEs). Ann. Gis. 2015, 21, 261–263. [Google Scholar] [CrossRef]
  22. Gennady, A.; Natalia, A.; Urska, D.; Doris, D.; Jason, D.; Sara, I.F.; Mikael, J.; Menno-Jan, K.; Heidrun, S.; Christian, T. Space, time and visual analytics. Int. J. Geogr. Inf. Sci. 2010, 24, 1577–1600. [Google Scholar] [Green Version]
  23. Bodum, L. Modelling Virtual Environments for Geovisualization: A focus on representation. In Exploring Geovisualization; Dykes, J., MacEachren, A.M., Kraak, M.-J., Eds.; Elsevier: Oxford, UK, 2005; pp. 389–402. [Google Scholar]
  24. Sherman, W.R.; Craig, A.B. Understanding Virtual Reality: Interface, Application, and Design; Morgan Kaufmann Publishers Inc.: San Francisco, CA, USA, 2002. [Google Scholar]
  25. MacEachren, A.M. How Maps Work: Representation, Visualization and Design; Paper Back; Guilford Press: New York, NY, USA, 2004; 513p. [Google Scholar]
  26. Hu, Y.; Zhu, J.; Li, W.; Zhang, Y.; Zhu, Q.; Qi, H.; Zhang, H.; Cao, Z.; Yang, W.; Zhang, P. Construction and optimization of three-dimensional disaster scenes within mobile virtual reality. ISPRS Int. J. Geo. Inf. 2018, 7, 215. [Google Scholar] [CrossRef]
  27. Zhu, L.; Hyyppä, J.; Kukko, A.; Kaartinen, H.; Chen, R. Photorealistic building reconstruction from mobile laser scanning data. Remote Sens. 2011, 3, 1406–1426. [Google Scholar] [CrossRef]
  28. Bunch, R.L.; Lloyd, R.E. The cognitive load of geographic information. Prof. Geogr. 2006, 58, 209–220. [Google Scholar] [CrossRef]
  29. Glander, T.; Döllner, J. Abstract representations for interactive visualization of virtual 3D city models. Comput. Environ. Urban Syst. 2009, 33, 375–387. [Google Scholar] [CrossRef]
  30. Bandrova, T. Designing of Symbol System For 3D City Maps. In Proceedings of the 20th International Cartographic Conference, Beijing, China, 6–10 August 2001; pp. 1002–1010. [Google Scholar]
  31. Petrovic, D.; Masera, P. Analysis of User’s Response on 3D Cartographic Presentations. In Proceedings of the 5th Mountain Cartography Workshop of the Commission on Mountain Cartography of the ICA, Bohinj, Slovenia, 29 March–1 April 2006. [Google Scholar]
  32. Auer, M.; Agugiaro, G.; Billen, N.; Loos, L.; Zipf, A. Web-based visualization and query of semantically segmented multiresolution 3d models in the field of cultural heritage. ISPRS Ann. Photogramm. Remote Sens. Spat. Inf. Sci. 2014, 2, 33. [Google Scholar] [CrossRef]
  33. Meyer, V.; Kuhlicke, C.; Luther, J.; Fuchs, S.; Priest, S.; Dorner, W.; Serrhini, K.; Pardoe, J.; McCarthy, S.; Seidel, J.; et al. Recommendations for the user-specific enhancement of flood maps. Nat. Hazards Earth Syst. Sci. 2012, 12, 1701–1716. [Google Scholar] [CrossRef] [Green Version]
  34. Peng, G.Q.; Yue, S.S.; Li, Y.T.; Song, Z.Y.; Wen, Y.N. A Procedural construction method for interactive map symbols used for disasters and emergency response. ISPRS Int. J. Geo Inf. 2017, 6, 95. [Google Scholar] [CrossRef]
  35. Couclelis, H. Ontologies of geographic information. Int. J. Geogr. Inf. Sci. 2010, 24, 1785–1809. [Google Scholar] [CrossRef]
  36. Evans, S.Y.; Todd, M.; Baines, I.; Hunt, T.; Morrison, G. Communicating flood risk through three-dimensional visualization. Proc. Inst. Civ. Eng. Civ. Eng. 2014, 167, 48–55. [Google Scholar]
  37. Clemens, P. OpenGIS Geography Markup Language (GML) Encoding Standard, Version 3.2.1; OGC Doc. No. 07-036; Open Geospatial Consortium: Wayland, MA, USA, 2014. [Google Scholar]
  38. Classification of Earthquake Damage to Buildings and Special Structures. Basic Terms on Natural Disaster Management; GB/T 24335-2009; Standardization Administration of the People’s Republic of China: Beijing, China, 2009.
  39. Basic Terms on Natural Disaster Management; GBT 26376-2010; Standardization Administration of the People’s Republic of China: Beijing, China, 2010.
  40. Zhu, J.; Zhang, H.; Chen, M.; Xu, Z.; Qi, H.; Yin, L.Z.; Wang, J.H.; Hu, Y. A procedural modelling method for virtual high-speed railway scenes based on model combination and spatial semantic constraint. Int. J. Geogr. Inf. Sci. 2015, 29, 1059–1080. [Google Scholar] [CrossRef]
  41. Dong, W.H.; Wang, S.K.; Chen, Y.Z.; Meng, L.Q. Using eye tracking to evaluate the usability of flow maps. ISPRS Int. J. Geo. Inf. 2018, 7, 281. [Google Scholar] [CrossRef]
  42. Dong, W.H.; Zheng, L.Y.; Liu, B.; Meng, L.Q. Using eye tracking to explore differences in map-based spatial ability between geographers and non-geographers. ISPRS Int. J. Geo. Inf. 2018, 7, 337. [Google Scholar] [CrossRef]
  43. Liu, B.; Dong, W.; Meng, L. Using eye tracking to explore the guidance and constancy of visual variables in 3D visualization. ISPRS Int. J. Geo. Inf. 2017, 6, 274. [Google Scholar] [CrossRef]
  44. Popelka, S.; Brychtova, A. Eye-tracking study on different perception of 2d and 3d terrain visualisation. Cart. J. 2013, 50, 240–246. [Google Scholar] [CrossRef]
  45. Yin, L.Z.; Zhu, J.; Li, Y.; Zeng, C.; Zhu, Q.; Qi, H.; Liu, M.W.; Li, W.L.; Cao, Z.Y.; Yang, W.J.; et al. A virtual geographic environment for debris flow risk analysis in residential areas. ISPRS Int. J. Geo. Inf. 2017, 6, 377. [Google Scholar] [CrossRef]
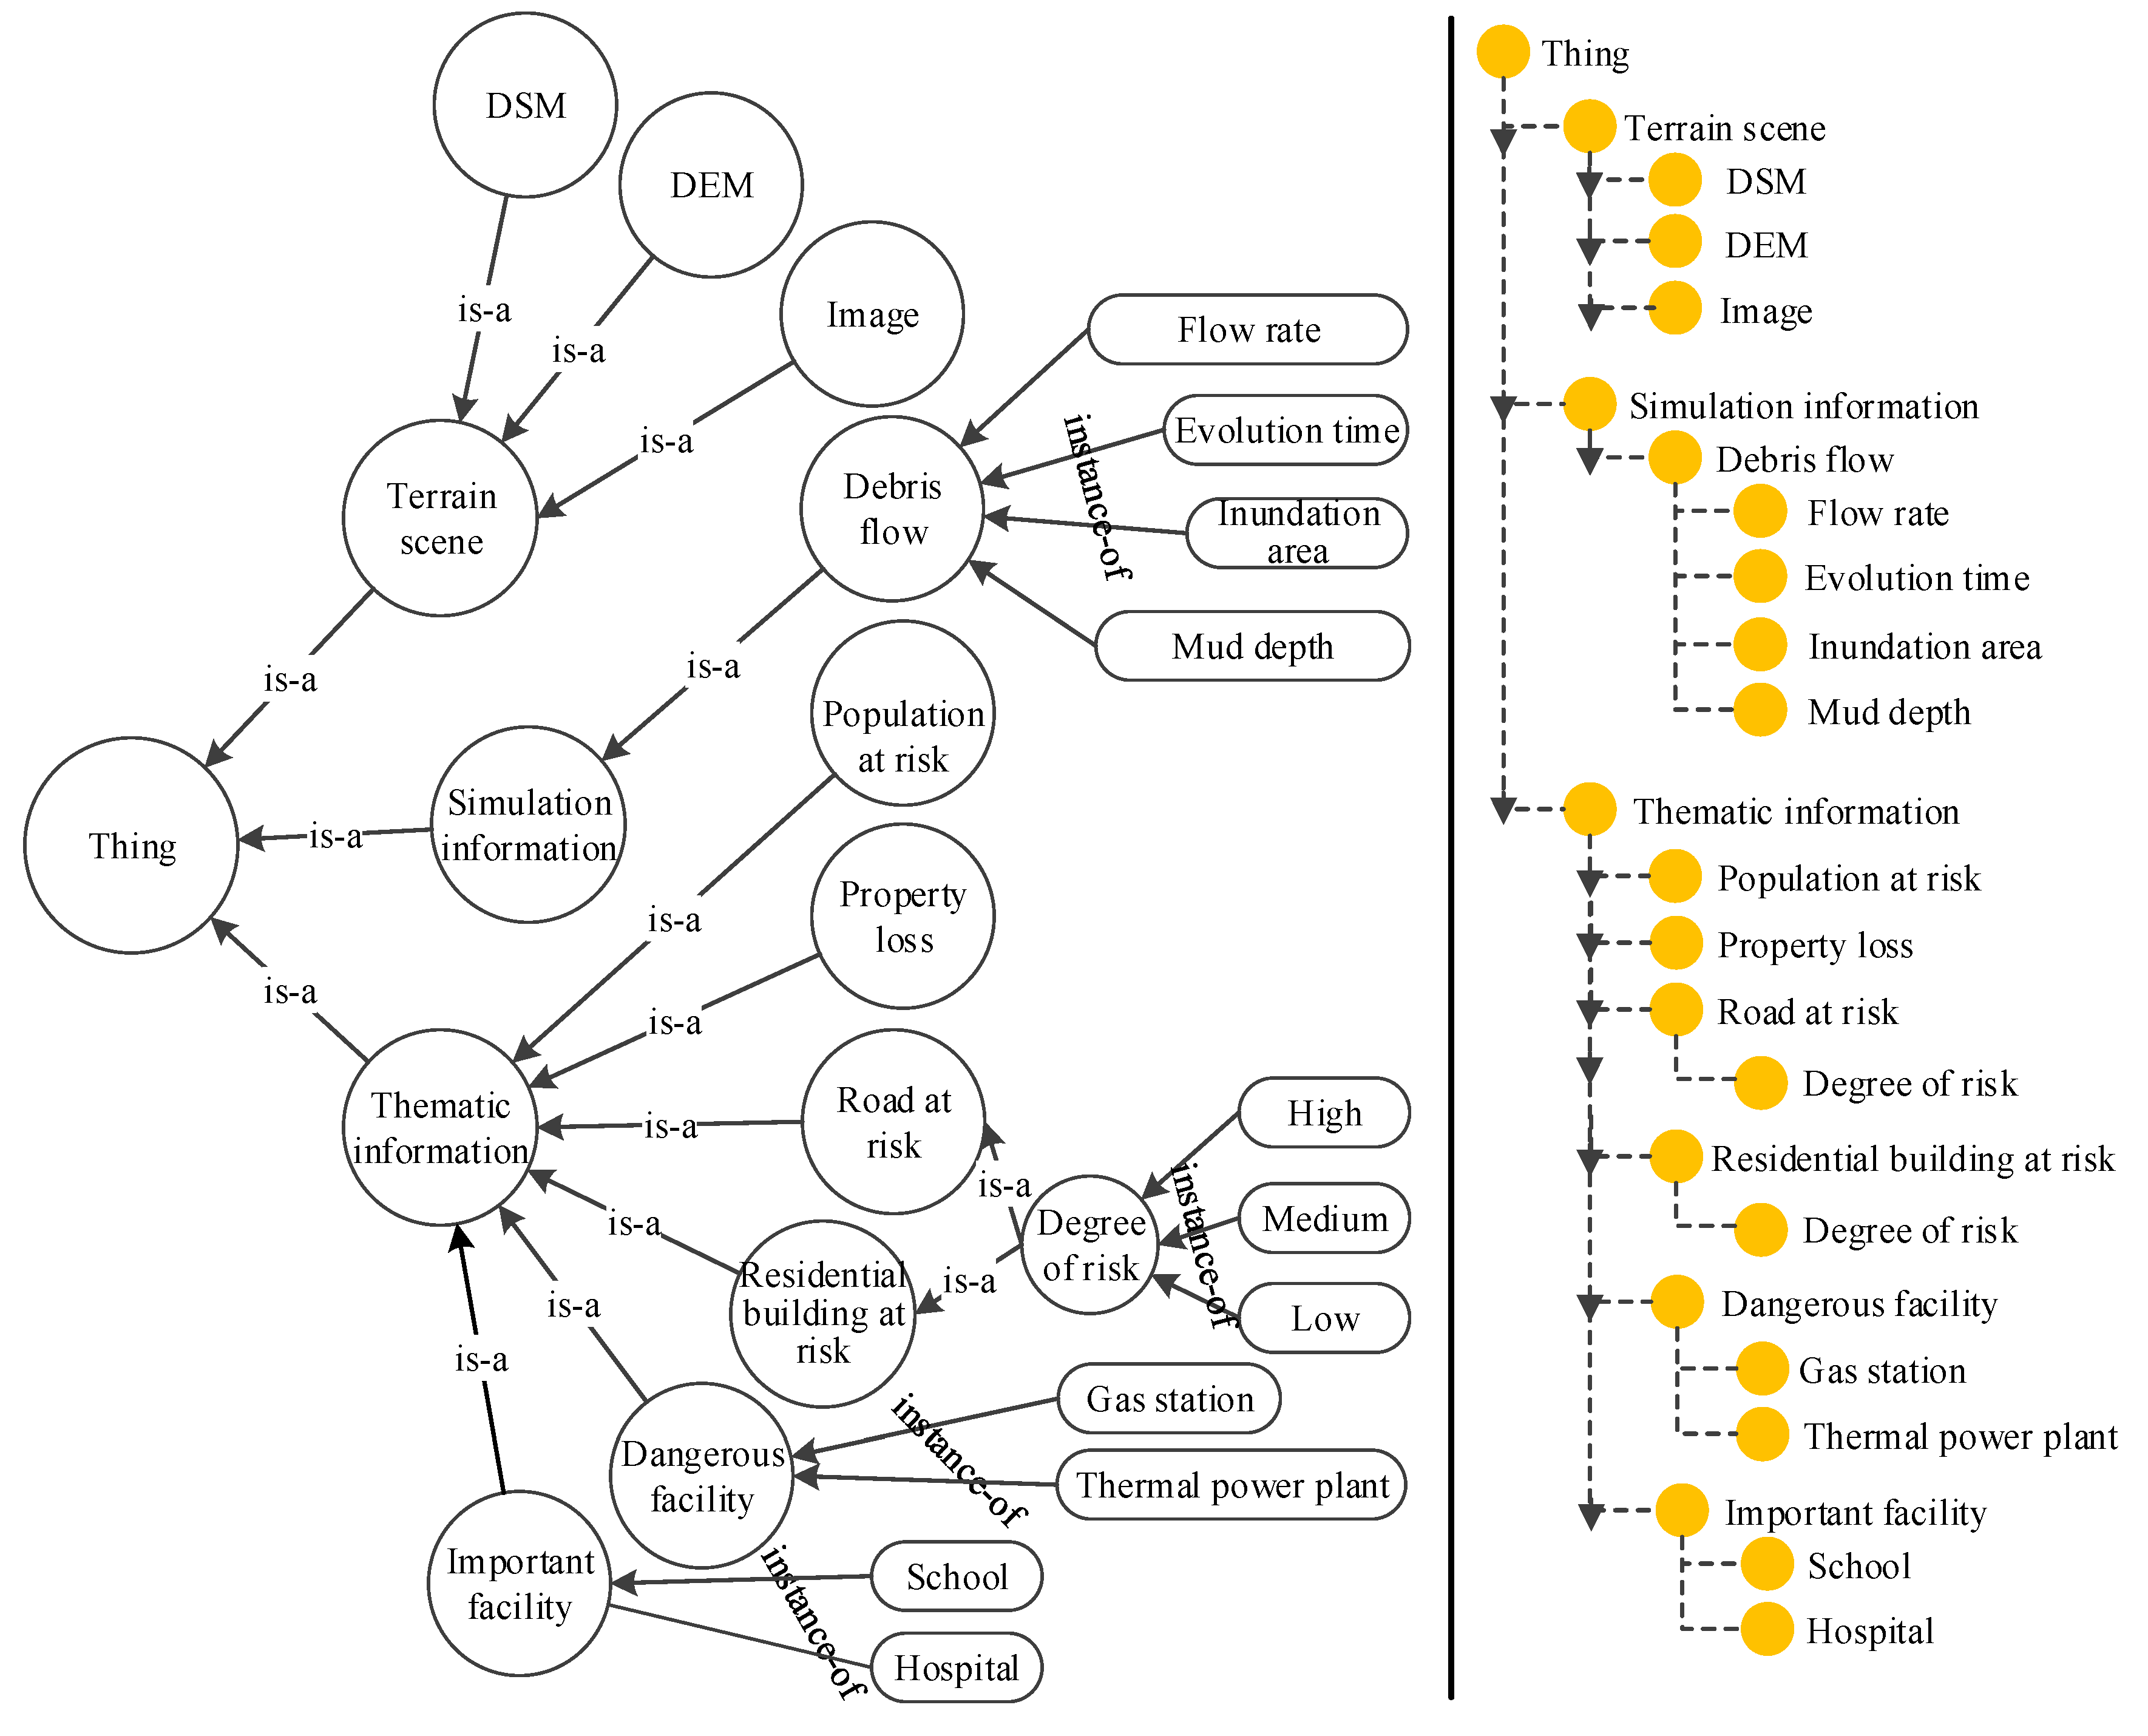
Figure 1. Concept hierarchy of the geographical ontology in a debris flow disaster scene.
Ijgi 08 00104 g001
Figure 2. Continuous hierarchy of non-photorealistic and photorealistic expression.
Ijgi 08 00104 g002
Figure 3. Cube model of self-explanatory symbols and photorealistic scene cooperation.
Ijgi 08 00104 g003
Figure 4. Spatial semantic constraints fusion visualization process.
Ijgi 08 00104 g004
Figure 5. Spatial position and orientation.
Ijgi 08 00104 g005
Figure 6. Fusion of disaster information with attribute category constraints.
Ijgi 08 00104 g006
Figure 7. The design of the cognition and visualization efficiency of disaster scene experiments.
Ijgi 08 00104 g007
Figure 8. Prototype system and study area.
Ijgi 08 00104 g008
Figure 9. Construction of debris flow scenes with spatial location constraints.
Ijgi 08 00104 g009
Figure 10. Attribute information fusion of residential buildings in risk.
Ijgi 08 00104 g010
Figure 11. Fusion visualization of debris flow disaster scenes with spatial semantic constraints.
Ijgi 08 00104 g011
Figure 12. Tests of the difference between scene 1 and scene 2 on cognition efficiency: (a) Scene 1; and (b) scene 2.
Ijgi 08 00104 g012
Figure 13. Tests of the difference between scene 1 and scene 2 on the rendering frame rate.
Ijgi 08 00104 g013
Table 1. Disaster data classification and processing.
CategoryContentData Format
BeforeAfter
Basic geographic dataTerrain data/image data.tif.terrain/.png
Debris flow Simulation dataLocation/range/depth/velocity.txt.json
Thematic analysis dataResidential buildings/roads/important facilities/dangerous facilities/population .shp/.txt/.3ds.json/.glTF/.png
Table 2. Experimental scene objects.
Test GroupsVisualization TypesImportant FacilitiesDangerous FacilitiesDegree of Risk of Residential Buildings
ASelf-explanatory symbolsSchools, hospitals, sheltersGas station, thermal power plantHigh, medium, low
BDetailed texture, annotations
Table 3. Evaluation criterion.
Evaluation criterionIndexDescribe
AccuracyScene object identification and question and answer accuracy
TimeThe average time taken to finish the cognitive experiment
Table 4. Evaluation index.
Evaluation IndexGroup AGroup B
Average accuracy (%)/variance91.93/94.4980.20/159.03
Average finish time (s)/variance62.20/332.45168.93/3361.78