An Integrated Framework Combining Multiple Human Activity Features for Land Use Classification


Abstract
1. Introduction
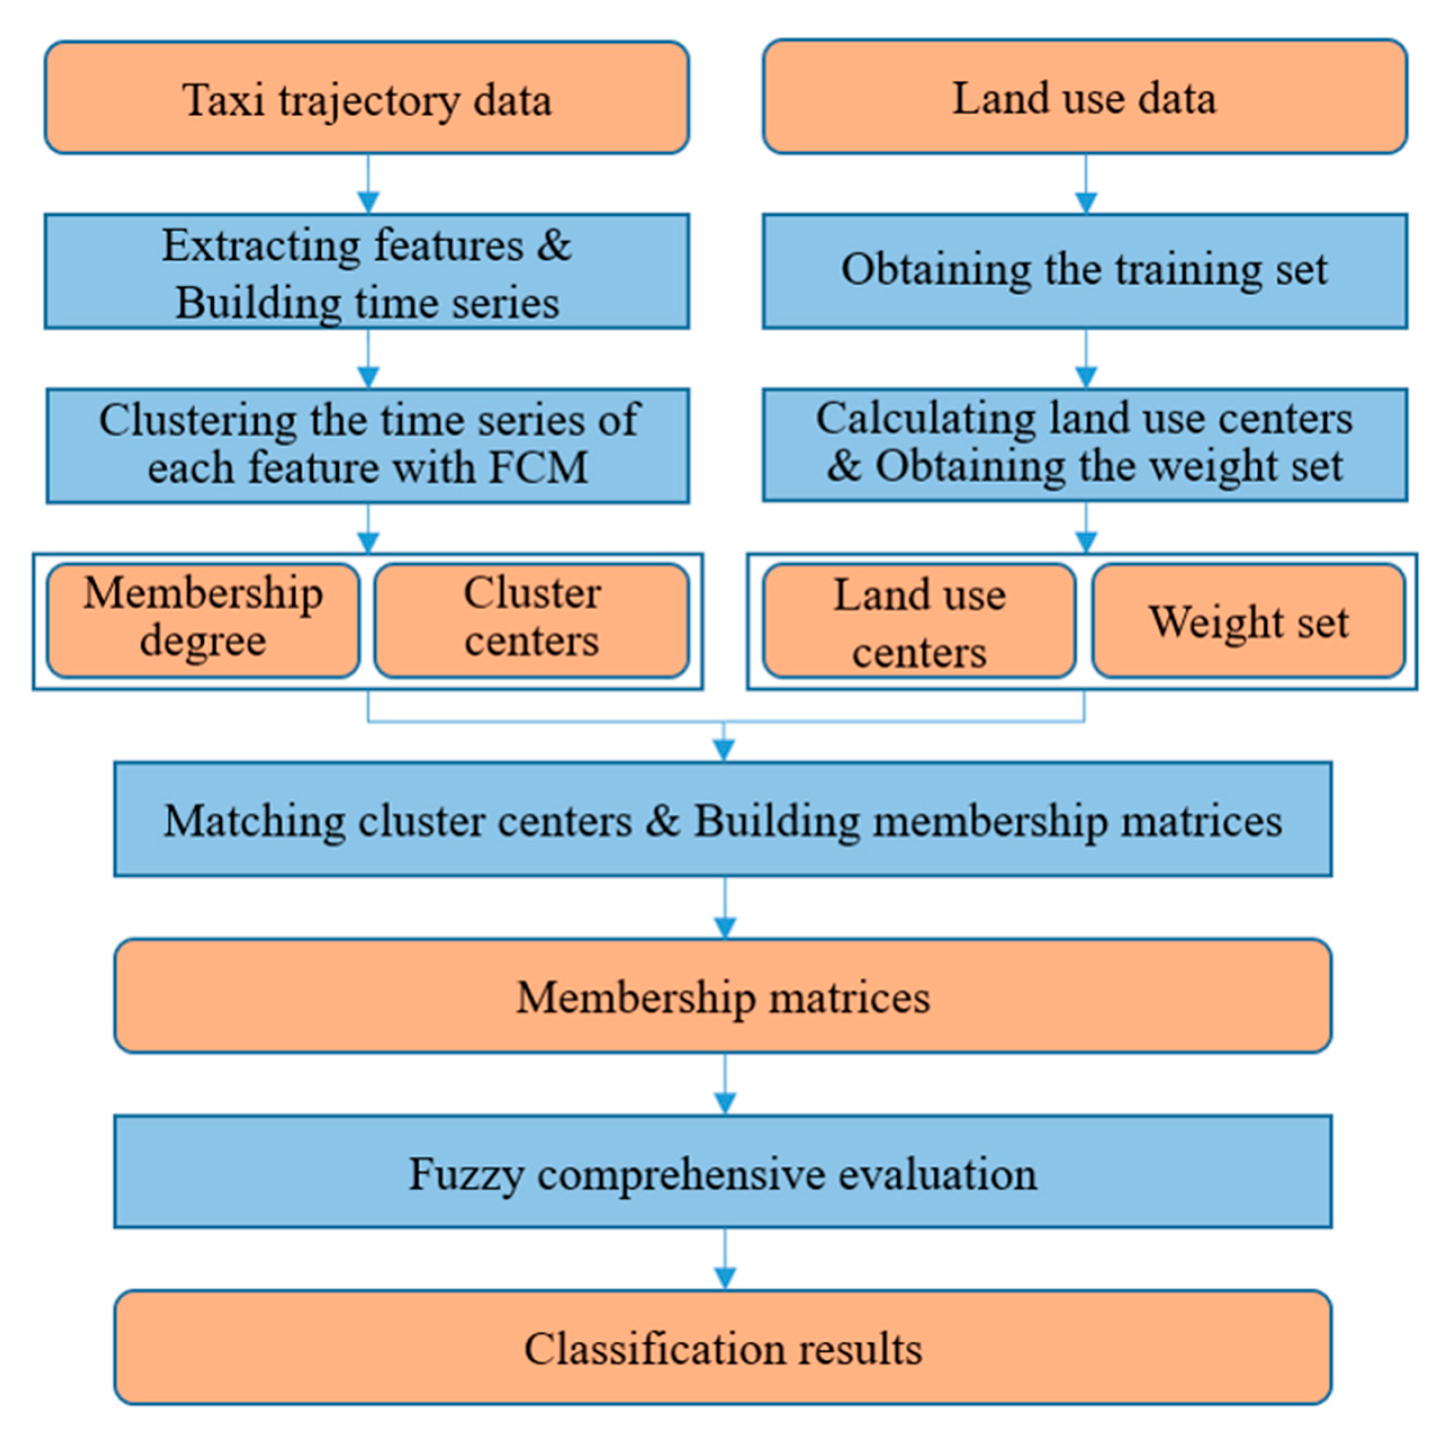
2. Method
2.1. Extracting Features and Constructing Time Series
2.2. Constructing the Membership Matrix
2.3. Determining land use types
3. Case Study Using Taxi Trajectory Data from Nanjing
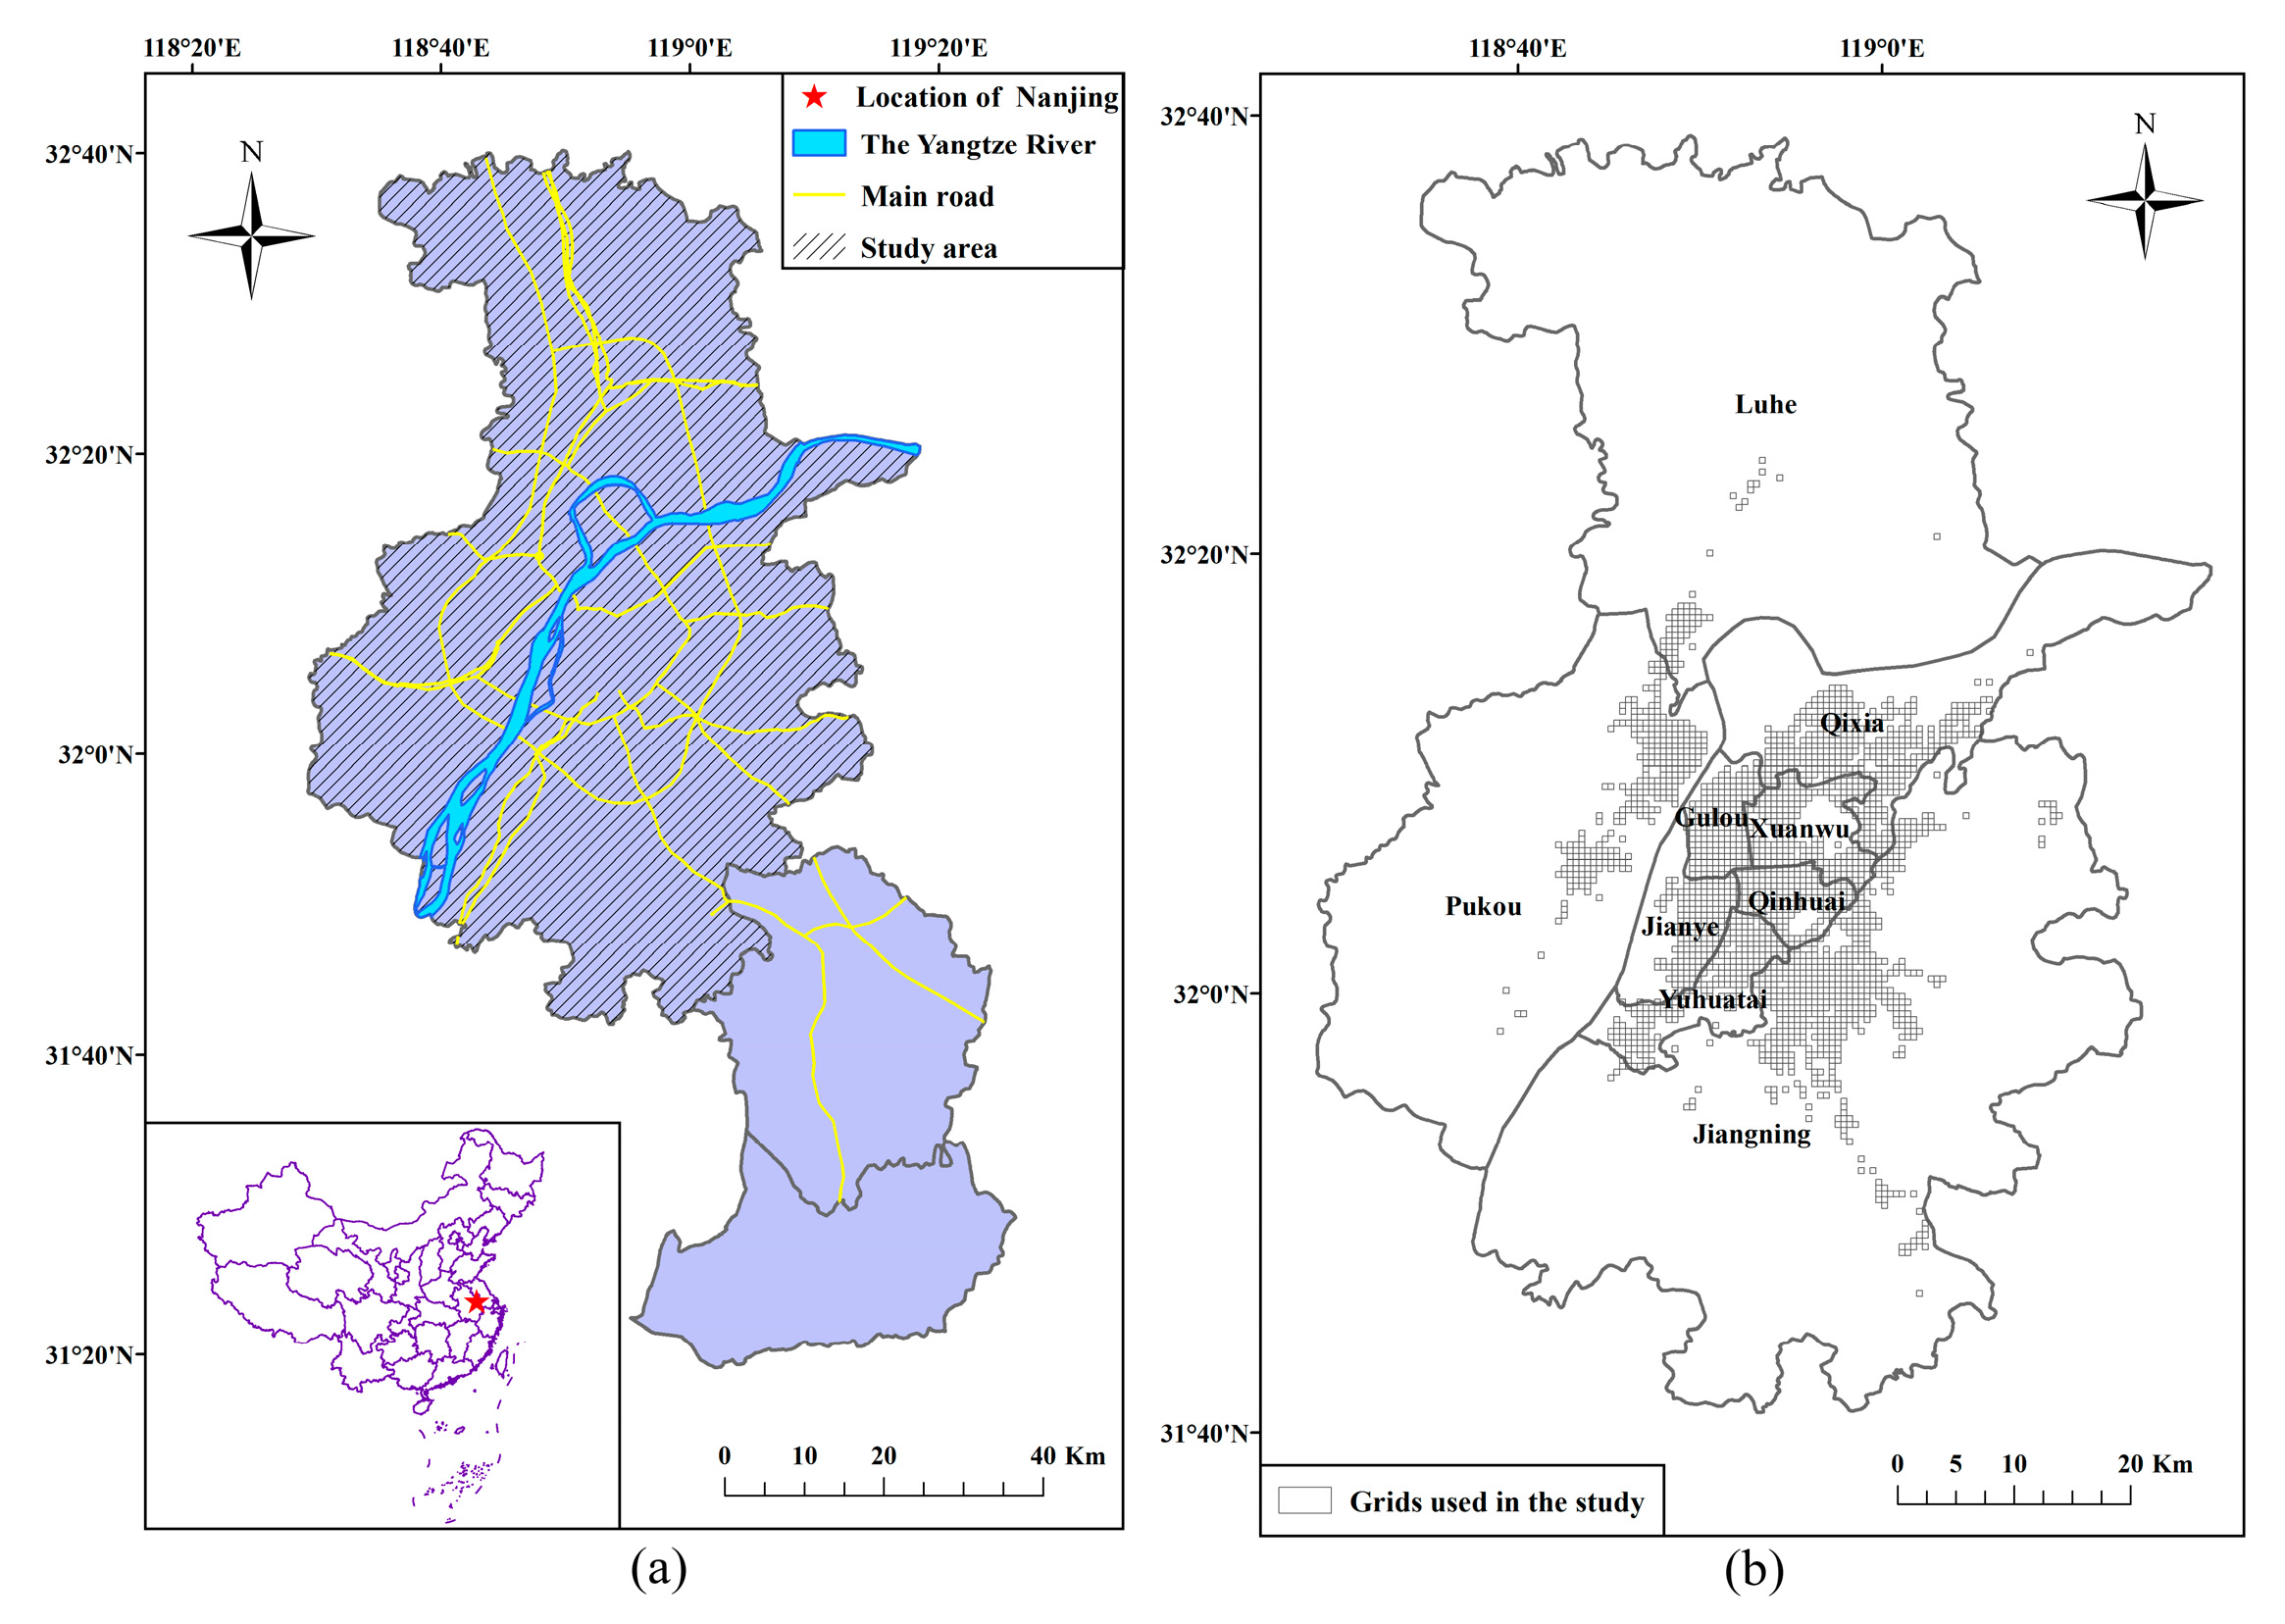
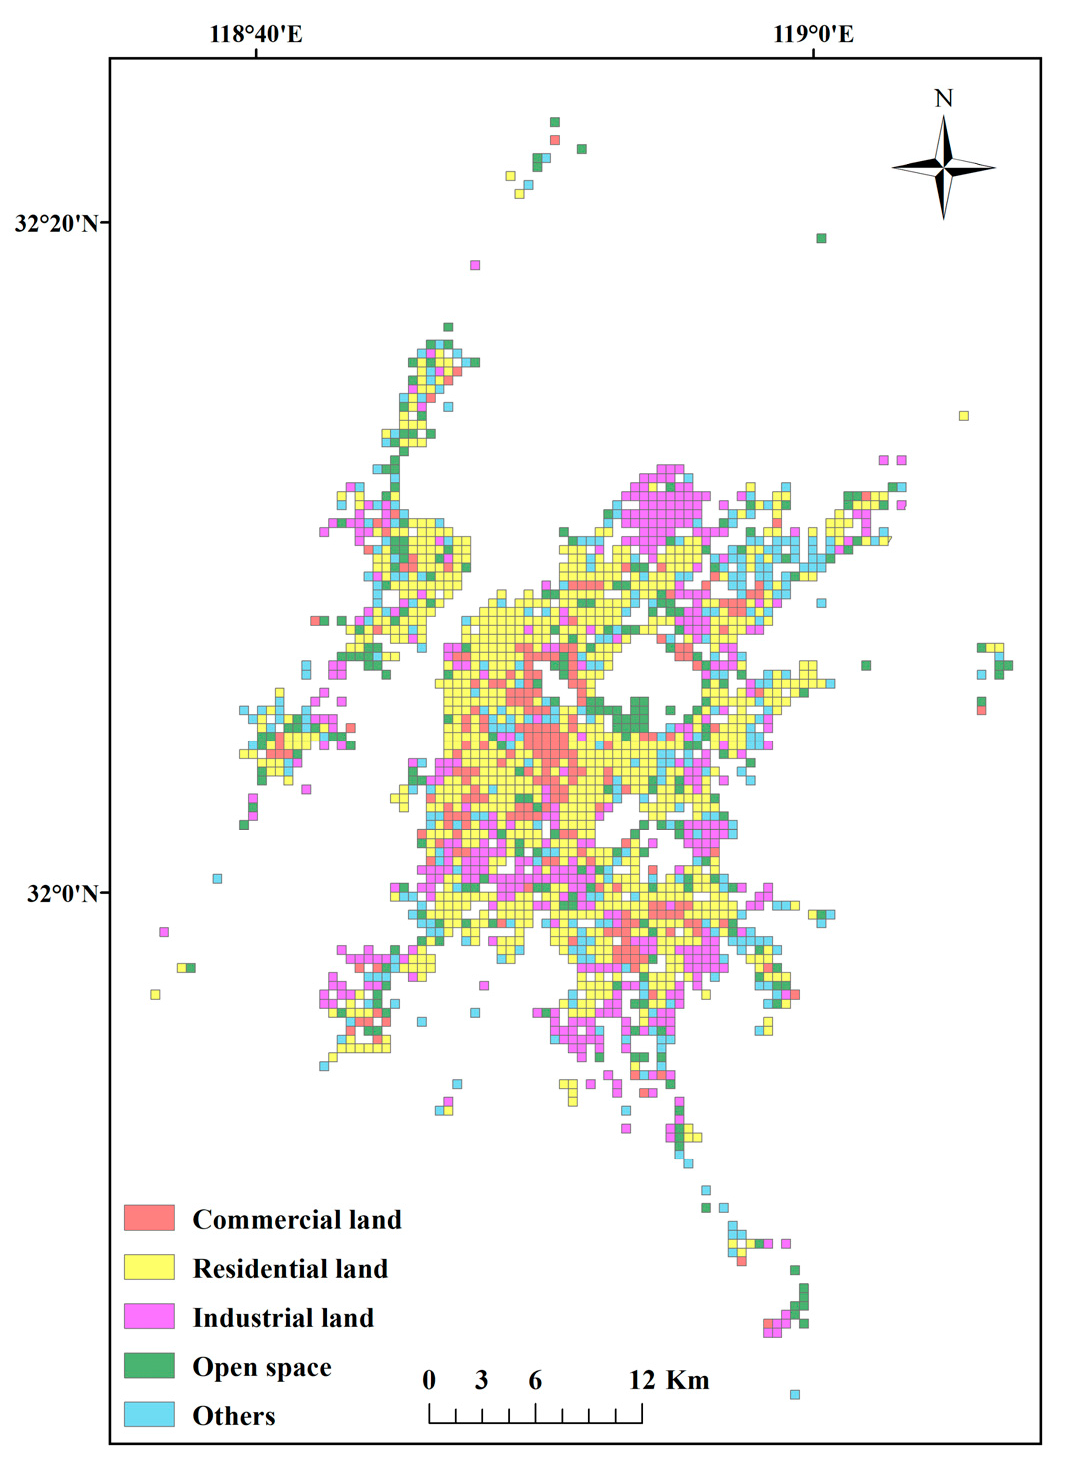
3.1. Study Area and Data Preparation
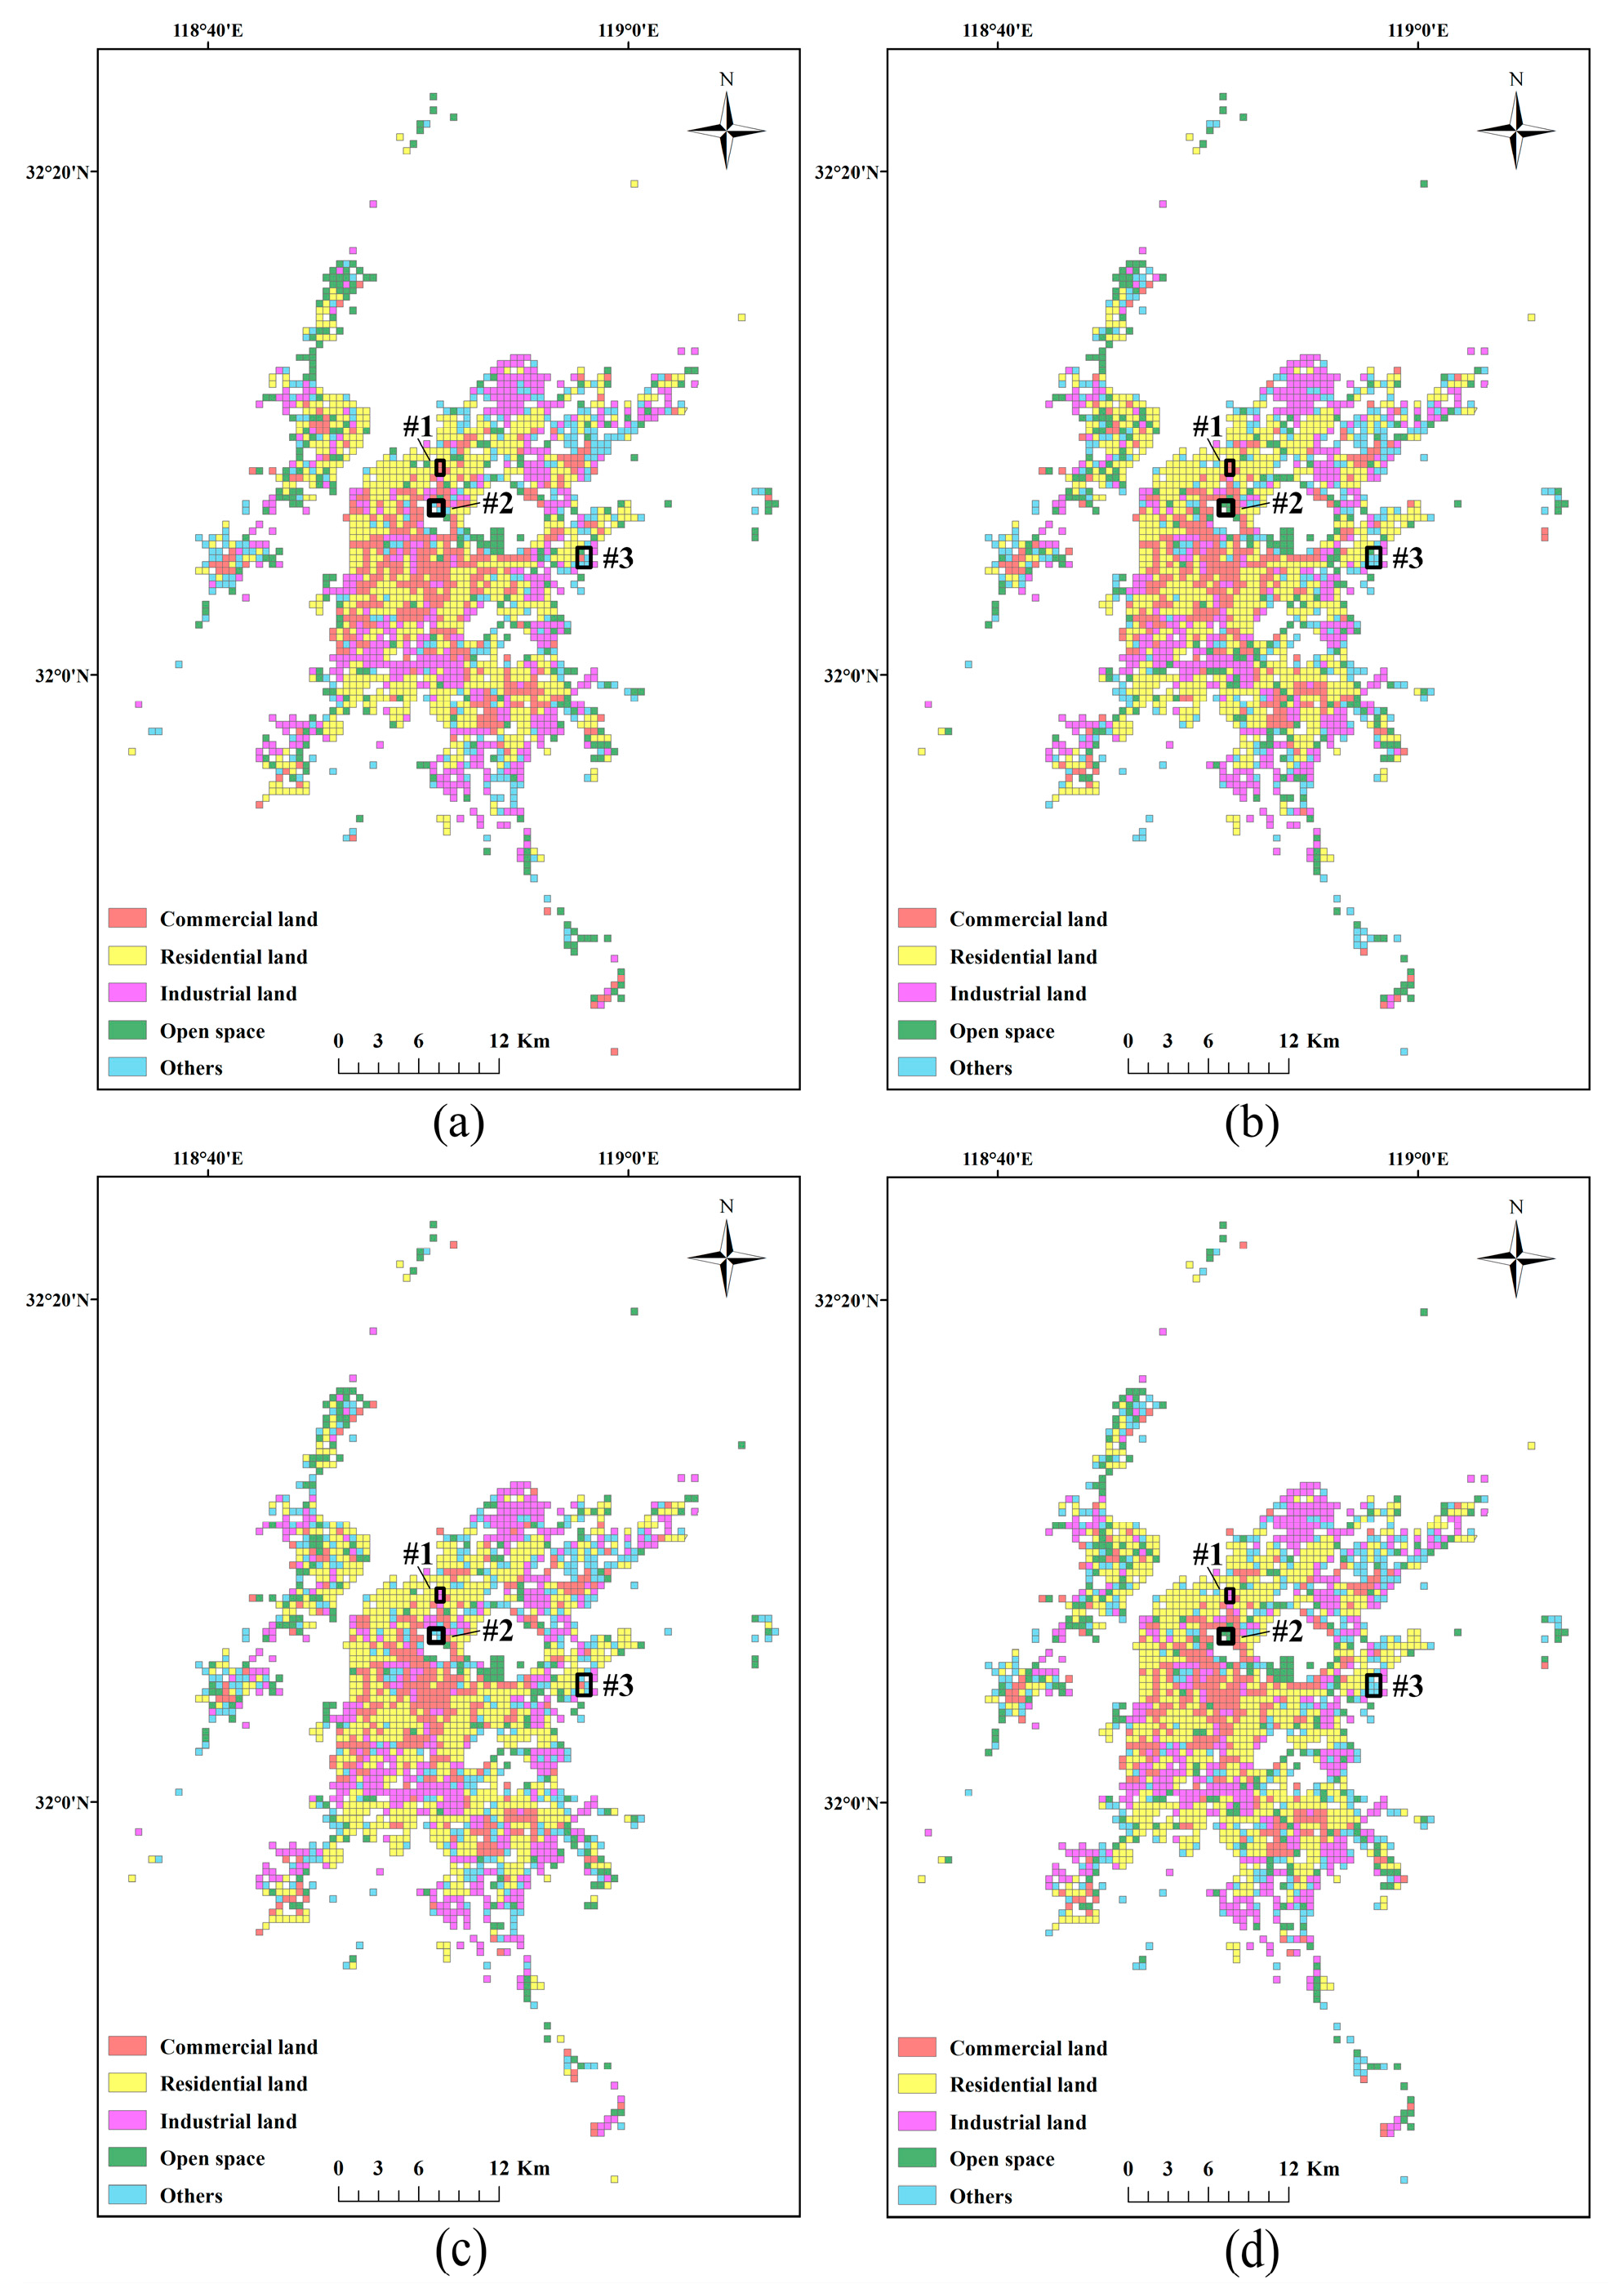
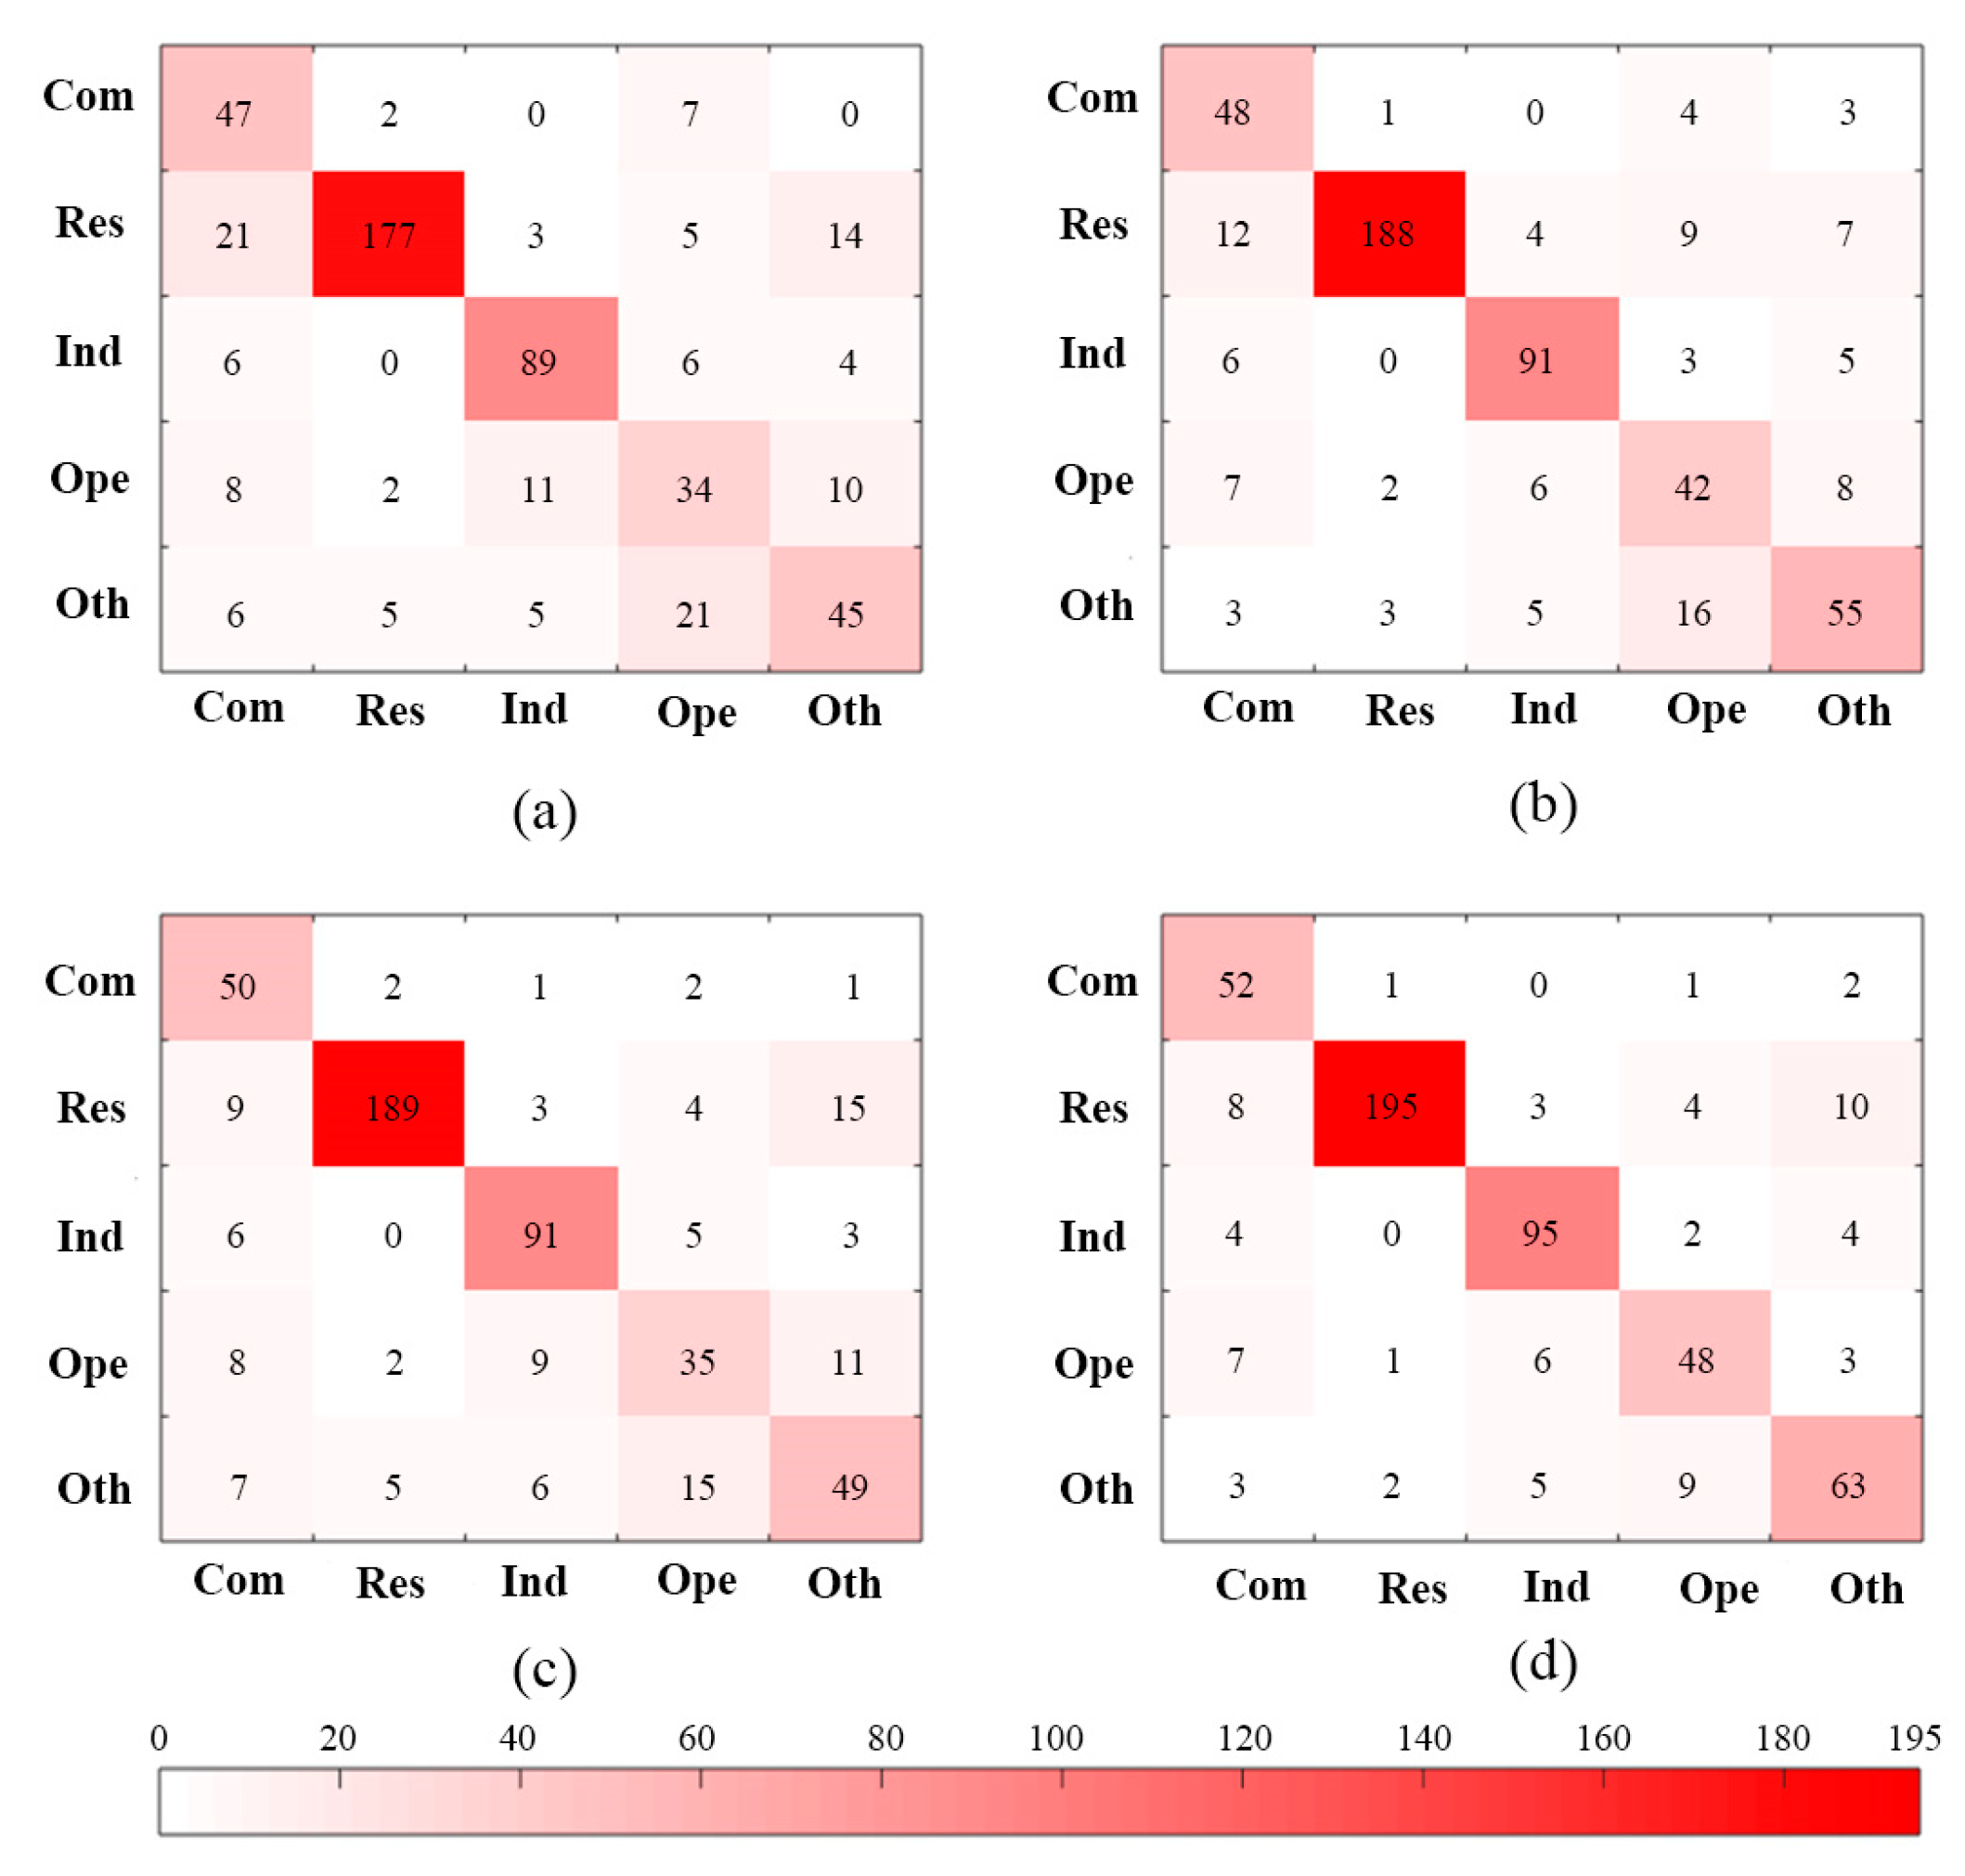
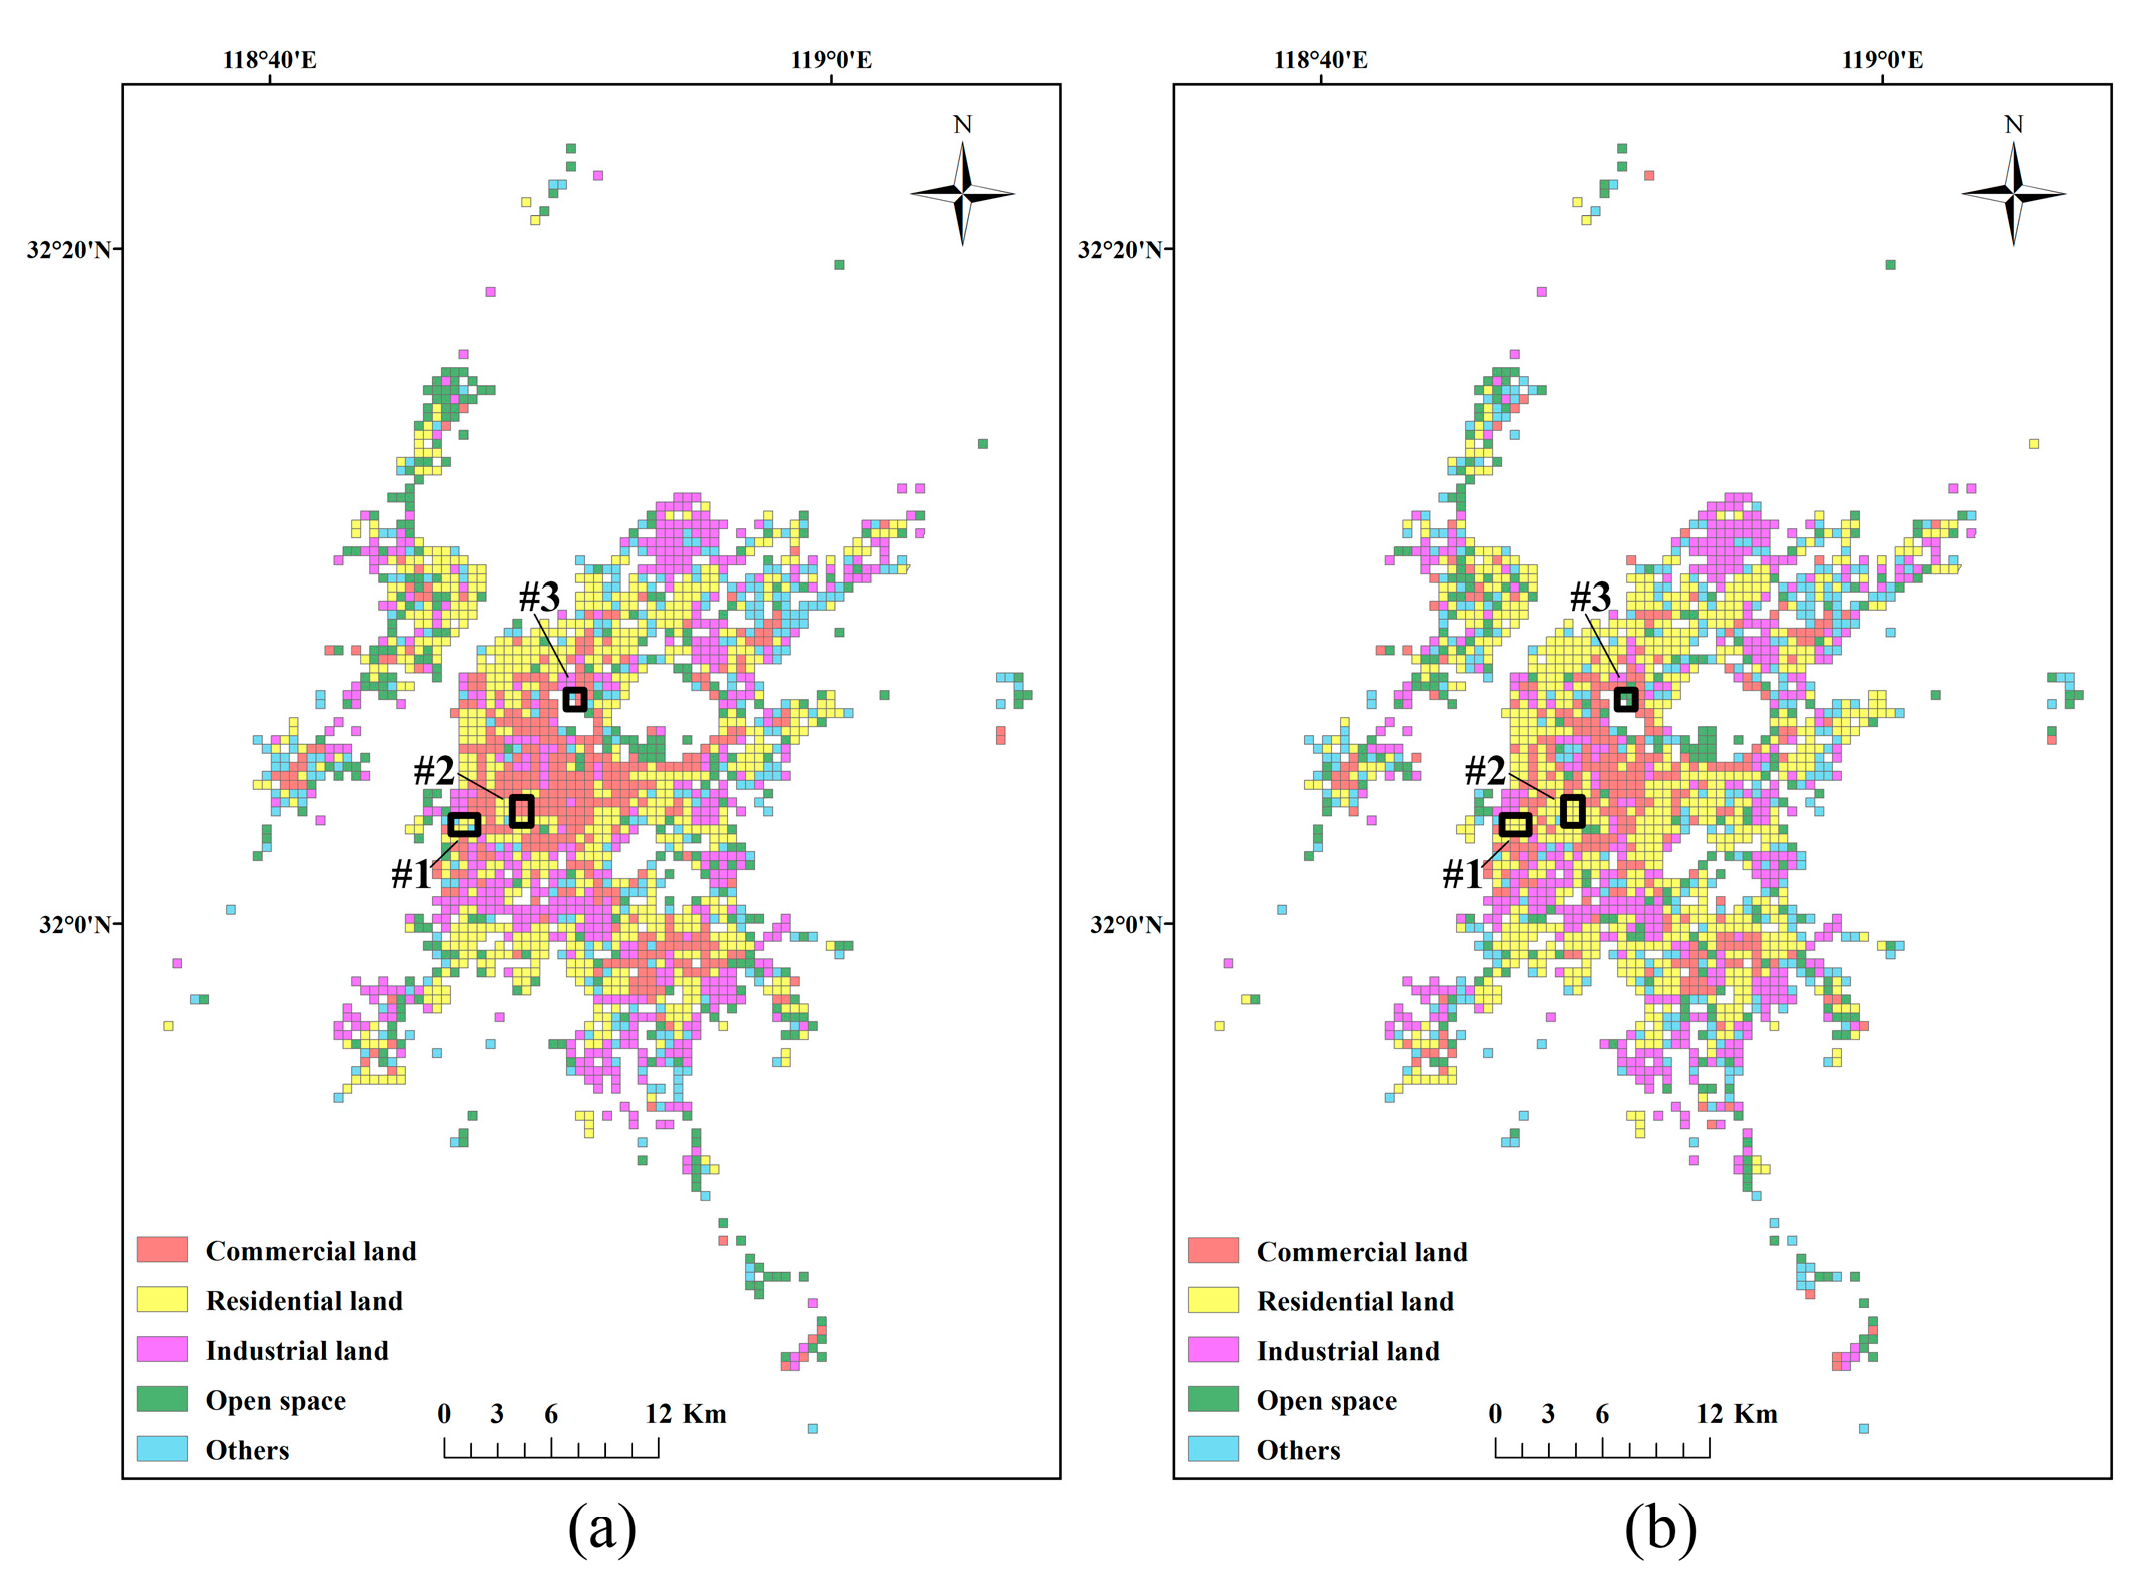
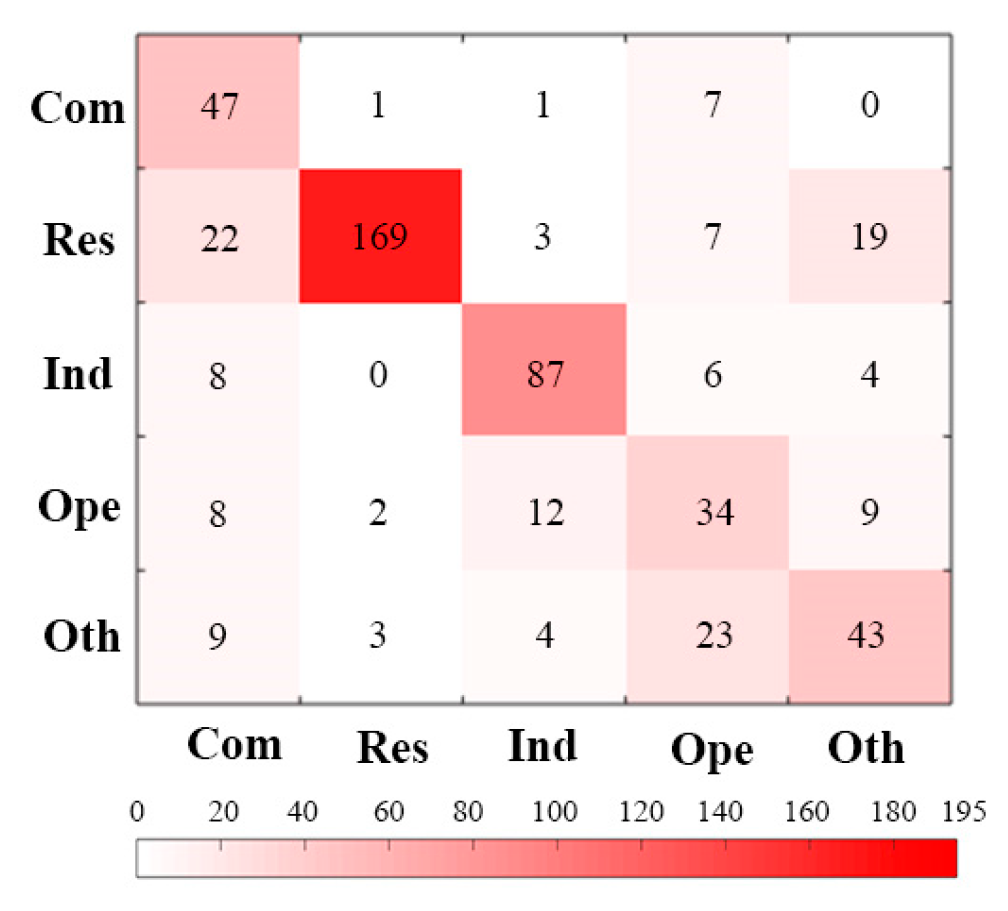
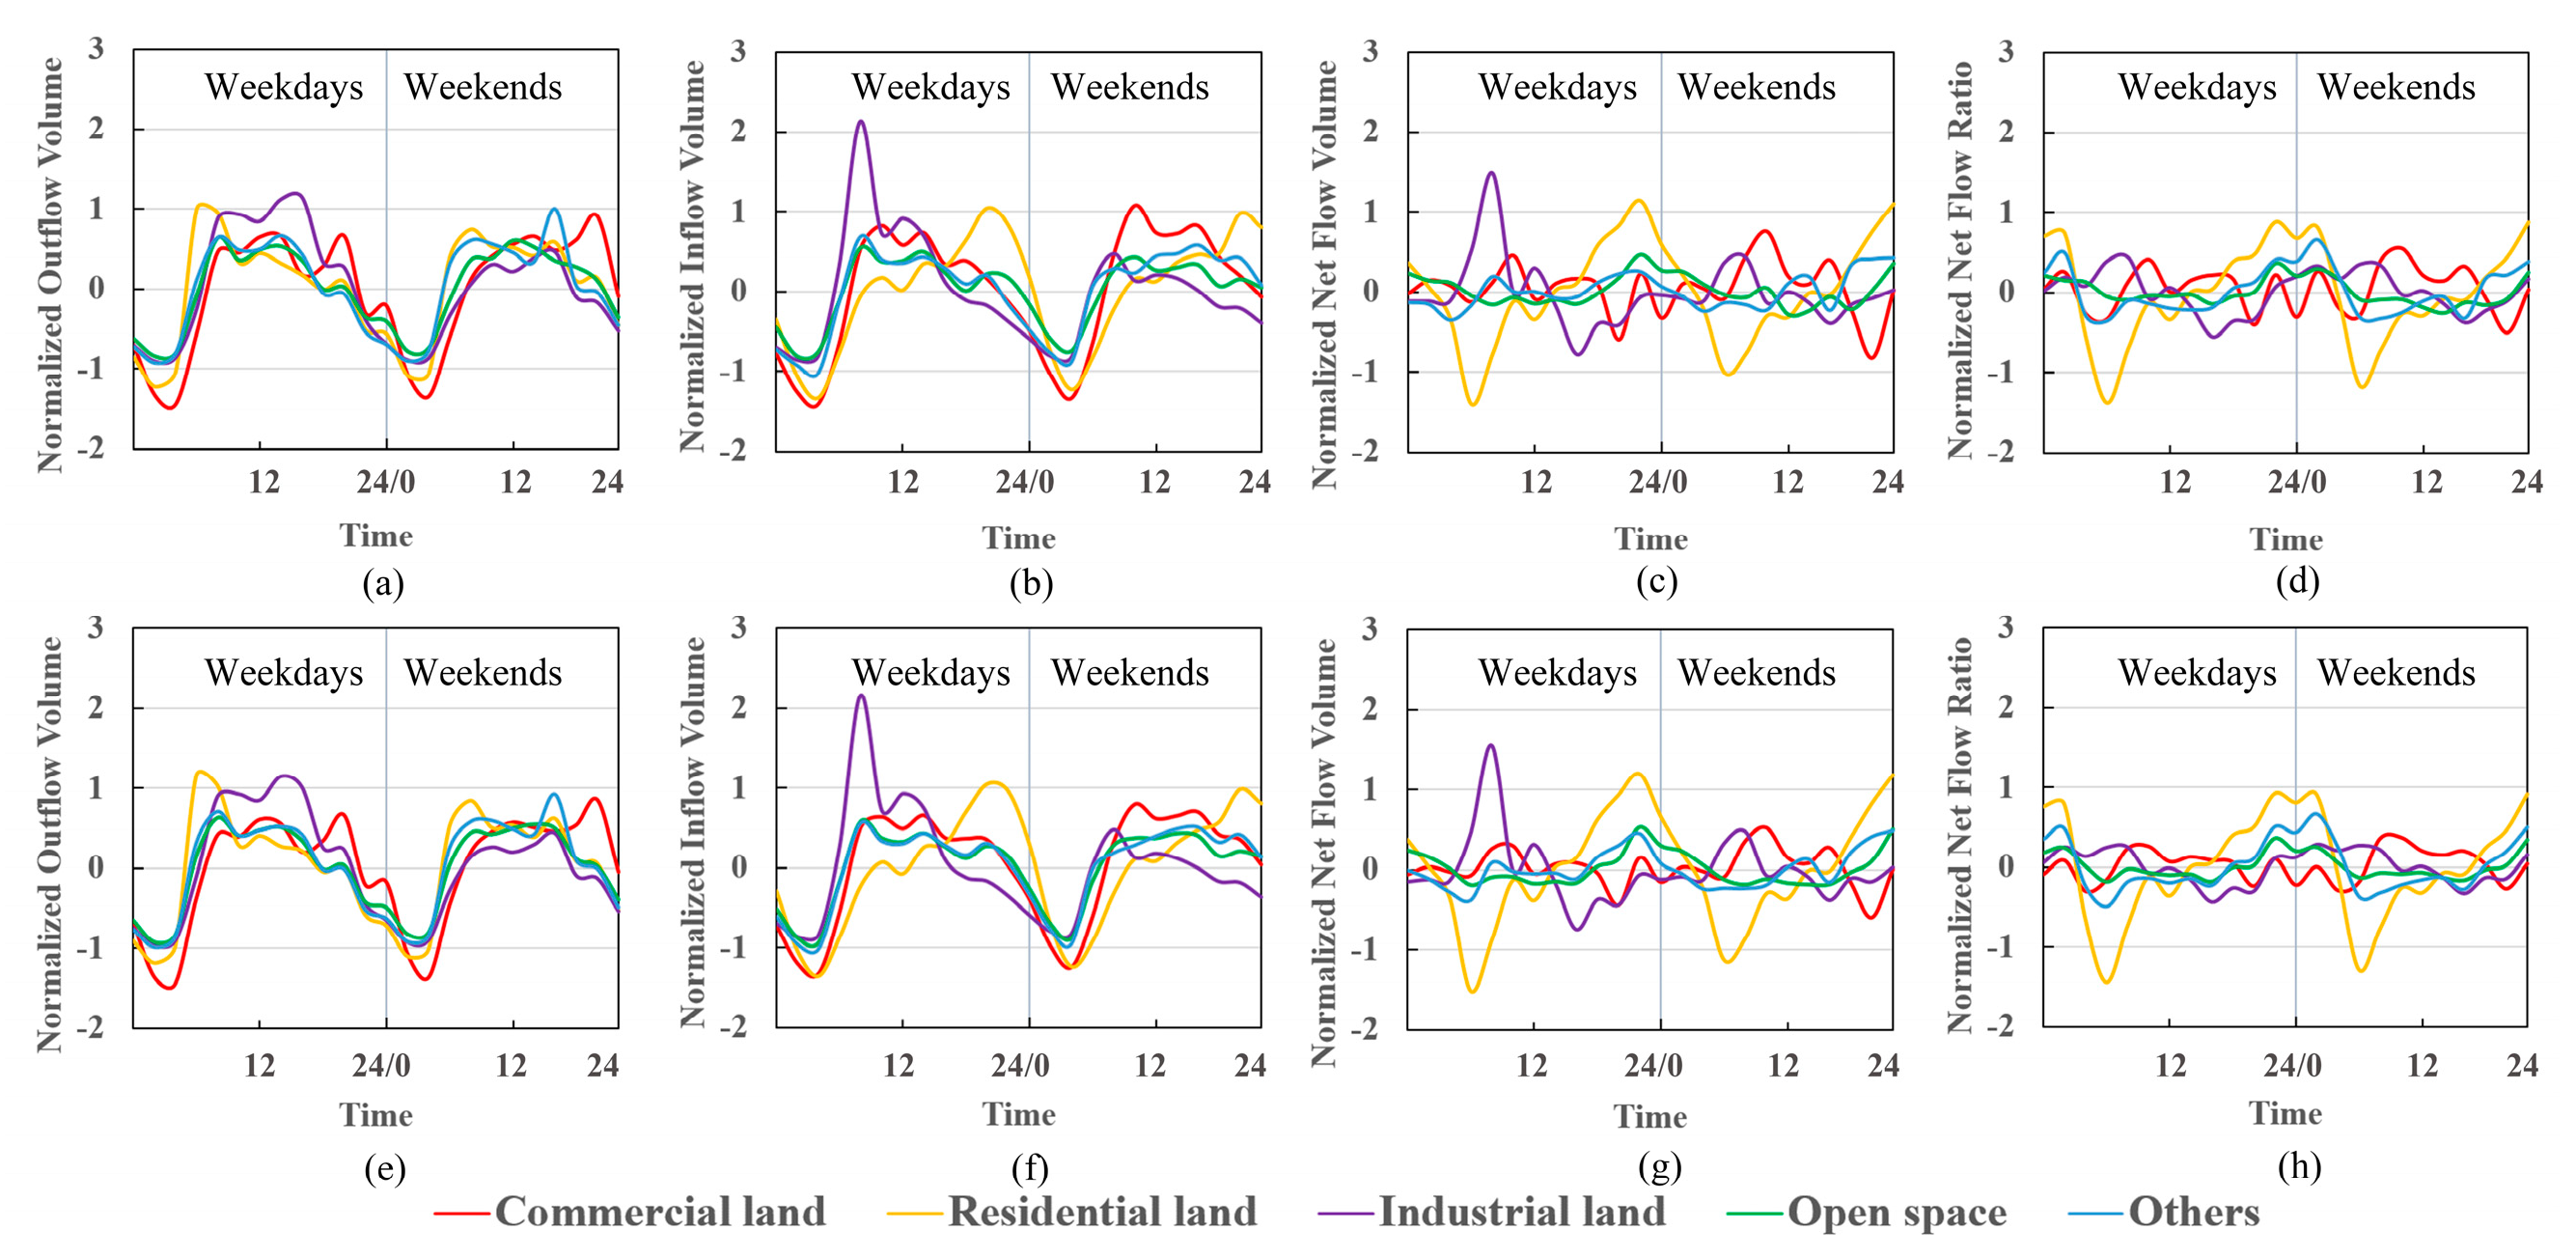
3.2. Results
4. Discussion
5. Conclusions
Author Contributions
Funding
Acknowledgments
Conflicts of Interest
References
- Herold, M.; Liu, X.H.; Clarke, K.C. Spatial metrics and image texture for mapping urban land use. Photogramm. Eng. Remote Sens. 2003, 69, 991–1001. [Google Scholar] [CrossRef]
- Arsanjani, J.J.; Helbich, M.; Bakillah, M.; Hagenauer, J.; Zipf, A. Toward mapping land-use patterns from volunteered geographic information. Int. J. Geogr. Inf. Sci. 2013, 27, 2264–2278. [Google Scholar] [CrossRef]
- Bakillah, M.; Liang, S.H.L.; Zipf, A.; Arsanjani, J.J. Semantic interoperability of sensor data with volunteered geographic information: A unified model. ISPRS Int. J. Geo-Inf. 2013, 2, 766–796. [Google Scholar] [CrossRef]
- Arsanjani, J.J. Characterizing, monitoring, and simulating land cover dynamics using GlobeLand30: A case study from 2000 to 2030. J. Environ. Manag. 2018, 214, 66–75. [Google Scholar] [CrossRef] [PubMed]
- Brovelli, M.A.; Celino, I.; Fiano, A.; Molinari, M.E.; Venkatachalam, V. A crowdsourcing-based game for land cover validation. Appl. Econ. 2018, 10, 1–11. [Google Scholar] [CrossRef]
- Oxoli, D.; Ronchetti, G.; Minghini, M.; Molinari, M.E.; Lotfian, M.; Sona, G.; Brovelli, M.A. Measuring urban land cover influence on air temperature through multiple geo-data-the case of Milan, Italy. ISPRS Int. J. Geo-Inf. 2018, 7, 421. [Google Scholar] [CrossRef]
- Liu, Y.; Sui, Z.W.; Kang, C.G.; Gao, Y. Uncovering patterns of inter-urban trip and spatial interaction from social media check-in data. PLoS ONE 2014, 9. [Google Scholar] [CrossRef] [PubMed]
- Long, Y.; Shen, Z.J. V-BUDEM: A vector-based Beijing urban development model for simulating urban growth. In Geospatial Analysis to Support Urban Planning in Beijing; Springer International Publishing: Cham, Switzerland, 2015; pp. 91–112. [Google Scholar]
- Zhang, X.Y.; Du, S.H. A linear dirichlet mixture model for decomposing scenes: Application to analyzing urban functional zonings. Remote Sens. Environ. 2015, 169, 37–49. [Google Scholar] [CrossRef]
- Gong, P.; Howarth, P.J. The use of structural information for improving land-cover classification accuracies at the rural-urban fringe. Photogramm. Eng. Remote Sens. 1990, 56, 67–73. [Google Scholar] [CrossRef]
- Fisher, P. The pixel: A snare and a delusion. Int. J. Remote Sens. 1997, 18, 679–685. [Google Scholar] [CrossRef]
- Shaban, M.A.; Dikshit, O. Improvement of classification in urban areas by the use of textural features: The case study of Lucknow City, Uttar Pradesh. Int. J. Remote Sens. 2001, 22, 565–593. [Google Scholar] [CrossRef]
- Lu, D.S.; Weng, Q.H. Use of impervious surface in urban land-use classification. Remote Sens. Environ. 2006, 102, 146–160. [Google Scholar] [CrossRef]
- Wu, S.S.; Qiu, X.M.; Usery, E.L.; Wang, L. Using geometrical, textural, and contextual information of land parcels for classification of detailed urban land use. Ann. Assoc. Am. Geogr. 2009, 99, 76–98. [Google Scholar] [CrossRef]
- Weng, Q.H. Remote sensing of impervious surfaces in the urban areas: Requirements, methods, and trends. Remote Sens. Environ. 2012, 17, 34–49. [Google Scholar] [CrossRef]
- Hu, T.Y.; Yang, J.; Li, X.C.; Gong, P. Mapping urban land use by using landsat images and open social data. Remote Sens. 2016, 8, 151. [Google Scholar] [CrossRef]
- Vanderhaegen, S.; Canters, F. Mapping urban form and function at city block level using spatial metrics. Landsc. Urban Plan. 2017, 167, 399–409. [Google Scholar] [CrossRef]
- Zhang, X.Y.; Du, S.H.; Wang, Q. Hierarchical semantic cognition for urban functional zones with VHR satellite images and POI data. ISPRS J. Photogramm. Remote Sens. 2017, 132, 170–184. [Google Scholar] [CrossRef]
- Xing, H.F.; Meng, Y. Integrating landscape metrics and socioeconomic features for urban functional region classification. Comput. Environ. Urban Syst. 2018, 72, 134–145. [Google Scholar] [CrossRef]
- Boarnet, M.; Crane, R. The influence of land use on travel behavior: Specification and estimation strategies. Transp. Res. A Pol. 2001, 35, 823–845. [Google Scholar] [CrossRef]
- Small, K. A.; Song, S. Wasteful commuting: A resolution. J. Polit. Econ. 1992, 100, 888–898. [Google Scholar] [CrossRef]
- Giuliano, G.; Small, K.A. Is the journey to work explained by urban structure. Urban Stud. 1993, 30, 1485–1500. [Google Scholar] [CrossRef]
- Wang, F.H. Modeling commuting patterns in Chicago in a GIS environment: A job accessibility perspective. Prof. Geogr. 2000, 52, 120–133. [Google Scholar] [CrossRef]
- Kim, T.J. Transportation: A Geographical Analysis. J. Am. Plan. Assoc. 2005, 71, 457–458. [Google Scholar]
- Gao, S.; Wang, Y.L.; Gao, Y.; Liu, Y. Understanding urban traffic-flow characteristics: A rethinking of betweenness centrality. Environ. Plan. B Urban Anal. City Sci. 2013, 40, 135–153. [Google Scholar] [CrossRef]
- Liu, Y.; Wang, F.H.; Xiao, Y.; Gao, S. Urban land uses and traffic ‘source-sink areas’: Evidence from GPS-enabled taxi data in shanghai. Landsc. Urban Plan. 2012, 106, 73–87. [Google Scholar] [CrossRef]
- Yuan, J.; Zheng, Y.; Xie, X. Discovering regions of different functions in a city using human mobility and POIs. In Proceedings of the 18th ACM SIGKDD International Conference on Knowledge Discovery and Data Mining, Beijing, China, 12–16 August 2012; pp. 186–194. [Google Scholar] [CrossRef]
- Crooks, A.; Pfoser, D.; Jenkins, A.; Croitoru, A.; Stefanidis, A.; Smith, D.; Karagiorgou, S.; Efentakis, A.; Lamprianidis, G. Crowdsourcing urban form and function. Int. J. Geogr. Inf. Sci. 2015, 29, 720–741. [Google Scholar] [CrossRef]
- Jiang, S.; Alves, A.; Rodrigues, F.; Ferreira, J.; Pereira, F.C. Mining point-of-interest data from social networks for urban land use classification and disaggregation. Comput. Environ. Urban Syst. 2015, 53, 36–46. [Google Scholar] [CrossRef]
- Jenkins, A.; Croitoru, A.; Crooks, A.T.; Stefanidis, A. Crowdsourcing a collective sense of place. PLoS ONE 2016, 11. [Google Scholar] [CrossRef]
- Caceres, N.; Benitez, F.G. Supervised land use inference from mobility patterns. J. Adv. Transp. 2018. [Google Scholar] [CrossRef]
- Wang, Y.D.; Gu, Y.Y.; Dou, M.X.; Qiao, M.L. Using spatial semantics and interactions to identify urban functional regions. ISPRS Int. J. Geo-Inf. 2018, 7, 130. [Google Scholar] [CrossRef]
- Kwan, M.P. Space-time and integral measures of individual accessibility: A comparative analysis using a point-based framework. Geogr. Anal. 1998, 30, 191–216. [Google Scholar] [CrossRef]
- Krosche, J.; Boll, S. The xPOI Concept. In Proceedings of the First International Workshop on Location and Context Awareness, Oberpfaffenhofen, Germany, 12–13 May 2005; Springer: Berlin/Heidelberg, Germany, 2005; pp. 113–119. [Google Scholar] [CrossRef]
- Yang, Y.; Tian, L.; Anthony, G.O.Y. Zooming into individuals to understand the collective: A review of trajectory-based travel behaviour studies. Travel Behav. Soc. 2014, 1, 69–78. [Google Scholar] [CrossRef]
- Liu, Y.; Liu, X.; Gao, S.; Gong, L.; Kang, C.G.; Zhi, Y.; Chi, G.H.; Shi, L. Social sensing: A new approach to understanding our socio-economic environments. Ann. Assoc. Am. Geogr. 2015, 105, 512–530. [Google Scholar] [CrossRef]
- Soliman, A.; Soltani, K.; Yin, J.J.; Padmanabhan, A.; Wang, S.W. Social sensing of urban land use based on analysis of Twitter users’ mobility patterns. PLoS ONE 2017, 12. [Google Scholar] [CrossRef] [PubMed]
- Mou, N.X.; Zhang, H.C.; Chen, J.; Zhang, L.X.; Dai, H.L. A review on the application research of trajectory data mining in urban cities. J. Geo-Inf. Sci. 2015, 17, 1136–1142. [Google Scholar]
- Tang, L.L.; Gao, J.; Ren, C.; Zhang, X.; Yang, X.; Kan, Z.H. Detecting and evaluating urban clusters with spatiotemporal big data. Sensors 2019, 19, 461. [Google Scholar] [CrossRef] [PubMed]
- Tang, L.L.; Zou, Q.Q.; Zhang, X.; Ren, C.; Li, Q.Q. Spatio-temporal behavior analysis and pheromone-based fusion model for big trace data. ISPRS Int. J. Geo-Inf. 2017, 6, 151. [Google Scholar] [CrossRef]
- Reades, J.; Calabrese, F.; Ratti, C. Eigenplaces: Analysing cities using the space-time structure of the mobile phone network. Environ. Plan. B Plan. Des. 2009, 36, 824–836. [Google Scholar] [CrossRef]
- Calabrese, F.; Reades, J.; Ratti, C. Eigenplaces: Segmenting space through digital signatures. IEEE Pervasive Comput. 2010, 9, 78–84. [Google Scholar] [CrossRef]
- Qi, G.D.; Li, X.L.; Li, S.J.; Pan, G.; Wang, Z.H.; Zhang, D.Q. Measuring social functions of city regions from large-scale taxi behaviors. IEEE Int. Conf. Pervasive Comput. Commun. Workshops 2011, 384–388. [Google Scholar] [CrossRef]
- Soto, V.; Frias-Martinez, E. Automated land use identification using cell-phone records. In Proceedings of the 3rd ACM international workshop on MobiArch, HotPlanet 11, Bethesda, MD, USA, 28 June 2011; pp. 17–22. [Google Scholar] [CrossRef]
- Soto, V.; Frias-Martinez, E. Robust land use characterization of urban landscapes using cell phone data. In Proceedings of the 1st Workshop on Pervasive Urban Applications, in Conjunction with 9th International Conference on Pervasive Computing, San Francisco, CA, USA, 12–15 June 2011; pp. 1–8. [Google Scholar]
- Frias-Martinez, V.; Frias-Martinez, E. Spectral clustering for sensing urban land use using Twitter activity. Eng. Appl. Artif. Intell. 2014, 35, 237–245. [Google Scholar] [CrossRef]
- Zhan, X.Y.; Ukkusuri, S.V.; Zhu, F. Inferring urban land use using large-scale social media check-in data. Netw. Spat. Econ. 2014, 14, 647–667. [Google Scholar] [CrossRef]
- Chen, S.L.; Tao, H.Y.; Li, X.L.; Zhuo, L. Discovering urban functional regions using latent semantic information: Spatiotemporal data mining of floating cars GPS data of Guangzhou. Act. Geogr. Sin. 2016, 71, 471–483. [Google Scholar] [CrossRef]
- Wang, Y.D.; Wang, T.; Tsou, M.H.; Li, H.; Jiang, W.; Guo, F.Q. Mapping dynamic urban land use patterns with crowdsourced geo-tagged social media (Sina-Weibo) and commercial points of interest collections in Beijing, China. Sustainability 2016, 8, 1202. [Google Scholar] [CrossRef]
- Toole, J.L.; Ulm, M.; Bauer, D.; Gonzalez, M.C. Inferring land use from mobile phone activity. In Proceedings of the ACM SIGKDD International Workshop on Urban Computing, Beijing, China, 12 August 2012; pp. 1–8. [Google Scholar] [CrossRef]
- Pei, T.; Sobolevsky, S.; Ratti, C.; Shaw, S.L.; Li, T.; Zhou, C. A new insight into land use classification based on aggregated mobile phone data. Int. J. Geogr. Inf. Sci. 2014, 28, 1988–2007. [Google Scholar] [CrossRef]
- Pan, G.; Qi, G.D.; Wu, Z.H.; Zhang, D.Q.; Li, S.J. Land-use classification using taxi GPS traces. IEEE Trans. Intell. Transp. Syst. 2013, 14, 113–123. [Google Scholar] [CrossRef]
- Liu, X.; Kang, C.G.; Gong, L.; Liu, Y. Incorporating spatial interaction patterns in classifying and understanding urban land use. Int. J. Geogr. Inf. Sci. 2016, 30, 334–350. [Google Scholar] [CrossRef]
- Bench-Capon, T.J.M.; Dunne, P.E. Argumentation in artificial intelligence. Artif. Intell. 2007, 171, 619–641. [Google Scholar] [CrossRef]
- Wang, X.Q.; Sloan, I.H. Brownian bridge and principal component analysis: Towards removing the curse of dimensionality. IMA J. Numer. Anal. 2007, 27, 631–654. [Google Scholar] [CrossRef]
- Muja, M.; Lowe, D.G. Scalable nearest neighbor algorithms for high dimensional data. IEEE Trans. Pattern Anal. Mach. Intell. 2014, 36, 2227–2240. [Google Scholar] [CrossRef]
- Guo, D.S.; Zhu, X.; Jin, H.; Gao, P.; Andris, C. Discovering spatial patterns in origin-destination mobility data. Trans. GIS 2012, 16, 411–429. [Google Scholar] [CrossRef]
- Reades, J.; Calabrese, F.; Sevtsuk, A.; Ratti, C. Cellular census: Explorations in urban data collection. IEEE Pervasive Comput. 2007, 6, 30–38. [Google Scholar] [CrossRef]
- Calegari, G.R.; Carlino, E.; Peroni, D.; Celino, I. Filtering and windowing mobile traffic time series for territorial land use classification. Comput. Commun. 2016, 95, 15–28. [Google Scholar] [CrossRef]
- Calegari, G.R.; Celino, I.; Peroni, D. City data dating: Emerging affinities between diverse urban datasets. Inf. Syst. 2016, 57, 223–240. [Google Scholar] [CrossRef]
- Bezdek, J.C. Pattern-recognition with fuzzy objective function algorithms. Adv. Appl. Pattern Recognit. 1981, 22, 203–239. [Google Scholar]
- Bezdek, J.C.; Ehrlich, R.; Full, W. FCM: The fuzzy c-means clustering algorithm. Comput. Geosci. 1984, 10, 191–203. [Google Scholar] [CrossRef]
- Demissie, M.G.; Correia, G.; Bento, C. Analysis of the pattern and intensity of urban activities through aggregate cellphone usage. Transportmetrica A 2015, 11, 502–524. [Google Scholar] [CrossRef]
- Wang, G.; Wang, Y.; Liu, L.; Jin, Y.; Zhu, N.; Li, X.; Wang, G.Q.; Chen, G.W. Comprehensive assessment of microbial aggregation characteristics of activated sludge bioreactors using fuzzy clustering analysis. Ecotoxicol. Environ. Saf. 2018, 162, 296–303. [Google Scholar] [CrossRef] [PubMed]
- Hounek, L.; Cintula, P. From fuzzy logic to fuzzy mathematics: A methodlological manifesto. Fuzzy Sets Syst. 2006, 157, 642–646. [Google Scholar] [CrossRef]
- Zuo, R.G.; Cheng, Q.M.; Agterberg, F.P. Application of a hybrid method combining multilevel fuzzy comprehensive evaluation with asymmetric fuzzy relation analysis to mapping prospectivity. Ore Geol. Rev. 2009, 35, 101–108. [Google Scholar] [CrossRef]
- Zhang, Q.W.; Zhang, Y.Z.; Zhong, M. A cloud model based approach for multi-hierarchy fuzzy comprehensive evaluation of reservoir-induced seismic risk. J. Hydraul. Eng. 2014, 45, 87–95. [Google Scholar] [CrossRef]
- Wei, X.; Luo, X.F.; Li, Q.; Zhang, J.; Xu, Z. Online comment-based hotel quality automatic assessment using improved fuzzy comprehensive evaluation and fuzzy cognitive map. IEEE Trans. Fuzzy Syst. 2015, 23, 72–84. [Google Scholar] [CrossRef]
- Liu, P.Y.; Wu, M.D. Fuzzy Theory and Its Application; National University of Defence Technology Press: Changsha, China, 1998. [Google Scholar]
- Jia, X.; Lu, Y. Fuzzy Information Processing; National University of Defence Technology Press: Changsha, China, 1996. [Google Scholar]
- Liu, X.P.; Niu, N.; Liu, X.J.; Jin, H.; Ou, J.P.; Jiao, L.M.; Liu, Y.L. Characterizing mixed-use buildings based on multi-source big data. Int. J. Geogr. Inf. Sci. 2018, 32, 738–756. [Google Scholar] [CrossRef]
- Shamshirband, S.; Amini, A.; Anuar, N.B.; Kiah, M.L.M.; Teh, Y.W.; Furnell, S. D-FICCA: A density-based fuzzy imperialist competitive clustering algorithm for intrusion detection in wireless sensor networks. Measurement 2014, 55, 212–226. [Google Scholar] [CrossRef]
- Guo, Q.; Li, C.; Quan, G.Q. Mixing matrix estimation of underdetermined blind source separation based on data field and improved FCM clustering. Symmetry 2018, 10, 21. [Google Scholar] [CrossRef]
- Jendryke, M.; Balz, T.; Mcclure, S.C.; Liao, M. Putting people in the picture: Combining big location-based social media data and remote sensing imagery for enhanced contextual urban information in Shanghai. Comput. Environ. Urban Syst. 2017, 62, 99–112. [Google Scholar] [CrossRef]
- Liu, X.P.; He, J.L.; Yao, Y.; Zhang, J.B.; Liang, H.L.; Wang, H.; Hong, Y. Classifying urban land use by integrating remote sensing and social media data. Int J Geogr Inf Sci. 2017, 31, 1675–1696. [Google Scholar] [CrossRef]
- Niu, N.; Liu, X.P.; Jin, H.; Ye, X.Y.; Liu, Y.; Li, X.; Chen, Y.M.; Li, S.Y. Integrating multi-source big data to infer building functions. Int. J. Geogr. Inf. Sci. 2017, 31, 1871–1890. [Google Scholar] [CrossRef]


| Commercial land | Residential land | Industrial land | Open space | Others | |
|---|---|---|---|---|---|
| Number | 226 | 878 | 421 | 261 | 328 |
| Proportion | 0.107 | 0.415 | 0.199 | 0.124 | 0.155 |
| Exp. | Outflow | Inflow | Net flow | Net flow ratio | OA | Kappa |
|---|---|---|---|---|---|---|
| A | √ | √ | 0.742 | 0.659 | ||
| B | √ | √ | √ | 0.803 | 0.738 | |
| C | √ | √ | √ | 0.784 | 0.712 | |
| D | √ | √ | √ | √ | 0.858 | 0.810 |
| Land use types | Feature combinations | ||||
|---|---|---|---|---|---|
| A | B | C | D | ||
| Commercial land | PA | 0.839 | 0.857 | 0.893 | 0.929 |
| UA | 0.534 | 0.632 | 0.625 | 0.703 | |
| Residential land | PA | 0.805 | 0.855 | 0.859 | 0.886 |
| UA | 0.952 | 0.969 | 0.955 | 0.980 | |
| Industrial land | PA | 0.848 | 0.867 | 0.867 | 0.905 |
| UA | 0.824 | 0.858 | 0.827 | 0.872 | |
| Open space | PA | 0.523 | 0.646 | 0.538 | 0.738 |
| UA | 0.466 | 0.568 | 0.574 | 0.750 | |
| Others | PA | 0.549 | 0.671 | 0.598 | 0.768 |
| UA | 0.616 | 0.705 | 0.620 | 0.768 | |
| Commercial land | Residential land | Industrial land | Open space | Others | |
|---|---|---|---|---|---|
| PA | 0.839 | 0.768 | 0.829 | 0.523 | 0.524 |
| UA | 0.500 | 0.966 | 0.813 | 0.442 | 0.573 |
| Exp. | Feature combinations | Weight sets | ||||||
|---|---|---|---|---|---|---|---|---|
| Outflow | Inflow | Net flow | Net flow ratio | |||||
| A | √ | √ | 0.350 | 0.650 | ||||
| B | √ | √ | √ | 0.230 | 0.400 | 0.370 | ||
| C | √ | √ | √ | 0.240 | 0.380 | 0.380 | ||
| D | √ | √ | √ | √ | 0.210 | 0.320 | 0.310 | 0.160 |
| Outflow | Inflow | Net flow | Net flow ratio | |
|---|---|---|---|---|
| OA | 0.563 | 0.691 | 0.741 | 0.636 |
| Kappa | 0.440 | 0.593 | 0.655 | 0.517 |
© 2019 by the authors. Licensee MDPI, Basel, Switzerland. This article is an open access article distributed under the terms and conditions of the Creative Commons Attribution (CC BY) license (http://creativecommons.org/licenses/by/4.0/).
Share and Cite
Ge, P.; He, J.; Zhang, S.; Zhang, L.; She, J. An Integrated Framework Combining Multiple Human Activity Features for Land Use Classification. ISPRS Int. J. Geo-Inf. 2019, 8, 90. https://doi.org/10.3390/ijgi8020090
Ge P, He J, Zhang S, Zhang L, She J. An Integrated Framework Combining Multiple Human Activity Features for Land Use Classification. ISPRS International Journal of Geo-Information. 2019; 8(2):90. https://doi.org/10.3390/ijgi8020090
Chicago/Turabian StyleGe, Panpan, Jun He, Shuhua Zhang, Liwei Zhang, and Jiangfeng She. 2019. "An Integrated Framework Combining Multiple Human Activity Features for Land Use Classification" ISPRS International Journal of Geo-Information 8, no. 2: 90. https://doi.org/10.3390/ijgi8020090
APA StyleGe, P., He, J., Zhang, S., Zhang, L., & She, J. (2019). An Integrated Framework Combining Multiple Human Activity Features for Land Use Classification. ISPRS International Journal of Geo-Information, 8(2), 90. https://doi.org/10.3390/ijgi8020090