3D Landform Modeling to Enhance Geospatial Thinking


Abstract
1. Introduction
2. Geovisualization Training
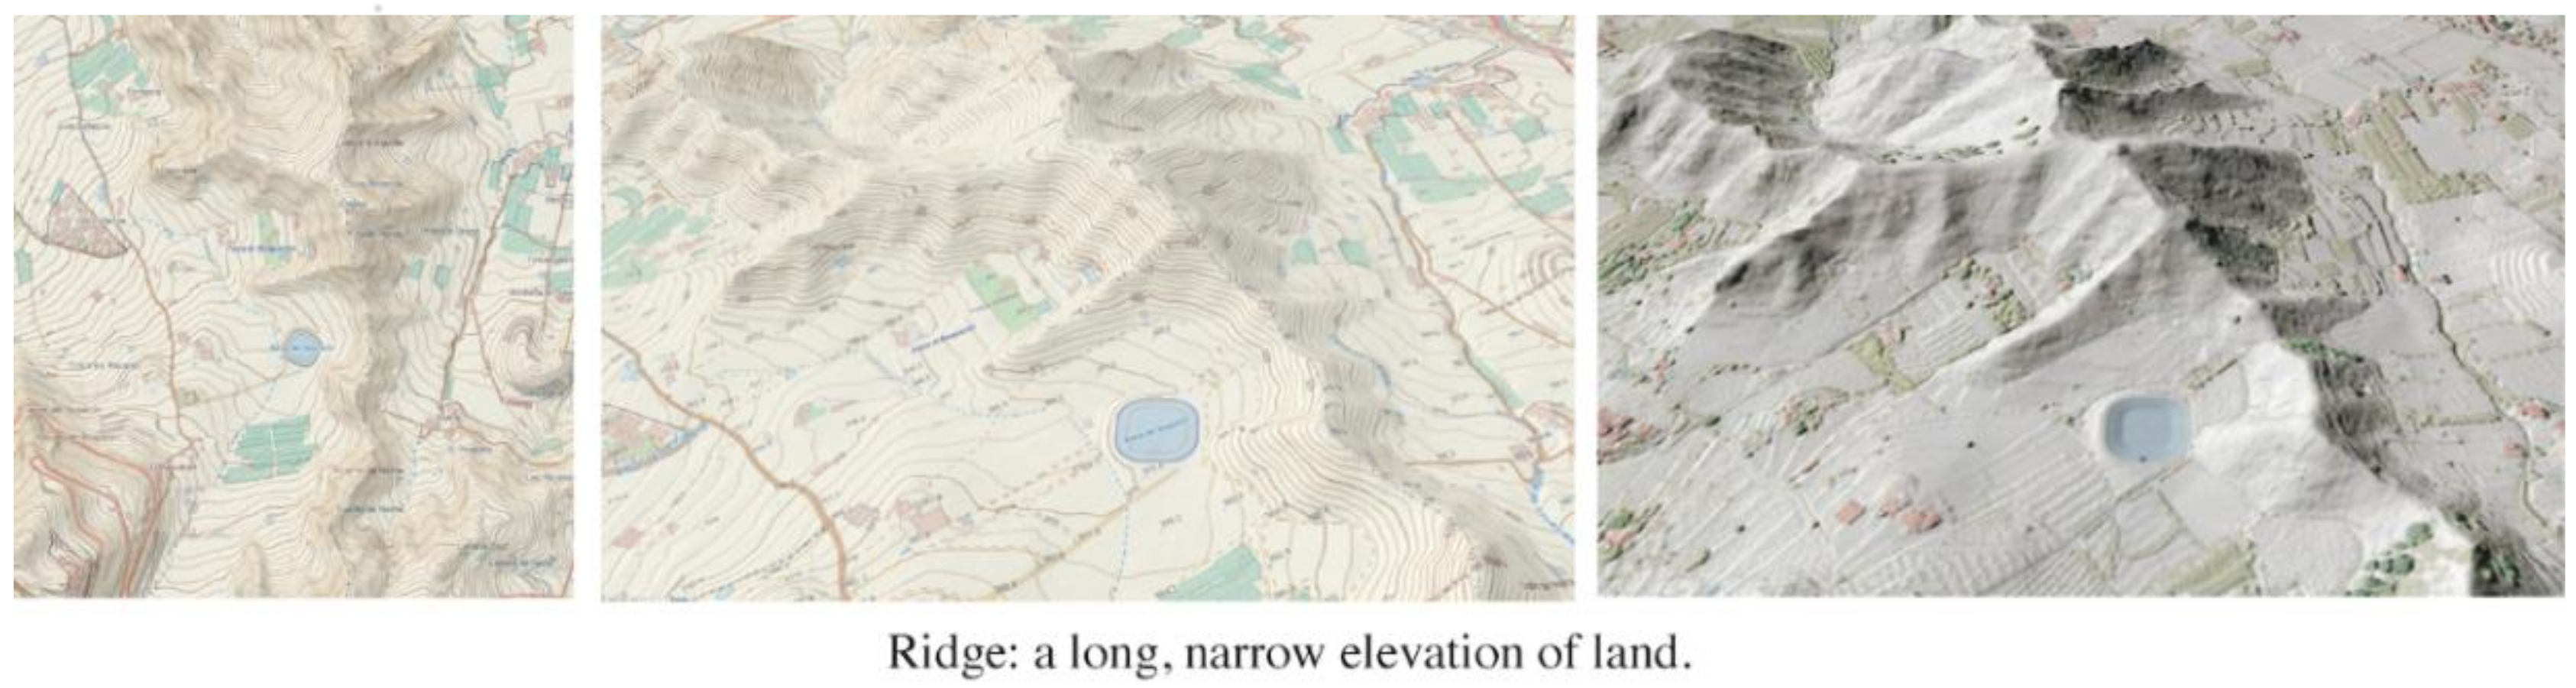
Geospatial Thinking and Landforms
3. Material and Methods
3.1. Participants
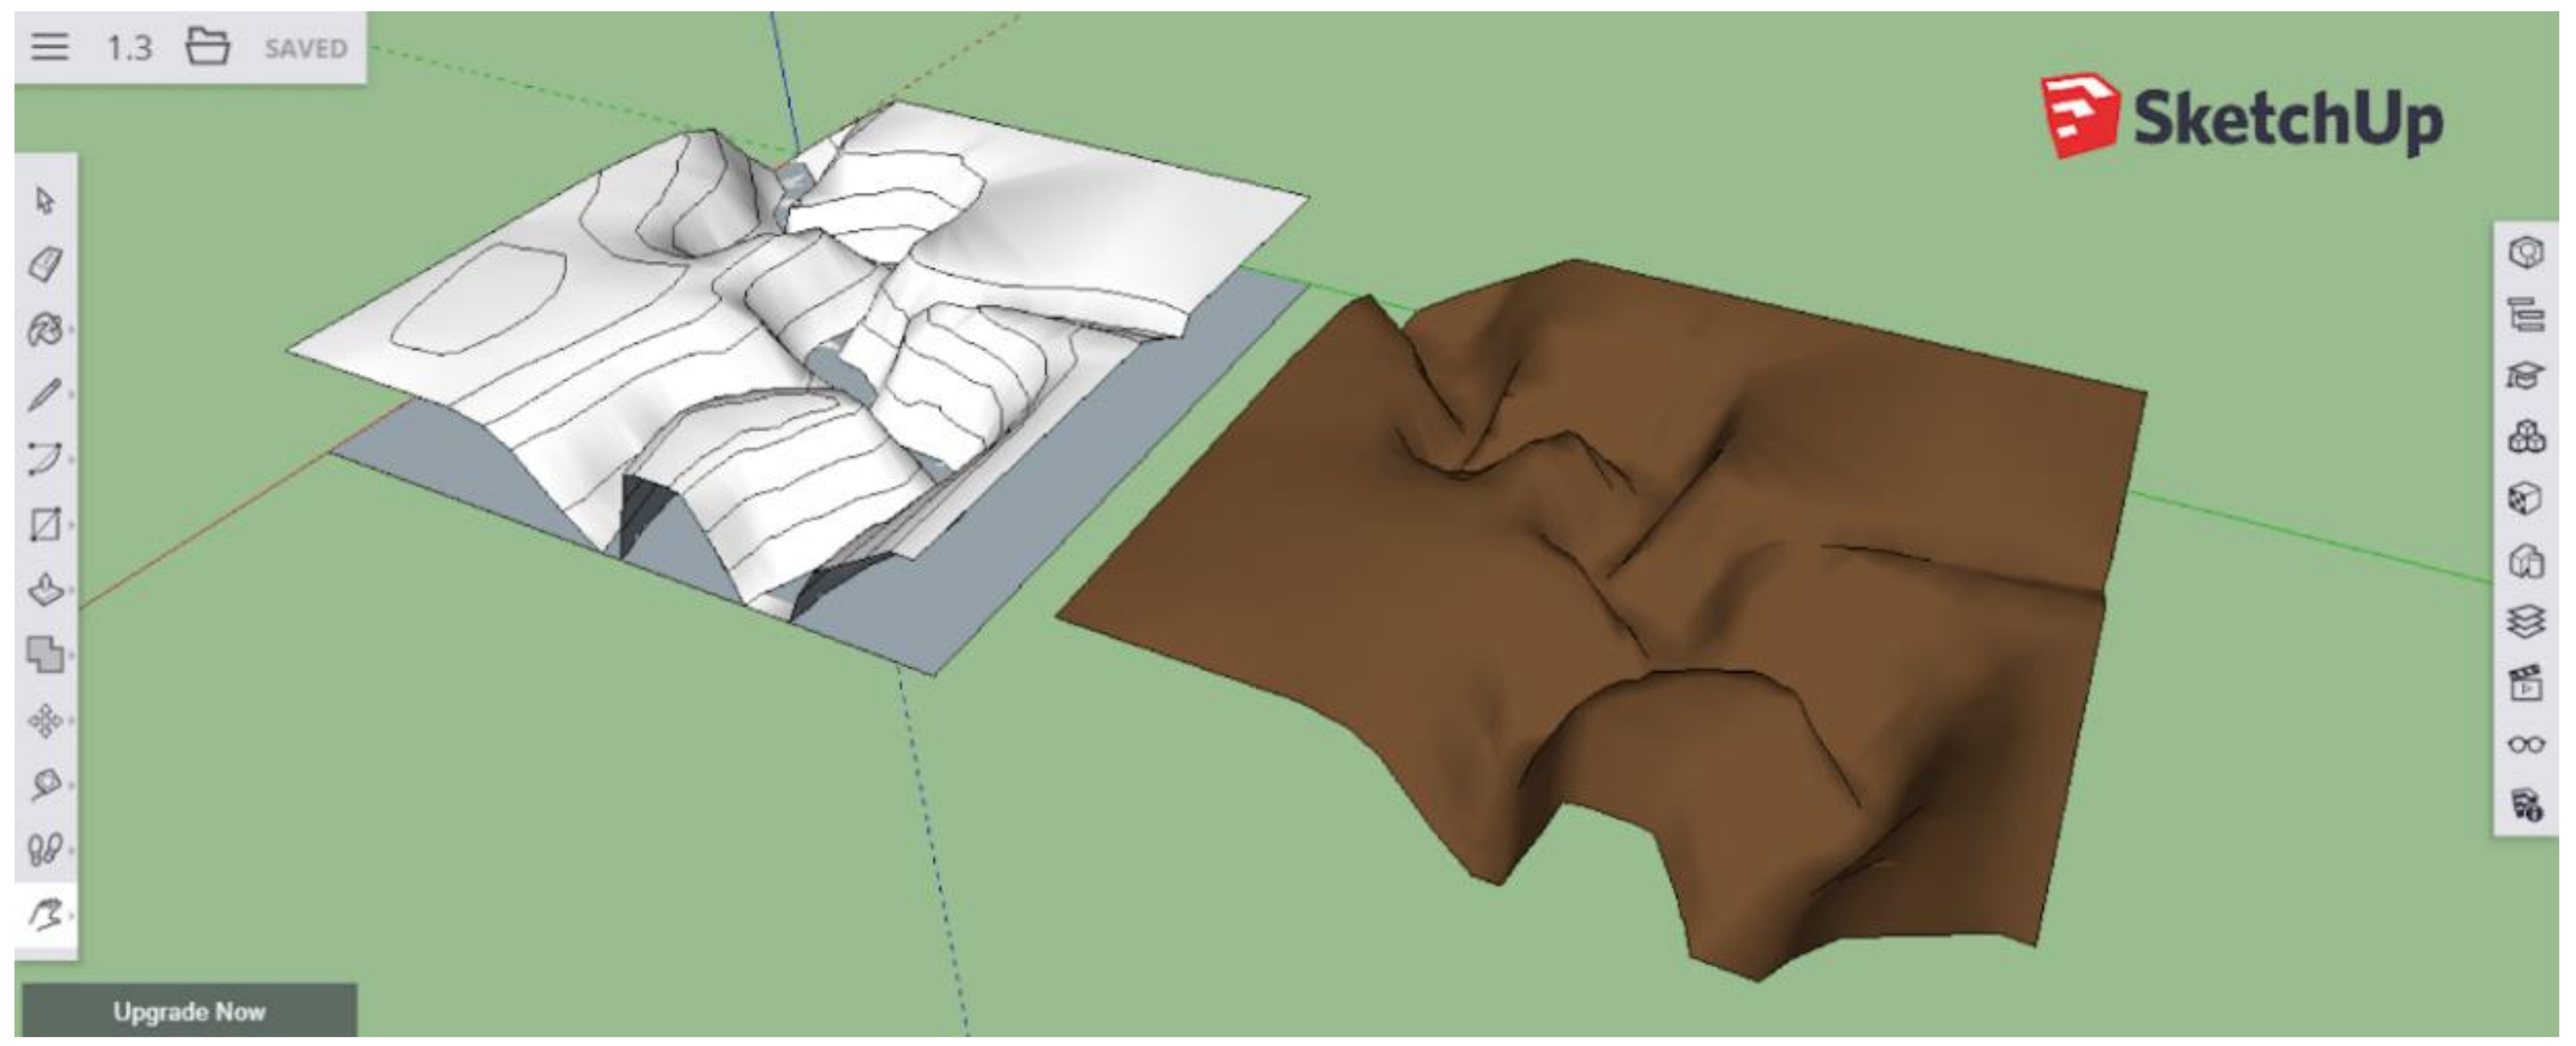
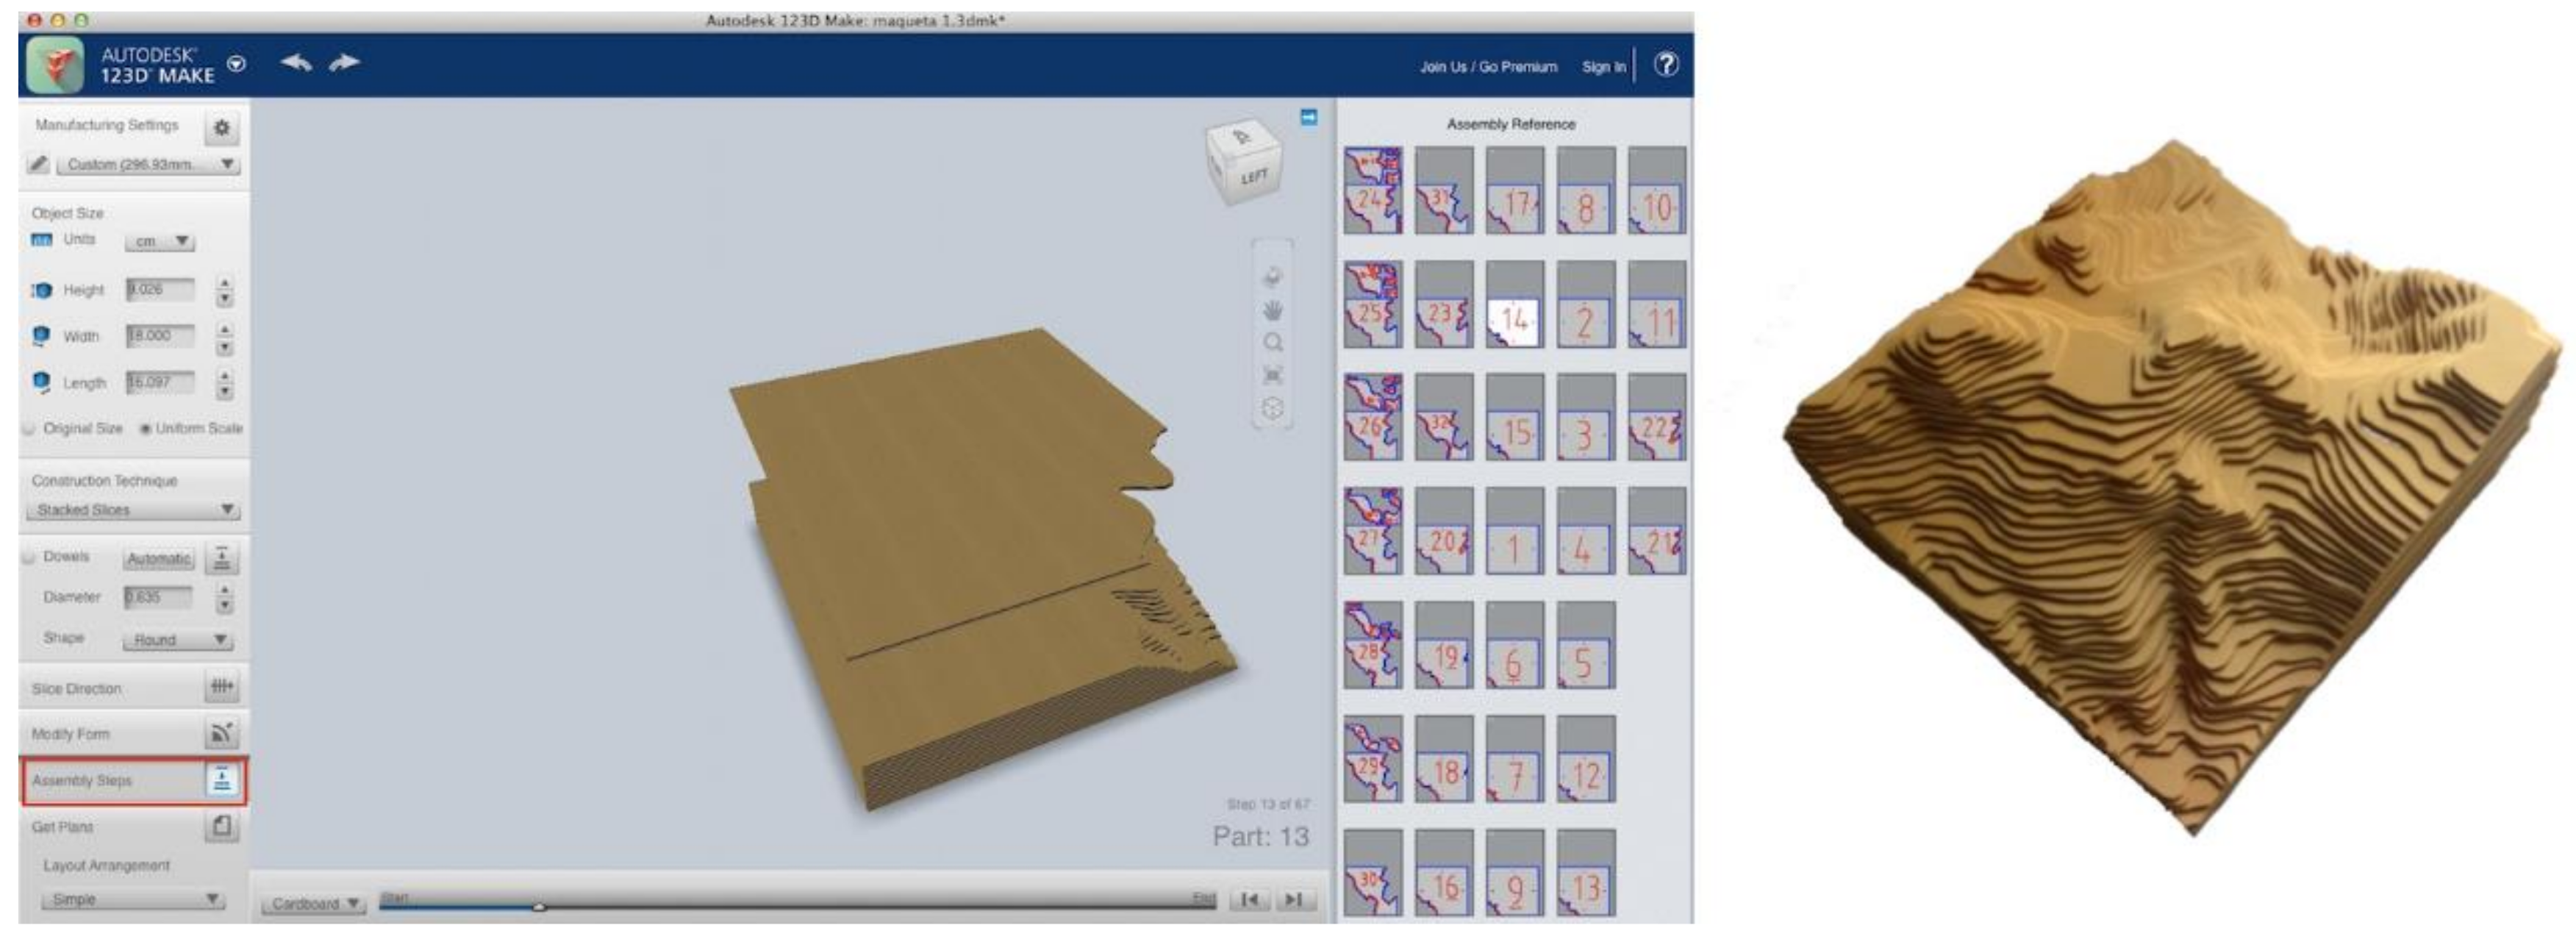
3.2. Hardware and Software
3.3. Procedure
3.4. Measurement of Geospatial Thinking Improvement

| Task | Description | Item Number |
|---|---|---|
| Path | Easy route between two points | 1 |
| Stream/water flow | Water flow between two points in different geographical settings | 2, 10, 11, 12 |
| Slope | Steeper slope between two points | 5, 9 |
| Visibility | Questions about visibility between points | 3, 17 |
| Elevation points | Questions about elevation points in a contour interval scenario | 4, 6, 7 |
| Photointerpretation relief | Different questions relating to a photograph/image of a topographic map of a land with contour lines | 8, 15, 16, 18 |
| Profile | Questions about topographic profiles from a topographic map with contour lines | 13, 14 |
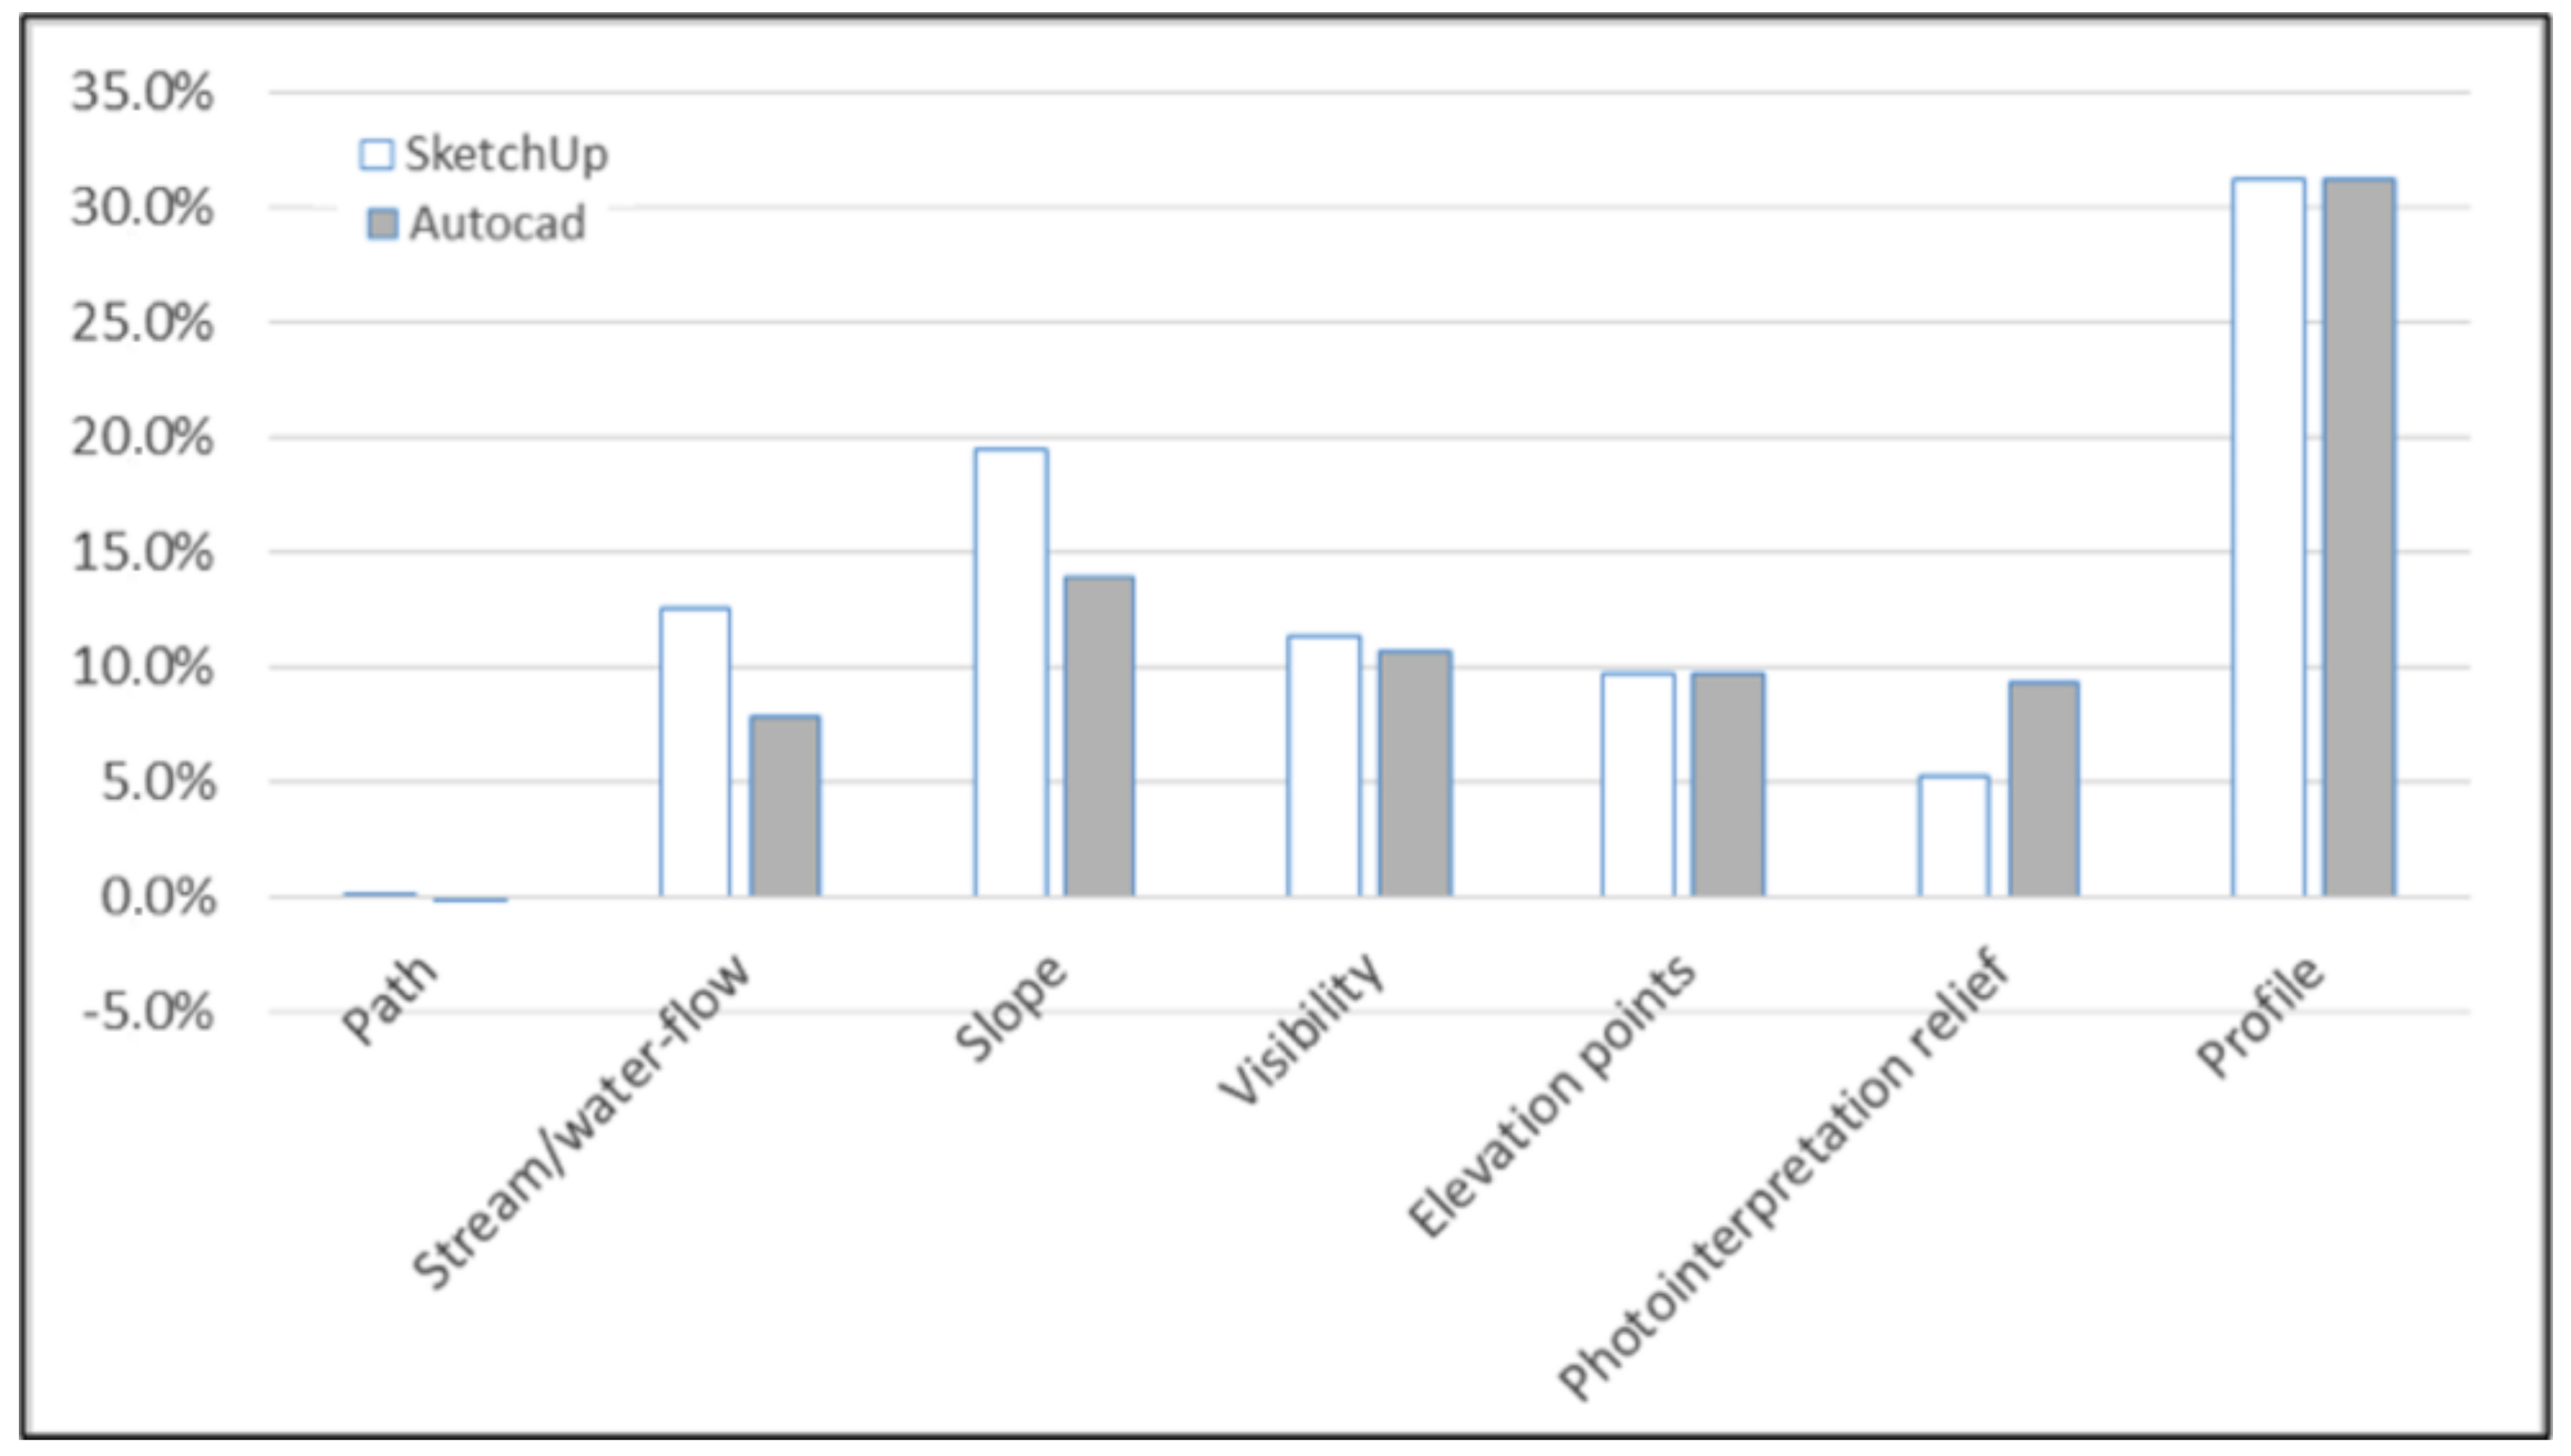
4. Results
4.1. Geospatial Thinking
| SketchUp n = 24 | AutoDesk123 n = 24 | ||||||||
|---|---|---|---|---|---|---|---|---|---|
| Pre | Post | Gain | Gain% | Pre | Post | Gain | Gain% | ||
| Path | Mean | 0.88 | 0.92 | 0.04 | - | 0.92 | 0.83 | −0.08 | |
| SD | 0.34 | 0.28 | 0.20 | 0.28 | 0.38 | 0.41 | |||
| Stream/water flow * | Mean | 3.21 | 4.21 | 1.00 | 12.5 | 3.38 | 4.00 | 0.63 | 7.8 |
| SD | 1.74 | 1.67 | 1.22 | 1.24 | 1.74 | 2.20 | |||
| Slope * | Mean | 1.96 | 2.54 | 0.58 | 19.3 | 1.88 | 2.29 | 0.42 | 13.9 |
| SD | 0.81 | 0.59 | 0.88 | 0.74 | 0.86 | 1.06 | |||
| Visibility * | Mean | 3.75 | 4.54 | 0.79 | 11.3 | 3.92 | 4.67 | 0.75 | 10.7 |
| SD | 1.36 | 1.50 | 1.02 | 1.41 | 1.58 | 1.29 | |||
| Elevation Points * | Mean | 1.67 | 1.96 | 0.29 | 9.7 | 1.67 | 1.96 | 0.29 | 9.7 |
| SD | 0.70 | 0.62 | 0.55 | 0.64 | 0.69 | 0.69 | |||
| Photointerpretation of Relief * | Mean | 1.13 | 1.33 | 0.21 | 5.3 | 0.92 | 1.29 | 0.38 | 9.5 |
| SD | 0.68 | 0.87 | 0.51 | 0.72 | 0.75 | 1.10 | |||
| Profile * | Mean | 0.50 | 1.13 | 0.63 | 31.3 | 0.54 | 1.17 | 0.63 | 31.3 |
| SD | 0.66 | 0.68 | 0.71 | 0.66 | 0.64 | 0.97 | |||
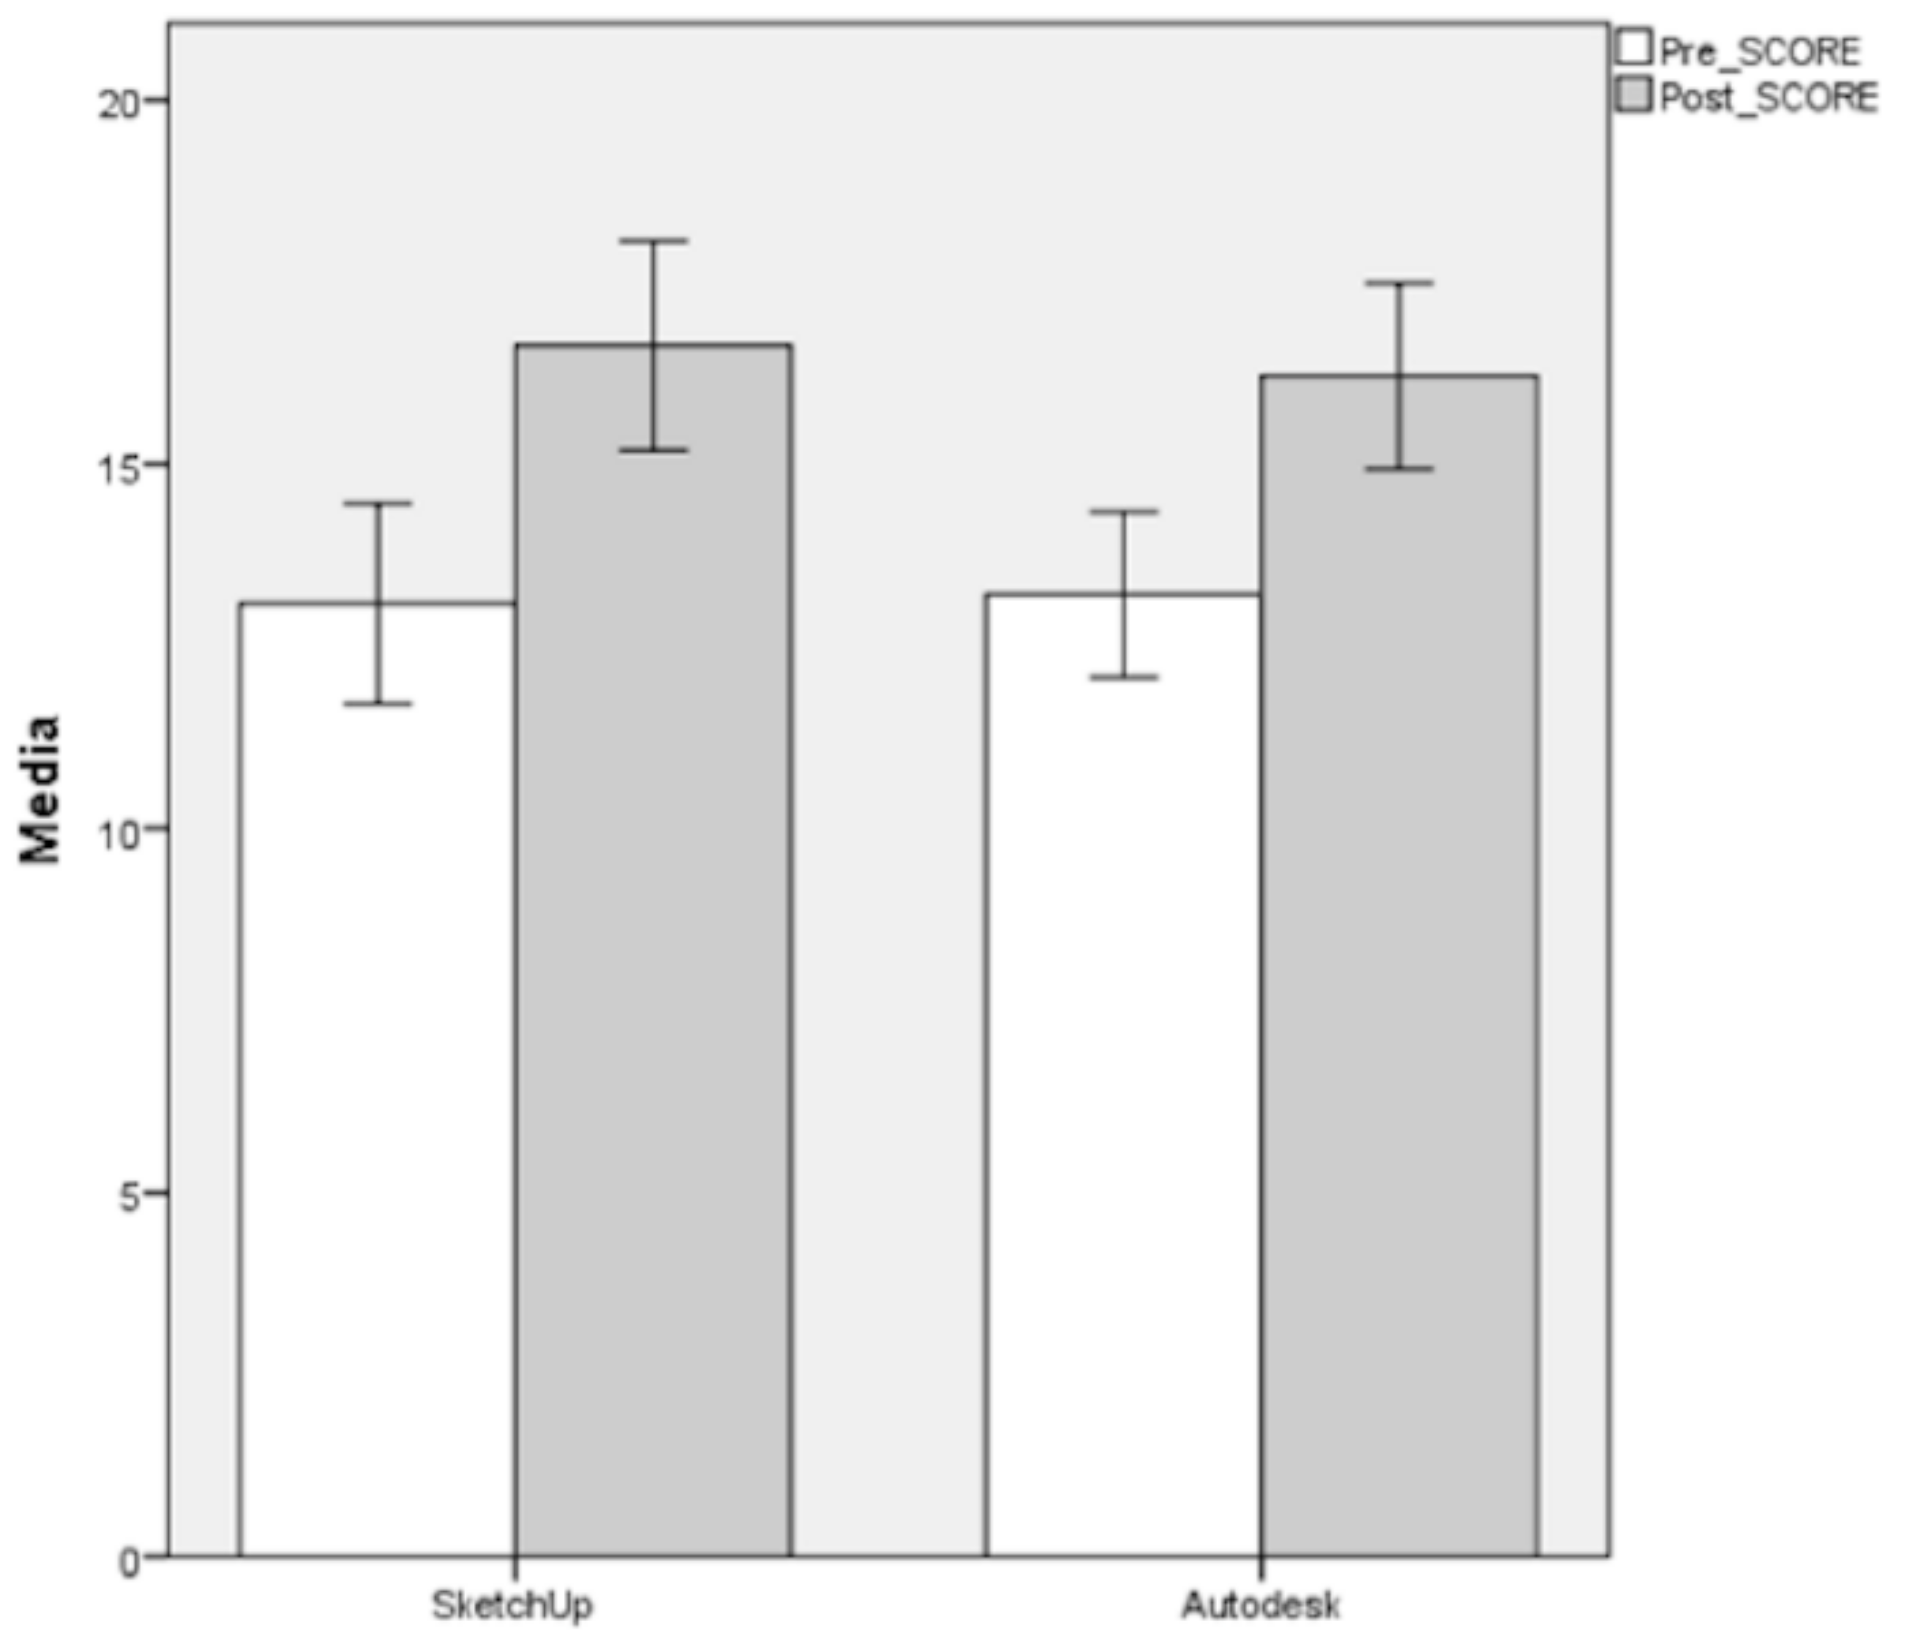
| Total Score * | Mean | 13.08 | 16.63 | 3.54 | 12.6 | 13.21 | 16.21 | 3.00 | 10.7 |
| SD | 3.26 | 3.40 | 2.65 | 2.69 | 3.02 | 3.46 | |||
4.2. 3D Modeling Questionnaire
| 3D Modeling Questionnaire Likert Scale (1: Strongly Disagree, 3: Neither Agree nor Desagree, 5: Strongly Agree) | SketchUp Workshop Mean (SD) | Autodesk Workshop Mean (SD) | ||
|---|---|---|---|---|
| Operation of SketchUp/ Autodesk123D Make application | Q1 | SketchUp/Autodesk123D Make is a powerful tool for the 3D modeling of landforms | 4.54 (1.03) | 4.46 (0.92) |
| Q2 | The application SketchUp/Autodesk123D Make is stable, no crashes | 4.11 (1.34) | 4.36 (1.03) | |
| Q3 | 3D modeling of landforms with SketchUp/Autodesk123D Make is easy and intuitive | 3.50 (1.20) | 3.07 (0.90) | |
| Improvement | Q4 | 3D modeling of landforms with SketchUp/Autodesk123D Make helps me with my geographical literacy | 4.18 (0.82) | 3.82 (0.86) |
| Q5 | I think 3D modeling activities of landforms with SketchUp/Autodesk123D Make develops my geospatial thinking | 3.96 (1.26) | 3.82 (1.12) | |
| Q6 | 3D modeling of landforms improves my understanding of relief | 4.00 (1.02) | 4.29 (0.85) | |
| Understanding of the concepts related to relief interpretation and representation | Q7 | I understand the landforms better from 3D modeling activities than from theoretical classes of the representation of relief | 4.00 (1.12) | 4.25 (0.75) |
| Q8 | 3D modeling of landforms helps me understand the concept of contour lines | 1.61 (1.13) | 4.75 (0.80) | |
| Q9 | 3D landform activities complement the traditional techniques of representing topographic relief | 2.11 (1.13) | 2.50 (1.13) | |
| Implications for the teaching–learning environment | Q10 | 3D modeling of landforms complements the traditional cartography teaching | 4.21 (0.79) | 3.89 (1.20) |
| Q11 | In my Digital Earth education, I consider activities with 3D modeling of landforms relevant | 3.89 (1.10) | 4.04 (1.07) | |
| Q12 | SketchUp/Autodesk123D Make is a valid tool for the early stages of Digital Earth education | 3.96 (1.17) | 3.93 (1.30) | |
| Total Score | 44.07 (6.90) | 47.18 (6.70) | ||
5. Discussion and Conclusions
Author Contributions
Funding
Acknowledgments
Conflicts of Interest
References
- Pike, R.J.; Park, M. Geomorphometry—Progress, practice and prospect. Z. Geomorphol. 1995, 101, 221–235. [Google Scholar]
- Florinsky, I. Digital Terrain Analysis in Soil Science and Geology; Academic Press: Amsterdam, The Netherlands, 2011. [Google Scholar]
- Barka, I.; Vladovic, J.; Máli, Š. Landform Classification and Its Application in Predictive Mapping of Soil and Forest Units. In Proceedings of the GIS Ostrava, Ostrava, Czech Republic, 24–26 January 2011; p. 11. [Google Scholar]
- Prasannakumar, V.; Shiny, R.; Geetha, N.; Vijith, H. Applicability of SRTM data for landform characterisation and geomorphometry: A comparison with contour-derived parameters. Int. J. Digit. Earth 2011, 4, 387–401. [Google Scholar] [CrossRef]
- Jasiewicz, J.; Stepinski, T.F. Geomorphons—A pattern recognition approach to classification and mapping of landforms. Geomorphology 2013, 182, 147–156. [Google Scholar] [CrossRef]
- Kramm, T.; Hoffmeister, D.; Curdt, C.; Maleki, S.; Khormali, F.; Kehl, M. Accuracy Assessment of Landform Classification Approaches on Different Spatial Scales for the Iranian Loess Plateau. ISPRS Int. J. Geo-Inf. 2017, 6, 366. [Google Scholar] [CrossRef]
- Food4Rhino Apps for Rhino and Grasshopper. Available online: https://www.food4rhino.com/app/bison (accessed on 10 November 2018).
- Rhinoceros. Available online: https://www.rhino3d.com/es/ (accessed on 15 November 2018).
- e-on Software. Available online: https://info.e-onsoftware.com/more-info-vue (accessed on 12 November 2018).
- Planetside Software. Available online: https://planetside.co.uk/ (accessed on 12 November 2018).
- Autodesk. Available online: https://www.autodesk.com/# (accessed on 23 November 2018).
- Autodesk 3DS MAX. Available online: https://www.autodesk.es/products/3ds-max/overview (accessed on 14 October 2018).
- World Machine. Stop Hand Sculpting 3D Terrain. Available online: https://www.world-machine.com/ (accessed on 14 November 2018).
- Ehlers, M. Geoinformatics and digital earth initiatives: A German perspective. Int. J. Digit. Earth 2008, 1, 17–30. [Google Scholar] [CrossRef]
- Zhu, L.; Pan, X.; Gao, G. Assessing Place Location Knowledge Using a Virtual Globe. J. Geogr. 2016, 112, 72–80. [Google Scholar] [CrossRef]
- Foresman, T.; Schade, S.; Georgiadou, Y.; Strobl, J. Does DE need a C? A proposal for a DE curriculum. Int. J. Digit. Earth 2014, 7, 88–92. [Google Scholar] [CrossRef]
- Carbonell-Carrera, C.; Bermejo Asensio, L.A. Augmented reality as a digital teaching environment to develop spatial thinking. Cartogr. Geogr. Inf. Sci. 2017, 44, 259–270. [Google Scholar] [CrossRef]
- Carbonell, C.; Avarvarei, B.V.; Cheliaru, E.L.; Draghia, L.; Avarvarei, S.C. Map-reading skill development with 3D technologies. J. Geogr. 2017, 116, 197–205. [Google Scholar] [CrossRef]
- Nielsen, C.P.; Oberle, A.; Sugumaran, R. Implementing a High School Level Geospatial Technologies and Spatial Thinking Course. J. Geogr. 2011, 110, 60–69. [Google Scholar] [CrossRef]
- National Research Council. Learning to Think Spatially; National Academy Press: Washington, DC, USA, 2006. [Google Scholar]
- Hegarty, M.; Keehner, M.; Khooshabeh, P.; Montello, D.R. How Spatial Abilities Enhance, and are Enhanced By, Dental Education. Learn. Indiv. Differ. 2009, 19, 61–70. [Google Scholar] [CrossRef]
- Sorby, S.A. Educational Research in Developing 3-D Spatial Skills for Engineering Students. Int. J. Sci. Educ. 2009, 31, 459–480. [Google Scholar] [CrossRef]
- Sorby, S.A. Developing 3-D Spatial Visualization Skills. Eng. Des. Graph. J. 2009, 63, 21–32. [Google Scholar]
- Wai, J.; Lubinski, D.; Benbow, C.P. Spatial Ability for STEM Domains: Aligning over 50 Years of Cumulative Psychological Knowledge Solidifies Its Importance. J. Educ. Psychol. 2009, 101, 817–835. [Google Scholar] [CrossRef]
- Liben, L.S.; Kastens, K.A.; Christensen, A.E. Spatial Foundations of Science Education: The Illustrative Case of Instruction on Introductory Geological Concepts. Cognit. Instruct. 2011, 29, 45–87. [Google Scholar] [CrossRef]
- Uttal, D.H.; Meadow, N.G.; Tipton, E.; Hand, L.L.; Alden, A.R.; Warren, C.; Newcombe, N.S. The Malleability of Spatial Skills: A Meta-Analysis of Training Studies. Psychol. Bull. 2013, 139, 352–402. [Google Scholar] [CrossRef]
- Huynh, N.T.; Sharpe, B. An assessment instrument to measure geospatial thinking expertise. J. Geogr. 2013, 112, 3–17. [Google Scholar] [CrossRef]
- Carbonell-Carrera, C.; Jaeger, A.J.; Shipley, T.F. 2D Cartography Training: Has the Time Come for a Paradigm Shift? ISPRS Int. J. Geo-Inf. 2018, 7, 197. [Google Scholar] [CrossRef]
- Collins, L. The Impact of Paper Versus Digital Map Technology on Students’ Spatial Thinking Skill Acquisition. J. Geogr. 2018, 116, 137–152. [Google Scholar] [CrossRef]
- Eynard, J.D.; Jenny, B. Illuminated and shadowed contour lines: Improving algorithms and evaluating effectiveness. Int. J. Geogr. Inf. Sci. 2016, 30, 1923–1943. [Google Scholar] [CrossRef]
- 2009 Beijing Declaration on Digital Earth. Int. J. Digit. Earth 2009, 2, 397–399. [CrossRef]
- Xu, G.H.; Chen, Y.T. Towards Digital Earth. In Proceedings of the International Symposium on Digital Earth, Beijing, China, 30 November–2 December 1999. [Google Scholar]
- Kerski, J.J. The role of GIS in Digital Earth education. Int. J. Digit. Earth 2008, 1, 326–346. [Google Scholar] [CrossRef]
- Manson, S.; Shannon, J.; Eria, S.; Kne, L.; Dyke, K.; Nelson, S.; Batra, L.; Bonsal, D.; Kernik, M.; Immich, J.; et al. Resource Needs and Pedagogical Value of Web Mapping for Spatial Thinking. J. Geogr. 2014, 113, 107–117. [Google Scholar] [CrossRef]
- Tulla, A.; Busto, J.R.; Gabilondo, A.; Ruiz-Rivas, C.; Laka, J.P.; Rosselló, G. White Paper Degree in Geography and Planning; National Agency for Quality Assessment and Accreditation (ANECA): Madrid, Spain, 2004; pp. 177–186. [Google Scholar]
- Chueca, M.; Salcedo, F.; Ferrer, J.; Galán, L.; Olivé, J. White Paper Title Engineer Degree in Geomatics and Surveying; National Agency for Quality Assessment and Accreditation (ANECA): Madrid, Spain, 2004; pp. 118–148. [Google Scholar]
- Huggett, R. Fundamentals of Geomorphology; Routledge: London, UK, 2007. [Google Scholar]
- Rapp, D.N.; Culpepper, S.A.; Kirkby, K.; Morin, P. Fostering students’ comprehension of topographic maps. J. Geosci. Educ. 2007, 55, 5–16. [Google Scholar] [CrossRef]
- Clark, D.; Reynolds, S.; Lemanowski, V.; Stiles, T.; Yasar, S.; Proctor, S.; Lewis, E.; Stromfors, C.; Korkins, J. University students’ conceptualization and interpretation of topographic maps. Int. J. Sci. Educ. 2008, 30, 375–406. [Google Scholar] [CrossRef]
- Reusser, L.J.; Corbett, L.B.; Bierman, P.R. Incorporating concept sketching into teaching undergraduate geomorphology. J. Geosci. Educ. 2012, 60, 3–9. [Google Scholar] [CrossRef]
- Snavely, L.; Cooper, N. The information literacy debate. J. Acad. Librariansh. 1997, 23, 9–14. [Google Scholar] [CrossRef]
- Dikmenli, Y. Geographic literacy perception scale (GLPS) validity and reliability study. Mevlana Int. J. Educ. 2014, 4, 1–15. [Google Scholar] [CrossRef]
- Van der Schee, J.; Notte, H.; Zwartjes, L. Some thoughts about a new international geography test. Int. Res. Geogr. Environ. Educ. 2010, 19, 277–282. [Google Scholar] [CrossRef]
- Johnson, L.; Adams Becker, S.; Estrada, V.; Freeman, A. NMC Horizon Report: 2014 Higher Education Edition; The New Media Consortium: Austin, TX, USA, 2014. [Google Scholar]
- Jacovina, M.; Ormand, C.; Shipley, T.F.; Weisberg, S. Topographic Map Assessment. 2014. Available online: http://www.spatiallearning.org/index.php/resources/testsainstruments (accessed on March 2017).
- Vandenberg, S.G.; Kuse, A.R. Mental rotations, a group test of three-dimensional spatial visualization. Percept. Motor Skills 1978, 47, 599–604. [Google Scholar] [CrossRef] [PubMed]
- Kozhevnicov, M.; Hegarty, M. A dissociation between object manipulation, spatial ability and spatial orientation ability. Mem. Cognit. 2001, 29, 746–756. [Google Scholar] [CrossRef]
- George, D.; Mallery, M. SPSS for Windows Step by Step: A Simple Guide and Reference; Allyn & Bacon: Boston, MA, USA, 2003. [Google Scholar]
- Augmented Reality Snadbox. Available online: https://arsandbox.ucdavis.edu/ (accessed on 15 November 2018).
- Afrooz, A.; Ballal, H.; Pettit, C. Implementing Augmented Reality Sandbox in geodesign: A future. ISPRS Ann. Photogramm. Remote Sens. Spat. Inf. Sci. 2018, IV-4, 5–12. [Google Scholar] [CrossRef]
- MIT Media Lab. Tangible Media Group. Available online: http://tangible.media.mit.edu/project/illuminating-clay/ (accessed on 10 November 2018).


© 2019 by the authors. Licensee MDPI, Basel, Switzerland. This article is an open access article distributed under the terms and conditions of the Creative Commons Attribution (CC BY) license (http://creativecommons.org/licenses/by/4.0/).
Share and Cite
Carbonell-Carrera, C.; Hess-Medler, S. 3D Landform Modeling to Enhance Geospatial Thinking. ISPRS Int. J. Geo-Inf. 2019, 8, 65. https://doi.org/10.3390/ijgi8020065
Carbonell-Carrera C, Hess-Medler S. 3D Landform Modeling to Enhance Geospatial Thinking. ISPRS International Journal of Geo-Information. 2019; 8(2):65. https://doi.org/10.3390/ijgi8020065
Chicago/Turabian StyleCarbonell-Carrera, Carlos, and Stephany Hess-Medler. 2019. "3D Landform Modeling to Enhance Geospatial Thinking" ISPRS International Journal of Geo-Information 8, no. 2: 65. https://doi.org/10.3390/ijgi8020065
APA StyleCarbonell-Carrera, C., & Hess-Medler, S. (2019). 3D Landform Modeling to Enhance Geospatial Thinking. ISPRS International Journal of Geo-Information, 8(2), 65. https://doi.org/10.3390/ijgi8020065