Article

Data Fusion and Accuracy Analysis of Multi-Source Land Use/Land Cover Datasets along Coastal Areas of the Maritime Silk Road

1
Yantai Institute of Coastal Zone Research, Chinese Academy of Sciences, Yantai 264003, China
2
College of Resources and Environment, University of Chinese Academy of Sciences, Beijing 100049, China
3
Key Laboratory of Coastal Environmental Processes and Ecological Remediation, CAS, Yantai 264003, China
4
Center for Ocean Mega-Science, CAS, Qingdao 266071, China
*
Author to whom correspondence should be addressed.
ISPRS Int. J. Geo-Inf. 2019, 8(12), 557; https://doi.org/10.3390/ijgi8120557
Submission received: 4 November 2019 / Revised: 24 November 2019 / Accepted: 2 December 2019 / Published: 4 December 2019

Abstract

:
High-precision land use/land cover classification mapping derived from remote sensing supplies essential datasets for scientific research on environmental assessment, climate change simulation, geographic condition monitoring, and environmental management at global and regional scales. It is an important issue in the study of earth system science, and the coastal area is a hot spot region in this field. In this paper, the coastal areas of the Maritime Silk Road were used as the research object and a fusion method based on agreement analysis and fuzzy-set theory was adopted to achieve the fusion of three land use/land cover datasets: MCD12Q1-2010, CCI-LC2010, and GlobeLand30-2010. The accuracy of the fusion results was analyzed using an error matrix, spatial confusion, average overall consistency, and average type-specific consistency. The main findings were as follows. (1) After the establishment of reference data based on Google Earth, both the producer accuracy and user accuracy of the fusion data were improved when compared with those of the three input data sources, and the fusion data had the highest overall accuracy and Kappa coefficient, with values of 90.37% and 0.8617, respectively. (2) Various input data sources differed in terms of the correctly classified contributions and misclassified influences of different land use/land cover types in the fusion data; furthermore, the overall accuracy and Kappa coefficient between the fusion data and any one of the input data sources were far higher than those between any two of the input data sources. (3) The average overall consistency of the fusion data was the highest at 89.29%, which was approximately 5% higher than that of the input data sources. (4) The average type-specific consistencies of cropland, forest, grassland, shrubland, wetland, artificial surfaces, bare land, and permanent snow and ice in the fusion data were the highest, with values of 69.95%, 74.41%, 21.24%, 34.22%, 97.62%, 51.83%, 84.39%, and 2.46%, respectively; compared with the input data sources, the average type-specific consistencies of the fusion data were 0.61–20.32% higher. This paper provides information and suggestions for the development and accuracy evaluation of future land use/land cover data in global and regional coastal areas.

1. Introduction

High-precision land use/land cover classification datasets at global and regional scales can provide important basic information to effectively support scientific research on global change and regional sustainable development, serving as a key information source with which to objectively describe the structure of terrestrial ecosystems and their ecological processes [1,2,3]. Countries and organizations worldwide have successively applied different imaging data and classification techniques to conduct numerous remote sensing mapping studies with land use/land cover as the main data type. Additionally, numerous land use/land cover datasets have been formed at global and regional scales [4,5], for example, IGBP-DISCover established by the United States Geological Survey, UMD developed by the University of Maryland in the United States, GLC2000 established by the Joint Research Center of the European Union, MCD12Q1 produced by Boston University in the United States, GlobCover and CCI-LC prepared by the European Space Agency, FROM-GLC developed by Tsinghua University in China, and GlobeLand30 provided by the National Administration of Surveying, Mapping and Geoinformation of China [6,7,8,9,10,11,12,13,14]. However, due to the use of different data sources, classification systems, and classification techniques, land use/land cover datasets from a single data source have many problems such as low accuracy, poor consistency, and significant differences from statistical data [15].
In the context of the coexistence of multi-source data and the increase in fusion research, finer land use/land cover remote sensing classification mapping based on multi-source data fusion has become a popular issue [16,17]. Specifically, the existing land use/land cover classification datasets are comprehensively utilized, and a mathematical algorithm is used for multi-source data fusion to obtain results that have spatiotemporal continuity and are accurately estimated. Overall, the fusion results, to a certain extent, exploit the advantages and characteristics of multi-source data and compensate for the defects and deficiencies of a single data source. Therefore, scholars and numerous international organizations are making full use of the advantages of data fusion technology to perform land use/land cover remote sensing classification mapping studies based on multi-source data fusion [18,19]. For example, Jung et al. proposed a fusion method based on the affinity index, which fuses GLCC, GLC2000, and MODIS data, and the fusion results were shown to better express land use/land cover types in heterogeneous regions [20]. Schepaschenko et al. used Russia as the research object and proposed a fusion method based on the suitability index, which fuses remote sensing data, statistical data and field survey data; the fusion results were applied to the parameter settings of a biochemical model [21]. Pérez-Hoyos et al. realized the fusion of CORINE, GLC2000, MODIS, and GlobCover data in the European region using fuzzy-set theory, and the fusion results were improved in terms of spatial consistency and accuracy [22]. Kinoshita et al. used a logistic regression model to realize the fusion of MOD12C4/5, UMD, GLC2000, GlobCover and GLCNMO data and found that the number of fusion datasets had an important impact on the accuracy of the fusion results [23]. Bai et al. designed a decision fusion method based on fuzzy logic, which fuses multi-source datasets such as GLCC, UMD, GLC2000, MODIS LC, GlobCover, MODIS VCF, MODIS Cropland Probability, and AVHRR CFTC, and generated a set of land use/land cover fusion data with a spatial resolution of 1 km at the global scale [24]. To date, remote sensing classification mapping of land use/land cover based on multi-source data fusion is relatively mature for most terrestrial areas, while related research on macro-scale coastal areas is still insufficient.
The Maritime Silk Road originates in the booming Asia–Pacific economic circle and reaches as far as the highly developed European economic circle; its development has benefitted countries along the route, although there has also been an impact on the ecological environment along the route [25,26]. The coastal area covers most of the coastal land area and near-shore sea area, and the land use/land cover in this area is significantly different from that of the land area due to the influence of land–sea patterns, climate, landforms, rivers emptying into the sea, vegetation, and other factors [27,28]. The coastal areas of the Maritime Silk Road are located between terrestrial ecosystems and marine ecosystems, serving as economically and culturally flourishing areas that contain clustered cities, populations, and industries and are composed of fragile ecosystems areas that are affected by human activity and climate change. Remote sensing classification mapping of land use/land cover in these areas can provide basic data sources for scientific research on environmental assessment, climate change simulation, geographic condition monitoring, and environmental management at the regional scale. Therefore, with reference to the evaluation of various classification data through existing research [4,5], the three land use/land cover classification datasets that have relatively high accuracy (MCD12Q1-2010, CCI-LC2010, and GlobeLand30-2010) were selected as the source datasets for the present research, in other words, based on the coastal areas of the Maritime Silk Road, an agreement analysis of land use/land cover datasets was carried out to determine the agreements and disagreements of the three datasets, and a fusion method based on fuzzy-set theory was used to reconstruct the disagreements to produce highly accurate land use/land cover fusion data. This paper lays a solid foundation for future research on data development and characteristic analysis of land use/land cover in global and regional coastal areas.

2. Study Area and Materials

2.1. Study Area

With comprehensive reference to relevant research results [29,30], based in East Asia, Southeast Asia, South Asia, West Asia, Northeast Africa, and Southern Europe, the study area was defined as the land area within 100 km of the coastline and the sea area within the 100 m isobath (Figure 1). The area covers a wide range of land and sea, where the natural environment has a complex diversity and human activity has a profound influence. The land use/land cover in the area is affected by natural conditions, resource endowments, the human environment, and the social economy and has the characteristics of being significantly different from the land area [31]. Specifically, in this area, the climate types show significant zonality including areas of temperate climate, subtropical climate, tropical climate, and Mediterranean climate, and the vegetation types show remarkable diversity including areas of temperate mixed forest, temperate deciduous broad-leaved forest, subtropical evergreen sclerophyllous forest, subtropical evergreen broad-leaved forest, rainforest, and savanna. Moreover, this area has a long coastline and many large ports including numerous large port cities such as Guangzhou, Bombay, Jakarta, Singapore, and Athens, and several major economic corridors such as the China–Indochina Peninsula, China–Pakistan, and China–Bangladesh–India–Myanmar, which are the most dynamic areas of prosperity and development in terms of regional economies.

2.2. Materials

In recent years, land use/land cover classification data at global and regional scales produced by multiple mapping techniques and data sources have been emerging and are gradually being applied such as IGBP-DISCover, UMD, GLC2000, MCD12Q1, GlobCover, CCI-LC, FROM-GLC, and GlobeLand30. We synthesized the evaluation of various classification data from existing research [4,5] and selected three classification data types that had relatively high overall accuracy (MCD12Q1-2010, CCI-LC2010, and GlobeLand30-2010) as the source datasets to carry out the present research (Table 1). MCD12Q1-2010, with a resolution of 500 m, whose land use/land cover was divided into 17 categories specified by the IGBP, was produced by Boston University in the United States using MODIS images [32]. CCI-LC2010, with a 300-m resolution, whose land use/land cover was divided into 22 categories specified by the FAO, was established by the European Space Agency using MERIS and SPOT-VGT images [11,33]. GlobeLand30-2010, with a resolution of 30 m, whose land use/land cover was divided into 10 types, was developed by the National Administration of Surveying, Mapping and Geoinformation of China; Landsat-TM/ETM7 images were used as the main image sources, and were supplemented by HJ-1A/b images [14,34].

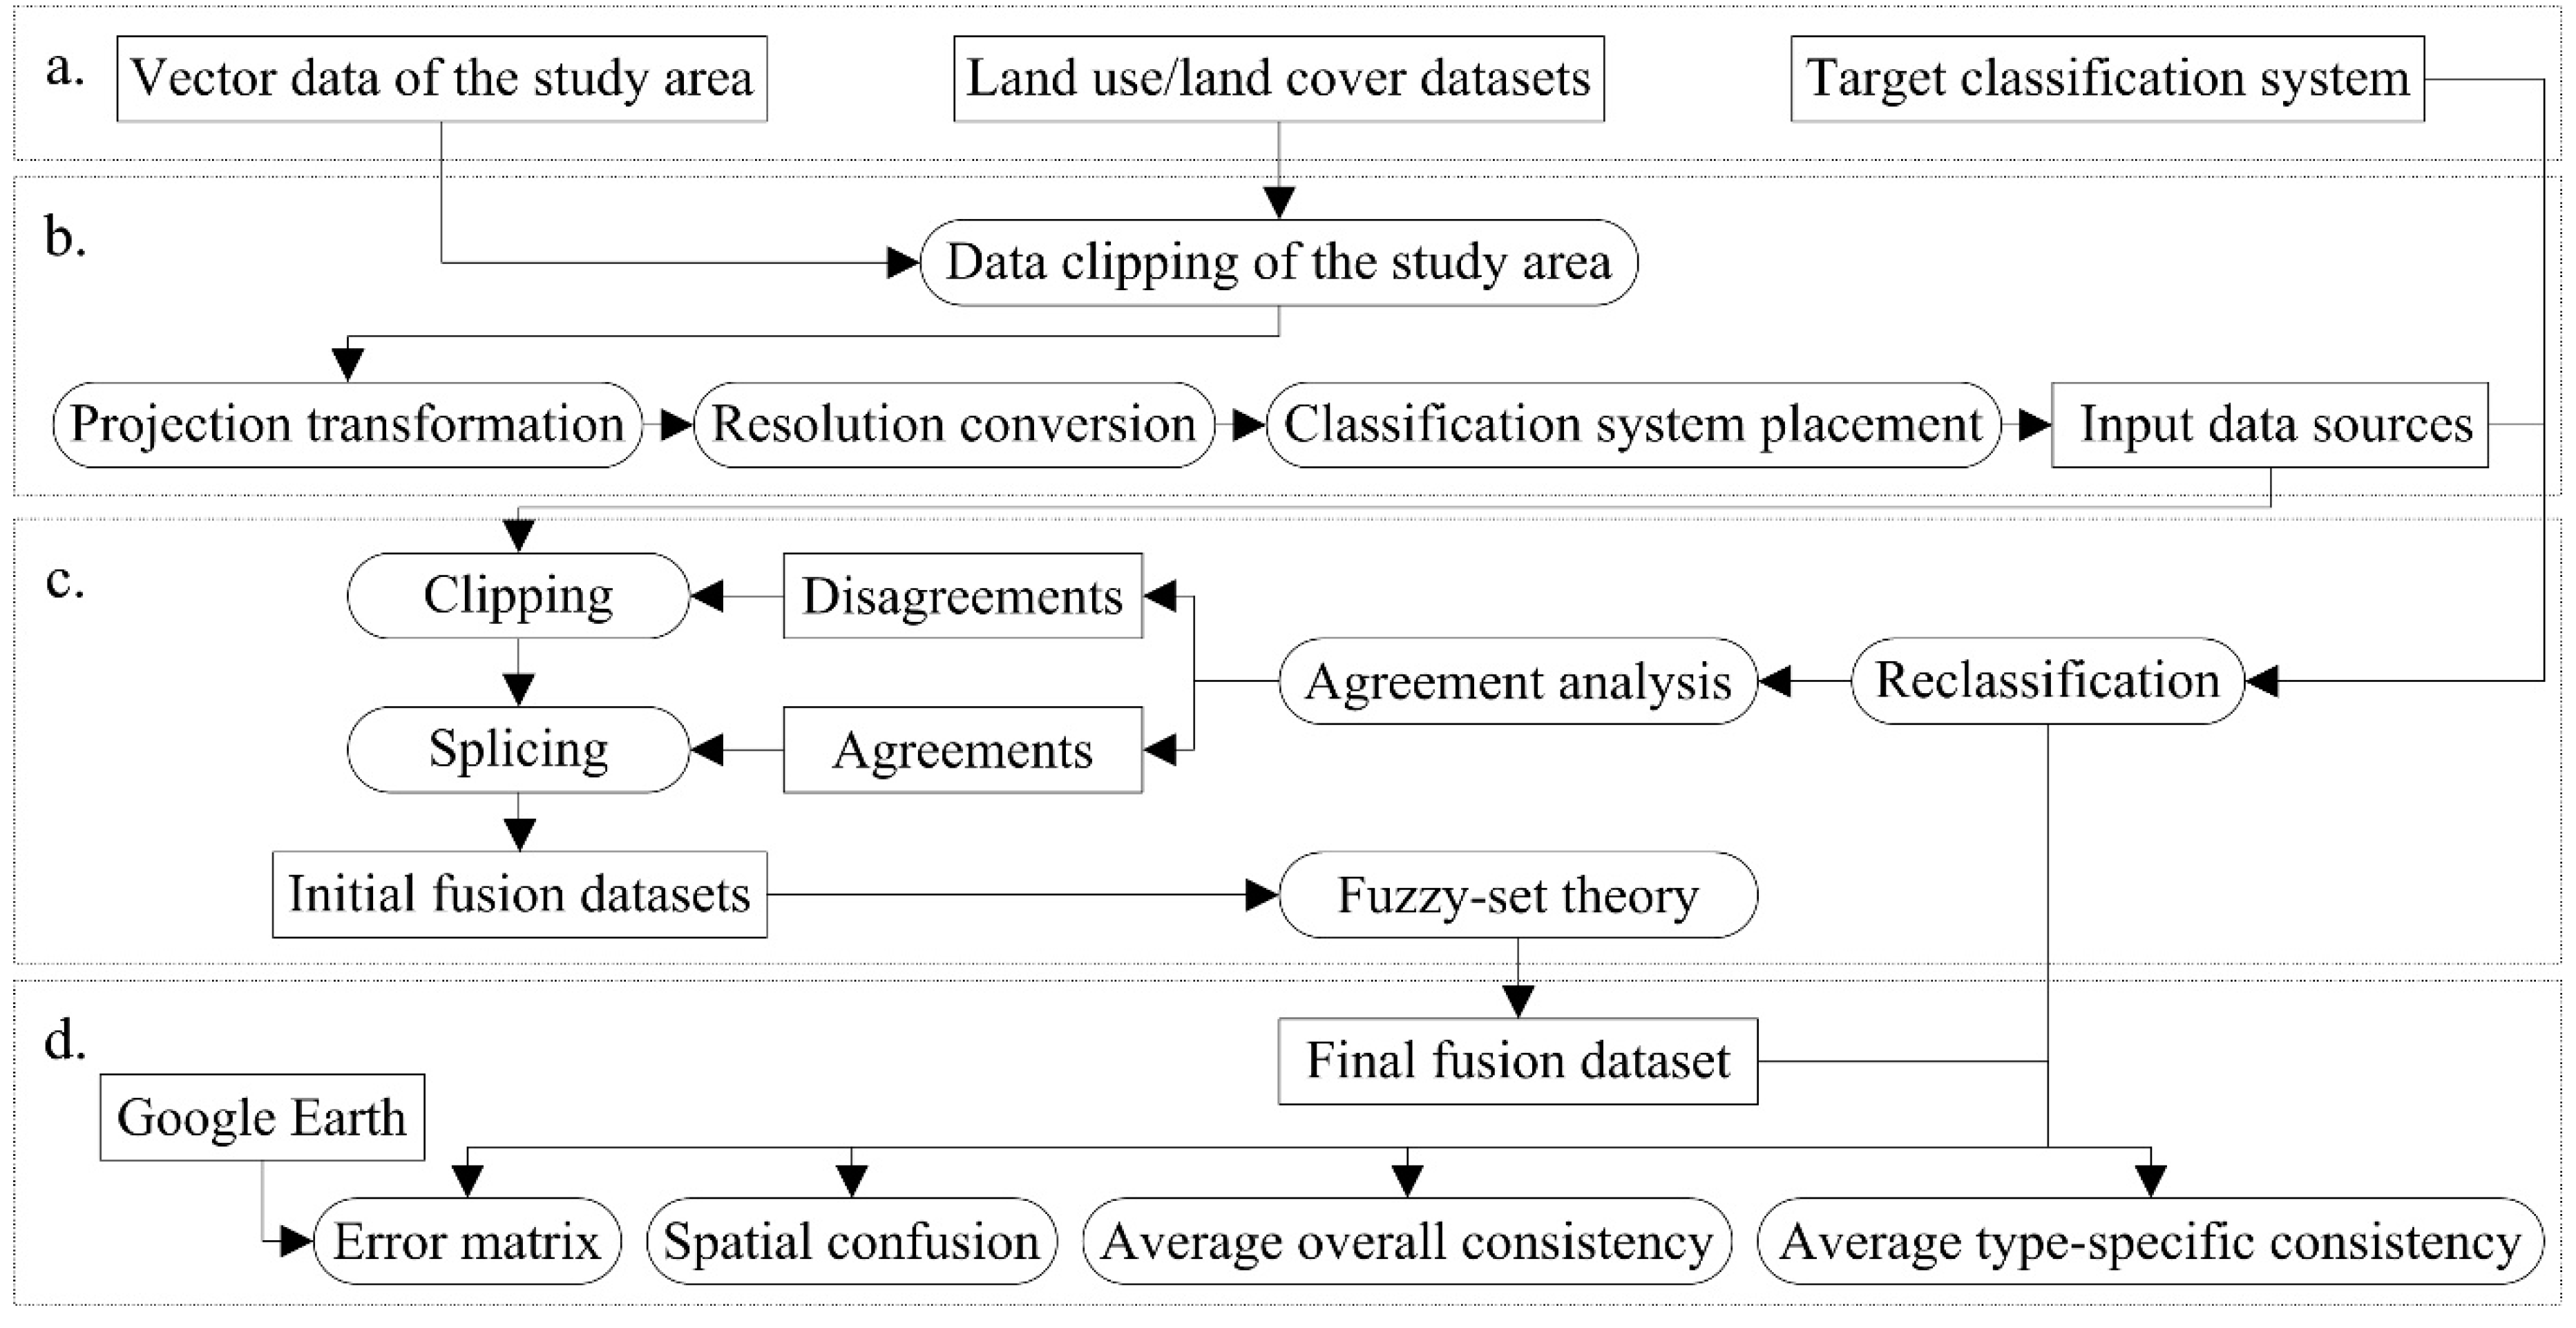
2.3. Data Pre-Processing

According to the requirements for multi-source data fusion, data pre-processing must be performed including for the above-mentioned three land use/land cover classification data, which were spliced and clipped with vector data for the study area to obtain land use/land cover classification datasets with consistent boundaries. To prevent area distortion, the three datasets were unified into the WGS 1984 cylindrical equal area projection. The maximum area polymerization method was adopted to convert the three datasets into a 300-m resolution, and the leading reason for choosing a 300-m resolution was that the datasets with a 300-m resolution had relatively superior classification results. The land use/land cover classification systems of three datasets [11,14,32] were reasonably placed, and the type codes and corresponding relationships after the placement are shown in Table 2.

3. Fusion Principle and Methods

3.1. Techniques

The specific techniques are shown in Figure 2. First, data collection and pre-processing were conducted. Then, a fusion method based on agreement analysis and fuzzy-set theory was used to realize the fusion of multi-source land use/land cover classification data. Finally, the accuracy of the fusion results was analyzed.

3.2. Establishment of Target Classification System

A scientific and reasonable land use/land cover classification system needs to be formulated, especially in research on land use/land cover remote sensing classification mapping. Referring to the existing research results [9,11,14,32,33,34], the coastal land use/land cover were divided into eight main types: cropland, forest, grassland, shrubland, wetland, artificial surfaces, bare land, and permanent snow and ice (Table 3). The classification system has two essential characteristics: (1) all classification information can be obtained from the above-mentioned three input data sources, and (2) all fusion results can be recognized by remote sensing images.

3.3. Agreement Analysis of Input Data Sources

Based on the land use/land cover classification system in Table 3, the land use/land cover types of the three input data sources were reclassified into eight target types, as shown in Table 4. Notably, in CCI-LC2010, the land use/land cover types coded as 40 and 100 were the mosaic cropland/natural vegetation (>50%) and the mosaic herbaceous cover/tree and shrub (>50%), respectively. The analysis showed that both types were advantageous to the proportion of forest; therefore, both types were included in the target type of forest. Additionally, to facilitate follow-up research, both water bodies and tundra from the input data sources were included in the target type of wetland.
Next, the three reclassified input data sources (i.e., MSRmcd-2010, MSRcci-2010, and MSRgl30-2010) were overlaid spatially to determine the pixel-by-pixel corresponding relationships of land use/land cover types among the three datasets. Then, pixel by pixel, we evaluated whether the land use/land cover types of different datasets were the same and determined the agreements and disagreements among the three datasets [35]. Specifically, for each pixel, if two or three of the three datasets used the same land use/land cover type, the type of the pixel would be defined as this type (i.e., agreement and codes 1–8); if there was a different type for each of the three datasets, the pixel would be defined as a disagreement and coded as 9. Finally, based on the disagreements, the three original land use/land cover classification data, which were not reclassified, were clipped, after which the three clipped datasets were spliced with the agreements to obtain the initial fusion datasets (i.e., Fmcd-1, Fcci-1, and Fgl30-1).

3.4. Reconstruction of Disagreements

A data fusion method based on fuzzy-set theory was used to reconstruct the above-mentioned initial land use/land cover fusion datasets.
First, for each initial type of each dataset, eight “membership degree” values were assigned to establish the corresponding relationships with each target type, characterizing the degree to which each initial type belonged to each target type. Notably, the affinity index was used to indicate the “membership degree”. Specifically, if the affinity index was 4, the initial type and the target type were identical; if the affinity index was 0, the two types were completely different; and if the affinity index was 1, 2, or 3, the degree of membership became stronger as the score increased. Appendix A, Appendix B and Appendix C present the membership degree scores of the three initial fusion datasets, respectively.
Second, one pixel was fixed in each turn. If the initial types of all three initial fusion datasets were 1–8, the pixel was defined as the initial type, and if the initial types of all three initial fusion datasets were not 1–8, the membership degrees of the initial types and the target types of the initial fusion datasets would be scored according to Appendix A, Appendix B and Appendix C. The specific formula is as follows [20]:
S t o t a l t ( i ,   j )   =   m = 1 3 [ 8 × S m t ( i ,   j ) + S m t ( i 1 ,   j ) + S m t ( i + 1 ,   j ) + S m t ( i ,   j 1 ) + S m t ( i ,   j + 1 ) + S m t ( i 1 ,   j 1 ) + S m t ( i 1 ,   j + 1 ) + S m t ( i + 1 ,   j 1 ) + S m t ( i + 1 ,   j + 1 ) ]
where i is the row of the current pixel; j is the column of the current pixel; t is the code of the target types; m is the code of the initial fusion datasets;   S m t ( i ,   j )   is the score of pixel (i, j) for target type t in the initial fusion dataset m; and S t o t a l t ( i ,   j )   is the total score of pixel (i, j) for target type t. To eliminate the hidden misclassifications in the initial fusion datasets and increase the scoring credibility in areas with diverse features, the pixel scores were weighted in a 3 × 3 field. After scoring, the total pixel scores for each target type were compared, and then the pixel was defined as the target type with the highest total score. Therefore, the final output was a set of land use/land cover fusion data of 300 m along coastal areas of the Maritime Silk Road based on 2010 (i.e., FusLULC-2010).

3.5. Accuracy Analysis Methods

The error (confusion) matrix is an effective method used to measure the classification accuracies of land use/land cover types in land use/land cover classification datasets [36,37,38]. By calculating the producer accuracy (PA), user accuracy (UA), overall accuracy (OA), and Kappa coefficient (K) of the reference data and the data that are to be verified, the consistency between two datasets can be measured. The specific formulas are as follows [39]:
P A t   =   n t t n + t
U A t   =   n t t n t +
O A   =   t = 1 8 n t t N
K   =   N t = 1 8 n t t t = 1 8 ( n t + n + t ) N 2 t = 1 8 ( n t + n + t )
where t is the land use/land cover type; ntt is the pixel number correctly classified in type t; n+t is the pixel number of type t in the reference data; nt+ is the pixel number of type t in the data that are waiting to be verified; and N is the total pixel number.
Google Earth can provide users with high-resolution global image data in real time, and these images have become effective reference data for the accuracy analysis of land use/land cover remote sensing mapping at moderate and low resolutions [40]. The specific processes of verification sample collection and mapping accuracy analysis were as follows: (1) Based on ArcGIS, sampling points were randomly generated in the study area; (2) the classification information at the sampling points of multi-source land use/land cover datasets were obtained through overlay analysis (i.e., the data that are to be verified); (3) the land use/land cover types of sampling points could be visually interpreted according to the high-resolution Google Earth images; notably, the land use/land cover type of a certain sampling point was defined as the most dominant land type within the 300 m × 300 m area around the sampling point (i.e., the reference data); and (4) the accuracy analysis results of land use/land cover remote sensing mapping were obtained based on the error matrix. Additionally, it is important to carry out the mutual validation of multi-source land use/land cover datasets [41]. Specifically, any two of the multi-source land use/land cover datasets were overlaid spatially to obtain the pixel-by-pixel corresponding relationships of land use/land cover types between two datasets, and then the spatial overlay results were summarized according to the confusion matrix. The spatial confusion of land use/land cover types and its accuracy characteristics were ultimately obtained.
The average overall consistency and the average type-specific consistency of land use/land cover datasets are effective indicators that can be used to quantitatively describe the consistency accuracies among the land use/land cover classification datasets [20,24]. In this paper, the consistencies between any two land use/land cover datasets were calculated (i.e., the percentage of pixels with the same classification types in the two datasets was calculated), and then the average overall consistency of one dataset was obtained by calculating the average of the consistencies between the dataset and any one of the other datasets. Additionally, the consistencies of a type between any two of land use/land cover datasets were calculated, and then the average consistency of this type in one dataset was obtained by calculating the average of the consistencies of this type between the dataset and any one of the other datasets. The specific formulas are as follows [42]:
M e a n C a   =   ( C a b + C a c + C a d ) / 3
C T a b t   =   n a b t / ( n a t + n b t n a b t )   ×   100
M e a n C T a t   =   ( C T a b t + C T a c t + C T a d t ) / 3
where ad are multi-source land use/land cover classification datasets;   C a * is the consistency between dataset a and any one of the other datasets;   M e a n C a     is the average overall consistency of dataset a; t is the land use/land cover type;   n a b t   is the pixel number of type t in both datasets;   n a t   and   n b t   are the pixel numbers of type t in datasets a and b, respectively;   C T a * t   is the consistency of type t between dataset a and any one of the other datasets; and   M e a n C T a t   is the average consistency of type t in dataset a.

4. Fusion Results and Accuracy Analysis

4.1. Fusion Results of Multi-Source Land Use/Land Cover Datasets

FusLULC-2010, a land use/land cover fusion dataset along coastal areas of the Maritime Silk Road, was obtained using the above-mentioned fusion method, as shown in Figure 3. Compared with the subjective cognition formed by visual observation of Google Earth images, it can be preliminarily determined that this dataset can accurately reflect the cropland that is widely distributed along the coasts of China’s Yellow and Bohai Seas, the Southeast Asian coast, the Indian east coast, and the Mediterranean coast. This method can accurately reflect the forest widely distributed along the coast of the Japan Sea, the southern Chinese coast, the Southeast Asian coast, the Indian west coast, and the southern European coast. It can accurately describe the grassland or shrubland distributed along the southern Spanish coast, coasts from Morocco to Algeria, the Greek coast, the southern Turkish coast, coasts from Djibouti to Somalia, and the western Yemeni coast. It can also accurately describe the bare land distributed along the northern Moroccan coast, coasts from Tunisia to Eritrea, and coasts from the Arabian Peninsula to Pakistan. Meanwhile, the wetland located at the junction of land and sea, the artificial surfaces distributed sporadically in the study area, and the permanent snow and ice originating from the Alps can also be accurately depicted.

4.2. Accuracy Analysis Based on Google Earth Sampling

Sampling points were randomly generated within the study area at a sampling interval of 5 km, and 5896 sampling points were ultimately obtained. Based on high-resolution Google Earth images, the land use/land cover types of sampling points were visually interpreted to gain the reference data. Then, the classification information at the sampling points of FusLULC-2010, MSRmcd-2010, MSRcci-2010, and MSRgl30-2010 were obtained through overlay analysis. Finally, the accuracy analysis results of land use/land cover remote sensing mapping were obtained based on the error matrix (Figure 4 and Table 5).
In FusLULC-2010, the producer accuracies of cropland, forest, shrubland, wetland, and artificial surfaces were higher than those of the three input data sources; in addition, the producer accuracy of grassland was lower than that in MSRgl30-2010 and the producer accuracy of bare land was lower than that in MSRcci-2010. Meanwhile, in FusLULC-2010, the user accuracies of forest, grassland, shrubland, and bare land were higher than those of the three input data sources; in addition, the user accuracies of cropland and wetland were lower than those of MSRgl30-2010 and the user accuracy of artificial surfaces was lower than that of MSRmcd-2010. Notably, the number of sampling points of permanent snow and ice was four, accounting for only 0.07% of the total sampling points; a small amount of reference data cannot accurately describe the reliability and availability of mapping results and can seriously misrepresent the real accuracy of mapping results.
Additionally, FusLULC-2010 had the highest overall accuracy and Kappa coefficient, with values of 90.37% and 0.8617, respectively, in other words, the overall accuracy was 3.22–5.94% higher than that of the three input data sources and the Kappa coefficient was 0.0455–0.0847 higher than that of the three input data sources.

4.3. Mutual Validation of Multi-Source Land Use/Land Cover Datasets

The confusion map of land use/land cover types and its accuracy characteristics of the four land use/land cover classification datasets of FusLULC-2010, MSRmcd-2010, MSRcci-2010, and MSRgl30-2010 were obtained, as shown in Figure 5 and Table 6.
As shown in Figure 5, in FusLULC-2010/MSRcci-2010, the cropland, wetland, artificial surfaces, bare land, and permanent snow and ice had the highest consistencies, with values of 86.91%, 99.06%, 81.59%, 97.22%, and 62.50%, respectively. Moreover, the consistencies of forest and grassland in FusLULC-2010/MSRgl30-2010 were the highest at 89.52% and 68.57%, respectively, and the consistency of shrubland in FusLULC-2010/MSRmcd-2010 was the highest at 67.41%. The above-mentioned results indicate that in the process of multi-source data fusion, MSRcci-2010 contributed the most to the fusion results of cropland, wetland, artificial surfaces, bare land, and permanent snow and ice. Moreover, MSRgl30-2010 contributed the most to the fusion results of forest and grassland and MSRmcd-2010 contributed the most to the fusion results of shrubland.
Similarly, in MSRcci-2010/MSRgl30-2010, the cropland, wetland, artificial surfaces, and bare land had the highest misclassifications (i.e., the errors mainly manifested as cropland and wetland that were misclassified as forest, artificial surfaces misclassified as cropland, and bare land misclassified as grassland and shrubland). In MSRmcd-2010/MSRcci-2010, the misclassifications of forest, grassland, and shrubland were the highest (i.e., the errors mainly showed that forest was misclassified as cropland; grassland was misclassified as cropland, forest, and shrubland; and shrubland was misclassified as forest, grassland, and bare land). Finally, the permanent snow and ice showed the most misclassifications in MSRmcd-2010/MSRgl30-2010, and almost all of them were misclassified as grassland, wetland or bare land. These results indicate that in the process of multi-source data fusion, MSRgl30-2010 had the greatest influence on the classification errors of cropland, wetland, artificial surfaces, and bare land, while MSRmcd-2010 and MSRcci-2010 had significant influences on the classification errors of forest and grassland. Moreover, MSRcci-2010 had the greatest influence on the classification errors of shrubland and MSRmcd-2010 and MSRgl30-2010 had significant influences on the classification errors of permanent snow and ice.
Additionally, as shown in Table 6, FusLULC-2010/MSRmcd-2010 showed the highest overall accuracy and Kappa coefficient with values of 90.44% and 0.8654, respectively; therefore, MSRmcd-2010 contributed slightly more to the fusion results than the other two data sources. Furthermore, the overall accuracies and Kappa coefficients of FusLULC-2010/MSRgl30-2010 and FusLULC-2010/MSRcci-2010 were only second and third, respectively, to those of FusLULC-2010/MSRmcd-2010, and were far higher than those of the other data combinations.

4.4. Consistencies of Multi-Source Land Use/Land Cover Datasets

The average overall consistencies and average type-specific consistencies of the land use/land cover classification datasets of FusLULC-2010, MSRmcd-2010, MSRcci-2010, and MSRgl30-2010 were analyzed, as shown in Table 7 and Figure 6.
As shown in Table 7, FusLULC-2010 had the highest average overall consistency (89.29%); MSRmcd-2010 and MSRgl30-2010 were second and third, respectively (84.74% and 84.11%); and MSRcci-2010 had the lowest average overall consistency (83.81%). Compared to the input data sources, the average overall consistency of FusLULC-2010 improved by approximately 5%. The overall consistencies of FusLULC-2010/MSRmcd-2010, FusLULC-2010/MSRcci-2010, and FusLULC-2010/MSRgl30-2010 were higher than 88%, and FusLULC-2010/MSRmcd-2010 had the highest overall consistency of 90.44%.
Additionally, as shown in Figure 6, compared to the three input data sources, the average consistencies of cropland, forest, grassland, shrubland, wetland, artificial surfaces, bare land, and permanent snow and ice in FusLULC-2010 were the highest, with values of 69.95%, 74.41%, 21.24%, 34.22%, 97.62%, 51.83%, 84.39%, and 2.46%, respectively. Thus, the classification results of cropland, forest, wetland, artificial surfaces, and bare land were relatively superior, while the classification results of grassland, shrubland, and permanent snow and ice were relatively poor. The reason for this difference is that cropland, forest, wetland, artificial surfaces, and bare land have distinctive spectral characteristics and clear spatial textures, while grassland, shrubland, and permanent snow and ice have similar spectral characteristics and fuzzy spatial distributions. Moreover, the average consistencies of cropland, forest, grassland, shrubland, wetland, artificial surfaces, bare land, and permanent snow and ice in FusLULC-2010 improved by 8.33–14.46%, 6.83–13.81%, 6.24–14.52%, 11.32–16.47%, 0.76–1.10%, 7.94–20.32%, 6.12–9.01%, and 0.61–1.98%, respectively, when compared to the values of the three input data sources.

5. Discussion

5.1. Superiority and Summary

High-precision land use/land cover remote sensing classification mapping is widely used in precision agriculture, vegetation ecology, wetland water quality, urban heat island, mineral resources, atmospheric environment, and other research fields. In this paper, multi-source data fusion was based on agreement analysis and fuzzy-set theory [20,35]. Only a small amount of computation was needed to weaken the contradiction between the multi-source land use/land cover datasets, and the advantages of various classification algorithms were integrated. Through error matrix, spatial confusion, average overall consistency, and average type-specific consistency, it was shown that regardless of the overall precision or the type precision, the fusion data obtained from the multi-source data fusion method adopted in this paper exhibited a certain improvement when compared with the input data sources.
Notably, the multi-source data fusion method proposed in this paper effectively combined the two evaluation factors of agreement and membership degree, which is relatively novel and unique. In comparison with existing studies [20,35,43,44], we found that the results obtained in this paper exhibited commonalities with the results of existing studies (i.e., the commonalities manifested as target classification system that was highly consistent, the data fusion method adopted was inherited and developed, and the accuracy of fusion results was improved). Additionally, the results obtained in this paper were distinctive (i.e., the features mainly showed that the study area was located in the coastal zone, and the coastal wetland had unique classification rules; MCD12Q1-2010, CCI-LC2010, and GlobeLand30-2010 were selected as the source datasets; and the time phase and spatial resolution of the fusion results were fixed at 2010 and 300 m, respectively).
The data fusion method based on agreement analysis and fuzzy-set theory adopted in this paper can be used for decision-making, future prediction, and accurate analysis of land use/land cover types in heterogeneous regions. When the input data sources have a wide range of heterogeneous regions in the distribution of land use/land cover types in the study area, it can be further processed based on the multi-source data fusion method adopted in this paper to improve the classification accuracies of the data sources. For example, the coexistence of grassland, shrubland, and forest occurred in a region along the coast of Somalia, and this region was defined as grassland, shrubland, and forest by the input data sources of different classification algorithms, respectively. Next, the multi-source data fusion based on agreement analysis and fuzzy-set theory was used to process this region. Compared with the subjective cognition formed by visual observation of high-resolution Google Earth images, it could be found that this region was indeed dominated by shrubland.

5.2. Limitation and Outlook

The data fusion method based on agreement analysis and fuzzy-set theory adopted in this paper has certain limitations. (1) Although the target classification system is comprehensive, it is too general. (2) Although the core algorithm is practical, its subjectivity is too large; notably, when selecting other source datasets as the research object, great efforts should be made to determine the degree of “fuzzy membership” between the initial types and target types. (3) The accuracy of the fusion results is affected by landscape heterogeneity in the study area. Therefore, although this research has made important progress in remote sensing classification mapping of land use/land cover based on multi-source data fusion, many follow-up studies [45,46] need to be completed to obtain the best fusion results.
For example, the target classification system can be further refined. With reference to the source datasets, this research divided the coastal land use/land cover into eight main types: cropland, forest, grassland, shrubland, wetland, artificial surfaces, bare land, and permanent snow and ice. Specifically, these types are high generalizations of actual land types, avoiding as much confusion as possible due to the complexity of classification. However, in view of the particularity of coastal areas, reasonable attention should be paid to wetland resources [47] in follow-up studies (i.e., on the basis of current research, emphasis should be given to the scientific classification of wetland resources in coastal areas including saltwater wetland and freshwater wetland).
Additionally, the data fusion algorithm can be further developed. The multi-source data fusion algorithm adopted in this paper was based on agreement analysis and fuzzy-set theory. Specifically, the degree of “fuzzy membership” between the initial types and target types in the disagreements was very subjective, and multitudinous scholars were consulted to determine the correlative scores to minimize the influence of subjectivity on fusion results in this research. However, the “agreement” definition itself, to some extent, will affect the fusion results. Therefore, more auxiliary information including the topography, temperature, precipitation, population, and economy, should be sought to support the decision-making fusion [48] in follow-up studies.
Finally, the accuracy of the fusion results can be further improved. In the fusion results of this paper, the classification results of cropland, forest, wetland, artificial surfaces, and bare land were relatively superior, while the classification results of grassland, shrubland, and permanent snow and ice were relatively poor. Therefore, data reconstruction by land types or subregions is an important direction [18] for future research (i.e., more accurate thematic data should be adopted to reclassify land types or subregions with relatively large misclassifications to effectively improve the accuracy of the fusion results at fixed points).

5.3. Previous Work and Follow-up Research

Previous work is as follows: (1) Remote sensing classification system of land use/land cover for global coastal zone was established considering fine classification of wetlands [49]; and (2) consistency of multiple remote sensing-based land use/land cover classification datasets in the global coastal zone was analyzed using deviation coefficient, correlation coefficient, error matrix, and spatial confusion [50]. Additionally, follow-up research is as follows: (1) Classification mapping and accuracy analysis of land use/land cover in the global coastal zone will be realized based on the multi-source data fusion method adopted in this paper; and (2) variation characteristics and driving factors of land use/land cover in the global coastal zone will be revealed using annual gradient, dynamic degree, and transfer matrix. Overall, these studies fill the gap in the study of land use/land cover in the global coastal zone, and provide references and suggestions for scientific research on the man–earth relationship, land resource management, ecological environmental protection, and coordinated economic development in coastal areas.

6. Conclusions

Multi-source data fusion, to a large extent, integrates the advantages of multi-source data and reduces the defects of single-source data to make the fusion data more accurate than the single-source data. Therefore, in view of the existing shortcomings of remote sensing data and fusion methods of land use/land cover in large-scale coastal areas, we used the three land use/land cover datasets of MCD12Q1-2010, CCI-LC2010, and GlobeLand30-2010 as input data sources and determined the agreements and disagreements of the three datasets through agreement analysis. Subsequently, we reclassified the disagreements based on fuzzy-set theory to generate a set of land use/land cover fusion data of 300 m along coastal areas of the Maritime Silk Road based on data from 2010 (i.e., FusLULC-2010). Finally, we evaluated the accuracy of the fusion results using the error matrix, spatial confusion, average overall consistency, and average type-specific consistency.
The research results are as follows: regardless of the overall precision or the type precision, the fusion data obtained from the above-mentioned method exhibited a certain improvement compared with the input data sources. In terms of the overall precision, the overall accuracy, Kappa coefficient, and average overall consistency of the fusion data were highest, with values of 90.37%, 0.8617, and 89.29%, respectively. Compared with the three input data sources, these precisions increased by 3.22–5.94%, 0.0455–0.0847, and 4.55–5.48%, respectively. The overall accuracies and Kappa coefficients between the fusion data and any one of the three input data sources were higher than those between any two of the three input data sources. In terms of the type precision, compared with the three input data sources, the producer accuracies, user accuracies, and average consistencies of each land use/land cover type in the fusion data were improved, especially in terms of the average type-specific consistencies, which increased by 0.61–20.32%. The various input data sources were different in terms of the correctly classified contributions and misclassified influences of different land use/land cover types in the fusion data. In summary, the improvement of the classification accuracy of the fusion data reflects the effectiveness, reliability, feasibility, controllability, and propagability of the multi-source data fusion method adopted in this paper.

Author Contributions

Wan Hou and Xiyong Hou conceived the idea for this paper. Then, the compilation of data and the data analysis for this paper were done by Wan Hou. Finally, this paper was written by Wan Hou and then sent to Xiyong Hou for comments.

Funding

This study was co-funded by the Strategic Priority Research Program of Chinese Academy of Sciences (No. XDA19060205) and the National Natural Science Foundation of China (No. 31461143032).

Acknowledgments

We sincerely thank the authors of the datasets that we used in this study.

Conflicts of Interest

The authors declare no conflicts of interest.

Appendix A

Table A1. Affinity Scores for the Fmcd-1.
Initial TypeTarget Type
12345678
140000000
204000000
300400000
400040000
500004000
600000400
700000040
800000004
1004000000
2004000000
3004000000
4004000000
5004000000
6000040000
7000040000
8002300000
9001310000
10000400000
11000004000
12040000000
13000000400
14031110000
15000000004
16001110030
17000004000

Appendix B

Table A2. Affinity Scores for the Fcci-1.
Initial TypeTarget Type
12345678
140000000
204000000
300400000
400040000
500004000
600000400
700000040
800000004
1130200000
1232020000
2040000000
3031110000
4022220000
5004000000
6104000000
6203110000
7104000000
7203110000
8104000000
8203110000
9004000000
10003230000
11002320000
12100040000
12200040000
13000400000
14000004000
15200020030
15300200030
16002003000
17002003000
18000223000
19000000400
20100000040
20200000040
21000004000
22000000004

Appendix C

Table A3. Affinity Scores for the Fgl30-1.
Initial TypeTarget Type
12345678
140000000
204000000
300400000
400040000
500004000
600000400
700000040
800000004
1040000000
2004000000
3000400000
4000040000
5000004000
6000004000
7000004000
8000000400
9000000040
10000000004

References

  1. Sutherland, W.J.; Adams, W.M.; Aronson, R.B.; Aveling, R.; Blackburn, T.M.; Broad, S.; Ceballos, G.; Cote, I.M.; Cowling, R.M.; Da Fonseca, G.A.B.; et al. One hundred questions of importance to the conservation of global biological diversity. Conserv. Biol. 2009, 23, 557–567. [Google Scholar] [CrossRef] [PubMed] [Green Version]
  2. Liu, J.X.; Vogelmann, J.E.; Zhu, Z.L.; Key, C.H.; Sleeter, B.M.; Price, D.T.; Chen, J.M.; Cochrane, M.A.; Eidenshink, J.C.; Howard, S.M.; et al. Estimating California ecosystem carbon change using process model and land cover disturbance data: 1951–2000. Ecol. Model. 2011, 222, 2333–2341. [Google Scholar] [CrossRef]
  3. Stewart, I.D.; Oke, T.R. Local climate zones for urban temperature studies. Bull. Am. Meteorol. Soc. 2012, 93, 1879–1900. [Google Scholar] [CrossRef]
  4. Congalton, R.G.; Gu, J.Y.; Yadav, K.; Thenkabail, P.; Ozdogan, M. Global land cover mapping: A review and uncertainty analysis. Remote Sens. 2014, 6, 12070–12093. [Google Scholar] [CrossRef] [Green Version]
  5. Grekousis, G.; Mountrakis, G.; Kavouras, M. An overview of 21 global and 43 regional land-cover mapping products. Int. J. Remote Sens. 2015, 36, 5309–5335. [Google Scholar] [CrossRef]
  6. Loveland, T.R.; Reed, B.C.; Brown, J.F.; Ohlen, D.O.; Zhu, Z.; Yang, L.; Merchant, J.W. Development of a global land cover characteristics database and IGBP DISCover from 1 km AVHRR data. Int. J. Remote Sens. 2000, 21, 1303–1330. [Google Scholar] [CrossRef]
  7. Hansen, M.C.; Defries, R.S.; Townshend, J.R.G.; Sohlberg, R. Global land cover classification at 1 km spatial resolution using a classification tree approach. Int. J. Remote Sens. 2000, 21, 1331–1364. [Google Scholar] [CrossRef]
  8. Bartholomé, E.; Belward, A.S. GLC2000: A new approach to global land cover mapping from Earth observation data. Int. J. Remote Sens. 2005, 26, 1959–1977. [Google Scholar] [CrossRef]
  9. Friedl, M.A.; McIver, D.K.; Hodges, J.C.F.; Zhang, X.Y.; Muchoney, D.; Strahler, A.H.; Woodcock, C.E.; Gopal, S.; Schneider, A.; Cooper, A.; et al. Global land cover mapping from MODIS: Algorithms and early results. Remote Sens. Environ. 2002, 83, 287–302. [Google Scholar] [CrossRef]
  10. Bicheron, P.; Amberg, V.; Bourg, L.; Petit, D.; Huc, M.; Miras, B.; Brockmann, C.; Hagolle, O.; Delwart, S.; Ranéra, F.; et al. Geolocation assessment of MERIS GlobCover orthorectified products. IEEE Trans. Geosci. Remote Sens. 2011, 49, 2972–2982. [Google Scholar] [CrossRef]
  11. ESA. CCI-LC Product User Guide v2.4. Available online: http://maps.elie.ucl.ac.be/CCI/viewer/download/ESACCI-LC-PUG-v2.4.pdf (accessed on 10 October 2014).
  12. Hartley, A.J.; MacBean, N.; Georgievski, G.; Bontemps, S. Uncertainty in plant functional type distributions and its impact on land surface models. Remote Sens. Environ. 2017, 203, 71–89. [Google Scholar] [CrossRef]
  13. Gong, P.; Wang, J.; Yu, L.; Zhao, Y.C.; Zhao, Y.Y.; Liang, L.; Niu, Z.G.; Huang, X.M.; Fu, H.H.; Liu, S.; et al. Finer resolution observation and monitoring of global land cover: First mapping results with Landsat TM and ETM+ data. Int. J. Remote Sens. 2013, 34, 2607–2654. [Google Scholar] [CrossRef] [Green Version]
  14. Chen, J.; Chen, J.; Liao, A.P.; Cao, X.; Chen, L.J.; Chen, X.H.; He, C.Y.; Han, G.; Peng, S.; Lu, M.; et al. Global land cover mapping at 30 m resolution: A POK-based operational approach. ISPRS J. Photogramm. Remote Sens. 2015, 103, 7–27. [Google Scholar] [CrossRef] [Green Version]
  15. Chen, B.; Huang, B.; Xu, B. Multi-source remotely sensed data fusion for improving land cover classification. ISPRS J. Photogramm. Remote Sens. 2017, 124, 27–39. [Google Scholar] [CrossRef]
  16. Fritz, S.; You, L.Z.; Bun, A.; See, L.; McCallum, I.; Schill, C.; Perger, C.; Liu, J.G.; Hansen, M.; Obersteiner, M. Cropland for sub-Saharan Africa: A synergistic approach using five land cover data sets. Geophys. Res. Lett. 2011, 38, L04404. [Google Scholar] [CrossRef] [Green Version]
  17. Vancutsem, C.; Marinho, E.; Kayitakire, F.; See, L.; Fritz, S. Harmonizing and combining existing land cover/land use datasets for cropland area monitoring at the African continental scale. Remote Sens. 2013, 5, 19–41. [Google Scholar] [CrossRef] [Green Version]
  18. Yu, L.; Wang, J.; Li, X.C.; Li, C.C.; Zhao, Y.Y.; Gong, P. A multi-resolution global land cover dataset through multisource data aggregation. Sci. China Earth Sci. 2014, 57, 2317–2329. [Google Scholar] [CrossRef]
  19. See, L.; Schepaschenko, D.; Lesiv, M.; McCallum, I.; Fritz, S.; Comber, A.; Perger, C.; Schill, C.; Zhao, Y.Y.; Maus, V.; et al. Building a hybrid land cover map with crowdsourcing and geographically weighted regression. ISPRS J. Photogramm. Remote Sens. 2015, 103, 48–56. [Google Scholar] [CrossRef] [Green Version]
  20. Jung, M.; Henkel, K.; Herold, M.; Churkina, G. Exploiting synergies of global land cover products for carbon cycle modeling. Remote Sens. Environ. 2006, 101, 534–553. [Google Scholar] [CrossRef]
  21. Schepaschenko, D.; McCallum, I.; Shvidenko, A.; Fritz, S.; Kraxner, F.; Obersteiner, M. A new hybrid land cover dataset for Russia: A methodology for integrating statistics, remote sensing and in situ information. J. Land Use Sci. 2011, 6, 245–259. [Google Scholar] [CrossRef]
  22. Pérez-Hoyos, A.; García-Haro, F.J.; San-Miguel-Ayanz, J. A methodology to generate a synergetic land-cover map by fusion of different land-cover products. Int. J. Appl. Earth Obs. Geoinf. 2012, 19, 72–87. [Google Scholar] [CrossRef]
  23. Kinoshita, T.; Iwao, K.; Yamagata, Y. Creation of a global land cover and a probability map through a new map integration method. Int. J. Appl. Earth Obs. Geoinf. 2014, 28, 70–77. [Google Scholar] [CrossRef]
  24. Bai, Y.; Feng, M. Data fusion and accuracy evaluation of multi-source global land cover datasets. Acta Geogr. Sin. 2018, 73, 2223–2235. [Google Scholar]
  25. Peng, P.; Yang, Y.; Lu, F.; Cheng, S.F.; Mou, N.X.; Yang, R. Modelling the competitiveness of the ports along the Maritime Silk Road with big data. Trans. Res. 2018, 118, 852–867. [Google Scholar] [CrossRef]
  26. Bellina, B.; Favereau, A.; Dussubieux, L. Southeast Asian early Maritime Silk Road trading polities’ hinterland and the sea-nomads of the Isthmus of Kra. J. Anthropol. Archaeol. 2019, 54, 102–120. [Google Scholar] [CrossRef]
  27. Masria, A.; Negm, A.; Iskander, M.; Saavedra, O. Coastal zone issues: A case study (Egypt). Proced. Eng. 2014, 70, 1102–1111. [Google Scholar] [CrossRef] [Green Version]
  28. Halkos, G.; Matsiori, S. Environmental attitudes and preferences for coastal zone improvements. Econ. Anal. Policy 2018, 58, 153–166. [Google Scholar] [CrossRef]
  29. Chang, Y.C. The ‘21st Century Maritime Silk Road Initiative’ and naval diplomacy in China. Ocean. Coast. Manag. 2018, 153, 148–156. [Google Scholar] [CrossRef]
  30. Jiang, L.P.; Jia, Y.; Zhang, C.; Wang, W.; Feng, X.J. Analysis of topology and routing strategy of container shipping network on “Maritime Silk Road”. Sustain. Comput. Informa. 2019, 21, 72–79. [Google Scholar] [CrossRef]
  31. Swaney, D.P.; Humborg, C.; Emeis, K.; Kannen, A.; Silvert, W.; Tett, P.; Pastres, R.; Solidoro, C.; Yamamuro, M.; Hénocque, Y.; et al. Five critical questions of scale for the coastal zone. Estuar. Coast. Shelf Sci. 2012, 96, 9–21. [Google Scholar] [CrossRef] [Green Version]
  32. Sulla-Menashe, D.; Gray, J.M.; Abercrombie, S.P.; Friedl, M.A. Hierarchical mapping of annual global land cover 2001 to present: The MODIS Collection 6 Land Cover product. Remote Sens. Environ. 2019, 222, 183–194. [Google Scholar] [CrossRef]
  33. Mousivand, A.; Arsanjani, J.J. Insights on the historical and emerging global land cover changes: The case of ESA-CCI-LC datasets. Appl. Geogr. 2019, 106, 82–92. [Google Scholar] [CrossRef]
  34. Arsanjani, J.J.; Tayyebi, A.; Vaz, E. GlobeLand30 as an alternative fine-scale global land cover map: Challenges, possibilities, and implications for developing countries. Habitat Int. 2016, 55, 25–31. [Google Scholar] [CrossRef]
  35. Ramankutty, N.; Evan, A.T.; Monfreda, C.; Foley, J.A. Farming the planet: 1. Geographic distribution of global agricultural lands in the year 2000. Global Biogeochem. Cycles 2008, 22, GB1003. [Google Scholar] [CrossRef]
  36. Iwao, K.; Nasahara, K.N.; Kinoshita, T.; Yamagata, Y.; Patton, D.; Tsuchida, S. Creation of new global land cover map with map integration. J. Geogr. Inf. Syst. 2011, 3, 160–165. [Google Scholar] [CrossRef] [Green Version]
  37. Ran, Y.H.; Li, X.; Lu, L.; Li, Z.Y. Large-scale land cover mapping with the integration of multi-source information based on the Dempster-Shafer theory. Int. J. Geogr. Inf. Sci. 2012, 26, 1–23. [Google Scholar] [CrossRef]
  38. Olofsson, P.; Foody, G.M.; Herold, M.; Stehman, S.V.; Woodcock, C.E.; Wulder, M.A. Good practices for estimating area and assessing accuracy of land change. Remote Sens. Environ. 2014, 148, 42–57. [Google Scholar] [CrossRef]
  39. Yang, Y.K.; Xiao, P.F.; Feng, X.Z.; Li, H.X.; Chang, X.; Feng, W.D. Comparison and assessment of large-scale land cover datasets in China and adjacent regions. J. Remote Sens. 2014, 18, 453–475. [Google Scholar] [CrossRef]
  40. Hou, X.Y.; Di, X.H.; Hou, W.; Wu, L.; Liu, J.; Wang, J.H.; Su, H.F.; Lu, X.; Ying, L.L.; Yu, X.Y.; et al. Accuracy evaluation of land use mapping using remote sensing techniques in coastal zone of China. J. Geo-Inf. Sci. 2018, 20, 1478–1488. [Google Scholar]
  41. Wickham, J.D.; Stehman, S.V.; Fry, J.A.; Smith, J.H.; Homer, C.G. Thematic accuracy of the NLCD 2001 land cover for the conterminous United States. Remote Sens. Environ. 2010, 114, 1286–1296. [Google Scholar] [CrossRef]
  42. Feng, M.; Bai, Y. A global land cover map produced through integrating multi-source datasets. Big Earth Data 2019, 3, 191–219. [Google Scholar] [CrossRef] [Green Version]
  43. Fritz, S.; See, L.; McCallum, I.; You, L.Z.; Bun, A.; Moltchanova, E.; Duerauer, M.; Albrecht, F.; Schill, C.; Perger, C.; et al. Mapping global cropland and field size. Glob. Chang. Biol. 2015, 21, 1980–1992. [Google Scholar] [CrossRef] [PubMed]
  44. Liu, M.; Cao, X.; Li, Y.; Chen, J.; Chen, X.H. Method for land cover classification accuracy assessment considering edges. Sci. China Earth Sci. 2016, 59, 2318–2327. [Google Scholar] [CrossRef]
  45. Judah, A.; Hu, B.X. The integration of multi-source remotely-sensed data in support of the classification of wetlands. Remote Sens. 2019, 11, 1537. [Google Scholar] [CrossRef] [Green Version]
  46. Amani, M.; Salehi, B.; Brisco, B.; Mahdavi, S.; Granger, J. Wetland classification in Newfoundland and Labrador using multi-source SAR and optical data integration. GISci. Remote Sens. 2017, 54, 779–796. [Google Scholar] [CrossRef]
  47. Hu, S.J.; Niu, Z.G.; Chen, Y.F. Global wetland datasets: A review. Wetlands 2017, 37, 807–817. [Google Scholar] [CrossRef]
  48. Dendoncker, N.; Rounsevell, M.; Bogaert, P. Spatial analysis and modelling of land use distributions in Belgium. Comput. Environ. Urban. Syst. 2007, 31, 188–205. [Google Scholar] [CrossRef]
  49. Hou, W.; Hou, X.Y. Remote sensing classification system of land use and land cover for global coastal zone considering fine classification of wetlands. Trop. Geogr. 2018, 38, 866–873. [Google Scholar]
  50. Hou, W.; Hou, X.Y. Consistency of the multiple remote sensing-based land use and land cover classification products in the global coastal zones. J. Geo-Inf. Sci. 2019, 21, 1061–1073. [Google Scholar]
Figure 1. Overview map of the study area.
Ijgi 08 00557 g001
Figure 2. Research contents and technical approaches. (a) Data collection; (b) data pre-processing; (c) multi-source data fusion; (d) data accuracy analysis.
Ijgi 08 00557 g002
Figure 3. The fusion dataset of land use/land cover along coastal areas of the Maritime Silk Road (FusLULC-2010).
Ijgi 08 00557 g003
Figure 4. Comparison of type precision between the Google Earth reference data and land use/land cover data (1. Cropland; 2. Forest; 3. Grassland; 4. Shrubland; 5. Wetland; 6. Artificial surfaces; 7. Bare land; 8. Permanent snow and ice).
Ijgi 08 00557 g004
Figure 5. Spatial confusion of land use/land cover types between any two different datasets (1. Cropland; 2. Forest; 3. Grassland; 4. Shrubland; 5. Wetland; 6. Artificial surfaces; 7. Bare land; 8. Permanent snow and ice). Notes: In this figure, ft stands for confounding relationships between two datasets. Taking Figure 5a as an example, the x-coordinate represents land use/land cover types of FusLULC-2010 and the y-coordinate represents the pixel percentages of various types in MSRmcd-2010 on a certain type of FusLULC-2010.
Ijgi 08 00557 g005aIjgi 08 00557 g005b
Figure 6. Comparison of average consistency among FusLULC-2010 and three original land use/land cover datasets (1. Cropland; 2. Forest; 3. Grassland; 4. Shrubland; 5. Wetland; 6. Artificial surfaces; 7. Bare land; 8. Permanent snow and ice).
Ijgi 08 00557 g006
Table 1. Basic information of the three land use/land cover datasets.
Data NameMCD12Q1CCI-LCGlobeLand30
Period/year201020102010
Resolution/m50030030
Overall accuracy/%71.670.880.3
SensorMODISMERIS, SPOT-VGTLandsat-TM/ETM7, HJ-1A/b
Classification systemIGBP 17 classesFAO LCCS 22 classes10 classes
Classification methodDecision treeNeural networkPOK-based
CreatorNASAESANASG
Download data URLhttps://ladsweb.modaps.eosdis.nasa.gov/search/http://maps.elie.ucl.ac.be/CCI/viewer/http://www.globallandcover.com/GLC30Download/DownLoad.aspx
Notes: NASA, the National Aeronautics and Space Administration in the United States; ESA, the European Space Agency; and NASG, the National Administration of Surveying, Mapping and Geoinformation of China.
Table 2. Classification systems of the three land use/land cover datasets.
MCD12Q1-2010CCI-LC2010GlobeLand30-2010
Croplands120Cropland, rainfed, herbaceous cover11Cultivated land10
Cropland, rainfed, tree or shrub cover12
Cropland, irrigated or post-flooding20
Cropland/natural vegetation mosaic140Mosaic natural vegetation/cropland (>50%)30
Mosaic cropland/natural vegetation (>50%)40
Evergreen broadleaf forest20Tree cover, broadleaved, evergreen, closed to open50Forest20
Deciduous broadleaf forest40Tree cover, broadleaved, deciduous, closed61
Tree cover, broadleaved, deciduous, open62
Evergreen needleleaf forest10Tree cover, needle-leaved, evergreen, closed71
Tree cover, needle-leaved, evergreen, open72
Deciduous needleleaf forest30Tree cover, needle-leaved, deciduous, closed81
Tree cover, needle-leaved, deciduous, open82
Mixed forests50Tree cover, mixed leaf type90
Woody savannas80Mosaic herbaceous cover/tree and shrub (>50%)100Grassland30
Savannas90Mosaic tree and shrub/herbaceous cover (>50%)110
Grasslands100Grassland130
Closed shrublands60Evergreen shrubland121Shrubland40
Open shrublands70Deciduous shrubland122
Permanent wetlands110Tree cover, flooded, fresh or brackish water160Wetland50
Tree cover, flooded, saline water170
Shrub or herbaceous cover, flooded, fresh/saline/brackish water180
Water170Water bodies210Water bodies60
------Lichens and mosses140Tundra70
Urban and built-up130Urban areas190Artificial surfaces80
Barren or sparsely vegetated160Sparse shrub152Bare land90
Sparse herbaceous cover153
Consolidated bare areas201202
Unconsolidated bare areas
Snow and ice150Permanent snow and ice220Permanent snow and ice100
Notes: The numbers in this table are the type codes of the original classification system of multi-source land use/land cover datasets.
Table 3. Land use/land cover classification system of the study area.
NumberType NameDescription
1CroplandLand used for agriculture, horticulture and gardens.
2ForestLand covered by trees, with vegetation cover over 10%.
3GrasslandLand covered by natural grass, with vegetation cover over 10%.
4ShrublandLand covered by shrubs, with vegetation cover over 10%.
5WetlandLand covered by water bodies or wetland plants.
6Artificial surfacesLand modified by human activities.
7Bare landLand with no vegetation cover or vegetation cover lower than 10%.
8Permanent snow and iceLand covered by permanent snow, glaciers or icecaps.
Table 4. Corresponding relationships of land use/land cover types in the three datasets.
Target TypeMCD12Q1-2010CCI-LC2010GlobeLand30-2010
1 Cropland120, 14011, 12, 20, 3010
2 Forest10, 20, 30, 40, 5040, 50, 61, 62, 71, 72, 81, 82, 90, 10020
3 Grassland80, 90, 100110, 13030
4 Shrubland60, 70121, 12240
5 Wetland110, 170160, 170, 180, 210, 14050, 60, 70
6 Artificial surfaces13019080
7 Bare land160152, 153, 201, 20290
8 Permanent snow and ice150220100
Notes: The numbers in this table are the type codes of the original classification system of multi-source land use/land cover datasets, as shown in Table 2.
Table 5. Comparison of overall precision in the land use/land cover data.
Data NameOA/%Kappa Coefficient
FusLULC-201090.370.8617
MSRmcd-201084.550.7800
MSRcci-201084.430.7770
MSRgl30-201087.140.8162
Table 6. Comparison of overall precision between any two different datasets.
Data NameOA/%Kappa Coefficient
FusLULC-2010/MSRmcd-201090.440.8654
FusLULC-2010/MSRcci-201088.320.8339
FusLULC-2010/MSRgl30-201089.090.8455
MSRmcd-2010/MSRcci-201081.810.7438
MSRmcd-2010/MSRgl30-201081.960.7467
MSRcci-2010/MSRgl30-201081.280.7355
Table 7. Comparison of overall consistency among FusLULC-2010 and three original land use/land cover datasets (%).
Data NameFusLULC-2010MSRmcd-2010MSRcci-2010MSRgl30-2010
FusLULC-201089.2990.4488.3289.09
MSRmcd-201090.4484.7481.8181.96
MSRcci-201088.3281.8183.8181.28
MSRgl30-201089.0981.9681.2884.11
Notes: The values on the diagonal are the average overall consistencies of the four datasets, while the values on the non-diagonal are the overall consistencies between any two of the four datasets.

