1. Introduction
Ports consist of water and land facilities, including port waterways, breakwaters, terminals and ancillary facilities. The main function of ports is to provide logistics services for cargo transportation. Based on this fact, wharves are the most important part of a port, playing a vital role in water transportation. These structures are constructed to enable ships or ferries to berth on the seashore and riverside, to provide access for passengers, and for cargo to load and unload. Wharves are not only connection points of land and water transportation, but also key hubs of land and sea communications. Since the 13th Five-Year Plan, China has strengthened the construction of urban infrastructure, including wharves. By the end of 2017, 6209 and 12,120 berths for major ports and wharves along the coast and the inland river had been constructed, respectively. However, despite the remarkable achievement of the construction of wharves, several shortcomings and weaknesses, such as unequal supply of resources, imbalances in allocation, and other issues remain, gradually highlighted by the growth of the population and the improvement of the economy. Therefore, investigating the spatial pattern of wharves is necessary.
Wharves have a long history and have played an important role in human life. In recent years, the degree of specialization and automation of wharves has been greatly improved with the progress of society, and the number of studies on this field has been increasing. Erdogan et al. [
1,
2,
3] evaluated the seismic performance of wharves. Hamid et al. [
4] developed an idealized seismic vulnerability curve of the pile-supported wharf through actual frames. Paulauskas et al. [
5] investigated the possibilities of evaluating the stability and strength of the quay walls and the evaluation method. Su et al. [
6] used the Gauss process surrogate model to improve and update the traditional simulation method, thereby increasing the effectiveness of the uncertain quantitative calculation of the seismic response of wharf structures. Li et al. [
7] examined the seismic dynamic damage of vertical and batter pile-supported wharf structures. Wang et al. [
8] referred on a grey rough set (GRS) and the entropy weight method (EWM) to study the matching comprehensive evaluation of the adjustment of functional wharf areas. The dynamic properties of a wharf structure were evaluated via experiments [
9]. The aforementioned studies have investigated the structure and performance of wharves. There are few studies on wharves that mainly focused on their site selection from a geographical perspective. Zhou et al. [
10] selected the location of hazardous chemical wharves based on environmental risk consequence assessment. Shang et al. [
11] discussed the key factors of the liquefied natural gas (LNG) terminal location. Gu et al. [
12] discussed the layout of Shenzhen public yacht wharves based on land–sea coordination by using geographic information system (GIS) spatial analysis method and spatial syntax. However, studies on the spatial pattern of wharves are still lacking.
Spatial pattern analysis was originally developed in plant ecology to study the spatial distribution and allocation of plants based on a certain scale [
13]. In the late 1950s and early 1960s, this method was extended to other research fields. In geography, the spatial pattern is used to study the regularity and difference of the spatial distribution of various geographical elements and geographical phenomena. At present, spatial pattern analysis is widely used in the fields of population mobility [
14,
15], land use [
16], economic development [
17,
18], and layout of public service facilities [
19,
20,
21]. However, these works only analyze the spatial pattern from the perspective of spatial distribution characteristics. Some scholars have analyzed the spatial pattern from the perspective of geographical element allocation. Using GIS technology, Wu et al. [
22] studied the spatial allocation of public welfare leisure cultural service facilities in downtown Guangzhou based on accessibility and fairness. Li et al. [
23] evaluated the rationality of the allocation of daily living facilities in Futian District in Shenzhen by calculating the walk score of the area. Aforementioned studies have only evaluated the allocation level from one aspect, e.g., accessibility. However, the level of allocation may involve many factors. Therefore, the allocation level of wharves should be investigated on the basis of multiple factors.
In this study, the spatial location data of 1264 wharves in the Yangtze River Delta Urban Agglomeration are used to analyze their spatial pattern. Initially, the spatial distribution characteristics of wharves are examined by using the methods of nearest neighbor index (NNI), multi-distance spatial clustering, kernel density estimation, and standard deviation ellipse. The results show that the spatial distribution of wharves is aggregated and unbalanced. Then, the allocation level of the wharves is evaluated by constructing an index system. The result shows that the relationship between allocation level and number of wharves is not evident. Lastly, the relationship between spatial wharf pattern and economy is analyzed on a city scale of the studied area.
2. Materials and Methods
2.1. Study Area
This study was conducted in the Yangtze River Delta Urban Agglomeration, which is located in the alluvial plain formed by the Yangtze River, entering the sea in eastern China. The study area covers a province-level municipality under the central government and three provinces, namely, Shanghai, Jiangsu, Anhui, and Zhejiang (
Figure 1). The maps presented in this study use the CGCS2000 coordinate system and the Gauss–Kruger projection 3-degree zoning. In addition, the central meridian is at 120° E. The study area covers 26 prefectural-level cities and 203 districts, with an area of approximately 217,700 km
2, which accounts for about 2.2% of China’s territorial area. It is located near the Yellow Sea and the East China Sea. The geography of the study area includes the plain of the Yangtze River Delta and the surrounding hilly and mountainous areas. The water resources in the study area are abundant. The average annual water resource is 53.779 billion m
3. In addition, this area has the highest density of river network in China, with an average river network length per square kilometer of 4.8–6.7 km.
2.2. Data Sources
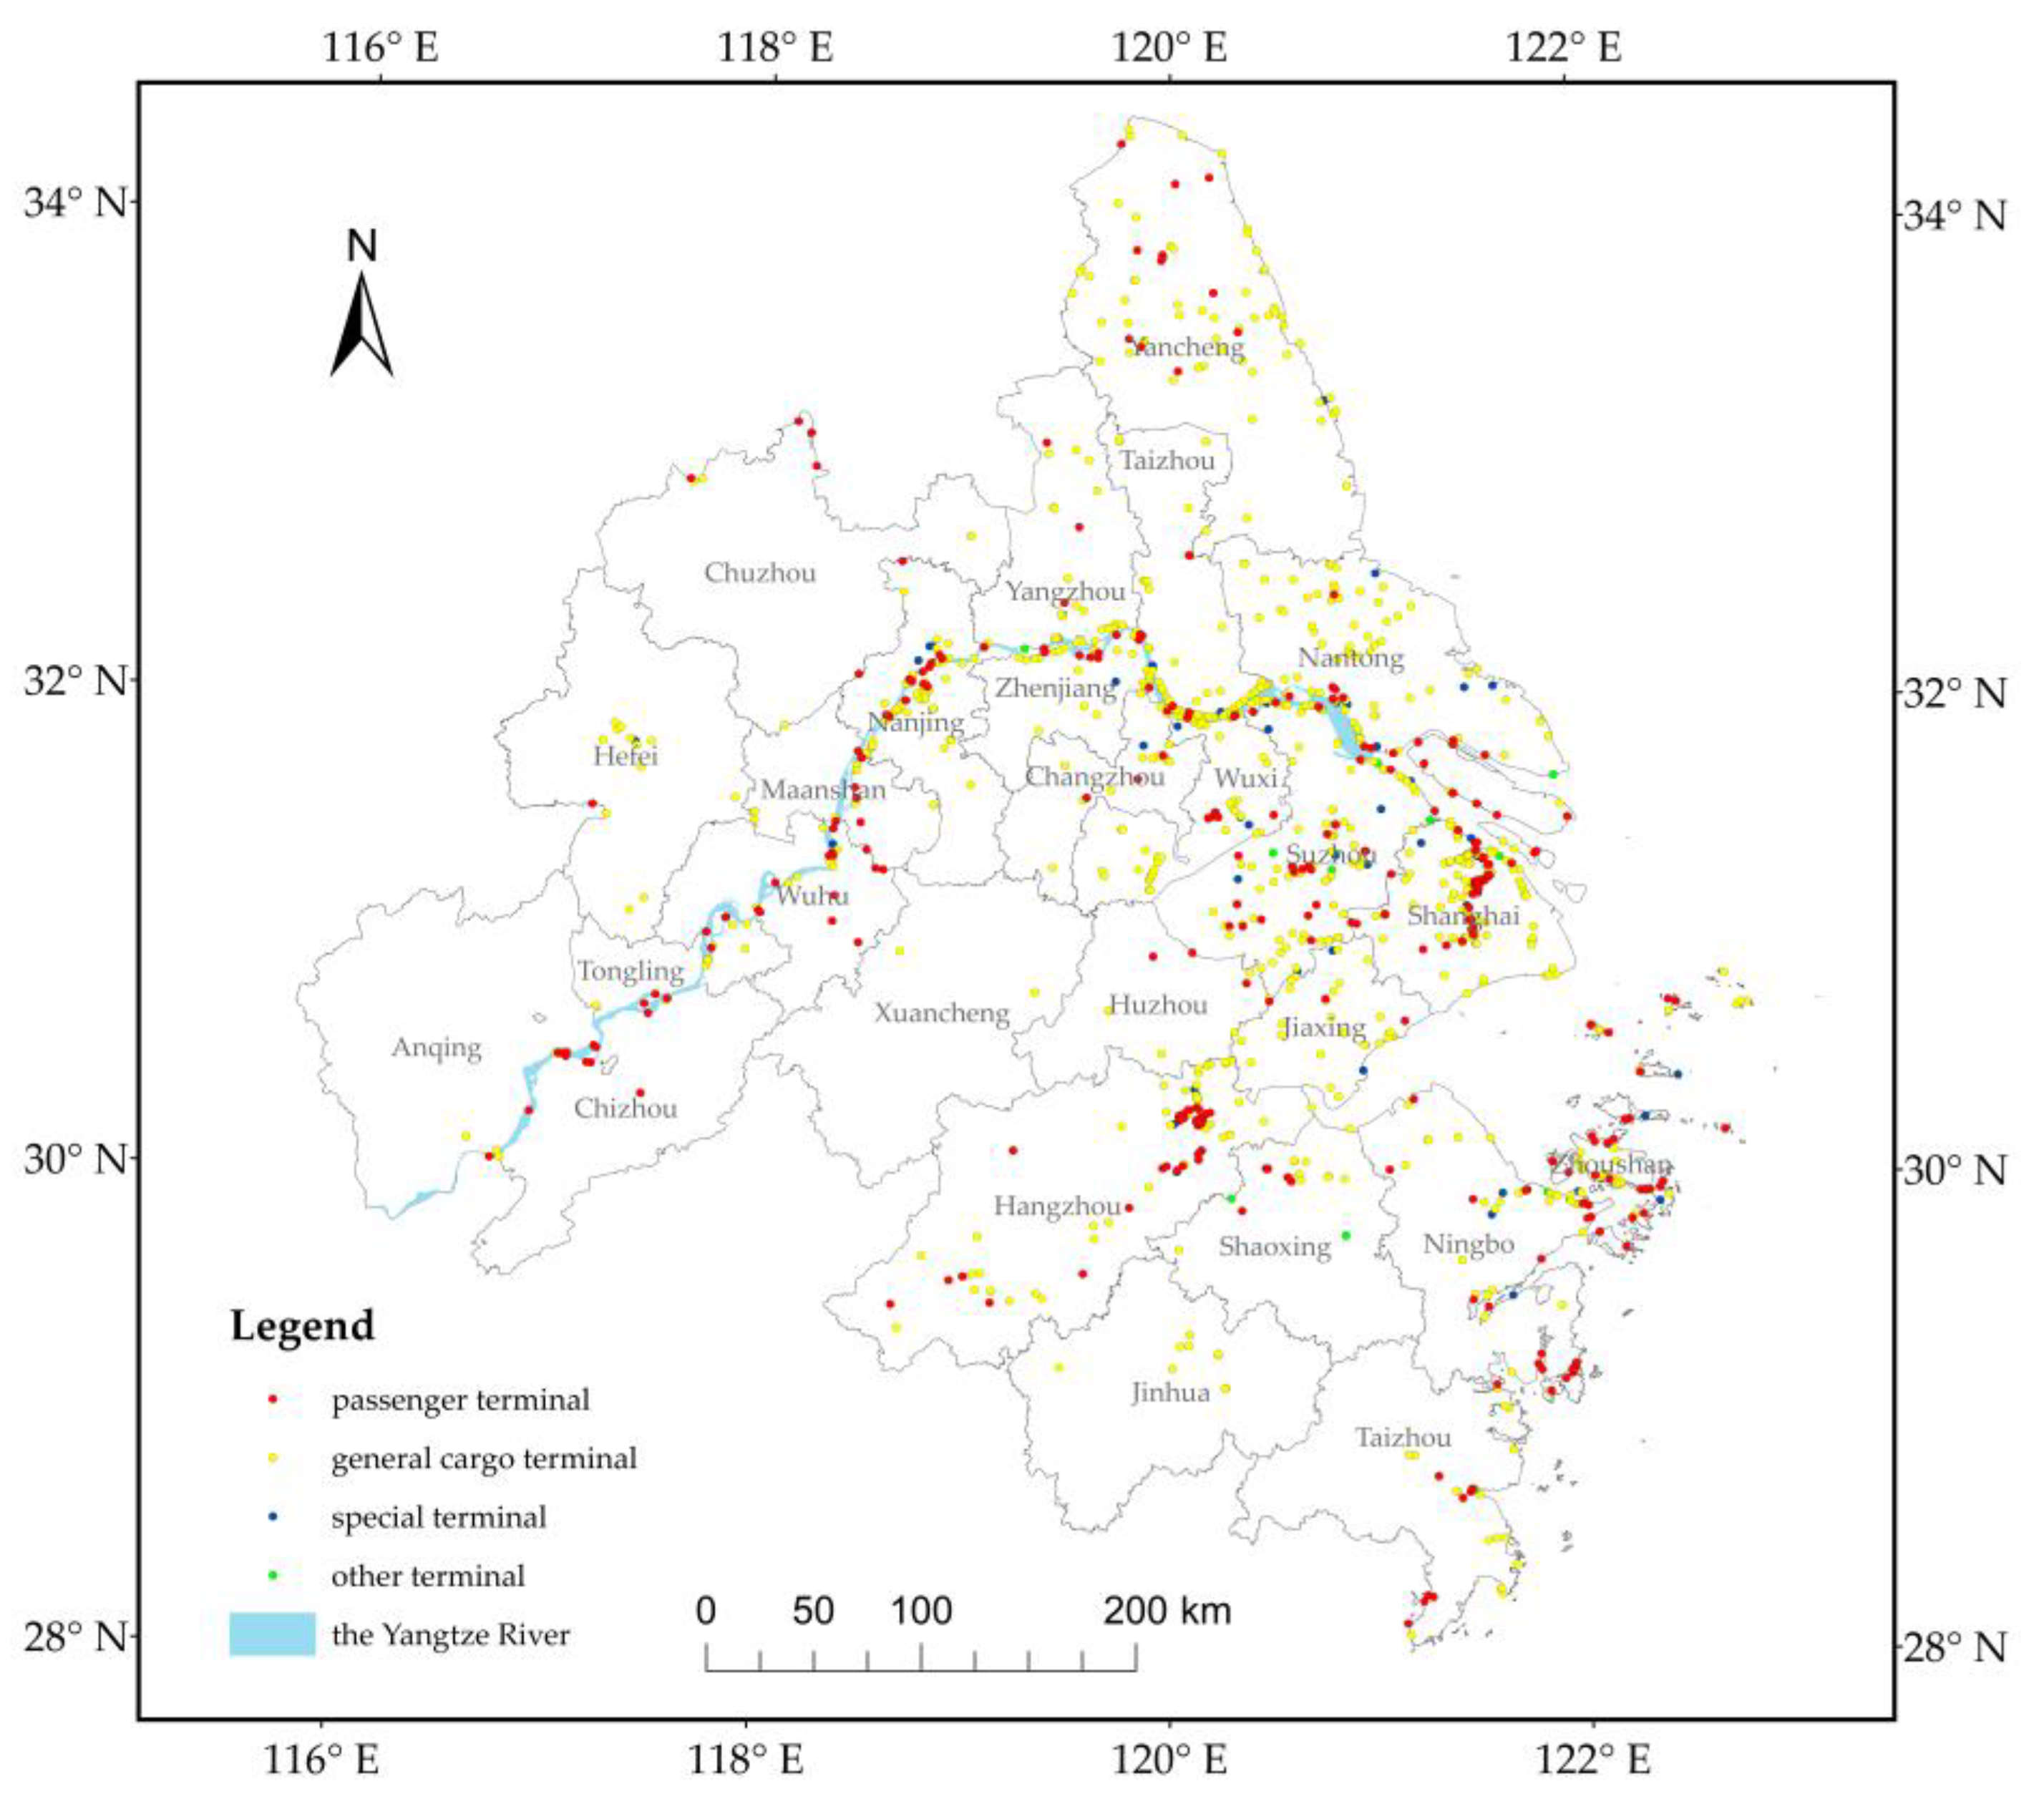
The wharf data are provided by the Third Geoinformation Mapping Institute of National Administration of Surveying Mapping and Geoinformation. A total of 1264 wharf datapoints, including basic information (e.g., location information and type of wharf), were collected. Wharves were divided into four categories according to use. The first type is passenger terminal, which enables the passengers to board and disembark. The second type is general cargo terminal, which is mainly used for loading and unloading all kinds of general cargoes. The third type is special terminal, which includes fishing, petroleum, coal, and container wharves, and is usually equipped with high-performance machinery and equipment. The main function of this wharf type is to load and unload special cargoes with a large volume and stable flow. The fourth type includes other types of wharves that do not belong to the first three categories (i.e., “other terminal”). For example, working ship wharves serve the working ships in the harbor, whereas repair and outfitting wharves operate for ship repair and shipbuilding. The 1264 wharves comprise 378 passenger terminals, 803 general cargo terminals, 67 special terminals, and 16 other terminals.
Figure 2 displays the spatial distribution map of the wharves.
Several statistical and geographic data were used in this study to analyze the spatial allocation level of wharves. The former (e.g., demographic and economic data) were collected from the 2018 statistical yearbook of provinces and municipalities, whereas the latter (e.g., vector road, vector water, water quality, and government shoreline planning data) were gathered from the data set of land spatial monitoring data set.
The vector road and water data cover the length and area of each road and the area of each water area in the study location, respectively. The water quality data comprise 552 water quality sampling points, and each point has a measured water quality class. Water quality is divided into five classes according to the environmental functions and protection objectives of surface water areas, namely, class I, class II, class III, class IV and class V [
24]. Class I is suitable for source water and national nature reserves. Class II is appropriate for a first-class protection zone of surface water source areas of centralized drinking water, habitat of rare aquatic organisms, spawning grounds of fish and shrimp, etc. Class III is suitable for a secondary protection zone of surface water source areas of centralized drinking water, wintering grounds of fish and shrimp, migration passages, aquaculture areas and other fishery waters and swimming areas. Class IV is suitable for general industrial and recreational water areas where a human body is not in direct contact. Class V is for agricultural water use and waters with general landscape requirements. Subsequently, a new class named class VI, which is worse than Class V, was added.
The government shoreline planning data consist of 384 bank lines with basic semantic information, such as ID, type and length. These bank lines were classified into four types according to government planning. The first type is coastal protected area, which might exert adverse effects on river regime stability and water supply safety when developed. The second type is coastal reserve area, which does not have the conditions for development nor the requirements for the protection of the ecological environment. The third type is controlled utilization area, which has been developed and utilized, but still requires control. The last type is development and utilization area, which is equipped with a stable river regime and good conditions for development, and has a low impact on the ecological environment.
2.3. Methodology
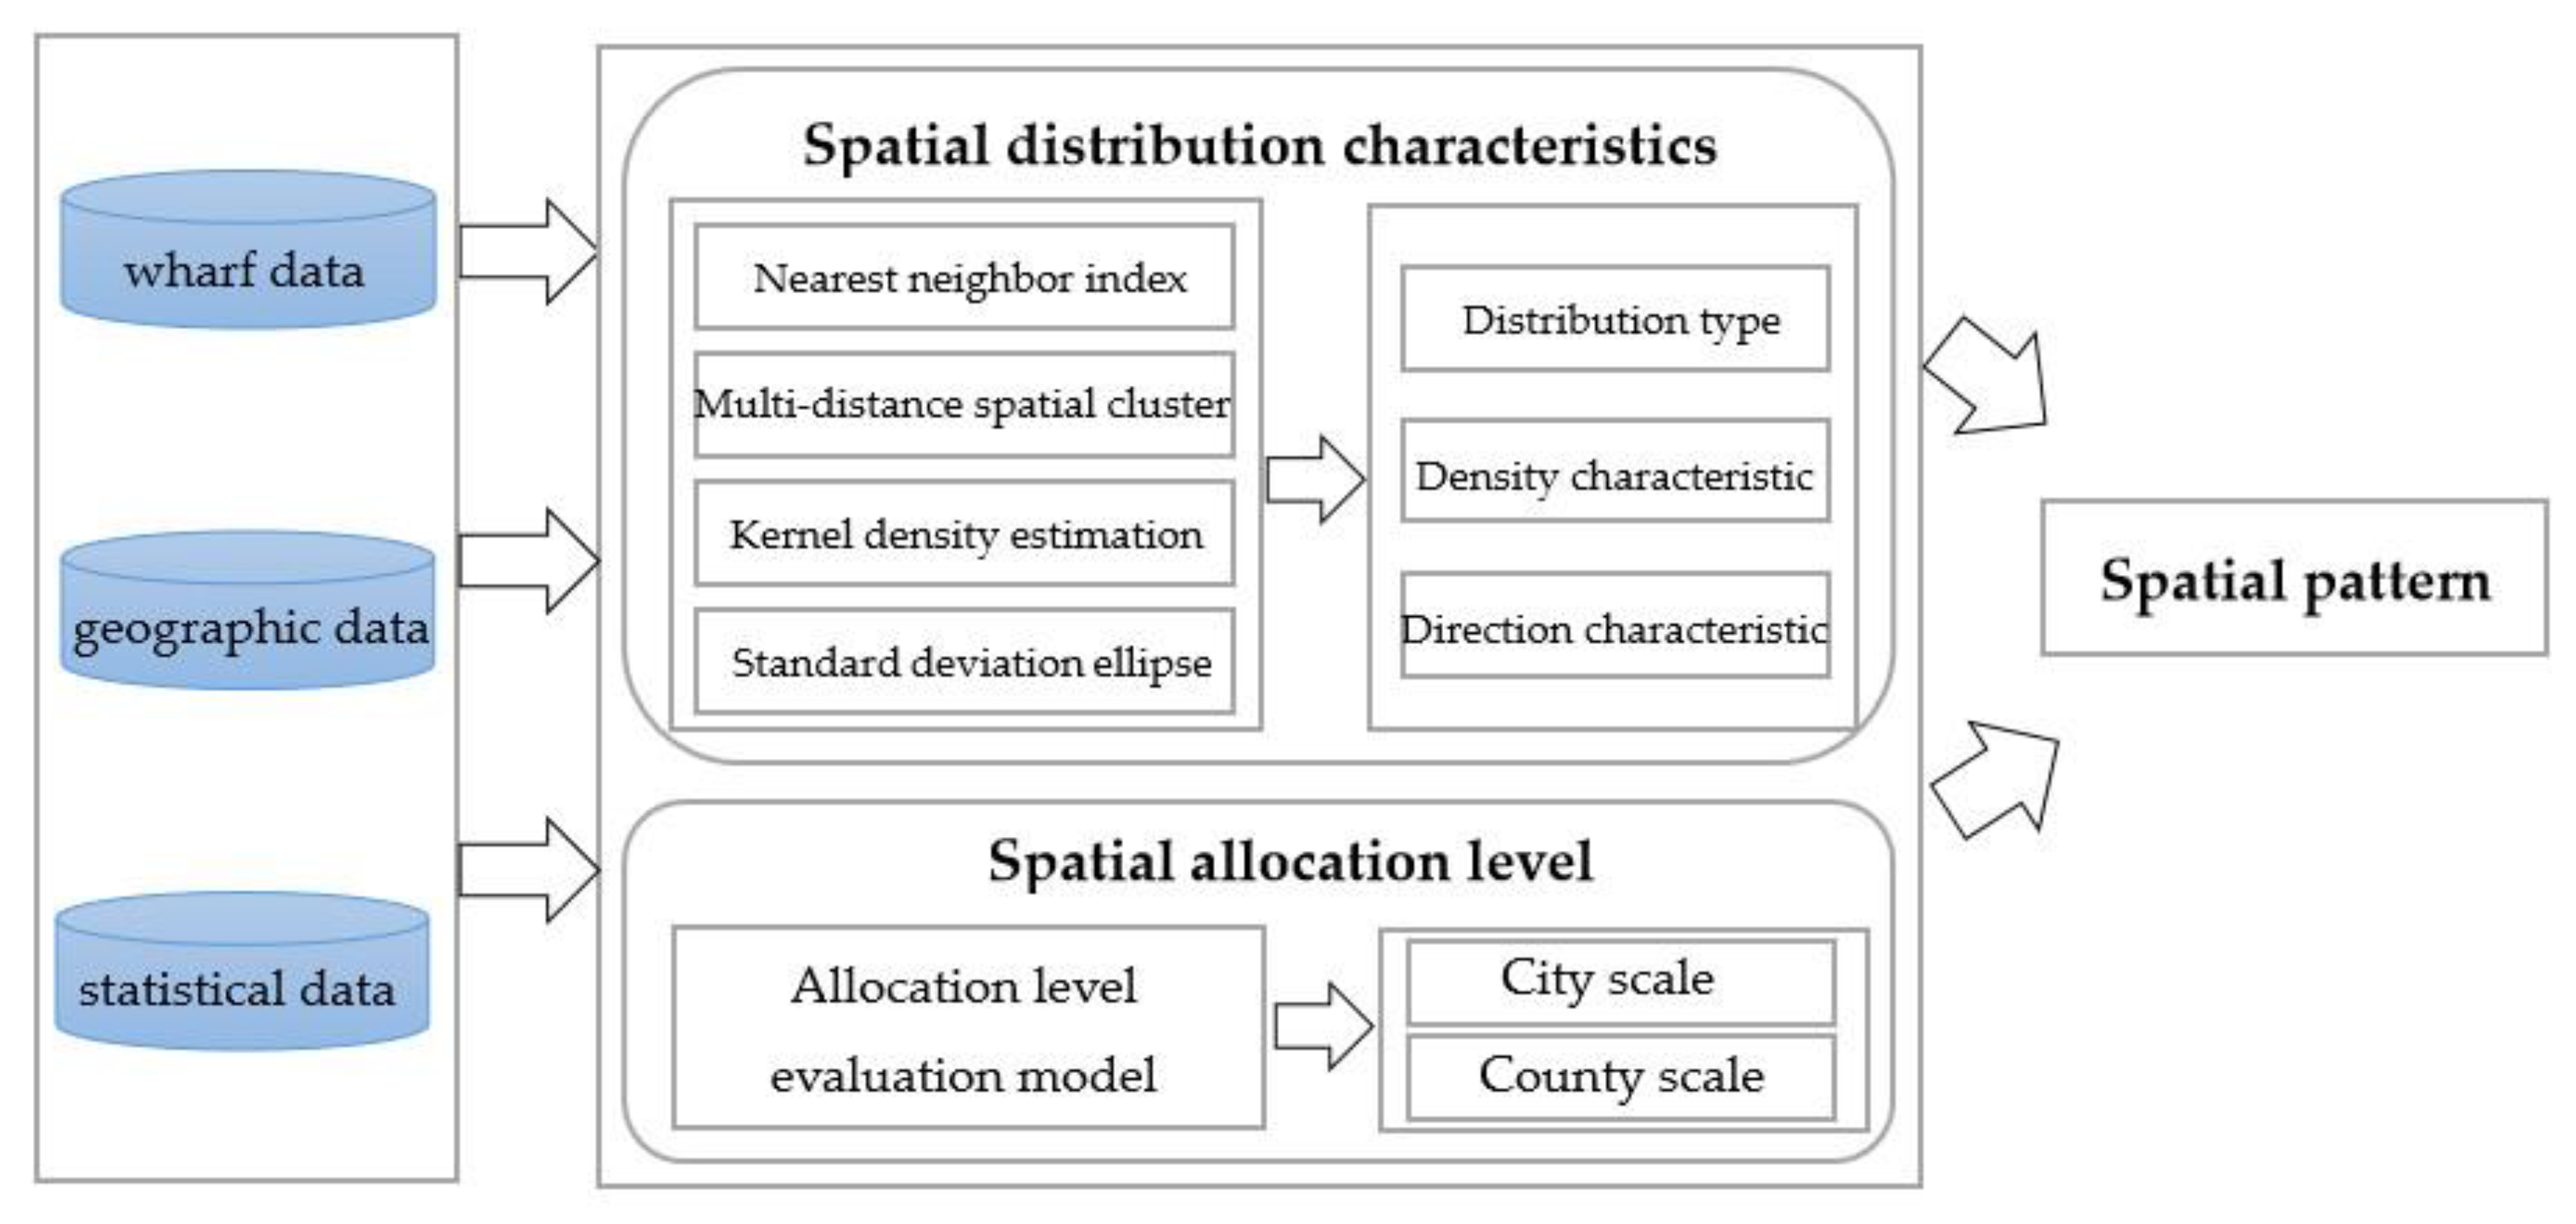
In this study, the spatial pattern of wharves was analyzed from two aspects: spatial distribution characteristics and spatial allocation level (
Figure 3). Wharves can be regarded as a series of geographic points in a large-scale geographic space. The spatial distribution of these geographic points has three basic types: random distribution, aggregated distribution, and uniform distribution. Quantitative methods can reveal the spatial distribution characteristics of geographic points [
25]. Several methods, including nearest neighbor index, multi-distance spatial clustering, kernel density estimation, and standard deviational ellipse were utilized used in this study. The nearest neighbor index and multi-distance spatial clustering were often used to analyze spatial distribution types of geographic points. First, we used the nearest neighbor index and multi-distance spatial clustering to analyze the spatial distribution type of wharves and confirmed that it belongs to aggregated distribution. Next, we applied the kernel density estimation and standard deviational ellipse to determine the location and direction of aggregated distribution area of the wharves. Then, we constructed the evaluation index system, selected six indicators, calculated the weight using EWM, and determined the comprehensive evaluation index of the wharves. Lastly, based on the results of the analysis of the spatial wharf pattern, we calculated the correlation between the spatial wharf pattern and the economy.
2.3.1. Nearest Neighbor Index
The nearest neighbor index is based on the distribution of random patterns, and serves as a criterion to measure the spatial distribution of point elements [
26]. Assuming that the points are randomly distributed, the distance and the nearest neighbor distance between the points conform to the normal distribution. The expected value of the average of the nearest neighbor distance is calculated as follows:
where
N is the total number of points in the study area and
A is the area of the study area.
The nearest neighbor index
R represents the ratio of the average value of the actual nearest neighbor distance to the expected value of the points in the study area. The formula is expressed as follows:
The range of
R is greater than or equal to 0. When
R = 1, the spatial distribution of points conforms to the random distribution pattern. When
R > 1, the nearest distance between points is larger than the expected value of the random distribution, and the points in the space are mutually exclusive and tend to be uniformly distributed. When
R < 1, the points are close to each other in the space and belong to the spatial agglomeration pattern [
27].
2.3.2. Multi-Distance Spatial Clustering
The multi-distance spatial clustering method analyzes the clustering degree of point datasets at different distances. The core of this method is Ripley’s K function, which determines if a point dataset is clustered at multiple distances. The formula is expressed as follows:
where
L(
d) is the K value,
A is the area of the study area,
N is the total number of points in the study area,
d is the distance, and
k(
i,
j) is the weight.
The calculated results produce the observed K values and expected K values. When the observed K value is larger than the expected K value at a particular distance, the distribution is rather more clustered than a random distribution at that distance. When the observed K value is larger than the expected K value at a particular distance, the distribution is more clustered than a random distribution at that distance.
2.3.3. Kernel Density Estimation
Kernel density estimation estimates the probability of the occurrence of geographic events at any location in space by calculating the density of spatial points that represent such events. This technique is a nonparametric density estimation method that usually uses the method proposed by Rosenblatt and Parzen [
28,
29]. The formula is expressed as follows:
where
is the probability density function,
is the kernel function,
h is the bandwidth,
n is the quantity of points, and (
x −
Xi) is the distance from the valuation point to the event
Xi.
The steps for kernel density estimation are presented as follows: (1) defining a circular window, in which its radius refers to the bandwidth of the kernel density function, which covers all spatial points in turn; (2) dividing the research area into regular grid units according to the requirement of output accuracy; (3) calculating the density contribution value of each spatial point to each grid in the window through the kernel function; (4) assigning the density value of each grid, which is the sum of the density contribution value of each space point in the search radius of the grid; and (5) outputting the density value of each grid [
30].
2.3.4. Standard Deviational Ellipse
A standard deviational ellipse can accurately reveal the overall characteristics of the spatial distribution of geographical elements [
31]. An ellipse is generated in this method. The ellipse center is based on the arithmetic mean value of the point set in the X and Y directions. Then, the ellipse variance is calculated in accordance with the mass center. The long and short half axes of the ellipse are also determined. Then, the equation of ellipse is determined as follows:
where
is the rotation angle;
n is the quantity of points; and
are the differences between the ellipse center and point coordinates, respectively. Further:
where
and
are the long and short half axes, respectively.
2.4. Allocation Evaluation Model
Wharf allocation has two main objectives: (1) deliver relatively fast and convenient travel services to the passengers and (2) distribute water transport stations reasonably to avoid idle and overly busy situations. The allocation should follow the basic principles of evaluation index system construction, consider various factors, and create a reasonable evaluation index system to achieve these two goals. We found that wharf construction needs to be connected with urban planning, should have convenient transportation connections and adequate water area, and must conform to the relevant national standards and regulations of safety, environmental protection, and health based on the analysis of the factors that affect the distribution of wharves and by consulting a large number of relevant studies [
32,
33]. Thus, we selected six indexes to analyze the allocation level of wharves: (1) wharf density, (2) per capita ownership, (3) spatial accessibility, (4) transportation convenience, (5) government planning compliance, and (6) environmental protection. The evaluation index of spatial wharf allocation level was finally determined (
Table 1).
Wharves should be built on the water’s edge; thus, wharf density represents the number of wharves per water unit area, and refers to the number of wharves divided by water area in a research unit (city/county).
Per capita ownership is the average number of docks owned by each person in a research unit. This index corresponds to the number of wharves divided by the population in a research unit. As a kind of urban infrastructure, wharves should fulfill the people’s travel and transport needs. Hence, the per capita ownership in areas with a high level of wharf allocation should also be high.
The scientific evaluation of facility spatial accessibility is the basis of a rational spatial allocation [
34]. Some scholars have studied the measurement methods of spatial accessibility and proposed some effective methods, such as nearest distance method, gravity method, Huff model method and two step floating catchment area method. Given the limitation of the data, we adopted the nearest distance method in this study. Spatial accessibility initially generates a 20 km service area for each wharf according to road network and then calculates the coverage ratio of the service area in a research unit.
Wharves are linked with land transportation. Before water transportation, goods are delivered at the wharf by land transportation, and to the destination by land transportation. Therefore, it is necessary to estimate the degree of land transportation convenience in a research unit. We selected road network density to represent transportation convenience. Road network density is a common indicator of the road network convenience, and an important indicator to measure the level of urban road construction [
35]. This indicator can be obtained by dividing the total length of roads in a research unit by the area of the research unit.
Government planning compliance determines whether the wharf is located in a government planning area and at which area it is located. Based on government shoreline planning data, we classified the wharves into five categories according to location: (1) coastal protected area, (2) coastal reserve area, (3) unplanned area, (4) controlled utilization area, and (5) development and utilization area. The conformity degree of the wharf was assigned, and the sum of the conformity degree of all wharves in the research unit was determined (
Table 2).
The environmental protection of wharves mainly considers the water environment. Shortage of water resources and water pollution are the two major problems restricting the utilization of water resources in China [
36]. The Yangtze River Delta Urban Agglomeration has abundant water resources; therefore, this study evaluated the environmental protection in the research unit from the perspective of water quality. Based on the water quality data, water quality has six categories.
Table 3 lists the value of each category. The average water quality of the research unit can be obtained as
where F is the wharf allocation level score,
i is the evaluation index serial number,
n is the total number of indexes,
is the total weight value of the index
i of the research unit, and
is the value of index
i, which represents the level of this index.
3. Results and Analysis
3.1. Spatial Distribution Pattern of Wharves
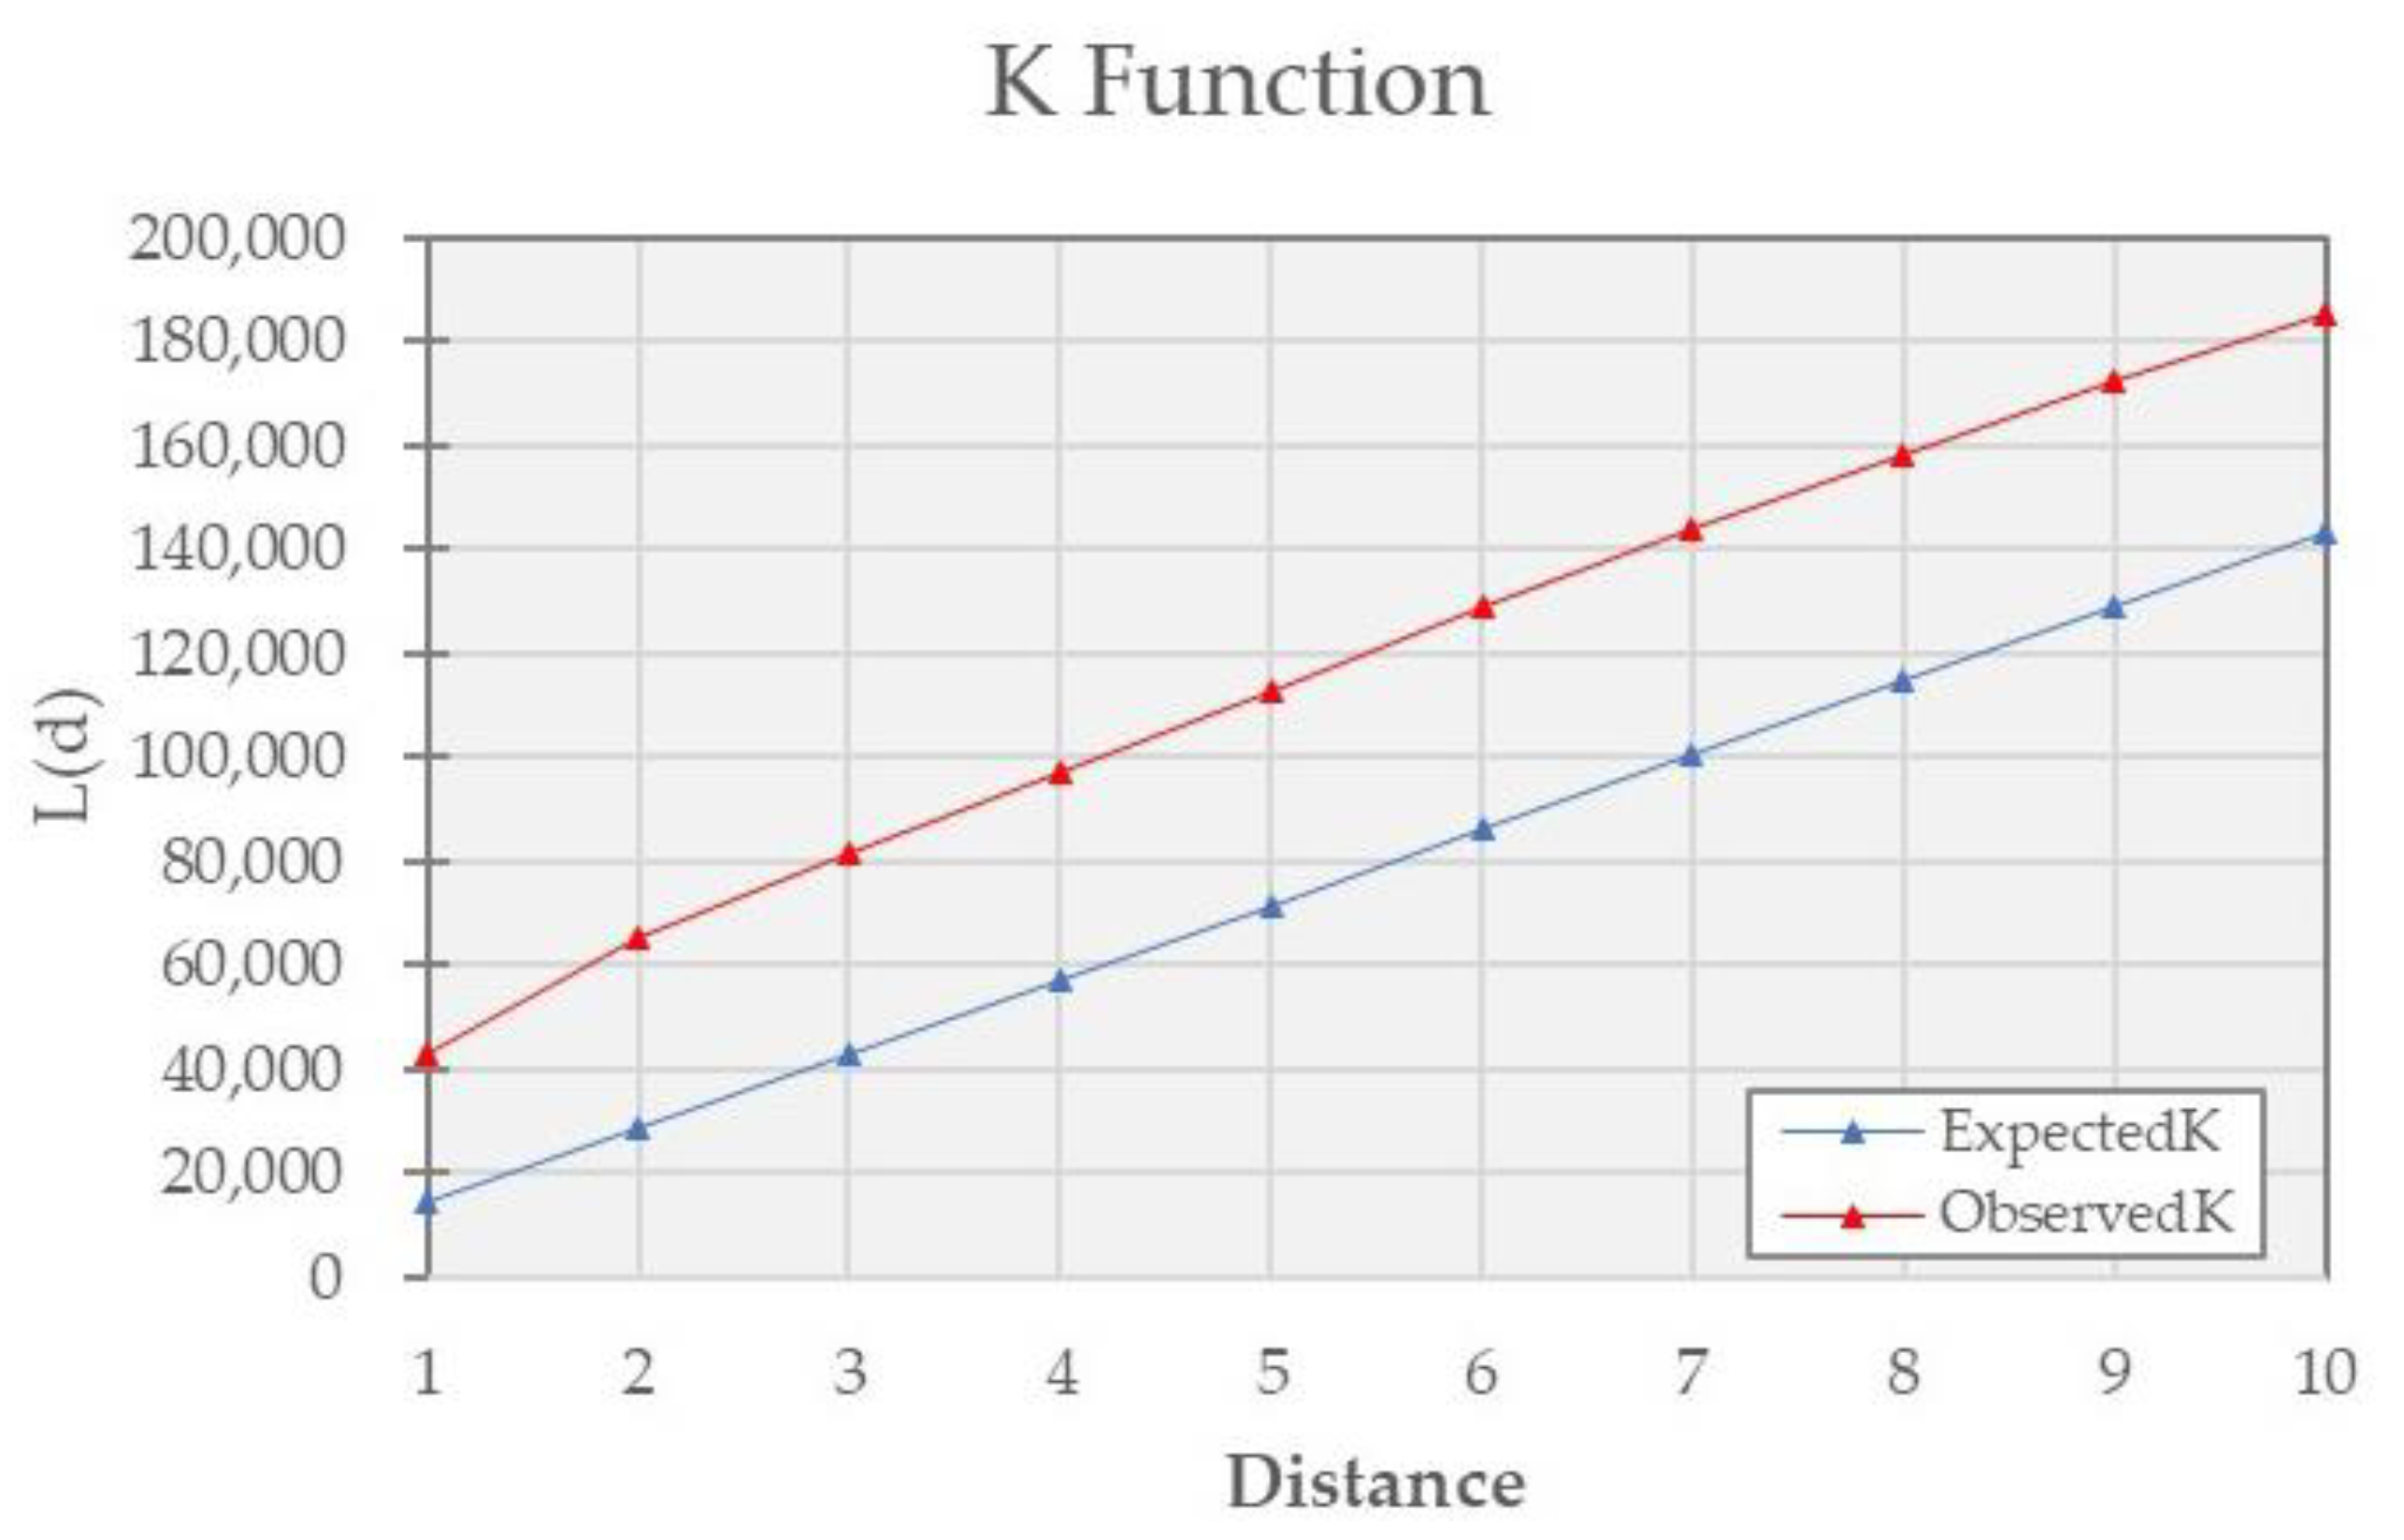
Table 4 shows that the average nearest neighbor index of all wharves in the Yangtze River Delta Urban Agglomeration is 0.49, which is less than 1 and indicates that the spatial distribution of wharves is a typical agglomeration distribution. The curve of the observed value is higher than that of the expected value (
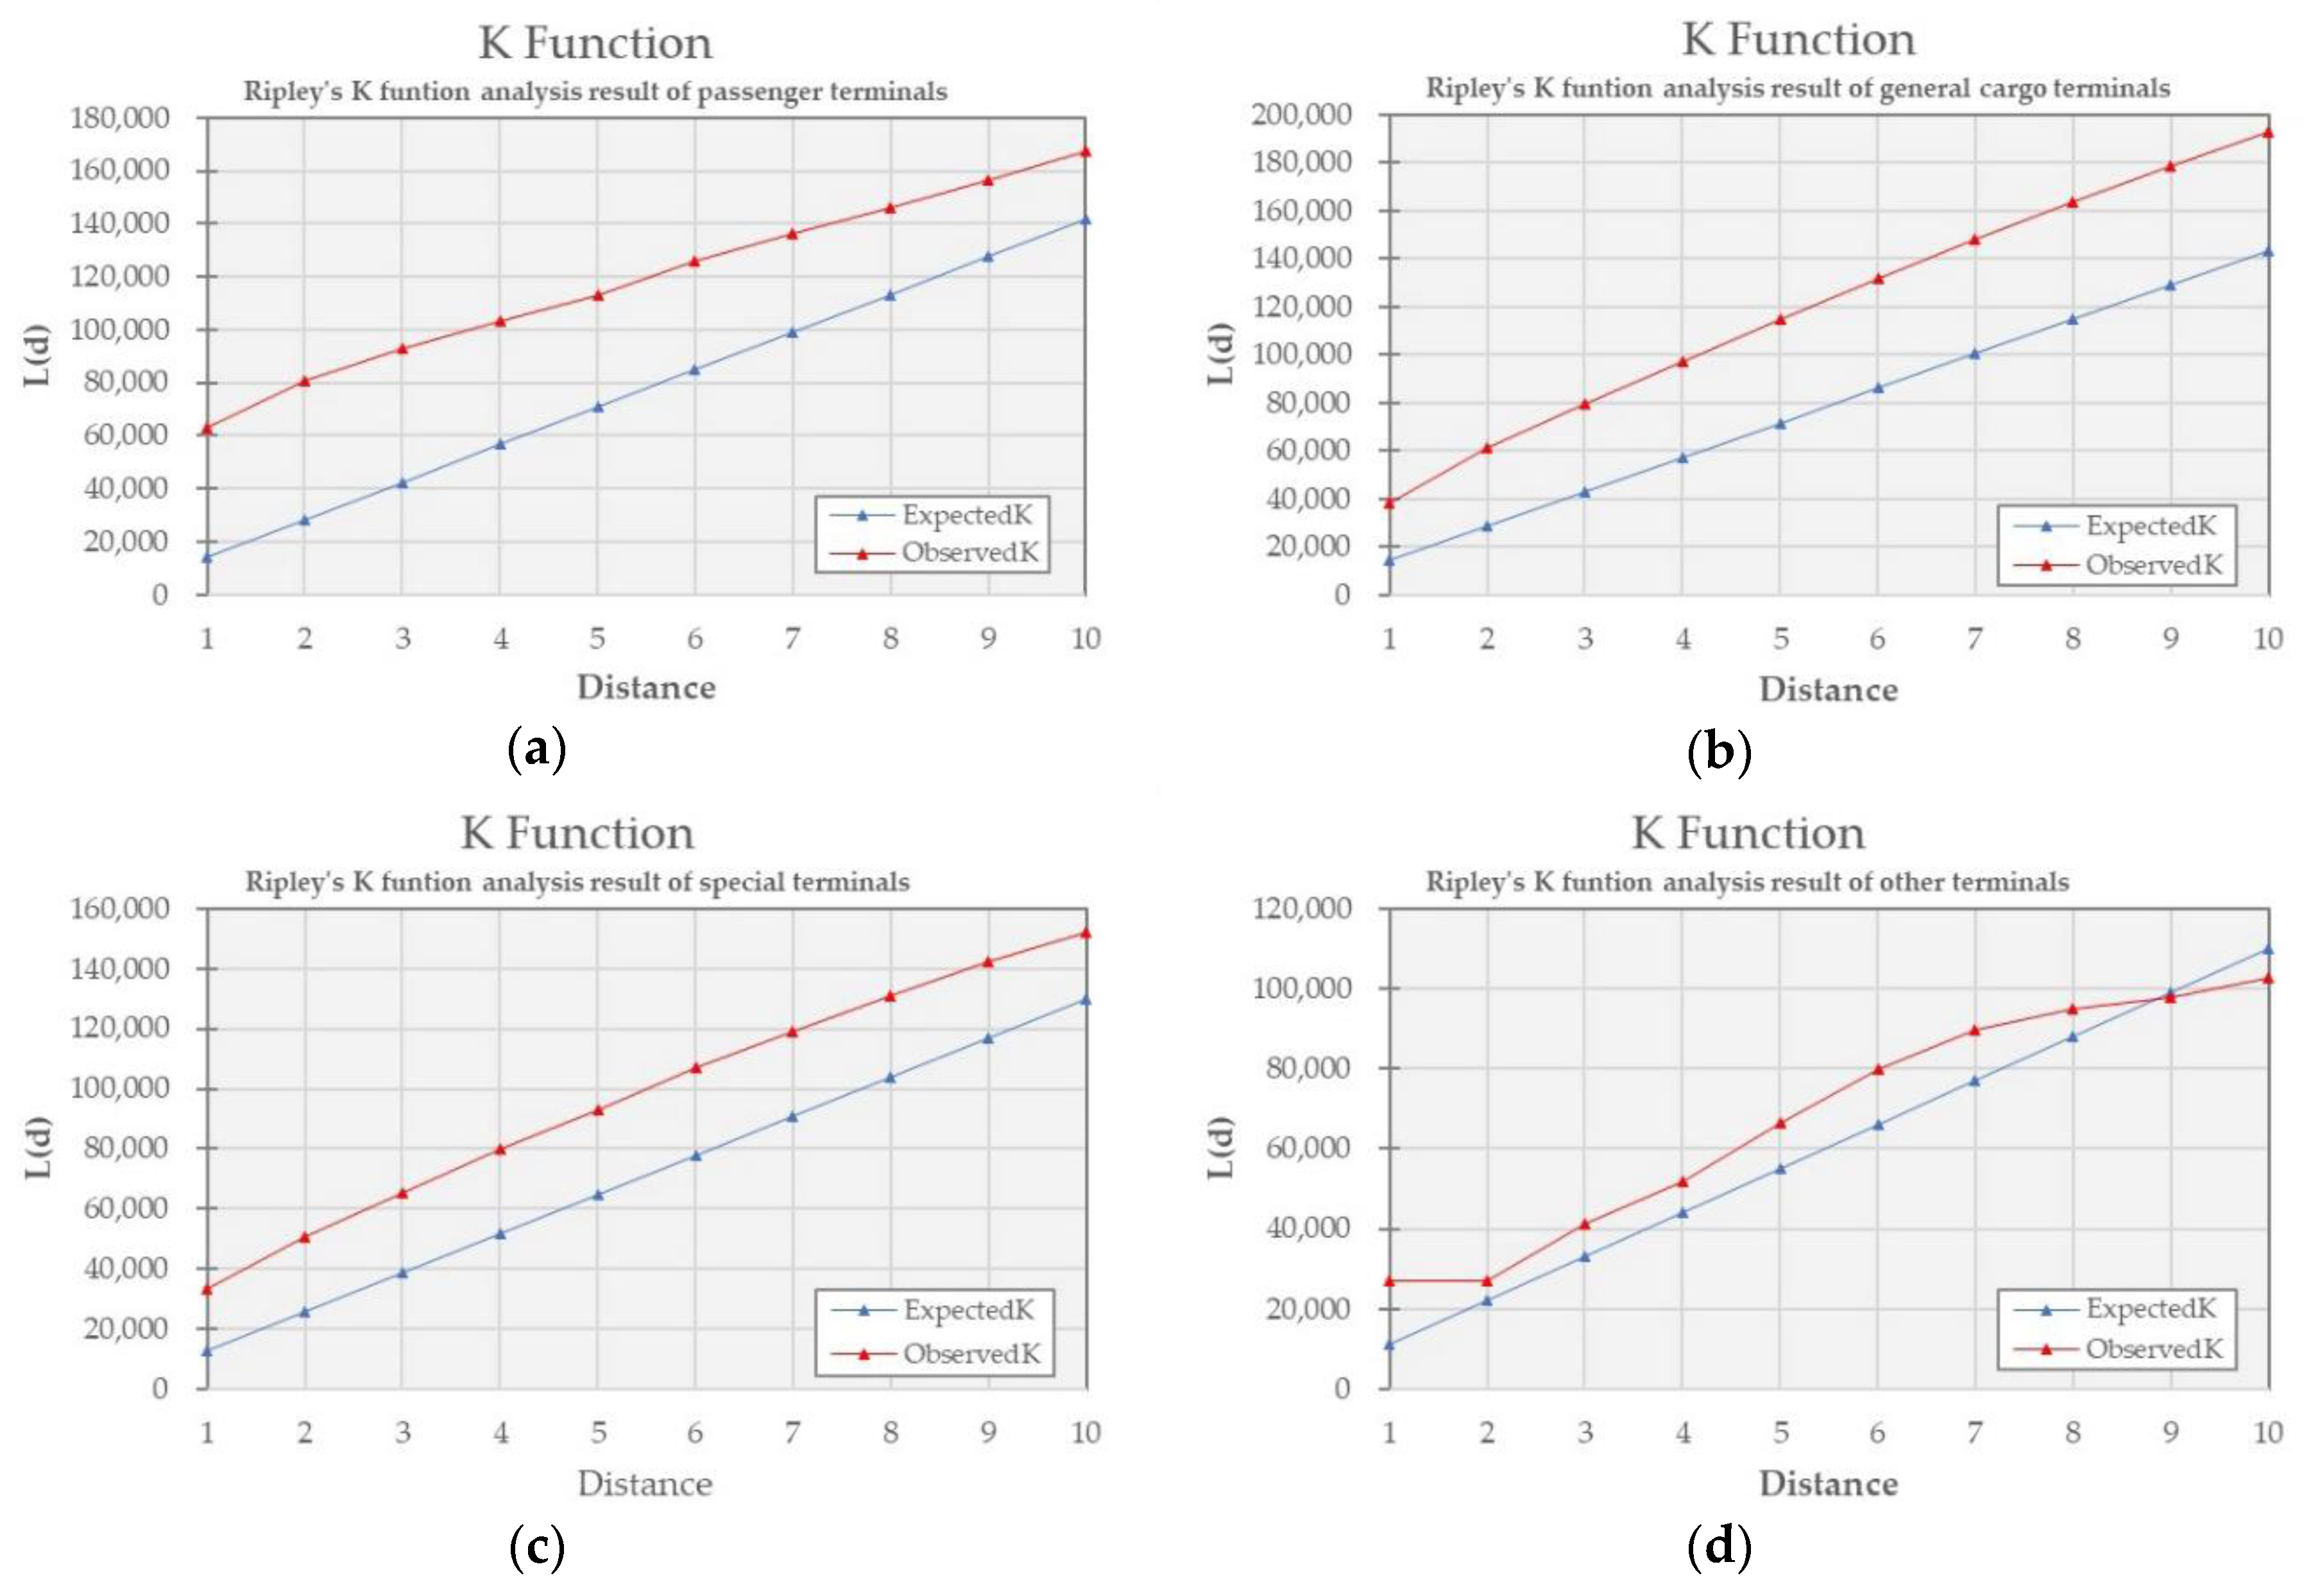
Figure 4), indicating that the wharves are rather more clustered than a random distribution at any distance. With respect to the distribution of the different types of wharves, the nearest index is between 0.46 and 0.68, indicating that all wharves demonstrate a typical agglomeration distribution. Among them, the average nearest neighbor index of passenger terminals is 0.47, which is slightly lower than that of the wharves with the highest agglomeration (0.49). The average nearest neighbor index of the other terminals is 0.67, signifying the lowest agglomeration. In addition, the observed values of Ripley’s K functions for the four types of wharves are all higher than the expected values (
Figure 5), indicating clustered distribution for all the four types of wharves.
The spatial distribution of wharves in the Yangtze River Delta Urban Agglomeration presents a “band” structure, with two main centers and three sub-centers, which is similar to the distribution characteristics of water resources in the area (
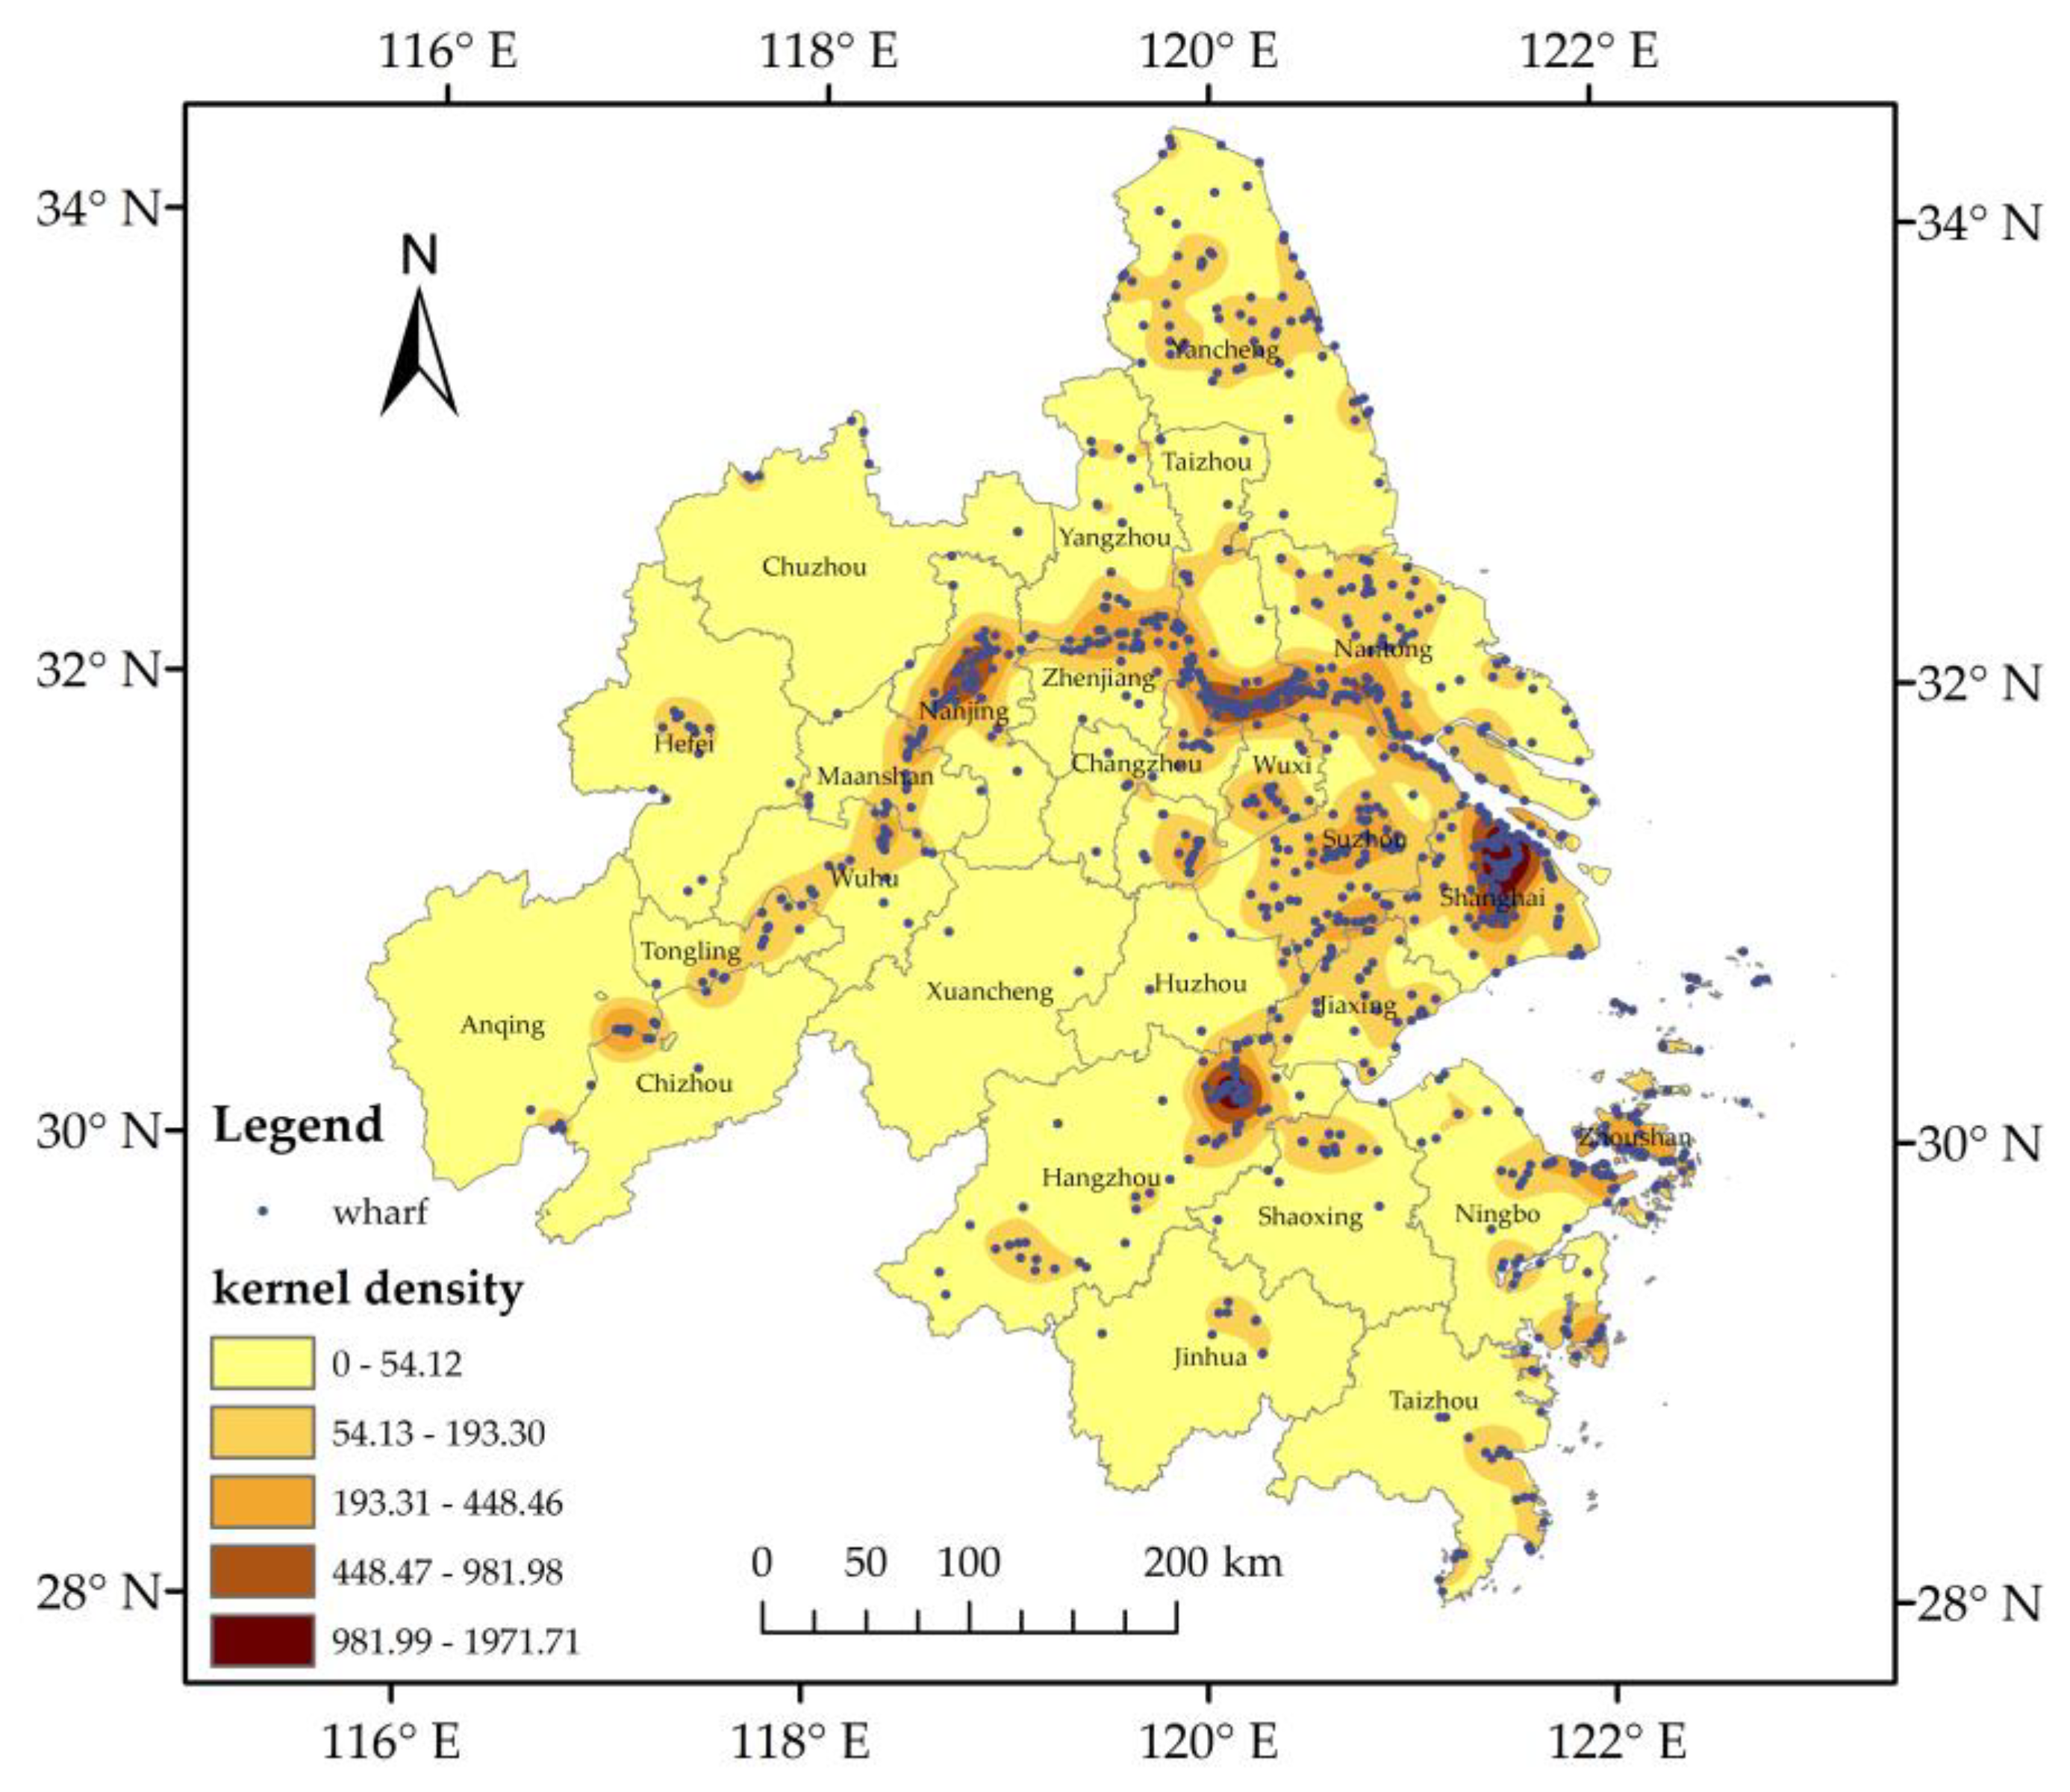
Figure 6). The first main center is located in the downtown area of Shanghai, whereas the second is located in the downtown area of Hangzhou. There are three sub-centers located in the Gulou District of Nanjing, the Jingjiang City of Taizhou, and the Gangzha District of Nantong. The densely distributed area of wharves comprises two axes connected with Shanghai: one extends from Shanghai to the economically developed areas in northern Jiangsu, and toward the southwest through Nanjing to the junction zone of Anqing, Chizhou, and Tongling; the other extends directly to the south of Jiaxing to form a large medium density area in the south of Jiaxing and middle of Suzhou. The mid-density area was extended to the northeast of Hangzhou. In general, the wharf-intensive areas are mainly distributed in cities with a developed economy, a large population, and advanced shipping, whereas the wharf-sparse areas are mainly distributed in the inland cities with a small area and a sparse population.
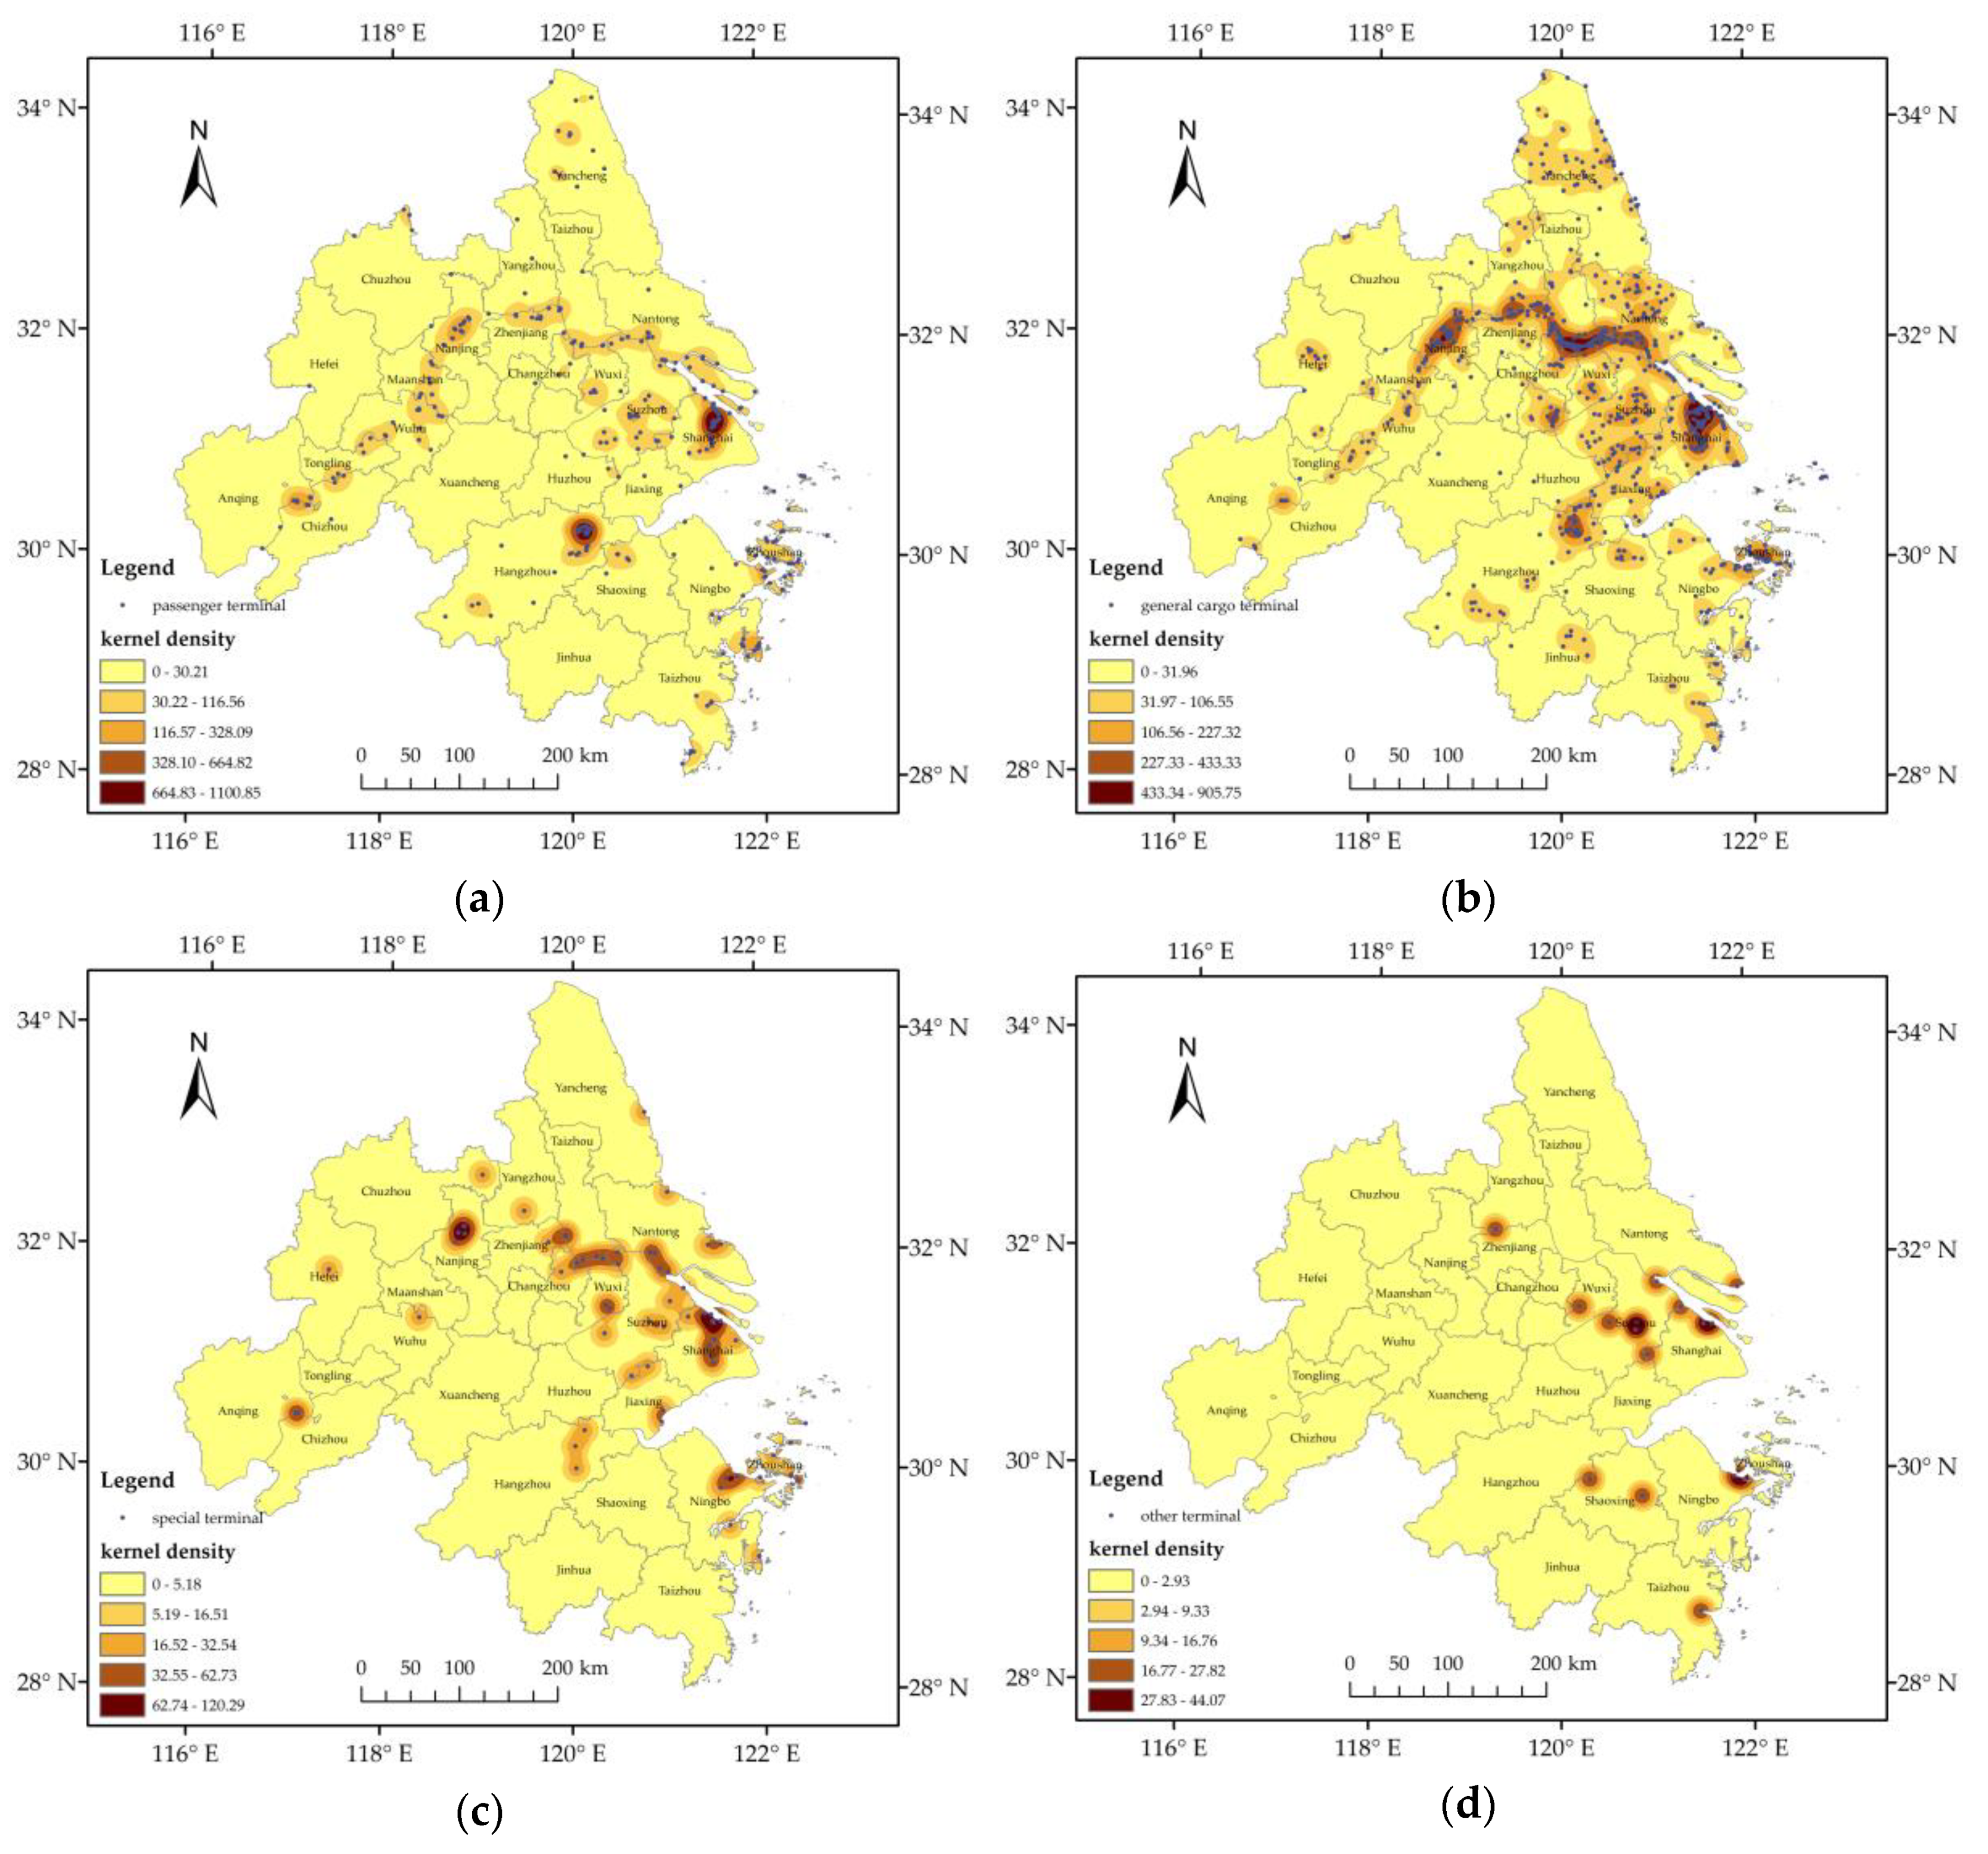
Figure 7 shows the density distribution characteristics of the different types of wharves. The most densely distributed areas of passenger terminals are the central part of Shanghai and the northeastern part of Hangzhou (
Figure 7a); such areas are the center of the tourism industry. The tourism industry is developed, and the scenic spots are mostly located near the water, which satisfies the basic conditions for the construction of passenger terminals. The most densely distributed areas of general cargo terminals are similar to the whole dense areas of wharves (
Figure 7b). Thus, the Jingkou District of Zhenjiang, Yixing City, Wuxi City, and the Dinghai District of Zhoushan are added. This finding is related to the shipping development in these areas. These areas are located in regions with good natural conditions, such as the coastline of water area. These conditions are suitable for the development of shipping. The volume of goods transported by sea or inland river is large. Moreover, inland transportation is highly developed and can be used as a connecting point of domestic and foreign economies. The gathering areas of the special terminals are relatively scattered (
Figure 7c), which is related to the types of cargo loaded and unloaded at special terminals. Taking grain wharves as an example, all Panamanian ships on the Yangtze River should be unloaded at Ningbo–Zhoushan or Shanghai ports before entering the inland wharves. The 16 other terminals are only distributed in eight prefecture-level cities (
Figure 7d).
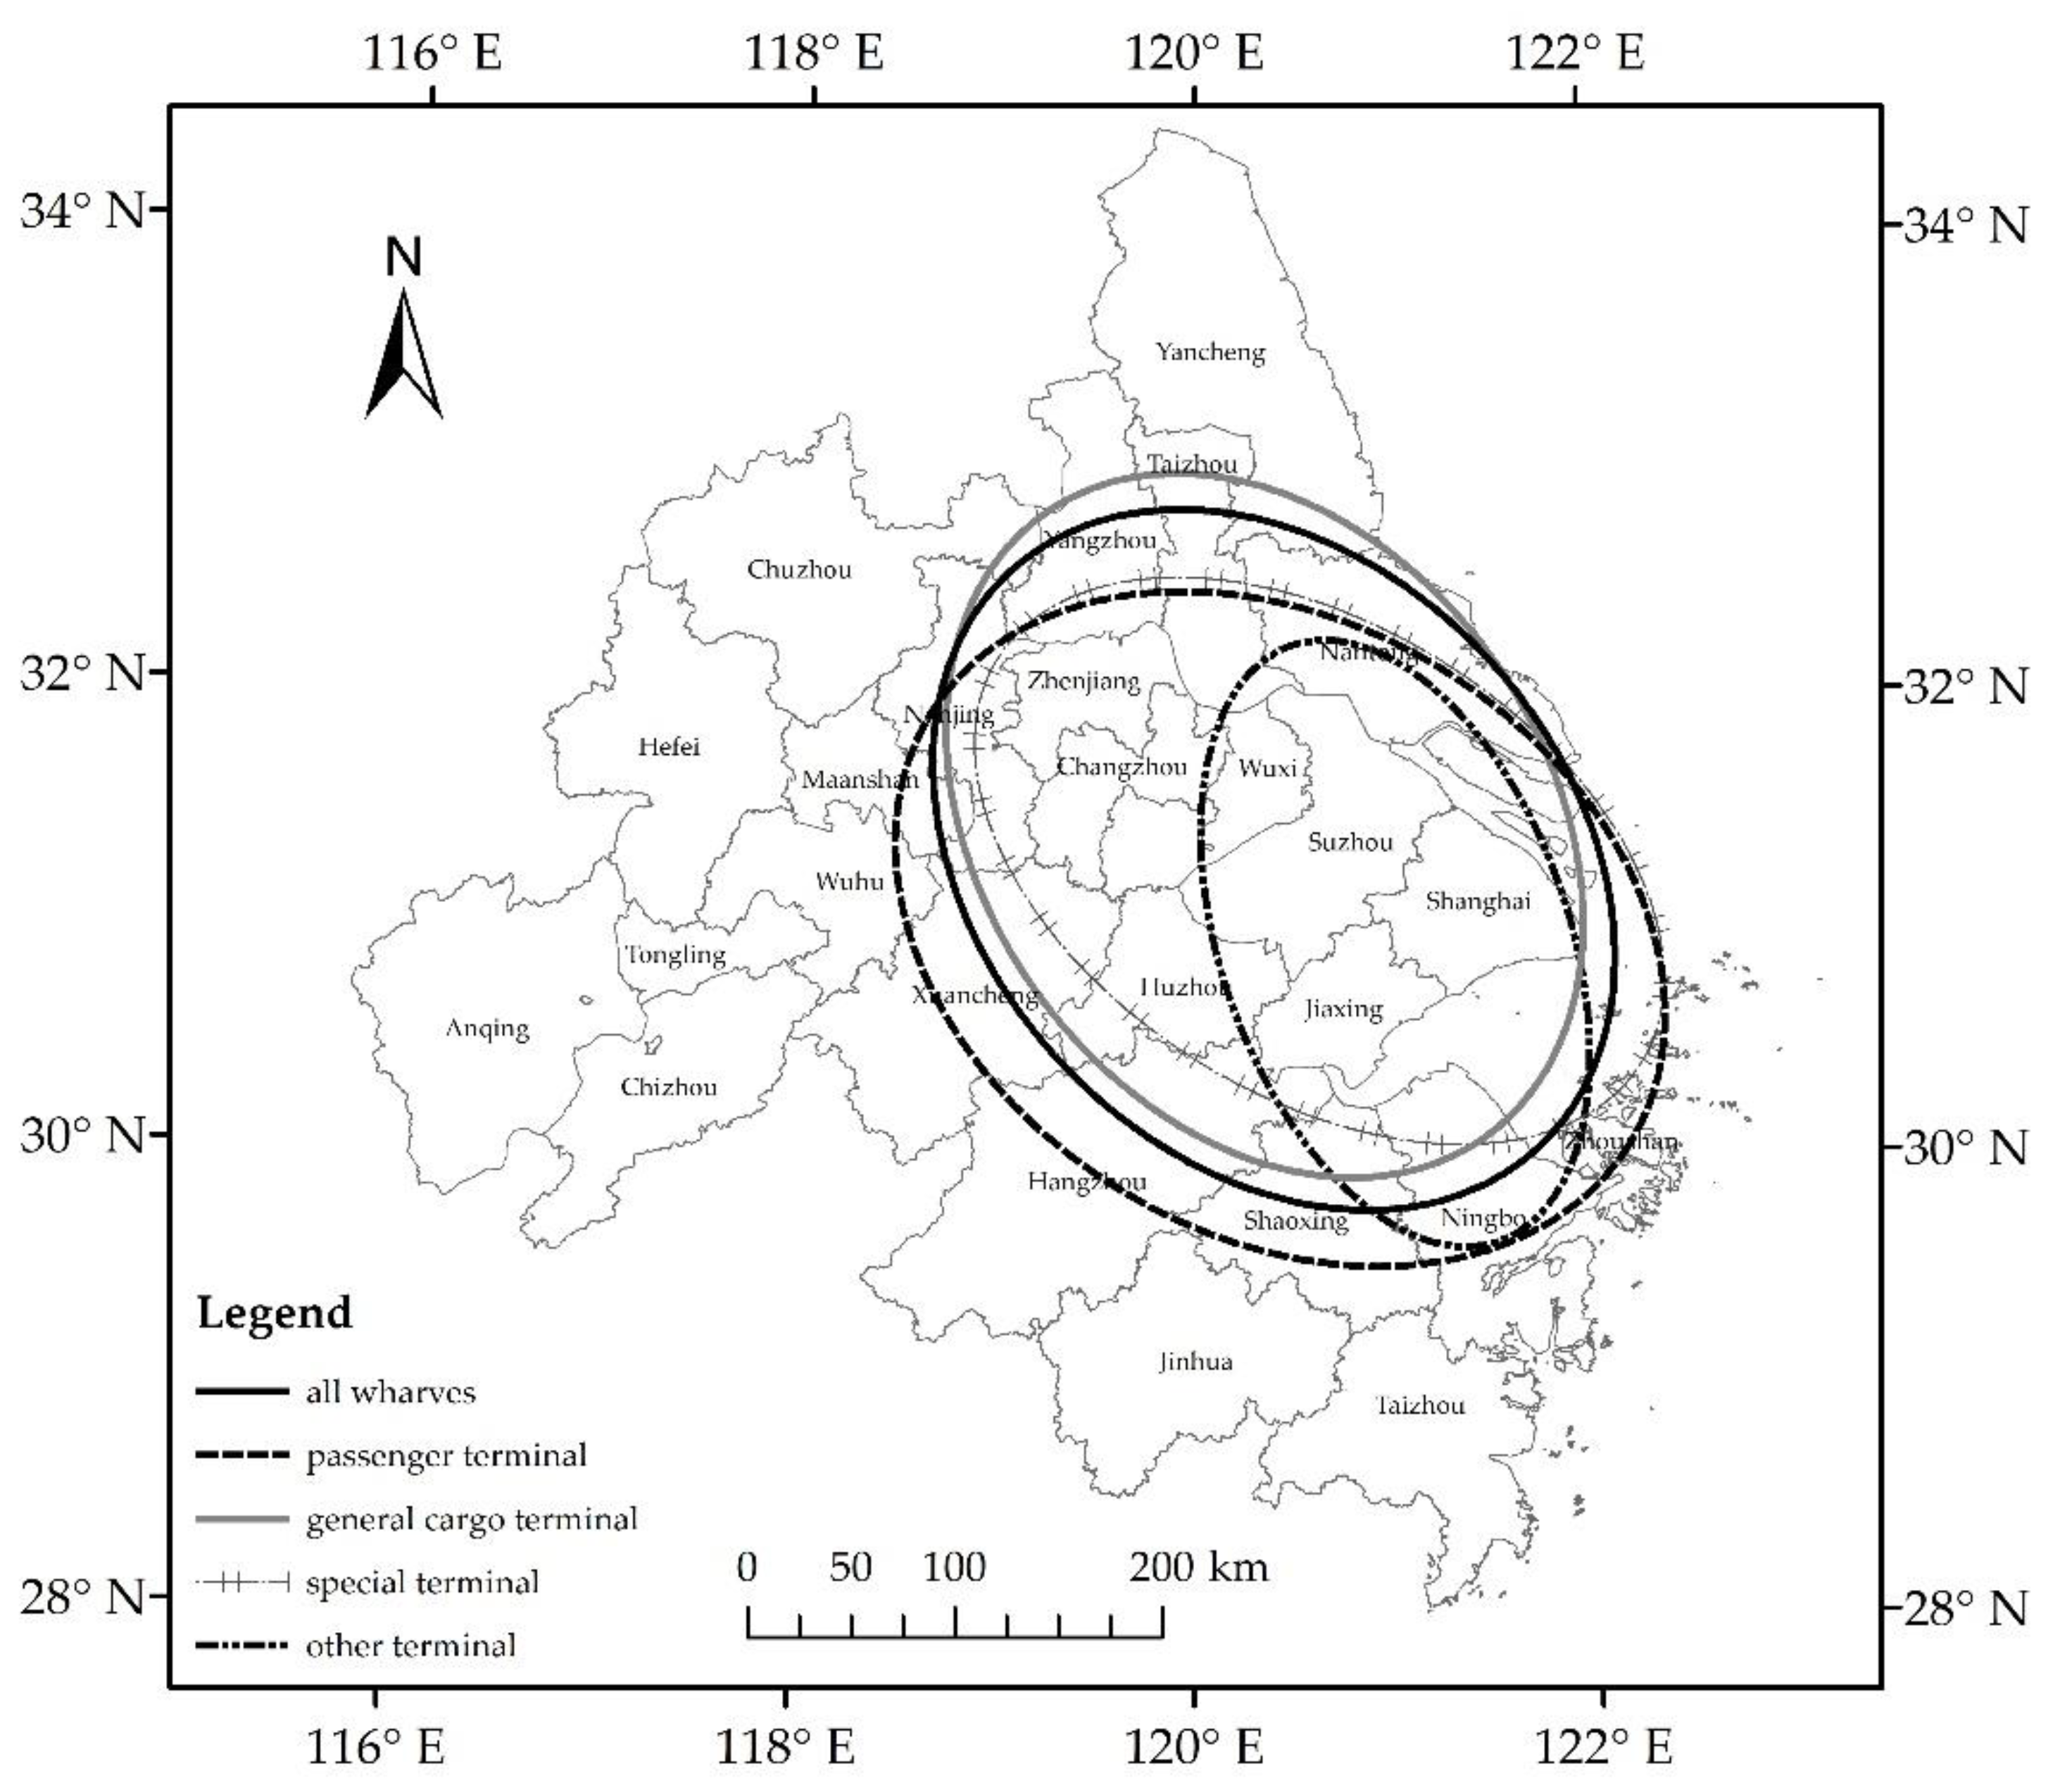
The wharves in the Yangtze River Delta Urban Agglomeration are spatially distributed in the “north-west–south-east” direction, with the center located in the south-east of the Wuzhong District of Suzhou (
Figure 8). The standard deviation ellipse directions of the passenger terminal, general cargo terminal, and special terminal also point to the “north-west–south-east” in space, with slight deviation and rotation. The center points are located in the eastern Nanxun District of Huzhou City, south-east of Wuzhong District of Suzhou City, and eastern Wuzhong District of Suzhou City. They all correspond to the direction of the Yangtze River in this section. The standard deviation ellipse direction of the other terminals is different. The main axis is in the north–south direction, the central point is located in the south-west of the Songjiang District of Shanghai, and its direction is similar to that of the coastline.
3.2. Spatial Allocation Level of Wharves
In this study, EWM, which is an objective weighting method, is used to determine the index weight. This method determines the amount of information provided by the different indexes by calculating the entropy value of each index, so as to determine the weight of the index [
37]. The smaller the entropy value of an index, the greater the variation degree of the index. Moreover, the greater the weight of the index, the greater the amount of information it contains.
Table 5 presents the calculation of the index weight.
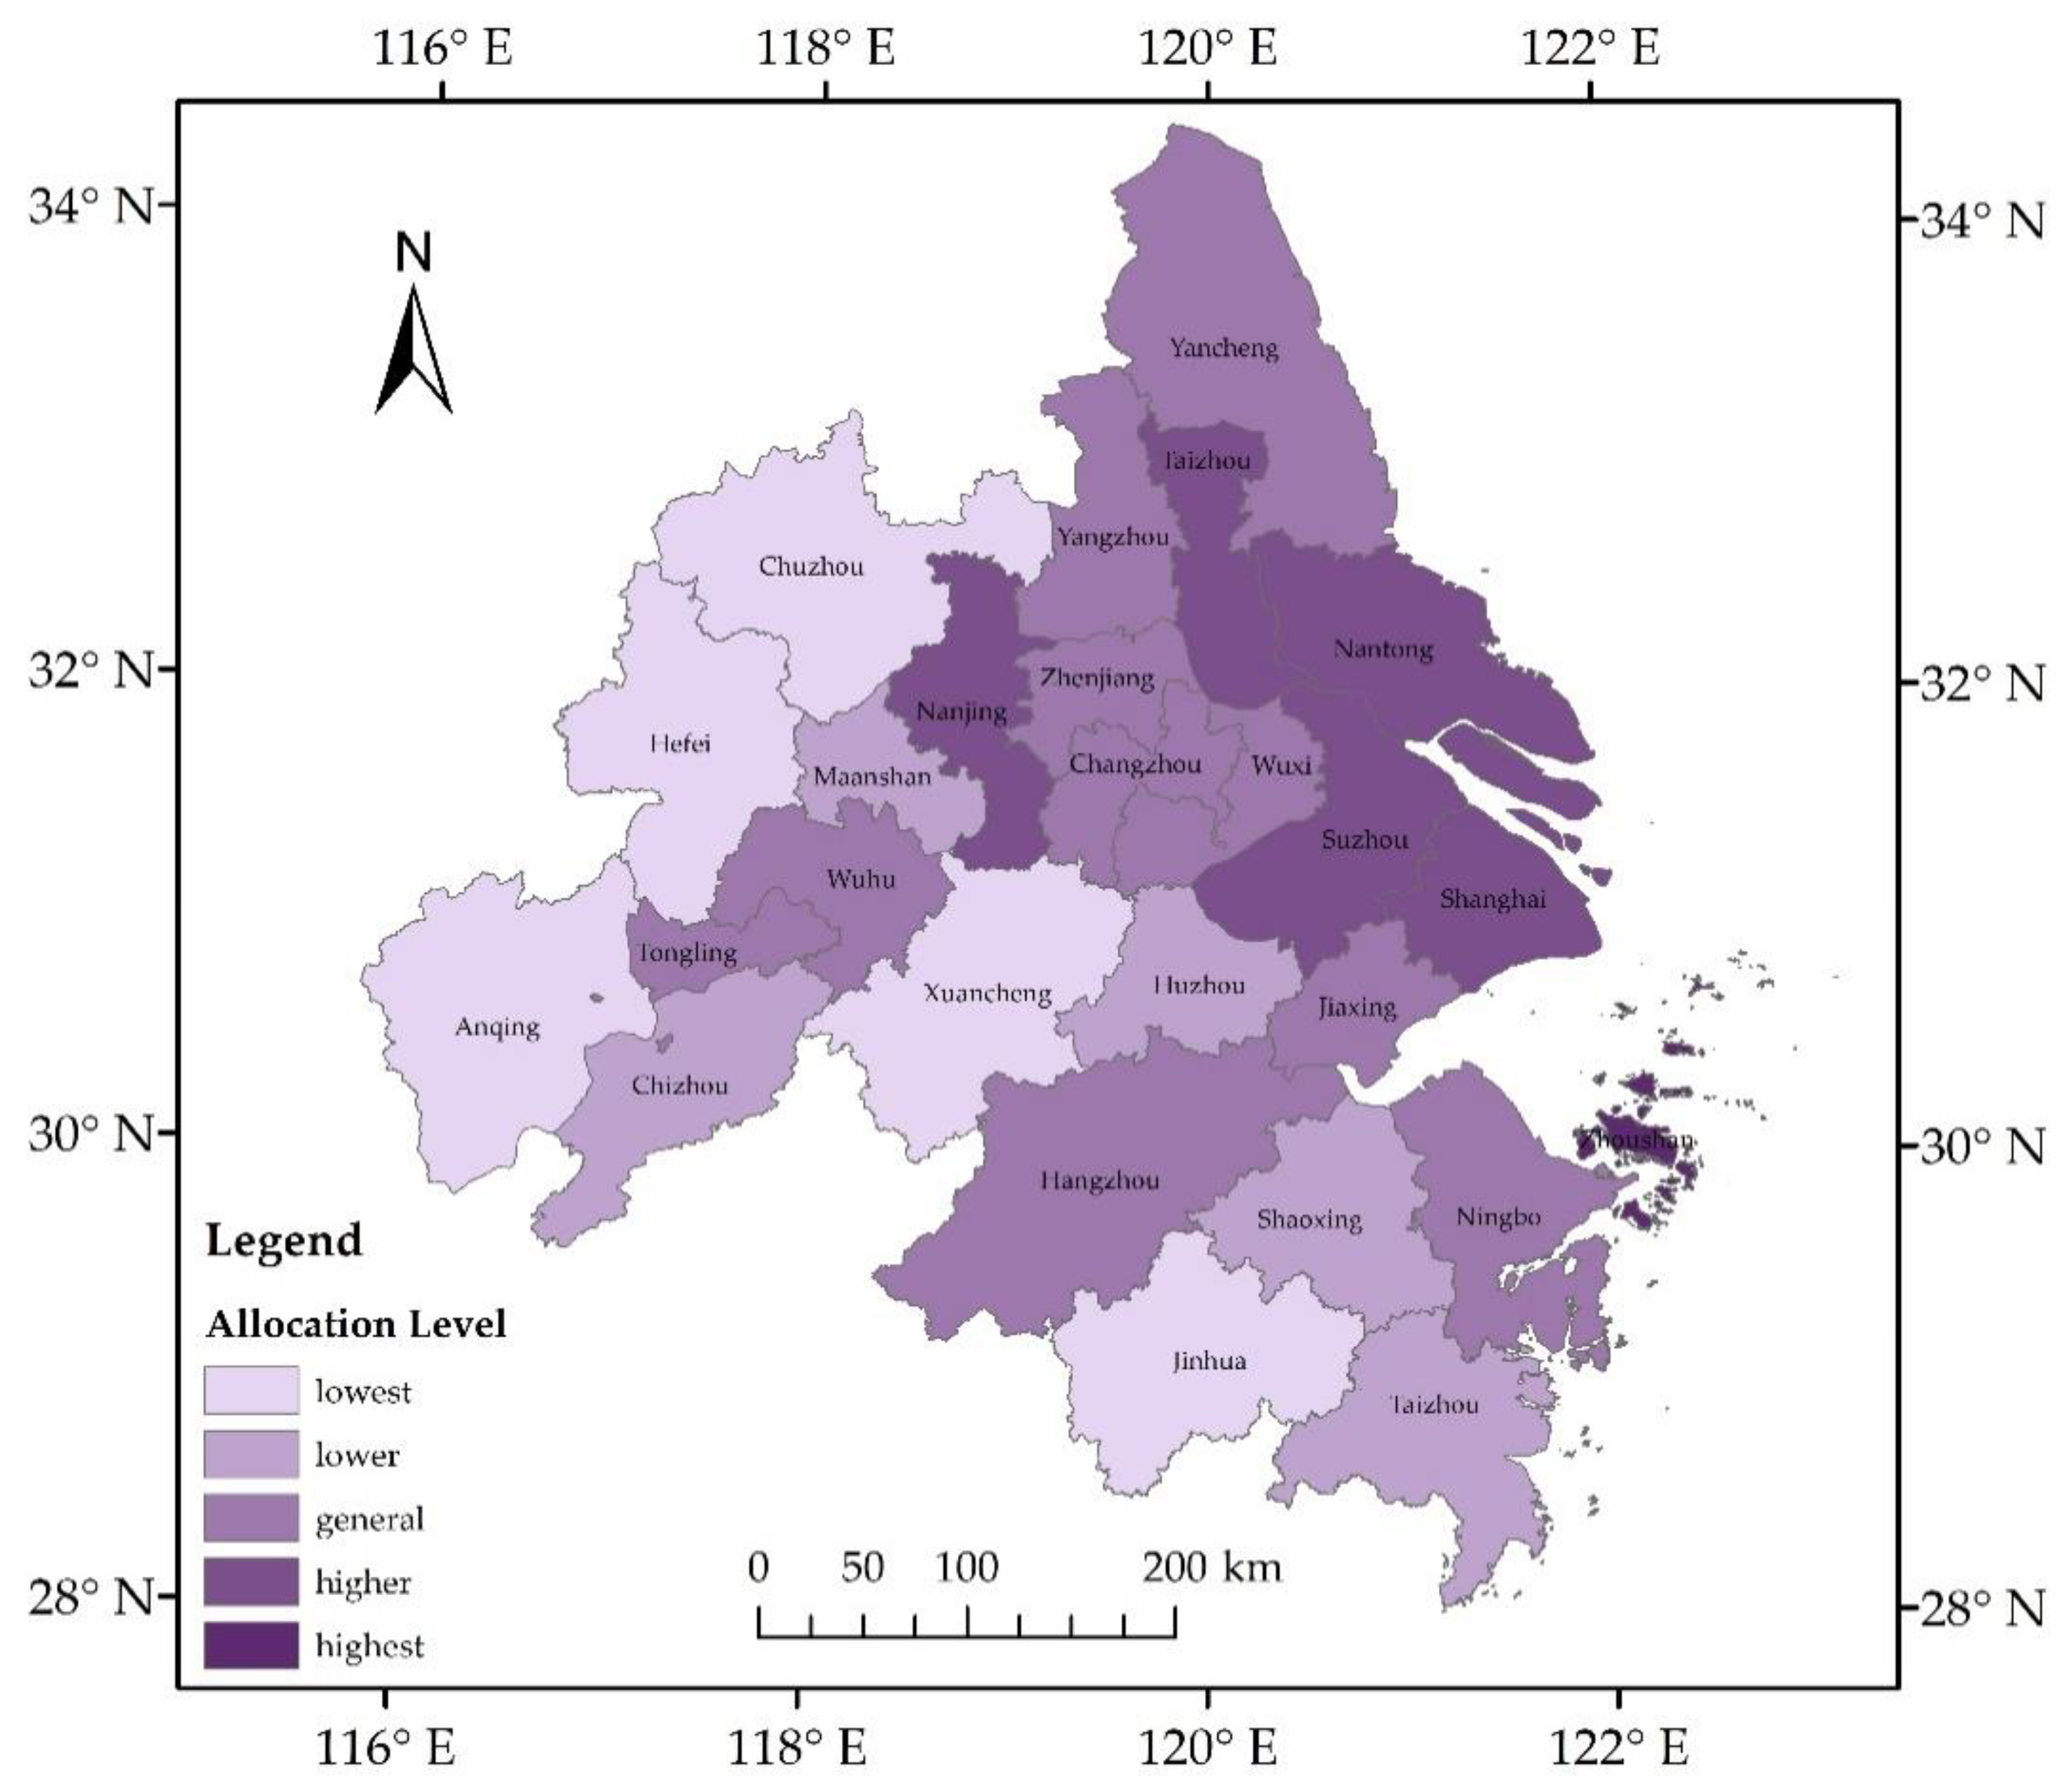
Several similarities and differences can be observed between the spatial allocation level distribution of wharves at the city scale and the county scale. At the city scale, the cities with high spatial allocation level are mainly distributed along the Yangtze River, from Shanghai to Hangzhou, and in parts of Zhoushan and Ningbo near the sea. At the county level, counties with high allocation level are also distributed in these areas. This phenomenon shows the consistency of features in different scales. However, by comparing the evaluation results of the two scales, the great variations in the allocation levels of the different counties become evident, signifying the complexity of the different scale features.
3.2.1. City Scale
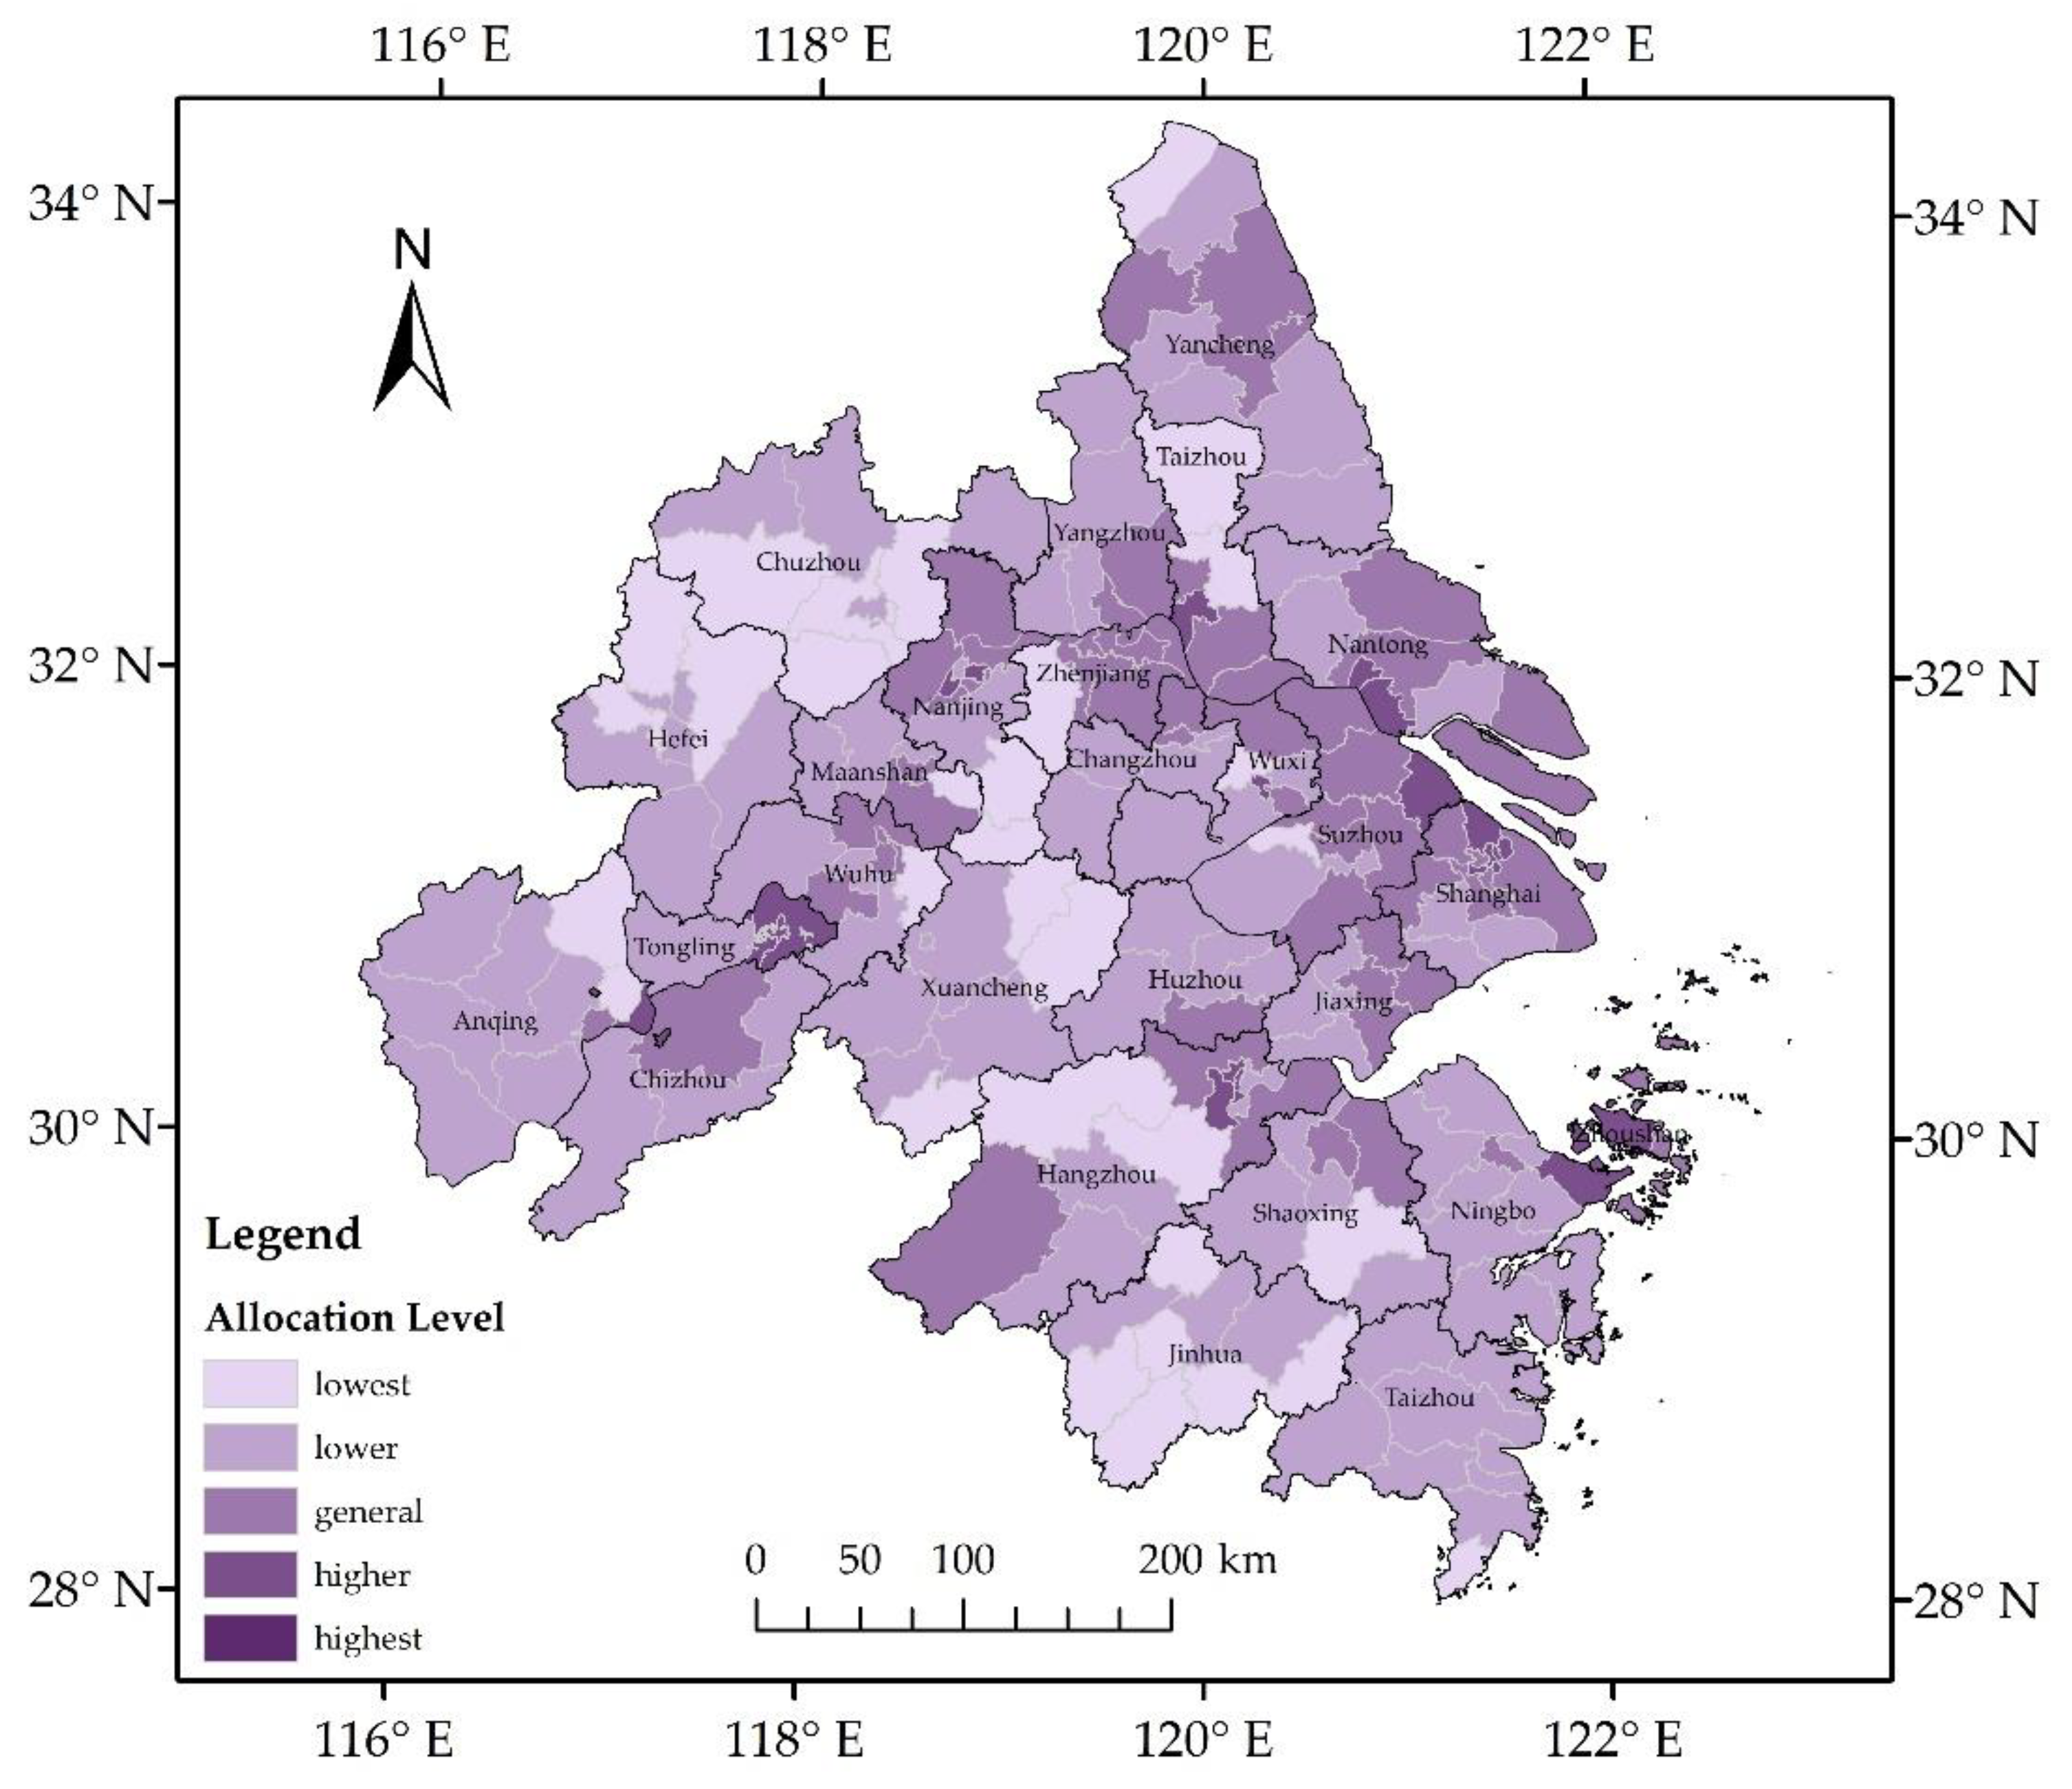
In accordance with the measured spatial allocation level, the results are divided into five levels from low to high. Correspondingly, the calculation results are enlarged 100 times to increase the intuitiveness of the data.
Figure 9 shows the allocation level distribution map of the wharves at the city scale. The highest and lowest allocation levels of wharves in the Yangtze River Delta are 77.10 and 4.38, respectively, indicating that the allocation levels of wharves among the cities in the Yangtze River Delta Urban Agglomeration demonstrate great differences. Among these cities, only Zhoushan has a high allocation level. Five cities, namely, Shanghai, Nantong, Taizhou, Suzhou, and Nanjing, have a high allocation level. A total of 10 and 5 cities have general and low allocation levels, respectively. Except for Zhoushan, the allocation level of the other cities is lower than 40, indicating that the overall level of wharf allocation in the Yangtze River Delta Urban Agglomeration is generally low.
Among the six cities with the highest allocation level, Shanghai and Nantong belong to the Yangtze River and the eastern coasts. Both city have prominent geographical advantages and combine the advantages of “Golden Coast” and “Golden Waterway”. Moreover, the two cities are the hubs that connect the Pacific Ocean and the Yangtze River. The five cities with the lowest allocation level are located at the edge of the Yangtze River Delta Urban Agglomeration. The population and facility density in these cities are at a lower level, indicating that the corresponding shipping traffic is backward, and the number of wharves is insufficient.
3.2.2. County Scale
Figure 10 shows the allocation level distribution map of wharves at the county scale. The highest and lowest allocation levels of Yangtze River Delta Urban Agglomeration are 77.06 and 0.60, respectively. At the county scale, the high level of wharf allocation is mainly distributed along the Yangtze River and the Shanghai–Jiaxing–Hangzhou section. This trend is evident at this scale, especially in Anqing, which has a low wharf allocation level. Moreover, the allocation level in the Yingjiang District along the Yangtze River is considerably higher than that of the other districts and counties. Among the six cities with higher allocation level, the districts and counties in Shanghai, Nantong, and Suzhou generally have a higher allocation level, whereas those in Taizhou, Nanjing, and Zhoushan districts and counties differ greatly. The allocation level in Taizhou increases from north to south, whereas that of Nanjing decreases from the center towards the surrounding areas. Zhoushan has archipelagic characteristics, which means that the covered districts and counties are seriously affected by the location of the sea and land concentration.
3.3. Relationship between Spatial Wharf Pattern and Economy
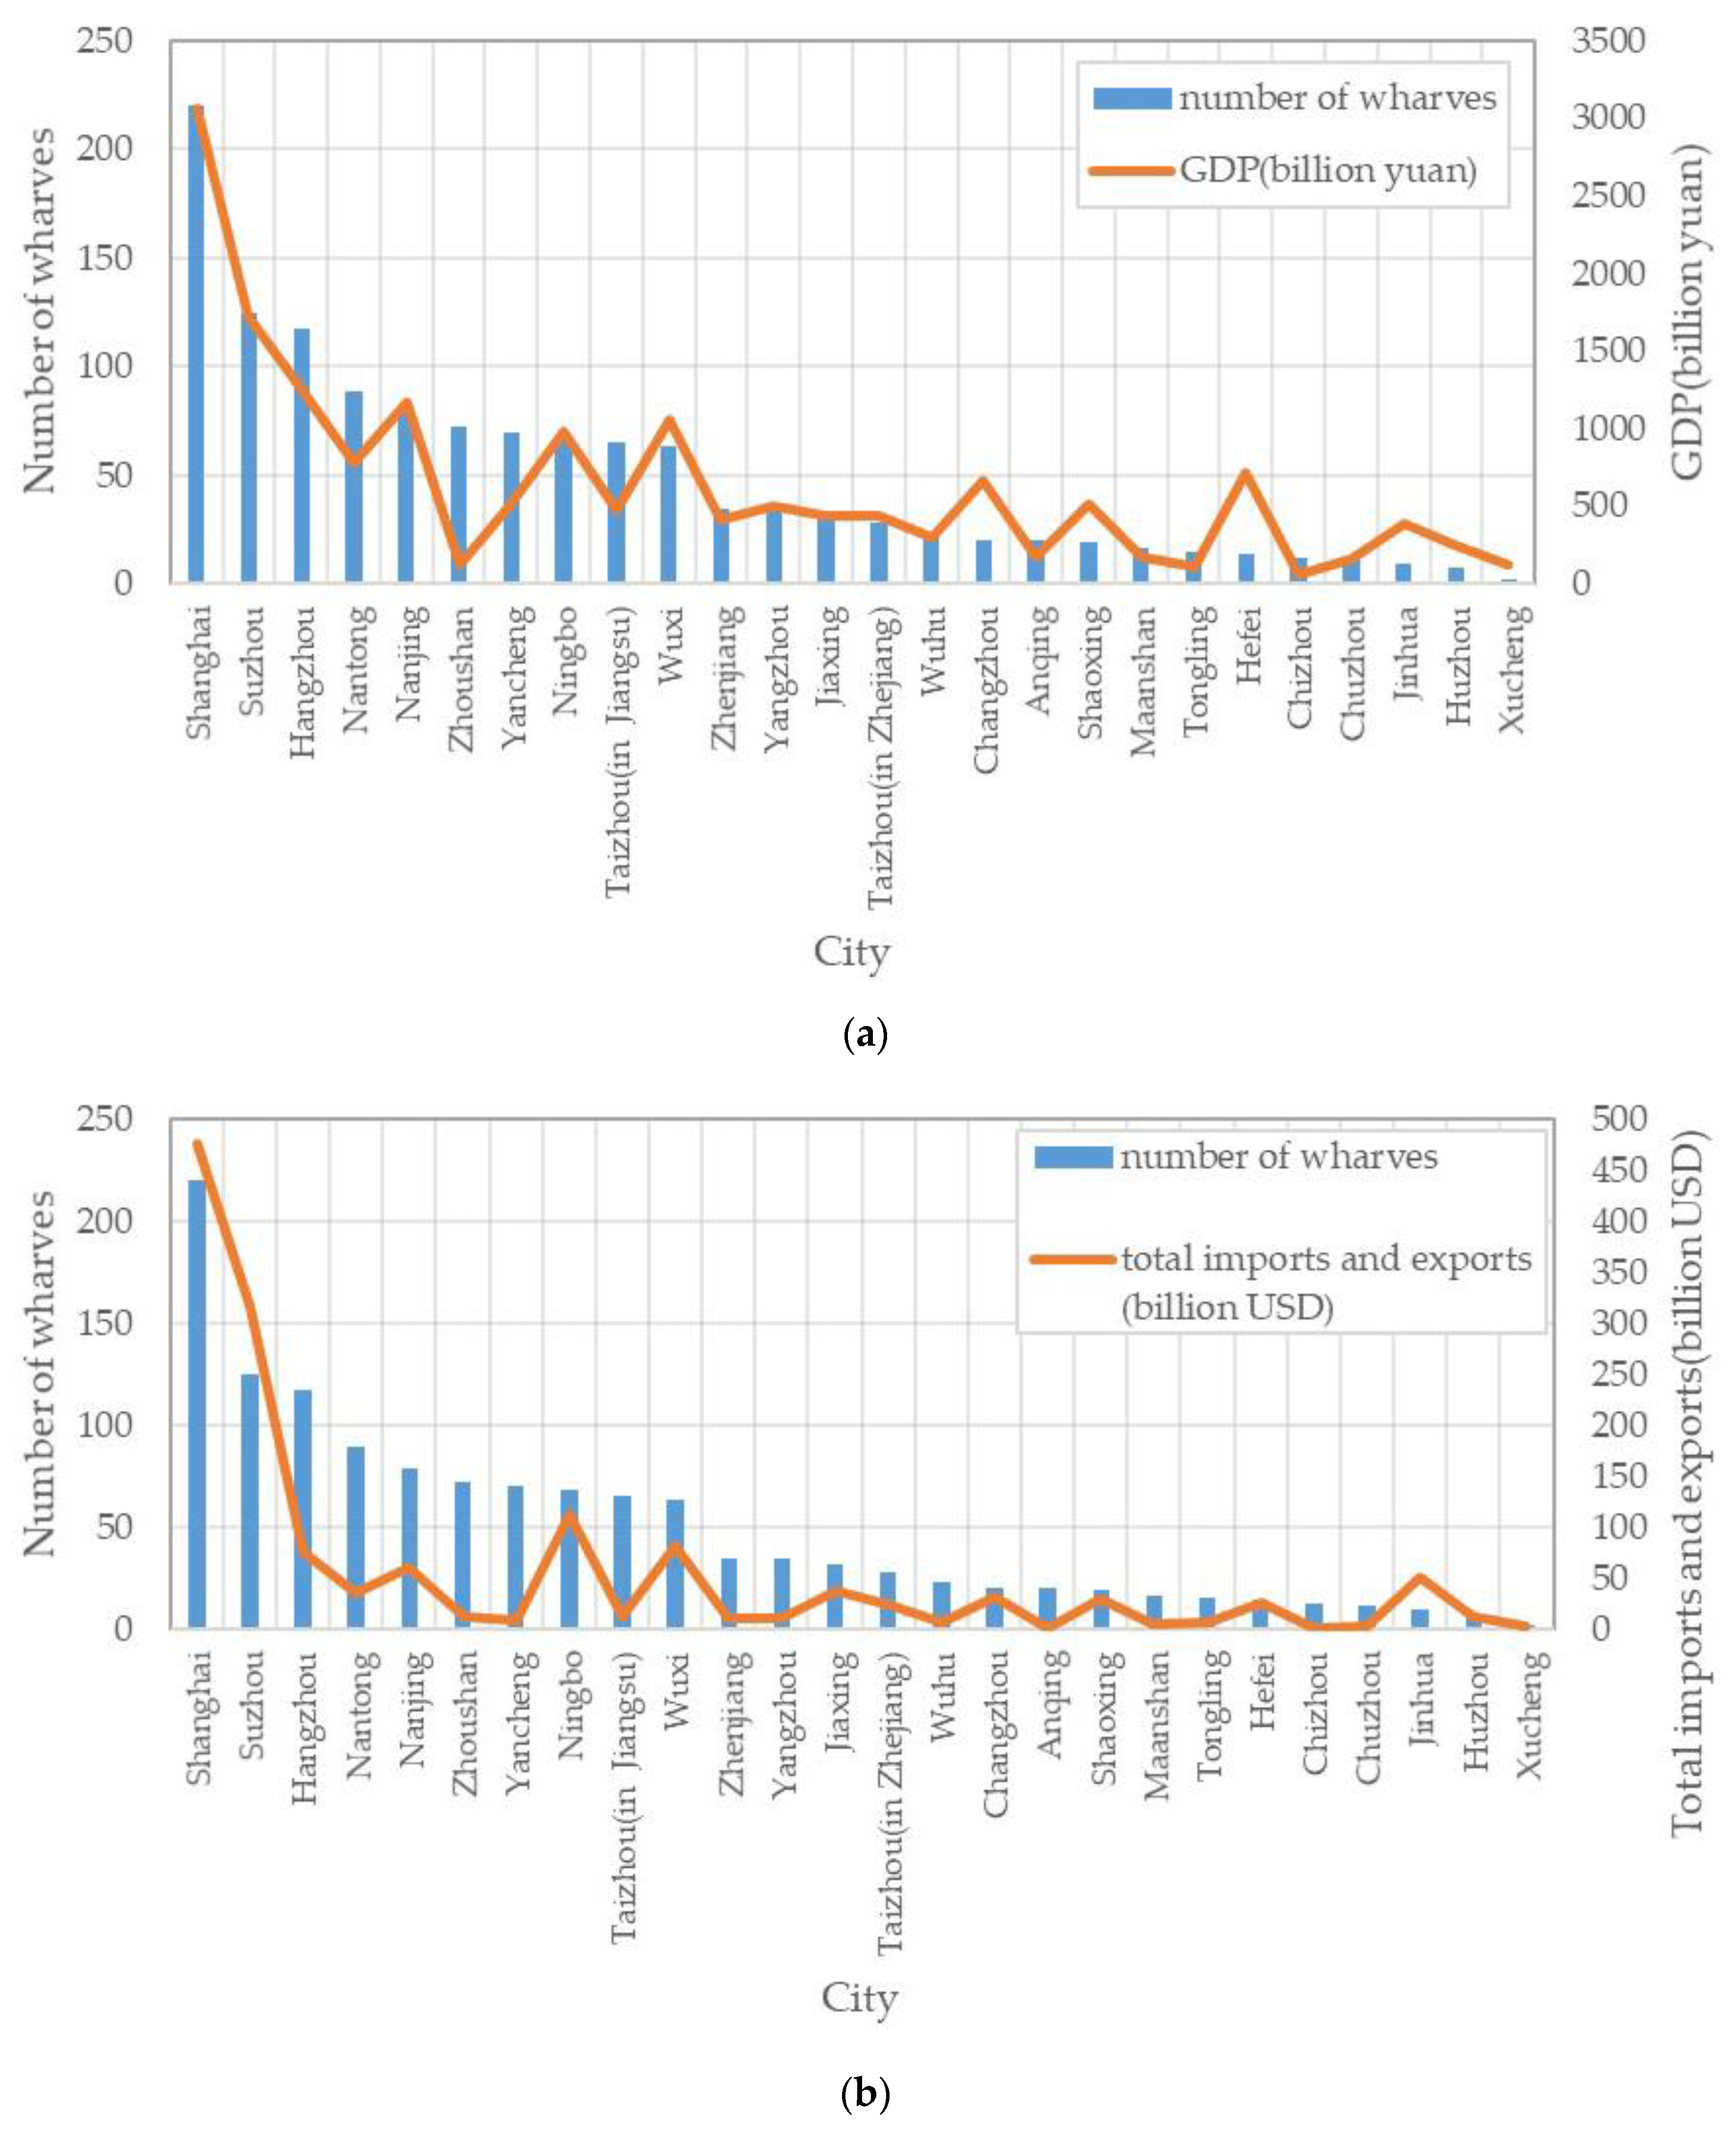
In this study, we selected four economic indicators to analyze the relationship between the spatial wharf pattern and the economy on a city scale by applying the Pearson correlation coefficient method. The four economic indicators are gross domestic product (GDP), per capita GDP, per capita disposable income (PCDI), and total imports and exports. The results are shown in
Table 6. The correlation of GDP and the number of wharves is significant (
p < 0.05) and positive. Similarly, the correlation of the total imports and exports with the number of wharves is significant (
p < 0.05) and positive. The correlation values of both indicators are larger than 0.8, indicating that the areas with more wharves have higher GDP and total imports and exports compared with those with less wharves. The correlation of the per capita GDP and PCDI with the number of wharves are also significant and positive, but the values are lower than 0.7, which means that the correlation is not strong. In addition, the correlations of the four economic indicators and the allocation level are all lower than 0.5, indicating that the relationship between the allocation level and the economy is not clear.
Figure 11 shows the relationship among the number of wharves, GDP, and total imports and exports. The results show that the GDP and the total imports and exports are positively correlated with the number of wharves, which is similar to the results of the Pearson correlation coefficient. However, several cities, including Zhoushan and Yancheng, do not conform to this result. Zhoushan has 72 wharves and ranks sixth among the 26 cities, but its GDP and total imports and exports are CNY 121.978 billion and USD 11.559 billion, which is lower than the average GDP (CNY 636.577 billion) and total imports and exports (USD 55.403 billion). The city’s per capita GDP and PCDI rank eleventh and ninth, respectively, among the 26 cities. These results can be attributed to the geographical location and industrial composition of Zhoushan. Located on the south side of the Yangtze River estuary and on the outer edge of the Hangzhou Bay, Zhoushan is at the center of China’s mainland coastline and the first prefecture-level unit built on the islands. Zhoushan has numerous islands. The total coastline length is 2444 km, which is highly suitable for wharf construction. However, Zhoushan’s primary industry accounted for 11.5% in 2017, which is higher than the national average of 7.9%; fisheries account for 94.6% of the city’s primary industry. The unique geographical environment and industrial structure lead to high allocation level and low total imports and exports. Compared with Zhoushan, Ningbo also has numerous wharves and a high allocation level, and its GDP and total imports and exports are also high. This city is adjacent to Zhoushan, and both have abundant water resources. However, Ningbo is on the mainland, which not only has developed fisheries, but also developed industries and commerce compared with Zhoushan. Yancheng has 70 wharves and ranks seventh among the 26 cities. The GDP of this city is CNY 508.269 billion, which is slightly lower than the average GDP. The total imports and exports are USD 8.653 billion, which is much lower than the average value. Meanwhile, Yancheng’s per capita GDP and PCDI are CNY 70,216 and CNY 26,740, respectively, both of which are lower than the respective average values of CNY 97,227 and CNY 37,399. These values imply that Yancheng’s economy is underdeveloped and foreign trade is inactive. This phenomenon may also depend on the geographical location. Yancheng is close to the Yellow Sea; thus, the coastline is sufficient to build wharves. However, the city is located at the northernmost part of the Yangtze River Delta Urban Agglomeration, far from Shanghai and other economically developed cities. Economically developed cities usually play a leading role in the economy of surrounding cities; therefore, Yancheng’s distance from Shanghai might be a factor in its underdeveloped economy.
4. Discussion
This study shows that wharves have a distinct clustering distribution in the Yangtze River Delta Urban Agglomeration. The distribution area mainly concentrates on the Yangtze River and eastern coasts, especially in the former. However, the level of wharf allocation is generally low, and differences are observed among the regions, especially in the cities along the Yangtze River and the eastern and western cities and counties. Wharves are mainly located in developed cities. The two areas with the highest wharf density are Shanghai and Hangzhou. Meanwhile, the areas with a high level of allocation include developed cities, such as Shanghai, Nanjing, Suzhou and Nantong. This phenomenon is confirmed by the correlation between the spatial wharf pattern and the economy.
Based on the aforementioned research, this paper established a wharf spatial pattern analysis system suitable for urban agglomeration. At present, although scholars attach great importance to urban infrastructure planning, few spatial analyses and model technology methods are related to wharves. Most research focuses on the location of a certain kind of wharf in a city, but investigations on the spatial wharf pattern of urban agglomerations are still lacking. Therefore, a simple and feasible wharf spatial pattern analysis system suitable for urban agglomerations must be established.
Moreover, this study explored the suitability of spatial allocation under the influence of multiple factors by establishing an evaluation system for the spatial allocation levels of urban agglomerations in the Yangtze River Delta. At present, the evaluation of facility allocation does not involve space factors or just considers one spatial factor. Therefore, a comprehensive consideration of various factors is presented in this research to address this gap.
5. Conclusions
This study utilizes the GIS spatial analysis method and index system construction to analyze the spatial pattern of wharves in the Yangtze River Delta Urban Agglomeration. Results show that the spatial pattern of wharves exhibits an aggregation pattern. The main agglomeration center is located in the downtown area of Shanghai and Hangzhou. The distribution of wharves is greatly influenced by water distribution. The allocation level of wharves at different scales also presents remarkable agglomeration characteristics. In general, significant differences and imbalances, which are influenced by many factors, such as geographical environment, water resources distribution, population, government planning, and macro-policies, are observed in the spatial pattern of the wharves. In addition, the development of a wharf is closely related to economy. The areas with more wharves tend to have higher GDP and total imports and exports compared with those with fewer wharves.
According to the analysis of the relationship between the spatial wharf pattern and economy of Ningbo and Zhoushan, the construction of wharves should conform to regional resources and economic structure. Based on the research results and analysis, we propose three suggestions for wharf planning:
- (1)
Accelerate the process of regional integration. As the economic development environment of the area, the Yangtze River Delta Urban Agglomeration is a mature economic region in China that requires corresponding harbor and wharf gathering and dispatching conditions. In terms of wharves, Shanghai should be the central hub. All kinds of wharves that will be built in the region should accord to logistics, and a combination of large, medium, and small wharves with clear functional division and close cooperation should be developed in accordance with the sources of goods and the gathering and dispatching conditions. Executing these actions can lay the material foundation for a long-term sustainable development of the Yangtze River Delta Urban Agglomeration economy.
- (2)
Construct the wharves according to local conditions to link the wharves closely with the cargo and passenger sources. Passenger terminals, cruise ship terminals, and yacht terminals for tourists should be constructed in areas that are rich in water resources and tourist attractions, such as Zhoushan, to develop tourism.
- (3)
Strengthen the connection between water transport and land transport, and establish an inland transport network system on land with a wharf as the end point. The construction of a convenient and high-speed road cargo transport network near the wharf logistics center can further expand the potential demand for the terminal throughput by facilitating smooth traffic between the wharf and the hinterland.
Research on the spatial distribution characteristics and allocation level of wharves is only a small portion of related issues that should be further studied. This study only considers the role of spatial factors in the evaluation of allocation. The impact of the attributes of the wharf itself, such as the capacity of handling cargoes, is excluded due to limited data availability. Therefore, the developed evaluation index system in this study remains insufficient. In addition, different types of wharves might involve different allocation level evaluation indexes. In this study, a consistent evaluation index system is adopted for all wharves because the wharf is only abstracted as a kind of urban infrastructure. In future research, different types of wharf allocation level should be evaluated by separately selecting the evaluation indexes and considering additional factors.
Author Contributions
Conceptualization, Penglin Zhang and Jiewen Hong; Methodology, Hongli Li, Penglin Zhang, Junqiang Wang and Jiewen Hong; Formal Analysis, Hongli Li and Jiewen Hong; Writing-Original Draft Preparation, Hongli Li; Writing-Review & Editing, Penglin Zhang and Junqiang Wang; Project Administration, Jiewen Hong.
Funding
This research was funded by The National Key Research and Development Program of China, grant numbers 2018YFF0215000, 2018YFF0215006.
Acknowledgments
The authors would like to thank the Third Geoinformation Mapping Institute of National Administration of Surveying Mapping and Geoinformation for providing the data used in this study.
Conflicts of Interest
The authors declare no conflict of interest. The funders had no role in the design of the study; in the collection, analyses, or interpretation of data; in the writing of the manuscript, or in the decision to publish the results.
References
- Erdogan, H.; Doran, B.; Seckin, A.; Akbas, B.; Celikoglu, Y.; Bostan, T. Seismic Performance and Retrofit Evaluation of an Existing Pile-Wharf Structure. J. Perform. Constr. Facil. 2017, 31, 04017110. [Google Scholar] [CrossRef]
- Su, L.; Lu, J.; Elgamal, A.; Arulmoli, A.K. Seismic performance of a pile-supported wharf: Three-dimensional finite element simulation. Soil Dyn. Earthq. Eng. 2017, 95, 167–179. [Google Scholar] [CrossRef]
- Tao, G.L.; Fei, D.; Shu, L. The Seismic Performance Evaluation of PHC Pile Wharf Based on Pushover Analysis. Appl. Mech. Mater. 2014, 638–640, 1900–1904. [Google Scholar] [CrossRef]
- Heidary-Torkamani, H.; Bargi, K.; Amirabadi, R.; McCllough, N.J. Fragility estimation and sensitivity analysis of an idealized pile-supported wharf with batter piles. Soil Dyn. Earthq. Eng. 2014, 61–62, 92–106. [Google Scholar] [CrossRef]
- Paulauskas, V.; Paulauskas, D.; Placiene, B.; Barzdziukas, R. Quay wall stability and strength evaluation. Mechanika 2017, 23, 298–304. [Google Scholar] [CrossRef]
- Su, L.; Wan, H.-P.; Dong, Y.; Frangopol, D.M.; Ling, X.-Z. Efficient Uncertainty Quantification of Wharf Structures under Seismic Scenarios Using Gaussian Process Surrogate Model. J. Earthq. Eng. 2018. [Google Scholar] [CrossRef]
- Li, J.; Song, B.; Wu, P. Comparative study of seismic dynamic damage on vertical and batter pile-supported wharf structures. J. Build. Struct. 2016, 37, 151–157. [Google Scholar] [CrossRef]
- Wang, Y.; Pang, M.; Pei, Y.; Cai, Z. Matching comprehensive evaluation of wharf function area adjustment based on grey rough set and entropy weight method. In Proceedings of the 2014 4th International Conference of Logistics Engineering and Management: System Planning, Supply Chain Management, and Safety, ICLEM 2014, Shanghai, China, 9–11 October 2014; pp. 1189–1194. [Google Scholar]
- Boroschek, R.L.; Baesler, H.; Vega, C. Experimental evaluation of the dynamic properties of a wharf structure. Eng. Struct. 2011, 33, 344–356. [Google Scholar] [CrossRef]
- Zhou, W.; Qian, Y.; Li, L.; Zhang, Y. Application of Environmental Risk Consequence Assessmentin in Site Selection of Hazardous Chemical Wharfs. Environ. Prot. Sci. 2012, 38, 59–64. [Google Scholar] [CrossRef]
- Shang, D.; Zhang, Y. Essential factors in site selection of LNG terminal. Port Waterw. Eng. 2014. [Google Scholar] [CrossRef]
- Gu, H.; Lv, D.; Shen, T.; Yang, Y. Study on the Location of Public Yacht Dock Sites in Shenzhen Based on Sea-Land Coordination. Geogr. Geo Inf. Sci. 2018, 34, 80–85. [Google Scholar] [CrossRef]
- Jia, Q. Remote Sensing Research of Green Space Evolution and Its Cool Island Intensity; Tianjin University: Tianjin, China, 2015. [Google Scholar]
- Lin, L.; Zhu, Y.; Liang, P.; Xiao, B. The spatial patterns of housing conditions of the floating population in China based on the sixth census data. Geogr. Res. 2014, 33, 887–898. [Google Scholar] [CrossRef]
- Liu, T.; Qi, Y.; Cao, G. China’s floating population in the 21st century:Uneven landscape, influencing factors, and effects on urbanization. Acta Geogr. Sin. 2015, 70, 567–581. [Google Scholar] [CrossRef]
- Han, H.; Yang, C.; Song, J. Simulation and projection of land-use change in Beijing under different scenarios. Prog. Geogr. 2015, 34, 976–986. [Google Scholar] [CrossRef]
- Sun, T.; Liu, X.; Li, G. Evolution of China’s Spatial Economy and Regional Industrial Shift:Empirical Analysis of Changes in Economic Shares of Chinese Provinces from 1952 to 2010. Sci. Geogr. Sin. 2015, 35, 56–65. [Google Scholar]
- Zhao, L.; Zhao, Z.; Wang, W. The Spatial Pattern of Economy in Coastal Area of China. Econ. Geog. 2014, 34, 14–18+27. [Google Scholar] [CrossRef]
- Tian, D.; Rui, J.; Chen, N. Shanghai Public Cultural Facility Numerical Character and Spatial Layout. Planners 2011, 27, 24–28. [Google Scholar] [CrossRef]
- Zhang, J.; Li, C.; Zhou, G.; Shen, Q.; Ma, Z. The evolution pattern and mechanism of public service facilities lands in Changchun. Acta Geogr. Sin. 2015, 70, 1939–1952. [Google Scholar] [CrossRef]
- Zhu, Y.; Yang, Y.; Li, J.; Tu, Z. Research on the spatial pattern of the public cultural services in Wuhan City. J. Cent. China Norm. Univ. Nat. Sci. 2017, 51, 526–533. [Google Scholar] [CrossRef]
- Wu, Y.; Li, S.; Ding, Y. Study on Urban Public Nonprofit Recreational and Cultural Facilities Allocation Based on the Accessibility—A case of Guangzhou Downtown. Spec. Zone Econ. 2017, 21, 59–64. [Google Scholar]
- Wu, J.; Qin, W.; Peng, J.; Li, W. The Evaluation of Walkability and Daily Facility Distribution Reasonability of Futian District, Shenzhen Based on Walk Score. Urban Dev. Stud. 2014, 21, 49–56. [Google Scholar] [CrossRef]
- Environmental Quality Standards for Surface Water; GB 3838-2002; State Environmental Protection Administration: Beijing, China, 2002.
- Yang, R.; Liu, Y.; Long, H.; Wang, Y.; Zhang, Y. Spatial Distribution Characteristics and Optimized Reconstructing Analysis of Rural Settlement in China. Sci. Geogr. Sin. 2016, 36, 170–179. [Google Scholar] [CrossRef]
- Du, G.; Guan, T.; Li, D.; Zhang, Y. Spatial Distribution of Poverty Village in Heilongjiang Province. Econ. Geogr. 2018. [Google Scholar] [CrossRef]
- Xie, Z.; Wu, B. Tourism Spatial Structure of Resources-based Attractions in China. Sci. Geogr. Sin. 2008, 28, 748–753. [Google Scholar] [CrossRef]
- Parzen, E. On estimation of a probability density function and mode. Ann. Math. Stat. 1962, 33, 1065–1076. [Google Scholar] [CrossRef]
- Rosenblatt, M. Remarks on Some Nonparametric Estimates of a Density Function. Ann. Math. Stat. 1956, 27, 832–837. [Google Scholar] [CrossRef]
- Gu, C.; Pang, H. Evolution of Chinese Urbanization Spaces: Kernel spatial approach. Sci. Geogr. Sin. 2009, 29, 10–14. [Google Scholar] [CrossRef]
- Li, D.; Yu, H.; Li, X. The Spatial-Temporal Pattern Analysis of City Development in Countries along the Belt and Road Initiative Based on Nighttime Light Data. Geomat. Inf. Sci. Wuhan Univ. 2017, 42, 711–720. [Google Scholar] [CrossRef]
- China, Ministry of Transport of the People’s Republic. Design Code for Cruise Terminal. 2015. Available online: http://www.wanfangdata.com.cn/details/detail.do?_type=standards&id=JTS 170-2015 (accessed on 14 March 2019).
- China, Ministry of Transport of the People’s Republic. Code for Design of Liquefied Natural Gas Port and Jetty. 2016. Available online: http://www.wanfangdata.com.cn/details/detail.do?_type=standards&id=JTS 165-5-2016 (accessed on 14 March 2019).
- Xu, X.; Zhao, Y. Spatial Distribution Pattern and Accessibility Assessment of Pension Service Facilities in Nanjing: Two-step Floating Catchment Area Method Based on Time Cost. Mod. Urban Res. 2017. [Google Scholar] [CrossRef]
- Wei, W.; Shi, P.; Tuo, M.; Wang, X.; Wang, X. The Road Network Density and Its Spatial Dependence in Gansu Province based on GIS. Sci. Geogr. Sin. 2012, 32, 1297–1303. [Google Scholar]
- Zhao, S.; Sun, C.; Zhen, D. Water resource utilization efficiency and its spatial spillover effects measure in China. Acta Geogr. Sin. 2014, 69, 121–133. [Google Scholar] [CrossRef]
- Zhang, S.; Zhang, M.; Chi, G. The Science and Technology Evaluation Model Based on Entropy Weight and Empirical Research During the 10th Five-Year of China. Chin. J. Manag. 2010, 7, 34. [Google Scholar] [CrossRef]
© 2019 by the authors. Licensee MDPI, Basel, Switzerland. This article is an open access article distributed under the terms and conditions of the Creative Commons Attribution (CC BY) license (http://creativecommons.org/licenses/by/4.0/).


