Article

Modelling and Visualizing Holographic 3D Geographical Scenes with Timely Data Based on the HoloLens

1
State Key Laboratory of Information Engineering in Surveying, Mapping and Remote Sensing, Wuhan University, 129 Luoyu Road, Wuhan 430079, China
2
Collaborative Innovation Center of Geospatial Technology, 129 Luoyu Road, Wuhan 430079, China
*
Author to whom correspondence should be addressed.
ISPRS Int. J. Geo-Inf. 2019, 8(12), 539; https://doi.org/10.3390/ijgi8120539
Submission received: 29 October 2019 / Revised: 14 November 2019 / Accepted: 24 November 2019 / Published: 28 November 2019

Abstract

:
Commonly, a three-dimensional (3D) geographic information system (GIS) is based on a two-dimensional (2D) visualization platform, hindering the understanding and expression of the real world in 3D space that further limits user cognition and understanding of 3D geographic information. Mixed reality (MR) adopts 3D display technology, which enables users to recognize and understand a computer-generated world from the perspective of 3D glasses and solves the problem that users are restricted to the perspective of a 2D screen, with a broad application foreground. However, there is a gap, especially dynamically, in modelling and visualizing a holographic 3D geographical Scene with GIS data/information under the development mechanism of a mixed reality system (e.g., the Microsoft HoloLens). This paper attempts to propose a design architecture (HoloDym3DGeoSce) to model and visualize holographic 3D geographical scenes with timely data based on mixed reality technology and the Microsoft HoloLens. The HoloDym3DGeoSce includes two modules, 3D geographic scene modelling with timely data and HoloDym3DGeoSce interactive design. 3D geographic scene modelling with timely data dynamically creates 3D geographic scenes based on Web services, providing materials and content for the HoloDym3DGeoSce system. The HoloDym3DGeoSce interaction module includes two methods: Human–computer physical interaction and human–computer virtual–real interaction. The human–computer physical interaction method provides an interface for users to interact with virtual geographic scenes. The human–computer virtual–real interaction method maps virtual geographic scenes to physical space to achieve virtual and real fusion. According to the proposed architecture design scheme, OpenStreetMap data and the BingMap Server are used as experimental data to realize the application of mixed reality technology to the modelling, rendering, and interacting of 3D geographic scenes, providing users with a stronger and more realistic 3D geographic information experience, and more natural human–computer GIS interactions. The experimental results show that the feasibility and practicability of the scheme have good prospects for further development.

1. Introduction

A three-dimensional (3D) geographical scene is an important way to understand the real world. In the 3D geographic information system (GIS) field, the modelling and visualization of 3D geographical scenes has been a hot issue. Researchers have made great efforts to build 3D models by software. Some work focused on integrating building information modeling (BIM) [1] and computer-aided design (CAD) [2] models in the architecture and design domain into GIS [3]. The main work was employing spatial information in BIM and CAD models. The City Geopraphy Markup Language (CityGML), an open, exchangeable, and XML-based 3D city model, was developed by the Open Geospatial Consortium (OGC) for the global geospatial community [4]. Those modelling methods promote the development of 3D GIS. However, many of the 3D models and 3D GIS are restricted to a two-dimensional (2D) visualization platform, hindering the understanding and expression of the real world from 3D space [5]. To overcome the limitations, some efforts have been made to display 3D models/scene/systems through wearable devices. Stereoscopic visualization with 3D glasses is one type. For example, the GeoWall a Cave Automatic Virtual Environment (CAVE) displays a 3D scene with 3D glasses for geoscience research and education [6]. This method displays 3D scenes well, but the interaction ability between the user and the system is poor.
With the developments of information technologies and hardware technologies, virtual reality (VR), augmented reality (AR), and mixed reality (MR) have been developed [7]. VR is a kind of realistic 3D virtual scene generated by a computer. Users can interact with and perceive the virtual scene with the help of necessary hardware devices, and thus produce an immersive computer system. AR is the extension and expansion of VR. Through AR equipment, the computer-generated virtual environment and objective real world coexist in the same AR system, which makes users present an enhanced reality environment integrating virtual objects. MR is a further development and combination of AR and VR. By introducing real environment information into the virtual reality, users can construct an interactive information loop among the virtual world, real world, and users, thus enhancing users’ experience. VR, AR, and MR adopt 3D display technology, which enables users to recognize and understand a computer-generated world from the perspective of 3D glasses and solves the problem that users are restricted to the perspective of a 2D screen [7].
MR has applications in 3D GIS. Some applications are actual common 3D GIS systems with VR ideas, but their visualizations are based on the 2D screens of a computer [8,9,10,11,12]. Some MR systems in GIS visualized with VR devices are emerging [13,14,15,16]. MR can fix the virtual object in real space to give people a sense of reality. Well-known MR devices and systems are Google Cardboard [17], Microsoft HoloLens [18], HTC Vive [19], Facebook Oculus Rift [20], and Sony PlayStation [21].
The Microsoft HoloLens is the first untethered and advanced MR headset [22,23,24]. The HoloLens has advanced features in 3D stereoscopic displays, such as gaze, gesture capture, spatial sound, and spatial mapping. Therefore, the HoloLens is widely used in the research of visual applications, such as film [24], education [25], robots [26,27], disaster and emergency management [28], virtual laboratories [29], the Mars exploration project [7], and medical treatment and care [23,30,31,32,33,34]. Also, the HoloLens is currently applied to the study of 3D geographic scenes [5]. Since the HoloLens is a general MR device, there is a gap between the device and its application in holographic 3D geographic scenes. To fill the gap, it should, especially dynamically, model and visualize a holographic 3D geographical scene with GIS data/information under the development mechanism of the HoloLens. The work modelling and visualizing a 3D geographical scene with prepared models has been done [5]. However, the work modelling and visualizing a 3D geographical scene with timely GIS data has not been done yet.
This paper furthers our previous work, which only studied the visualization of 3D geographic scenes with prepared models based on the HoloLens glasses [5]. The main goal of this paper was to propose an architecture using HoloLens glasses to model and visualize holographic 3D geographic scenes with timely data. Here, the timely data mainly refers to the data obtained from the web service at the best possible moment. To test the feasibility of the design architecture, this paper used the HoloLens developer version as the experimental platform, using OpenStreetMap data [35] and Bing Map Server data [36] as test data to carry out experiments. The experimental results show that the HoloLens can be used to create and display 3D geographic scenes, bringing useful human–computer physical interaction experiences and visual impact experiences to users. The contribution of this paper is that it shows an approach to model and visualize a holographic 3D geographical scene with timely GIS data/information under the development mechanism of the HoloLens. It would be meaningful to broaden the applications of the HoloLens in GIS.

2. Methods

2.1. Architecture and Design of the HoloDym3DGeoSce

The goals of this paper were to model and visualize holographic 3D geographic scenes with timely GIS data based on mixed reality holographic glasses of the HoloLens, map 3D geographic scenes to physical space, realize virtual and real fusion, and provide a new visual experience and more efficient human–computer physical interactions. Figure 1 shows the design architecture covered in this paper. It includes two parts: Web service-based 3D geographic scene modelling and HoloDym3DGeoSce interaction design. The 3D geographic scene modelling based on Web services consists of a HoloDym3DGeoSce data layer and a HoloDym3DGeoSce 3D geographic scene modelling layer. The data layer provides geographic data for the modelling layer, and the 3D geographic scene modelling method provides 3D geographic scenes for HoloDym3DGeoSce. The HoloDym3DGeoSce interaction method enables human–computer interaction between the user and the holographic 3D geographic scene. In the following section, each part of the system is explained.

2.2. Web Service-Based 3D Geographic Scene Modelling

We created a 3D geographic scene with timely data (the data can be extracted 3D information) based on Web services [37], that is, we dynamically acquired the basic geographic and image data of the target area on-demand from the Web, and created a holographic 3D geographic scene by rendering the basic geographic data and integrating the image data through the Unity3D game engine [38]. Figure 2 shows a flow chart for creating a 3D geographic scene based on Web services. First, the OpenStreetMap 2D basic geographic data as the shapefile format with elevation information is obtained through the OverPass Application Programming Interface (API) [39]. The data are in Extensible Markup Language (XML) [40] format, and this format is then converted into a geographic information network shared data format, GeoJSON [41]. The GeoJSON API is used to generate a 3D mesh of the GeoJSON format OSM data by stretching the shapefile data with the elevation information. Finally, the same range of latitude and longitude information as the OSM data is transmitted to the Bing Map Server, and the corresponding satellite image is acquired based on the REST service [42]; the texture is formed and covered by a 3D mesh to create 3D geographic scenes. The following section is a detailed introduction of the HoloDym3DGeoSce data layer and of the HoloDym3DGeoSce modelling layer.

2.2.1. HoloDym3DGeoSce Data Layer

(1) Acquisition, analysis, and transformation of basic geographic data
The method for obtaining the basic geographic data is as shown in Appendix A. First, the Uniform Resource Locator (URL) [43] for accessing the OSM is defined. The URL is bound to the latitude and longitude range of the OSM data and to the data type (node, way, and relation), and an HttpClient object is then created to access the service in an asynchronous manner. After obtaining the OSM data through the service, the next step is to convert the OSM data in XML format into the GeoJSON format. GeoJSON is a JSON format for encoding various geographic data structures. JSON is similar to the XML format, but it is smaller, faster, and easier to parse than XML data. This format can be used to share geometric geographic data on the Web. The specific conversion process is shown in the following table.
(2) Obtain image data
Textures in 3D geographic scene modelling use satellite imagery, and the satellite image data were obtained from Bing Maps using its map image service (ImageryServices). By analyzing the geographic location (latitude and longitude) coordinates and the zoom level of the map, the service can provide complete map data metadata corresponding to the map image system, including a series of detailed parameters, such as image map address and image size. The interface of the service can also be reversed to generate different map images by specifying geographic location coordinates, map zoom levels, and image sizes (height and width). The client accesses the client configuration information (as shown in Appendix B) of the ImageryServices service. From the configuration information, the map image service address is: http://dev.virtualearth.net/webservices/v1/imageryservice/ImageryService.svc. The project can use this method in the map image service by adding the Web service reference. Appendix C shows the specific operation of adding the Web service reference to ImageryService and calling the service interface to obtain the satellite image data. In this case, the data returned include the geographic location (longitude: 97.1964042859709, latitude: 37.5939128813461) and map zoom level (which is 4). The map URL pointing to the map data of the corresponding map image system (Tile System), and the specific image effect corresponding to the URL can be viewed by executing the URL in a browser.

2.2.2. HoloDym3DGeoSce Modelling Layer

The development engine recommended by the official HoloLens website is Unity3D. Unity3D has a built-in Holotoolkit development kit for rapid development of mixed reality applications. Therefore, the HoloDym3DGeoSce modelling layer uses the Unity3D engine to render GeoJSON data. Unity3D draws basic geographic data in GeoJSON format and generates 3D grids, and consists mainly of three steps: First, the GeoJSON data are loaded into the memory; then, the data are parsed with Full Serializer [44]; and, finally, the points are drawn according to points, lines, and polygons. The most important operation is to draw the surface features because the generated mesh represents the characteristics of the polygon. The second step is to stretch the surface feature mesh according to its elevation attribute to generate a 3D mesh (3D building model); the third step is to obtain the image data as the texture of the 3D scene and retrieve the corresponding GeoJSON data by starting the REST API. Satellite imagery is used to load and generate the required material textures, assigning textures to 3D models to generate actual 3D building models.
(1) 3D mesh generation
After loading the GeoJSON data into memory, the geometric polygon feature data are transformed into a polygon mesh, and the polygon mesh is then stretched to generate a 3D mesh. GeoJSON represents different geometric objects as point sets with different latitudes and longitudes. It is necessary to construct polygon mesh data to generate 2D polygons. In this paper, the Triangulator [45] object is used to generate a triangulation polygon for the point data. The constructor parameter of the object is an array of Vector 2 points, which is indexed by calling the triangulator function of the triangulator object, and the grid is constructed using points and indexes. After the triangle mesh is generated, it is stretched to generate a 3D mesh. The method flow for 3D mesh generation is shown in Appendix D.
(2) Texture map
After the 3D model is generated, it needs to be textured to make it more realistic. As shown in Figure 3, 3D model texturing typically includes the following three steps:
(1) Texture data acquisition. This generally consists of two parts. The first part is to automatically generate texture data by defining texture generation functions. The second part is to acquire satellite image data of the corresponding area of the 3D model from the BingMap service. These two parts constitute the texture data.
(2) Defining the mapping function. This step refers to the mapping relationship between the image and the surface of the 3D model. The specific implementation steps are shown in Figure 4. First, the precise external orientation elements of the image are obtained, and the spatial position and image attitude of the image in the spatial coordinate system of the 3D model are calculated. The mapping relationships between the image space point (x, y) and the model space coordinates are determined; the image space point pixel value to the texture space point is then assigned, according to the mapping relationship between the texture space and the 3D model space, and the image texture can be realized as a 3D model.
(3) Anti-aliasing. Anti-aliasing is performed on the mapped data because the deformation step needs to resample the texture.
The 3D model with texture information is modelled by the above two steps. Figure 5 shows the generate a 3D model with texture based on Unity3D rendering GeoJSON data.

2.3. HoloDym3DGeoSce Interaction Method

The HoloDym3DGeoSce interaction method includes a human–computer physical interaction method and a human–computer virtual–real interaction method. The human–computer physical interaction method is used to achieve the interaction between the user and the holographic 3D geographic scene. Eye gaze, gesture, and voice control are adopted as the interfaces of the main human–computer physical interaction; the human–computer virtual–real interaction is the virtual–reality fusion between the virtual geographic scene and the physical world through spatial mapping. As shown in Figure 6, it is the main content of the interaction design, and the implementation method and process are described in detail below.

2.3.1. Gaze

Gaze, based on eye-tracking technology, is the first and fastest interaction method for HoloLens human–computer physical interaction input, similar to a desktop cursor, and is used to lock holographic object targets. The gaze design is shown in Figure 7. The HoloLens Inertial Measurement Unit (IMU) senses the user’s direction, and the four environmental-aware cameras sense the relative position of the user. The IMU and the vision camera can be used to locate the user’s position and direction. This information confirms the starting point and direction of the user’s gaze based on the position and orientation of the user, forming a physical ray having a position and direction; this physical ray intersects with the spatial mapping grid corresponding to the holographic image in the holographic application, and if intersected, the intersection result contains the spatial location of the collision point and collision object information to determine the virtual or real world object that the user may be viewing. If they do not intersect, the gaze cursor disappears.
In addition to the design features, the gaze needs to consider stability. The gaze stability design is mainly to stabilize the user’s line of sight by an iterative gaze ray (Raycast) data sample, to achieve accurate and stable acquisition of the object, so that the user does not introduce gaze-positioning instability due to slight head shaking. The concept of gaze stability design is to calculate the mean and standard deviation of the gaze position and direction using a certain number of Raycast samples. Then, two of these values are used as a standard to compare the average and standard deviation of the gaze position and direction when the user uses the gaze input. If it is lower than the standard value, linear interpolation of the position and direction is used to create the position and direction of the gaze ray and to make it stable; otherwise, stabilizing is stopped, and the position and direction of the gaze ray are updated. Figure 8 is a flow chart of gaze stability design, as shown below.

2.3.2. Gestures

When gazing at a holographic object or a real-world object, the next step is to achieve deeper and substantial interaction with the object through gestures. This is achieved by interacting with the holographic image by tracking and by capturing the input gesture. Gesture-tracking capture is defined as different gestures (e.g., air-taps, navigation gestures, manipulation gestures, etc.) according to the position and state of the user’s hand, that is, the system needs to recognize and determine different gestures. The gesture response is based on the gestures determined by the system, such as clicking and double-clicking through air-tap, using a navigation gesture to rotate the hologram, and a manipulation gesture to control the movement of the hologram. Gesture recognition belongs to the category of computer vision and artificial intelligence. To speed up the development process, this article uses the HoloLens built-in HoloToolkit development kit, which is divided into the underlying API and advanced API according to different development requirements. The advanced API recognizes gestures (including clicking, double-clicking, long-pressing, and panning) by creating a system-predefined gesture recognizer. This development is simple, but it is not convenient to customize the gesture function. The underlying API can obtain lower-level information, such as the position and speed of the user’s hand, making it convenient for the user to customize the gesture function. The following describes the design principle and specific implementation flow of the underlying gesture recognition API.
The underlying API is used to obtain more detailed information about the input gesture source, such as the position and speed of the gesture in the physical world, whether the user is staring at the target when the gesture event occurs, whether the gesture source is in a click state, and the ID and type of the gesture source. The gesture interactions are designed through the underlying API involving two steps. The first is to register the underlying gesture events, and the second is to design a callback method that handles the underlying interaction events and to execute the callback method when the event is triggered. As shown in Appendix E, the gesture input source includes five kinds of changed events, namely, PressPressed, SourceReleased, SourceDetected, SourceLost, and SourceUpdated. Gesture events describe five different states of the gesture source. SourceDetected event (gesture function is about to be activated), SourceLost (gesture function is about to be deactivated), SourceUpdated (gesture is moving or some state is changing), SourcePressed (gesture click, button press), and SourceReleased (gesture click end, button release, the voice is selected to end).

2.3.3. Voice Control

Voice control refers to the use of natural language control applications to improve traditional complex interactions by freeing hands. Voice control initiates the corresponding behavior by defining keywords or phrases for the application. When the user says a keyword or a phrase, a preset action is executed. The first step in voice development is to activate the voice message recording function, record the voice through the microphone input, and set the feedback mechanism to the user. Voice development has three parts: Keyword recognition, grammar recognition, and voice dictation. Because this article mainly uses dictation recognition, the following introduces the method and flow of dictation recognition. Dictation recognition converts the user’s voice information into text information and provides it to the user. Instead of being manually input by the user, the user can determine whether it is the input voice information according to the text information given by the system, and then determine whether to upload the information according to its accuracy. The process of dictation recognition is to first create a dictation recognizer dictation object (DictationRecognizer), which is used to monitor and realize the conversion of speech into text. Dictation recognition is a process involving the understanding of the dictation recognizer, understanding the result, identifying the error, and so on. Therefore, events and corresponding callback methods need to be defined for the process. The dictation identification key codes of the methods are shown in Appendix F.

2.3.4. Spatial Mapping

Spatial mapping maps virtual digital geographic scenes to physical space surfaces for precise virtual and real fusion. The difference between spatial mapping and gaze, gesture, and voice interaction is that gaze, gesture, and voice are based on human–computer physical interaction, while spatial mapping belongs to virtual and real interaction, accomplishing the interaction between the holographic geographic scene and the physical space surface. The design and implementation of spatial mapping includes two steps: Physical space modelling and geographic scene mapping. Physical space modelling is the scanning of the target environment and construction of a physical network by building and retrieving a triangulation network. This is one of the indicators for distinguishing between MR and AR. Is it possible to have a 3D depth of field camera? Automatic 3D modelling: Mapping of geographic scenes places the geographical scene on the surface of the physical space. Before this placement, it is necessary to calculate whether the physical space can accommodate the geographical scene and whether the physical space surface placement is smooth, and if precise integration can be achieved. The HoloLens Holotoolkit development kit provides space-mapping components, a spatial mapping underlying API, and a deeper spatial mapping (SpatialUnderstanding) library [46]) to develop spatial mapping. The MixedRealityToolkit provides the space-mapping component, and the program can quickly and conveniently acquire the capability of spatial mapping;
The underlying API for spatial mapping provides complete control over the underlying features of spatial mapping and supports more complex spatial mapping customization functions. The SpatialUnderstanding library can be used to achieve a deeper understanding of the physical space environment, obtain additional environmental information, and better implement spatial mapping features. The following section introduces the implementation method and the principle of grid analysis (SpatialUnderstanding library). Mapping holographic geographic scenes to the physical world requires deeper environmental awareness and understanding to determine the optimal placement of geographic scenes. This process usually requires the program to obtain detailed environmental information of the physical space and can automatically identify room structure information, such as floors, ceilings, and walls. SpatialUnderstanding provides a higher level of grid analysis that encapsulates a room solver that quickly finds empty areas on the walls, maps holographic geography to the ceiling, and identifies placed room structures and location information as well as other spatial queries. The module exposes three main interfaces for spatial surface topologies and spatial queries for the detection of target shapes, and for the constraint-based object set placement solvers. The specific steps for developing a spatial map based on the SpatialUnderstanding API are as follows:
(1)
The room space data is scanned through the HoloLens depth camera. The RequestBeginScanning function in the SpatialUnderstanding API starts the scan, the RequestFinishScan function ends the scan, and the ScanStates function describes the scan process, which encapsulates the scan progress and status information.
(2)
The spatial surface topology and spatial query interface (SpatialUnderstandingDllTopology) are accessed; this script calculates and encapsulates the information of the current room environment based on the scan data topology. The topology information of the environment is stored in the PlaySpaceInfos structure, where the structure contains the wall, the ground position, the ceiling location, and other information.
(3)
The spatial shape query interface (SpaitalUndstandingDllShapes) is accessed according to the topological analysis results of the above surface, and each parameter is specified to query an object of a certain shape, and its place in the environment that matches the parameters.
(4)
The object’s placement solver interface (SpatialUnderstandingObjectPlacement) is accessed. To place the object at the specified location, after scanning and finalizing the room, tags are internally generated for object placement solvers for surfaces, such as floors, ceilings, and walls.

3. HoloDym3DGeoSce Experiments

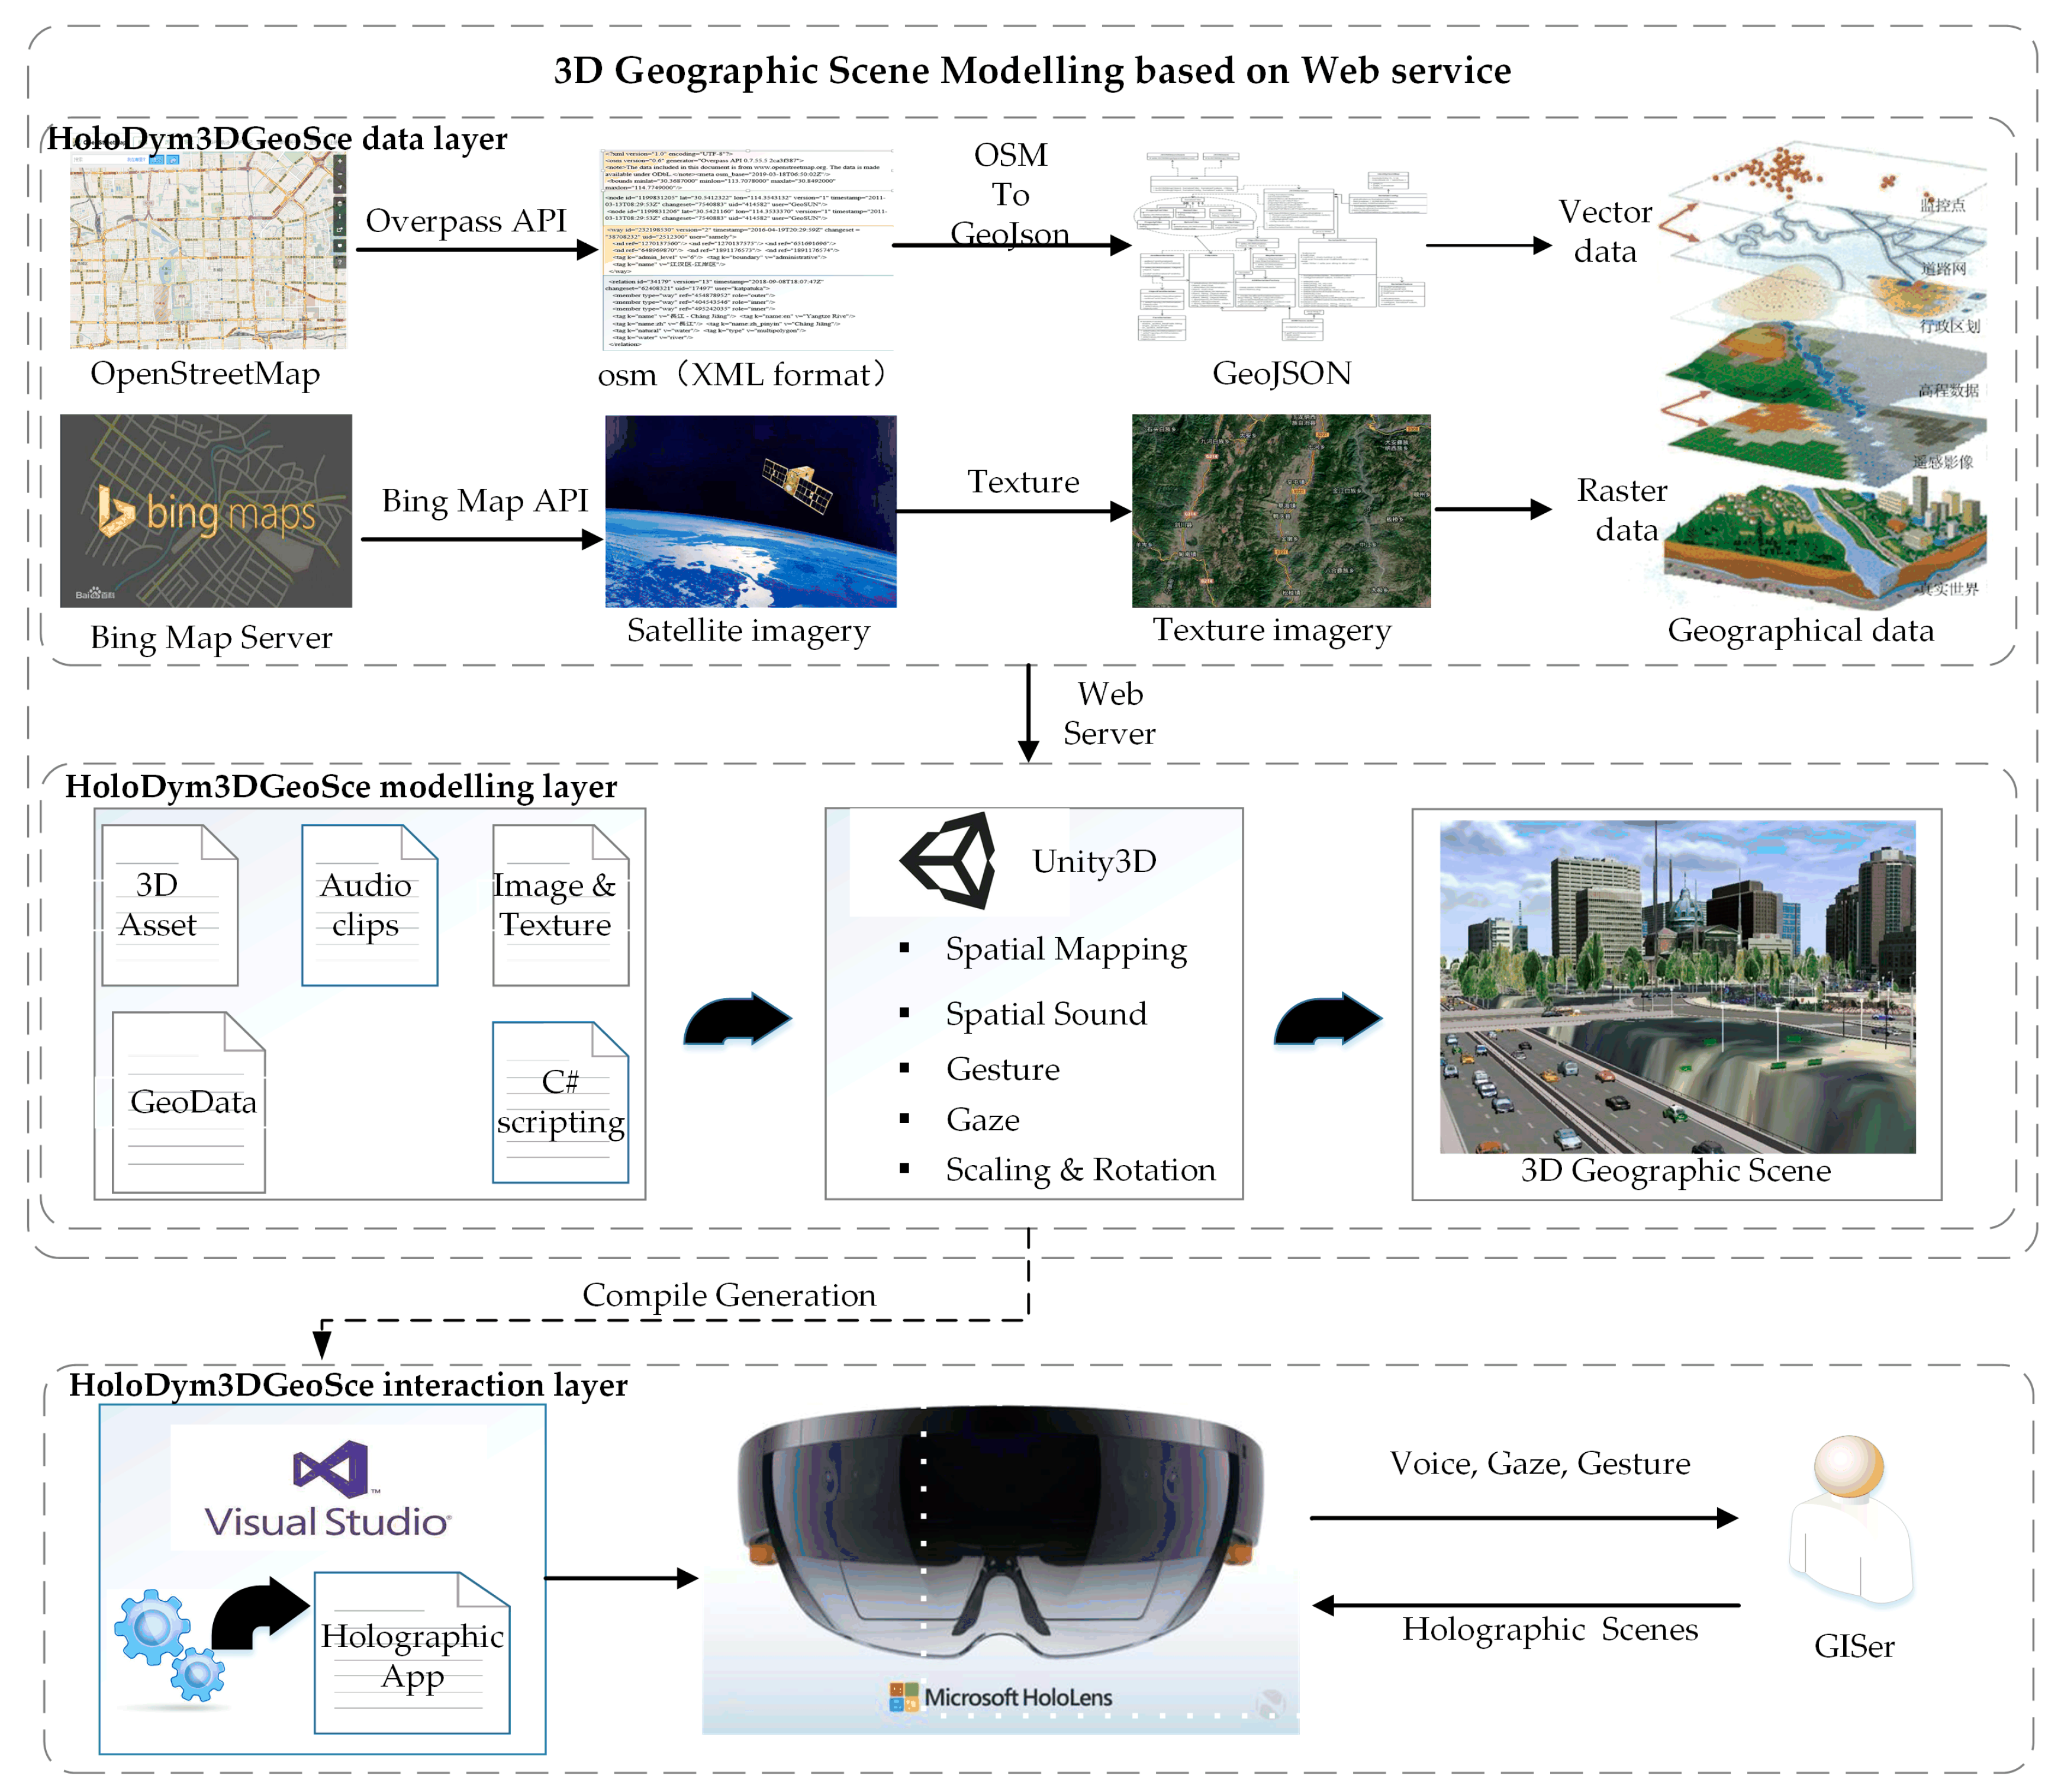
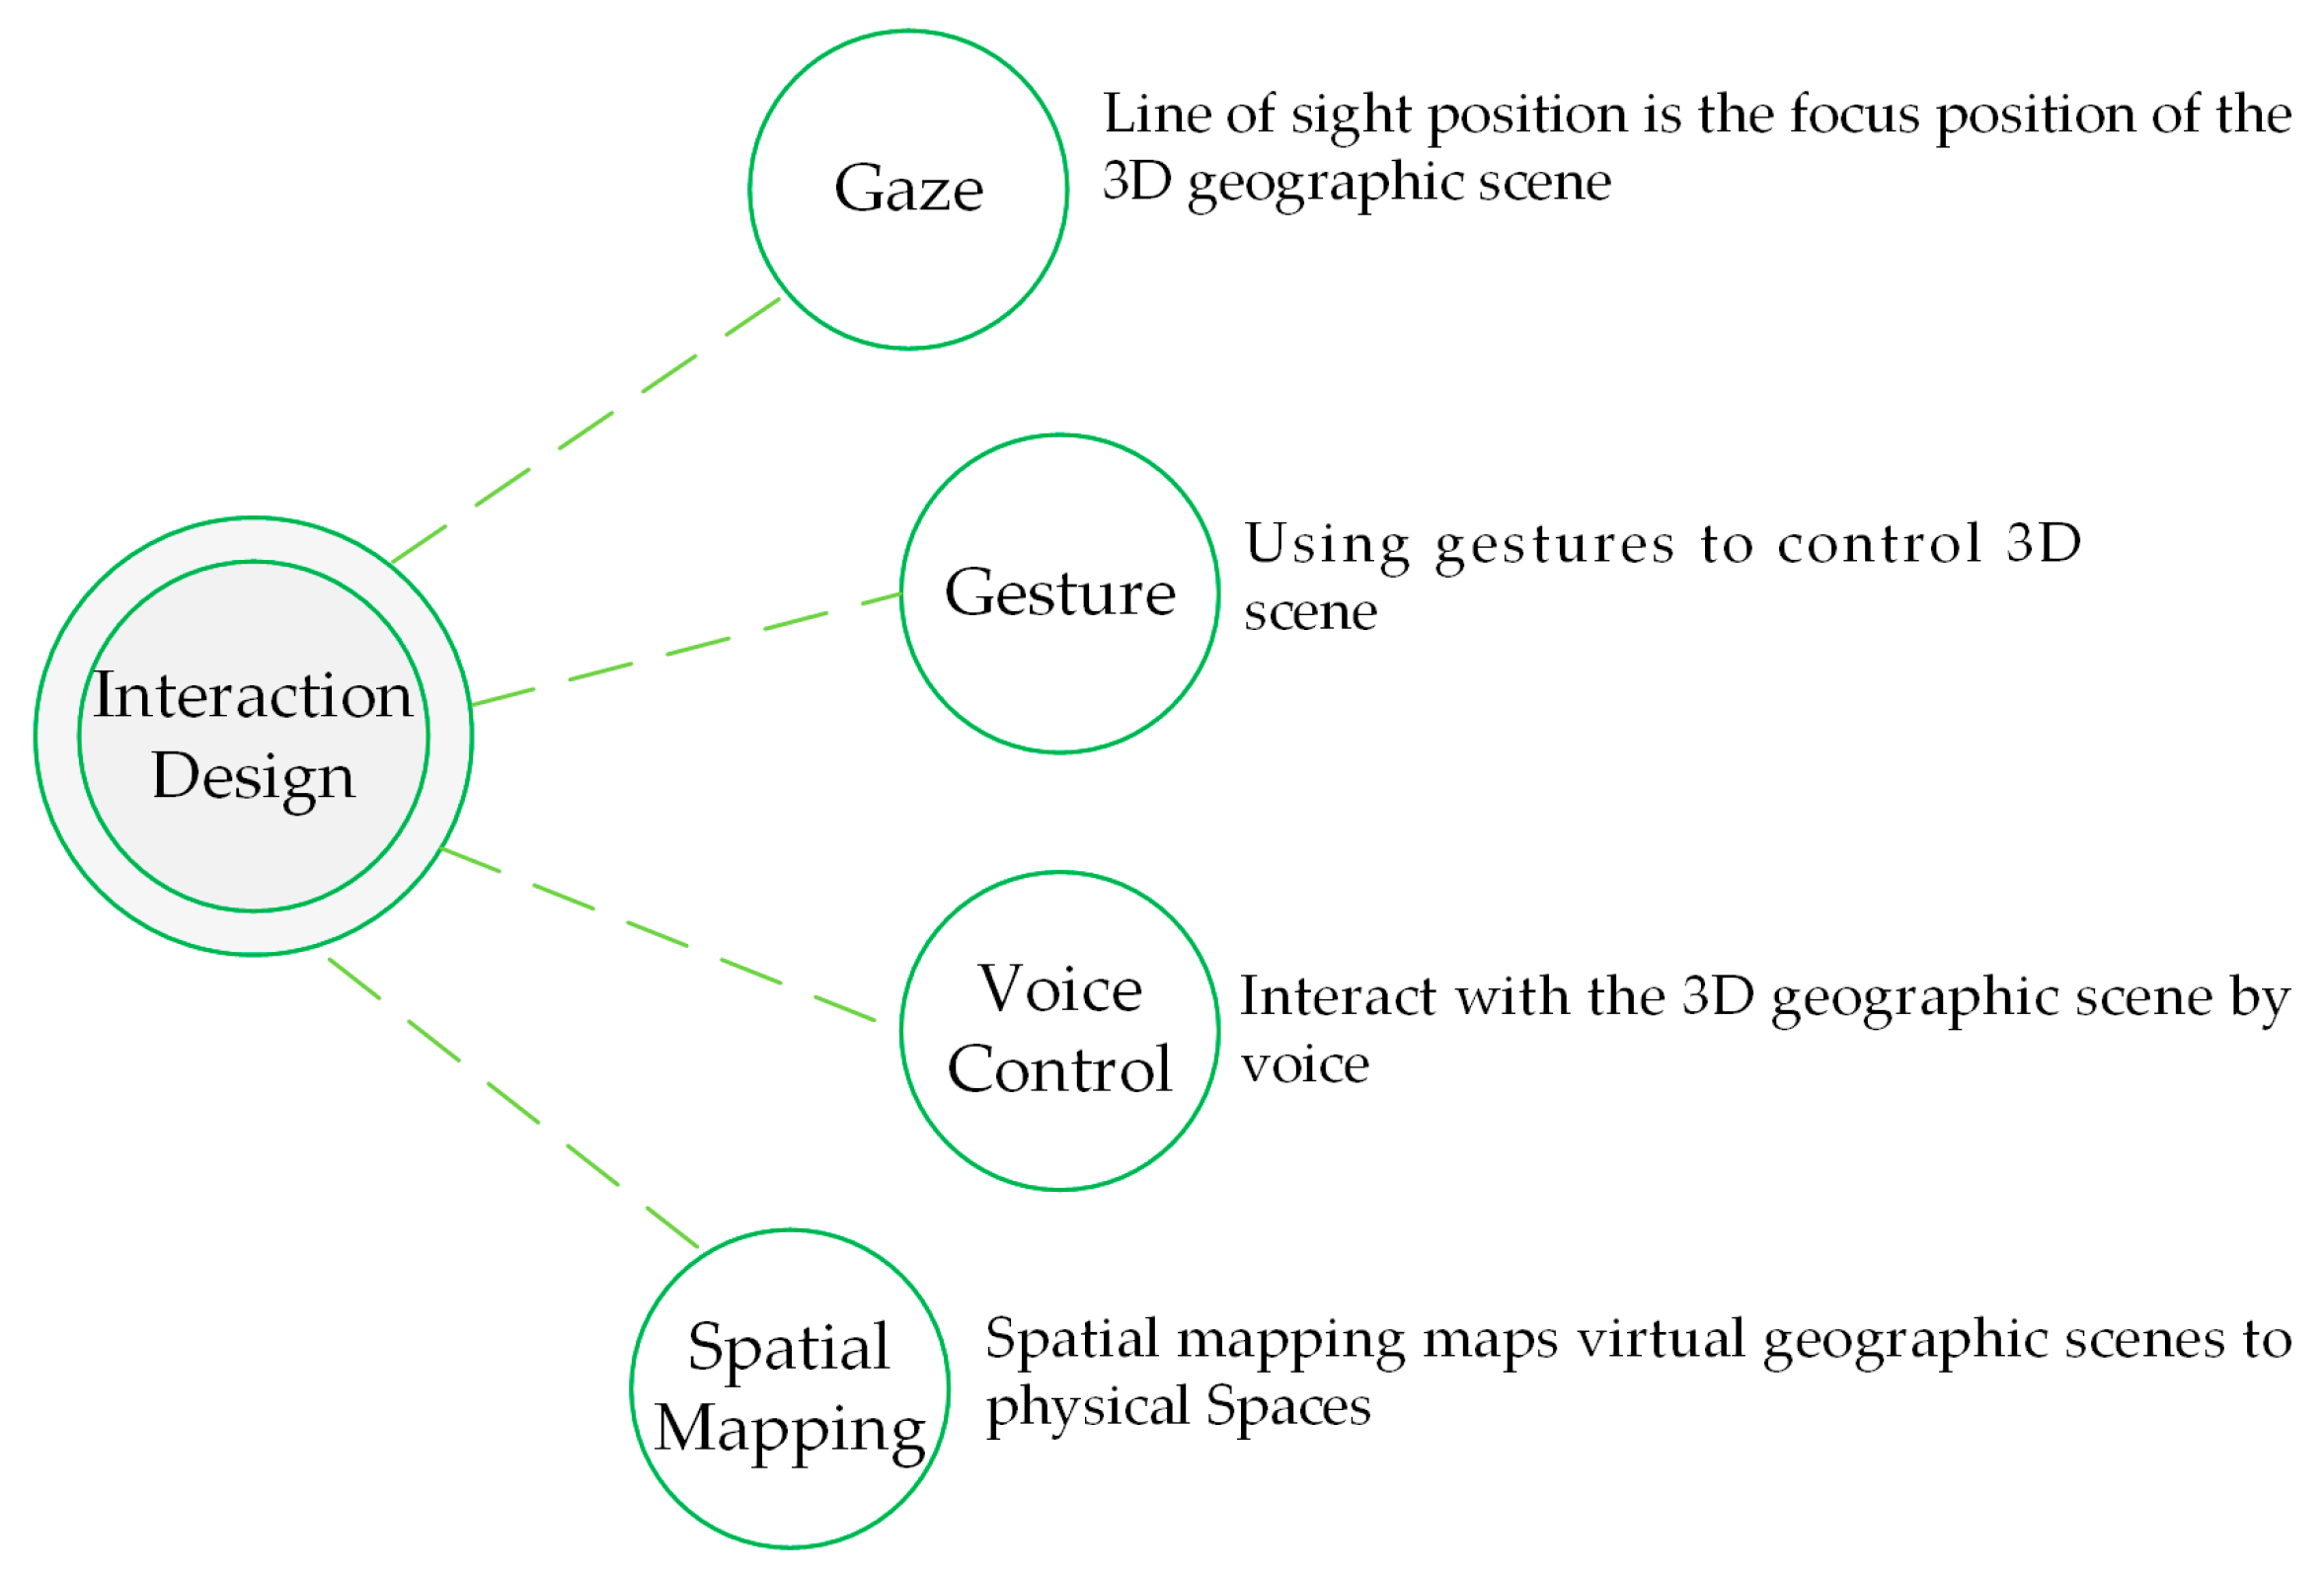
According to the framework and method proposed above, this paper designed an experimental scheme based on holographic glasses, the HoloLens, to model and render 3D geographic scenes with timely data. This scheme was developed using the HoloDym3DGeoSce app. The experiment mainly uses GIS technology, Web service technology, and mixed reality as well as other technologies. The above technologies were implemented by OpenStreetMap, BingMap Server, Unity3D, and the HoloLens platform. The specific objectives and contents of the experiment were as follows: (1) Virtual reality fusion: Virtual geographic scenes are brought from the computer screen into the real world and map a virtual 3D digital city to the actual world through spatial mapping technology; (2) 3D GIS new human–computer physical interaction mode: The traditional 3D GIS mouse-based and keyboard-based human–computer interaction mode is changed and manipulation of holographic 3D geographic scenes is accomplished by means of gaze, gestures, and voice; (3) modelling holographic geography scenes with timely data: The geographic scene model is dynamically loaded through the Web service and textures are applied to the model to create a more realistic and dynamic 3D geographic scene in the real world; and (4) dynamic holographic geographic scene performance analysis and problems: The problems of this method are analyzed. The overall goal was to solve the problem of geographic information visualization provided by a traditional 3D GIS 2D screen by using HoloLens 3D stereo display technology, to bring users a new true 3D visual experience.

3.1. Experimental Preparation

The experimental preparation mainly includes three parts: Data, software, and hardware. Among these, the data are the basic content of the experiment. The software is used to develop, debug, and deploy the HoloDym3DGeoSce system. The hardware provides a platform for running, computing, and 3D rendering the visualization for the HoloDym3DGeoSce system.
Data: OpenStreetMap [35], BingMap Server map data and image data [36].
Software: Unity3D 5.4.0f3 (the main engine developed by HoloDym3DGeoSce), Visual Studio Community 2015 (application development, compilation and deployment platform), and Win10 Professional Edition (HoloLens development requires Windows 10 Professional, Enterprise and Education).
Hardware: Microsoft HoloLens Developer Edition, PC (Dell, Intel (R) Xeon (R) CPU E3-1220 v3 @ 3.10 GHz (4 CPUs), ~3.1 GHz).

3.2. Experimental Results and Analysis

This experiment developed the HoloDym3DGeoSce system, which achieves mapping of 3D geographic scenes to the physical world, providing users with holographic 3D geographic scenes, and bringing users a new 3D GIS human–computer interaction. HoloDym3DGeoSce users need to wear HoloLens glasses to obtain holographic geographic scene images from a first-person perspective. To obtain experimental results, the HoloDym3DGeoSce application holographic view of the user’s first-person view is projected onto a computer screen to form a video stream by using the Mixed Reality Capture system in HoloLens Device Portal. All results in this article are from the video stream captured by the Mixed Reality Capture system. Because the Mixed Reality Capture system uses a 2-megapixel RGB (Red-Green-Blue) camera, there is no effect based on the first-person perspective of the HoloLens glasses. Therefore, the spatial mapping result graphs and the holographic geographic scene result graphs in the experiment simultaneously capture the real physical world and the holographic image.

3.2.1. Dynamic Holographic Geographic Scenario

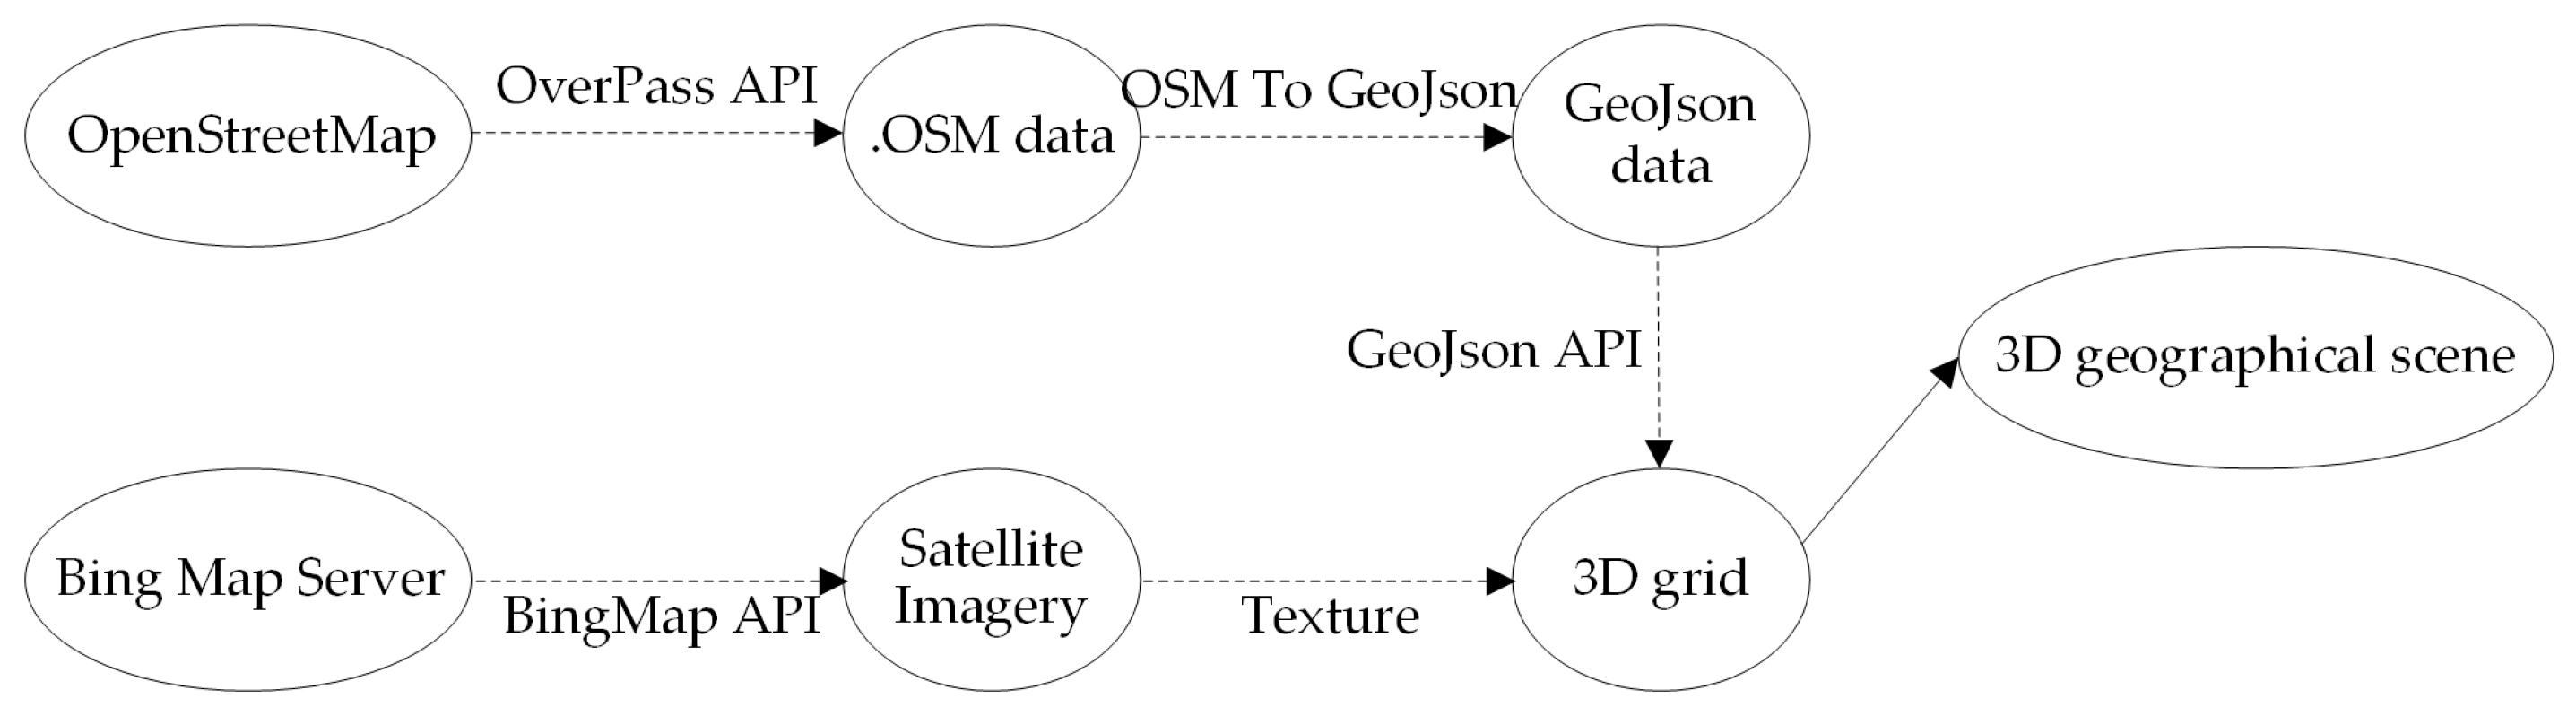
A dynamic holographic geographic scenario is a geographical scenario created by dynamically loading geographic data through a Web service. In this experiment, according to the method of Section 2.1, for Web-based service 3D geographic scene creations, the user accomplishes switching of the target area by acquiring the geographic scene of the target area on demand by using the HoloLens holographic glasses.
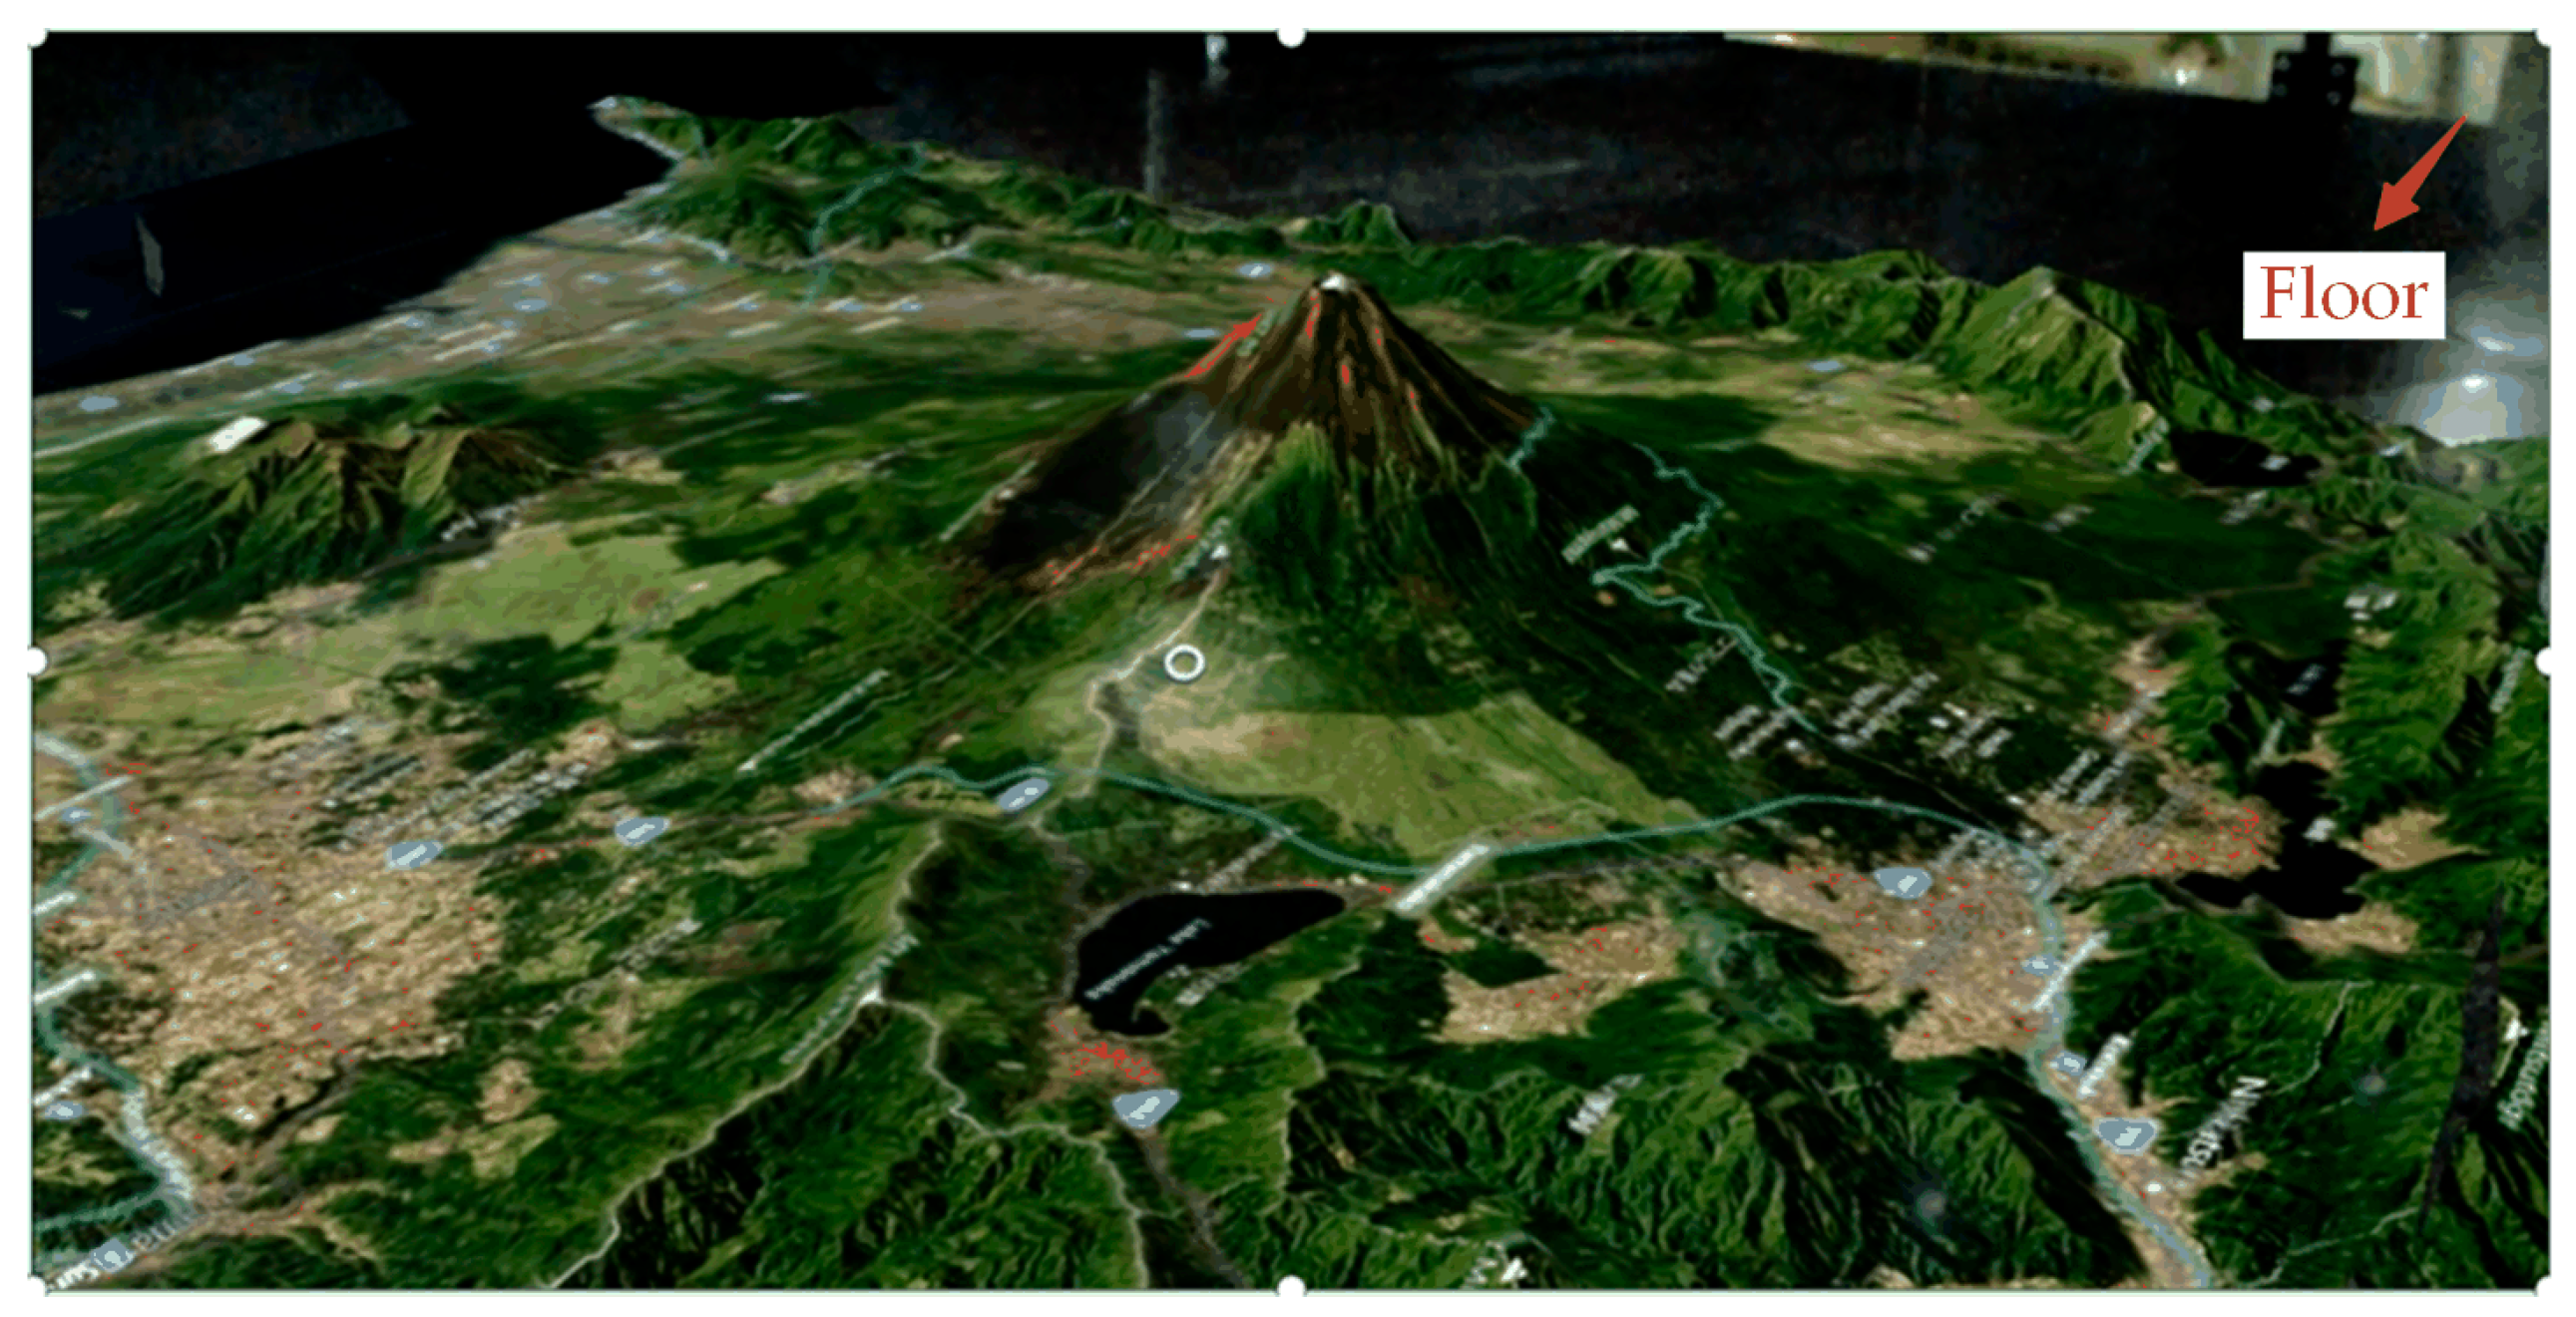
 Figure 9 and Figure 10 are schematic diagrams of a holographic geographic scene dynamically projected onto the floor, where the red arrow points to the physical floor and the floor is a virtual geographic scene, and the two are spatially mapped to achieve virtual and real fusion. 
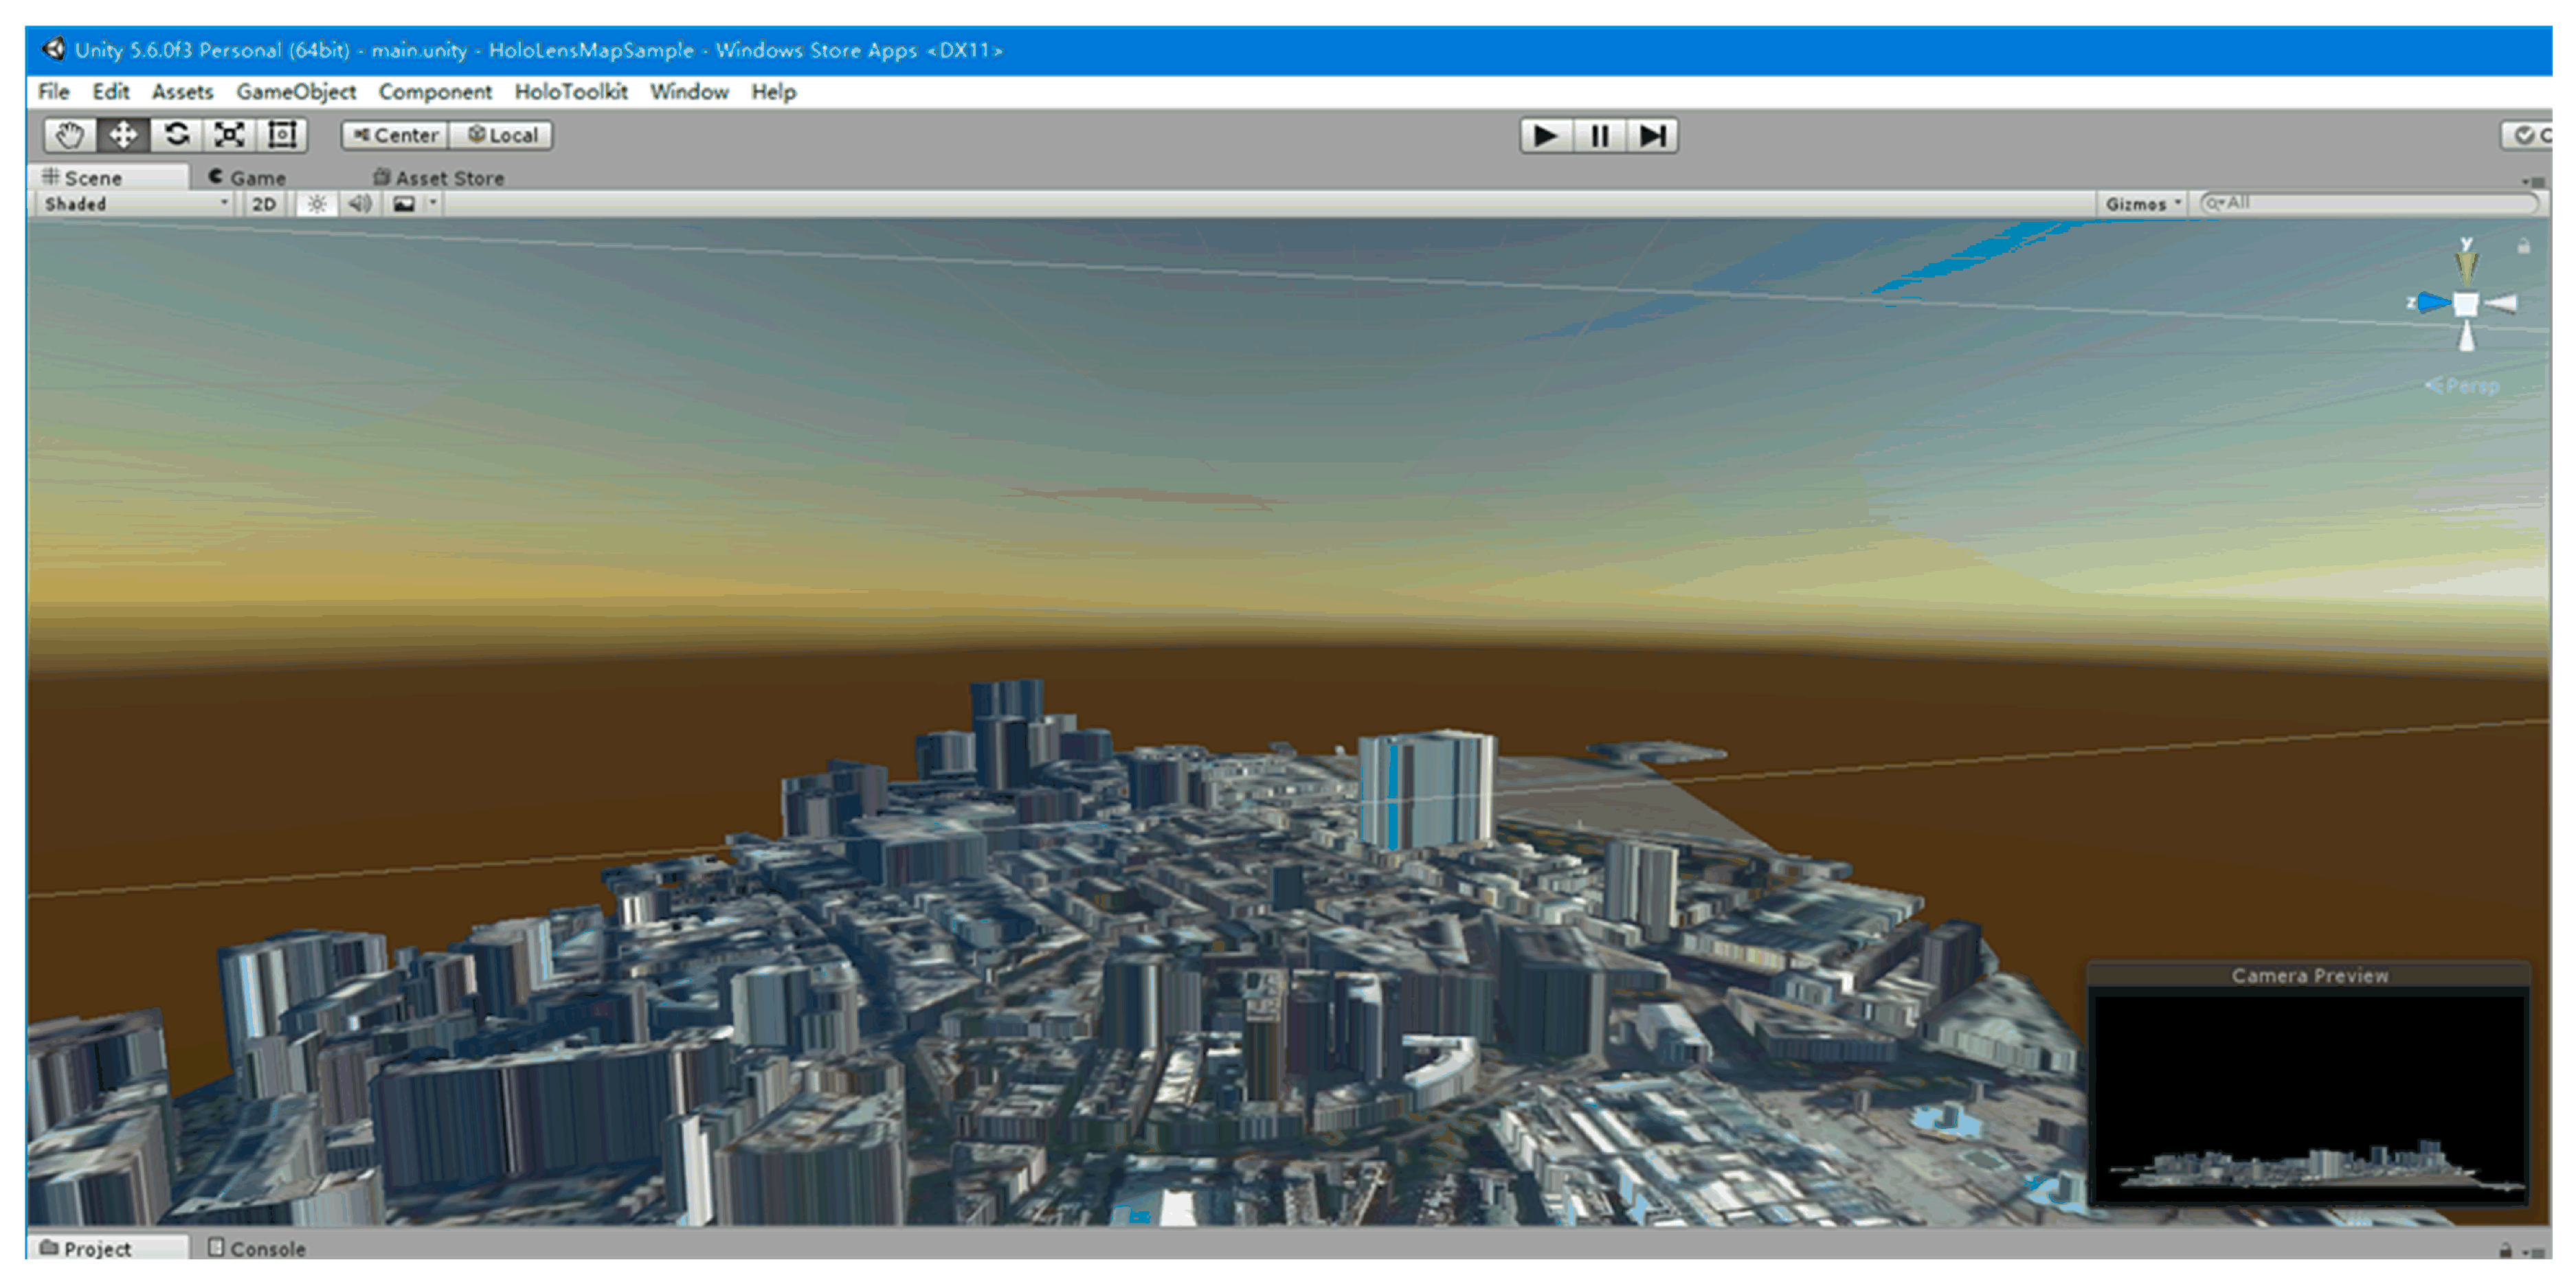
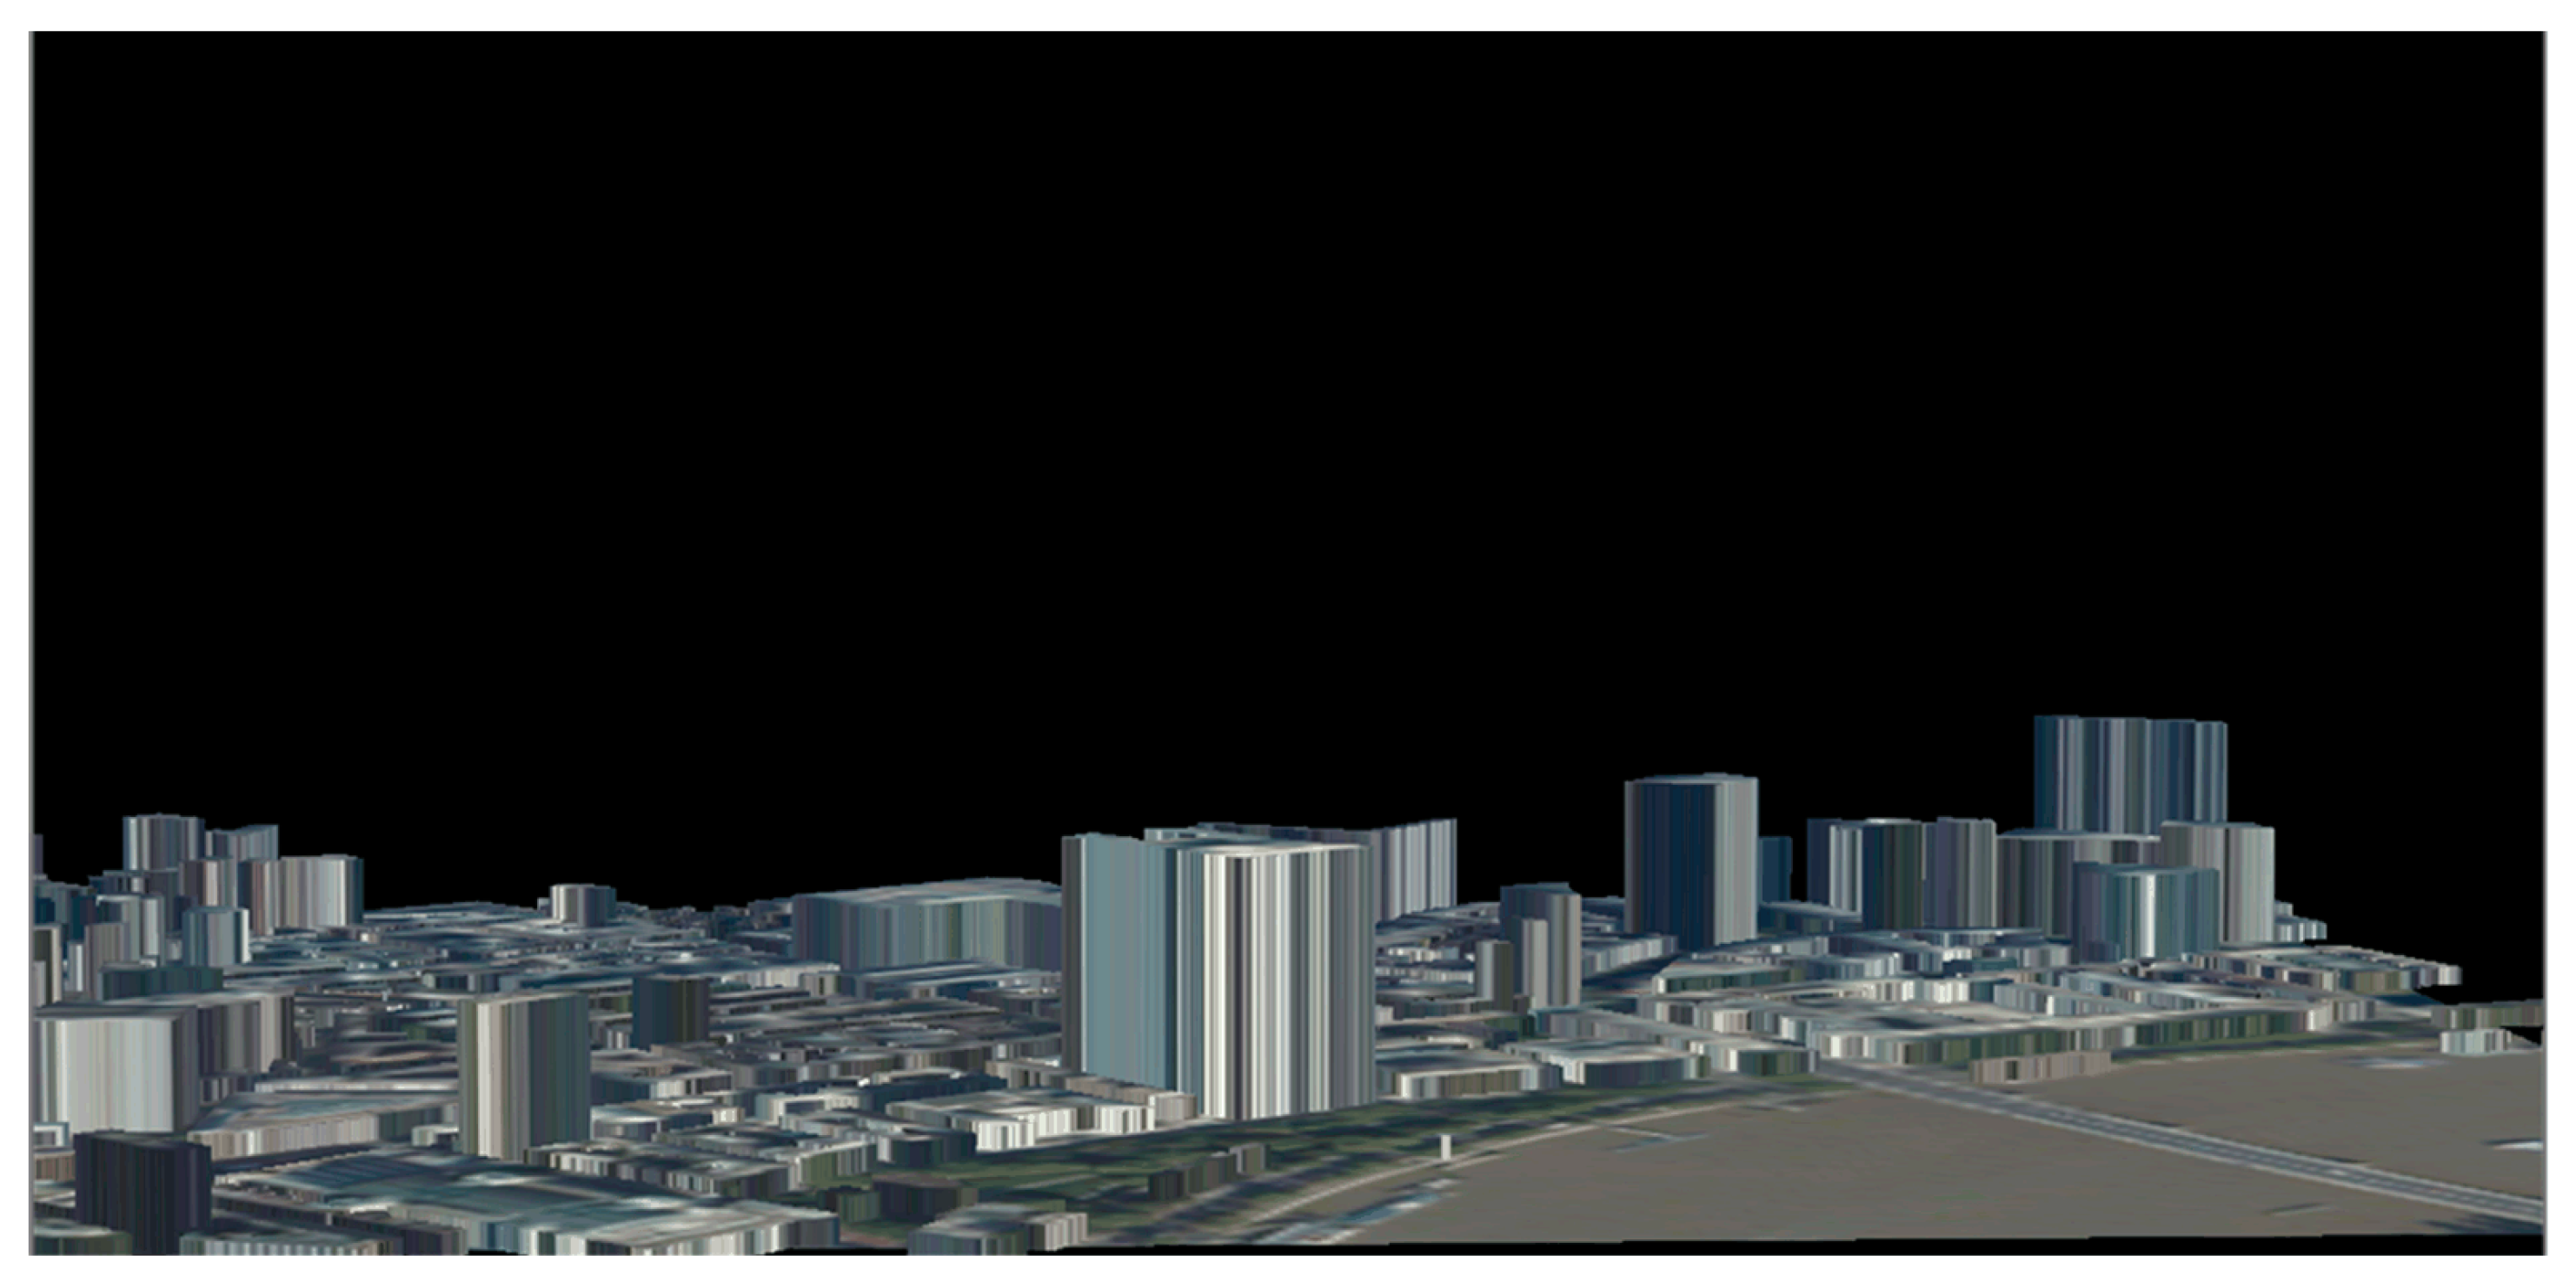
Figure 11 is a schematic diagram of a 3D digital city dynamically created by the HoloLens Emulator. The Emulator is a HoloLens virtual machine. In the absence of a HoloLens device, an Emulator can be used instead of completing the experiment. Static holographic 3D geographic scenes can only load pre-created 3D geographic scenes. The creation of a holographic geographic scene is based on user input of a target location, and scene switching is implemented through network loading. As shown in Figure 9, this experiment designed two kinds of human–computer physical interaction modes, voice control and manual input, to allow the input of position information. Manual input means that the user can transfer the text information of the target area to the HoloLens application through a virtual keyboard provided by HoloLens and convert the position information into latitude and longitude through geo-inverse coding, thereby realizing the positioning, data acquisition, and 3D scene modelling of the target area.
Voice control is a component of the Dictation Recognizer, as discussed in Section 2.3.3. The dictation of the user’s voice information is converted into text information, and the dictation result is presented to the user. If the dictation result is information that the user wishes to input, it is submitted to achieve positioning; if the voice recognition is incorrect, the dictation results can be changed by re-entering the voice message or in a manual fashion. As shown in Figure 9, when the voice mark is red, the system begins to monitor the user’s voice input information, and the dictation result is automatically updated in the input box of the virtual keyboard. Voice control is essentially the same as manual input. The former is more convenient and faster, but the recognition accuracy is not high. In this experiment, two states are designed by holographic geographic scenes created by human–computer physical interaction positioning and data acquisition. The first holographic geographic scene is user-centered and dynamically moves and updates geographic scenes in the physical space as the user moves beyond a set distance. The second state is a fixed geographical scene; the holographic geographic scene is locked in the physical space, and its position does not move and change. The user can observe the holographic scene from different perspectives by moving his position and experience depth and perspective information.

3.2.2. Analysis and Problems of Holographic Geographic Scenes

As shown in 
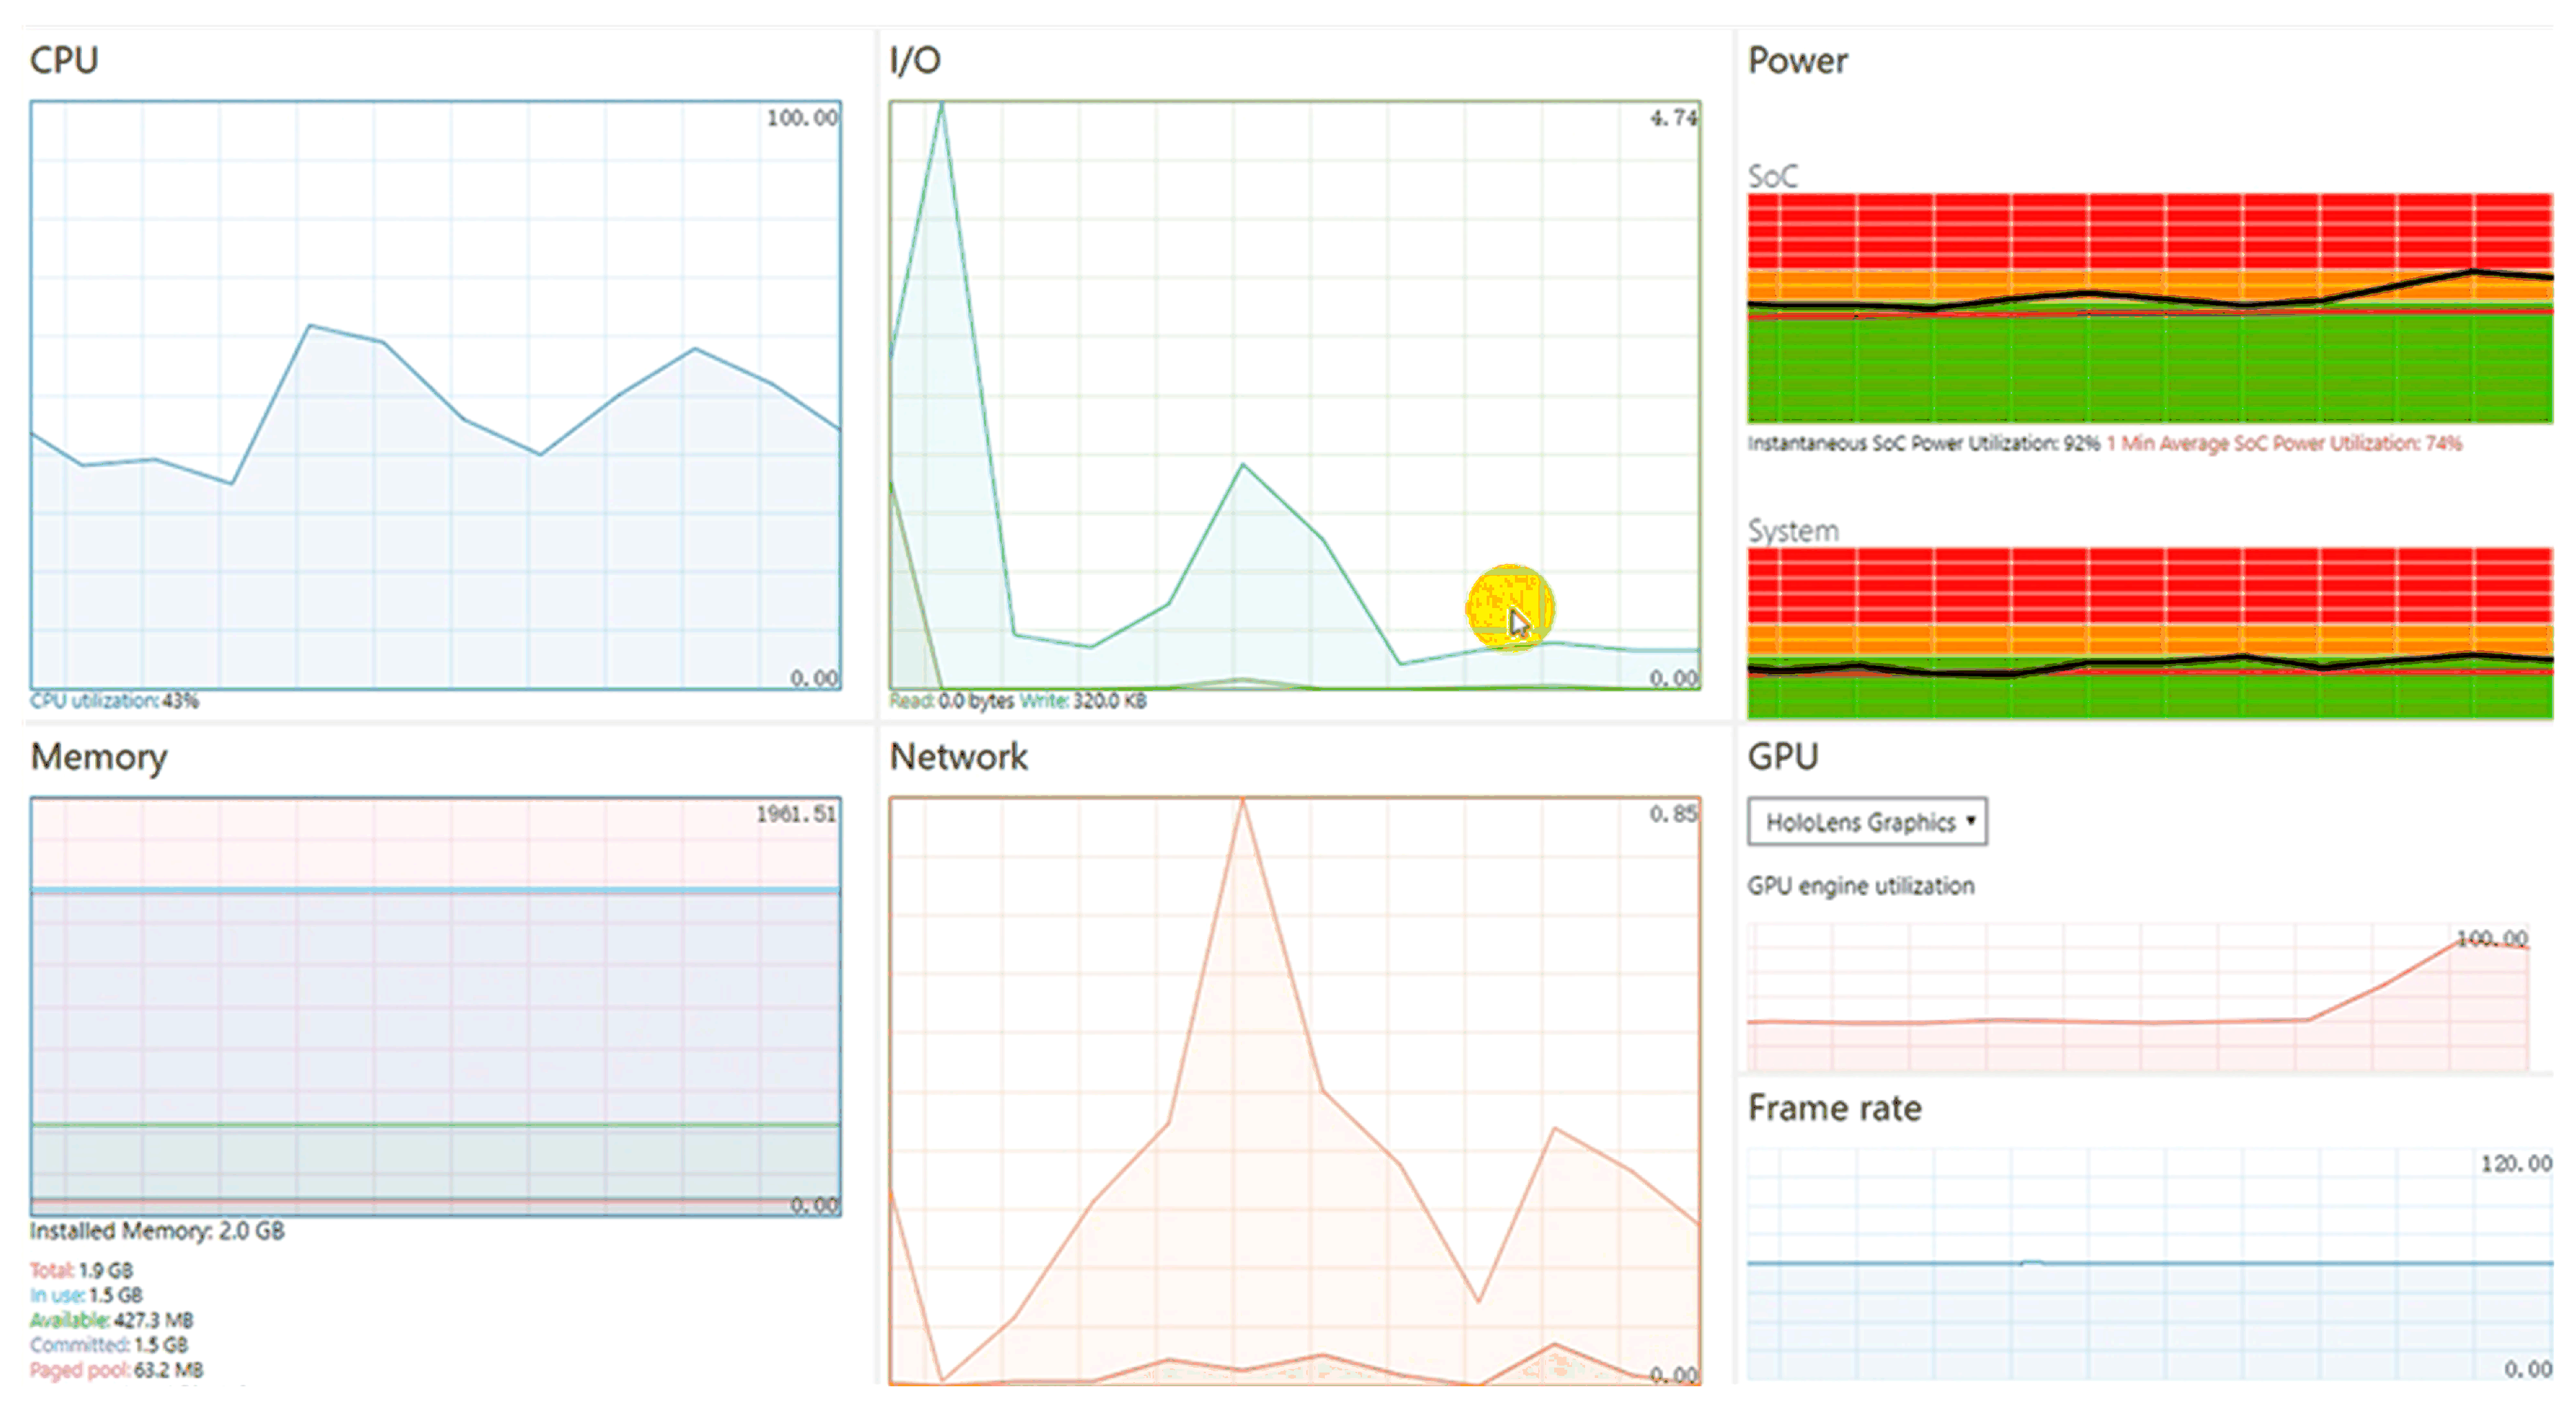
Figure 12, performance graphs based on the dynamic holographic geography of the Web service were created. The data are organized in this paper. The results are shown in Table 1. As it can be seen from the chart, HoloLens uses 0 Mb, I/O throughput is 0 MB, GPU usage is 40%, and CPU usage is 20% before the geographic scene is created. When the geographical scene starts to be created, the network usage rises to 0.85 Mb, I/O throughput rises to 4.74 MB, GPU utilization increases to 90%, and CPU usage increases to 43%. From this data, it can be determined that the dynamic creation of geographic scenes creates the greatest network and GPU demand, so a good network environment and high-performance GPUs are crucial for this experiment. In addition, it can be seen from the figure that the increases in the usage rates of the network, I/O, and GPU are delayed, mainly because the data are first loaded through the network, the data are then loaded into the memory, and the GPU finally renders the data. As seen from the experimental results in Section 3.2.1 and in the performance graph in Figure 12, it is feasible for HoloLens to dynamically create a 3D geographic scenario based on Web services.
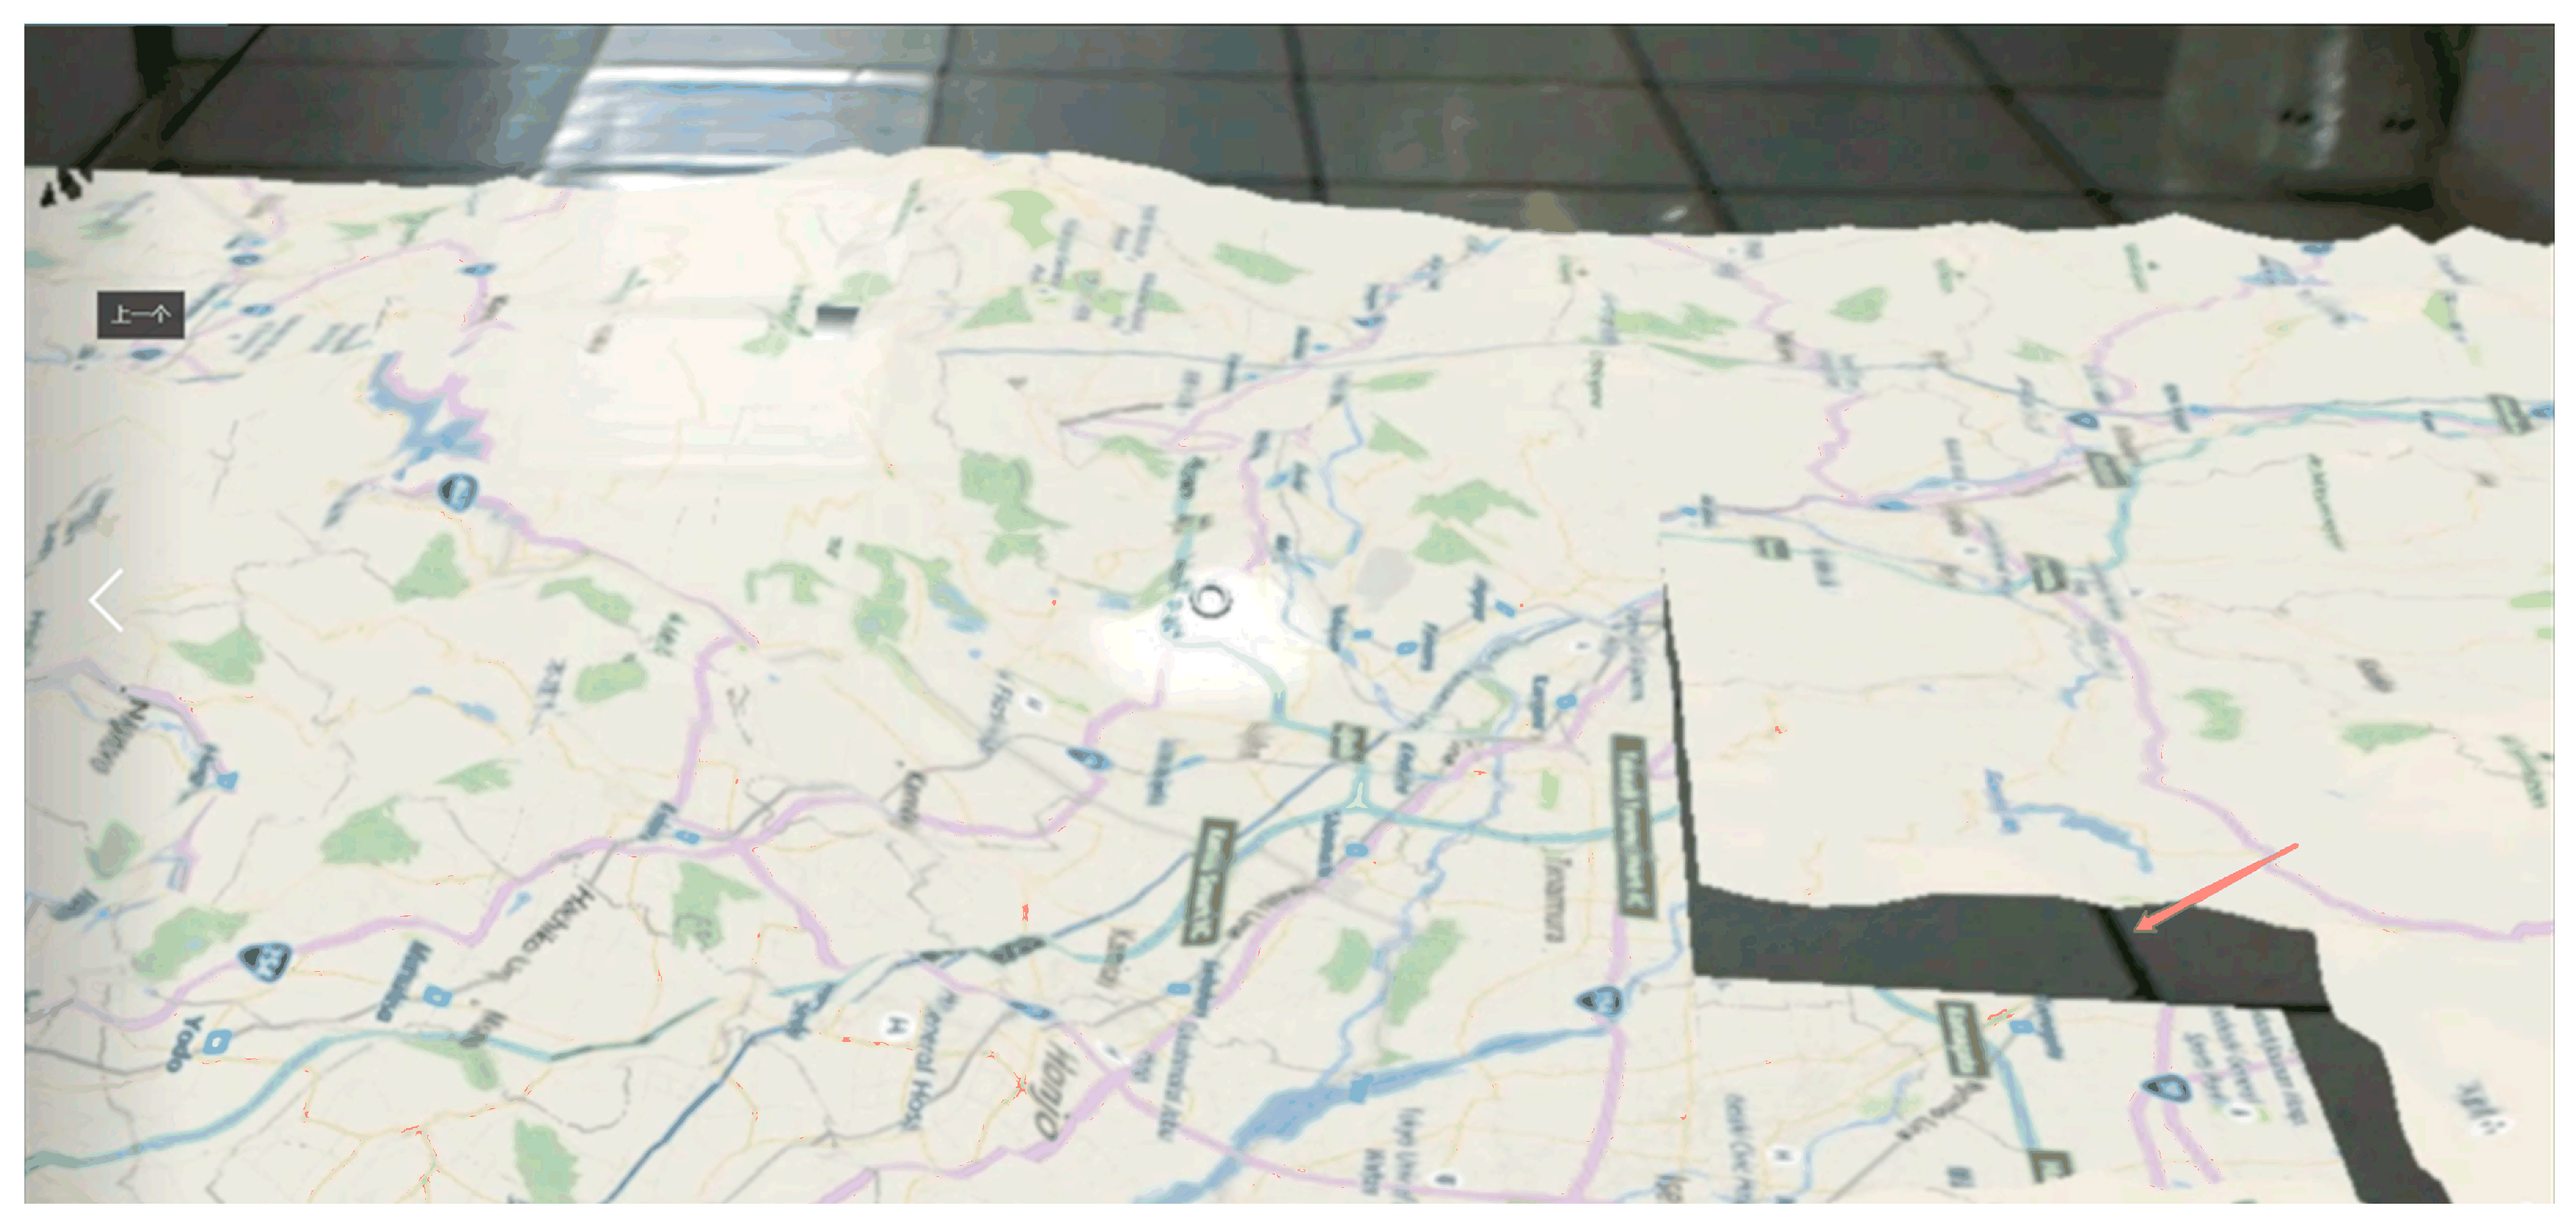
Although it is possible to dynamically create a geographic scene through the network, there are some problems. As shown in Figure 13, the main problem relates to the OpenStreetMap map data loaded by HoloLens through the network. The red mark in the figure indicates the missing portion of the map data. The missing data is due to data transmission failure during the process of loading data over the network. On the other hand, real-time data rendering has high requirements for hardware performance. Currently, the HoloLens developer version used in this experiment does not meet this requirement very well.

3.2.3. Human Computer Interact Test

To show the users’ experience with the HoloDym3DGeoSce application, an un-strict human computer interact (HCI) Test was done. The tasks of the test were to see the 3D digital city scenario described in Section 3.2.2. Ten people were selected as shown in Table 2. The evaluation index system with six indexes as visual clarity (the clarity of the three-dimensional picture presented by the system), system efficiency (the smoothness of the picture presented by the system), easy learning (how easy is the system to use under the instructions of professionals), interoperability (how easy is the system to operate through human–computer interaction), comfort (the visual and stress comfort of people when use the system with a headset), and flexibility (display the required scale of three-dimensional picture according to the user’s needs) adopted by [5] was followed. Each index was evaluated with a score by a number among 1 to 10. The number of the scores indicated the degree of satisfaction, where 1 was the worst and 10 was the best. The testers gave the score according to the satisfaction of each index. The scores were asked by the author according to the six indexes. The test results are shown in Table 2. From the results, we can see that all six indexes have high scores (four in indexes are 10, one index is 9.8, and one index is 9.7). The results demonstrate that the HoloDym3DGeoSce gives users a very good experience. However, the old man and the old woman said the system could not catch what they said occasionally. This may be caused by the voice function of the HoloLens, which is not powerful enough to handle the local accent. Also, the old woman and the schoolchild felt the HoloLens headset was a bit heavy when they wore the device for a long time. These two problems need further improvements.

3.2.4. Brief Comparisons with Previous Studies

The work of this paper furthers the previous work, and the work has inherited the advantages of the previous work compared with traditional 3D GIS, such as: It changes the vision, body sense, and interaction mode of traditional GIS, and enables GIS users to experience real 3D GIS [5]. With the development of information technologies and sensor technologies, timely geographic information is acquired by omnipresent space-based sensors, air-borne sensors, underground sensors, and human observers [47]. Thus, geographic information and its services become real-time, dynamic, and online [48]. GIS has evolved to real-time GIS from the perspective of time [49,50]. The previous work studied the visualization of 3D geographic scenes with prepared models based on HoloLens glasses, and the model could not flexibly change with timely data. In the era of real-time GIS, this will limit the applications of the previous work. The work of this paper tried to overcome the shortages of the previous work, and proposed an approach of modelling and visualizing holographic 3D geographic scenes with timely data. From this point, the work is meaningful and makes a great improvement compared with the previous work.

4. Summary and Outlook

This paper mainly described the design architecture of modelling and visualizing 3D geographic scenes with timely data through mixed reality glasses, the HoloLens, with natural human–computer physical interactions (e.g., gaze, gesture, voice). This design architecture was based mainly on three methods: The 3D geographic scene modelling method, the HoloDym3DGeoSce interaction method, and the size scene visualization method. The method proposed in this paper provides a new method and platform for 3D GIS data visualization. To verify the proposed design architecture, this paper tested the proposed method by using OpenStreetMap data, Bing Map Server map data, and image data. The experimental results showed that the Microsoft HoloLens can be used to model and render 3D geographic information.
The work of this paper would have wide applications referring to virtual and real coexistence 3D geographical scenes in the future. Two possible applicable scenarios are taken as an example. One is field natural survey teaching: By sharing a holographic 3D geographic scene with two HoloLens, a teacher in the field can remotely guide students in classes, and the effect is almost the same as the students being in the field. The other is an indoor fire simulation drill: Through a HoloLens system that simulates indoor fire and the real indoor environment, indoor fire simulation drills can be realized.
Future work will focus on integrating the geographic analysis model into the HoloDym3DGeoSce to enrich the HoloDym3DGeoSce’s spatial analysis ability and expand its applications.

Author Contributions

Xingxing Wu, Wei Wang and Zeqiang Chen conceived of the idea of the paper. Xingxing Wu and Zeqiang Chen analyzed the data and performed the experiments. Xingxing Wu, An He and Zeqiang Chen wrote the paper.

Funding

This research was funded by the National Key R&D Program of China, grant number 2017YFC0803700 and the National Nature Science Foundation of China, grant numbers 41771422, 41971351.

Conflicts of Interest

The authors declare no conflict of interest.

Appendix A

The main codes of obtaining OSM data and converting into GeoJSON data.
Obtain data based on the overpass API, and convert into Geojson data through Converter
 var httpStr = $”http://overpass-api.de/api/interpreter?data=[out:json];
 (node[\”building\”]({rect.MinLat},{rect.MinLon},{rect.MaxLat},{rect.MaxLon});
 way[\”building\”]({rect.MinLat},{rect.MinLon},{rect.MaxLat},{rect.MaxLon});
 relation[\”building\”]({rect.MinLat},{rect.MinLon},{rect.MaxLat},{rect.MaxLon}););
 out body;>;out skel qt;”;
 var http = new HttpClient();
 var tsk = await http.GetAsync(httpStr);
 var strTsk = await tsk.Content.ReadAsStringAsync();
 Converter.FilesRoot = _he.WebRootPath + Path.DirectorySeparatorChar.ToString();
 var converter = new Converter();
 var geojson = converter.OsmToGeoJSON(strTsk);

Appendix B

Complete configuration information for clients access Imagery Services.
Ijgi 08 00539 i001

Appendix C

The main codes call ImageryService to Acquire Satellite Image Data.
using UnityEngine;
//Building service request objects
var request=new ImageryMetadataRequest();
request.Credentials=new Microsoft.MapControl.Credentials();
request.Credentials.ApplicationId=AkzZURoD0H2Sle6Nq_DE7pm7F3xOc8S3CjDTGNWkz1EFl
JJkcwDKT1KcNcmYVINU";
//Set geographic longtitude, dimension and map zoom levels to collect values from the interface control
var location =
new Location(double.Parse(this.tbLatitude.Text),double.Parse(this.tbLongitude.Text));
request.Options=new ImageryMetadataOptions();
request.Options.Location=location;
request.Options.ZoomLevel=int.Parse(this.tbZoomLevel.Text);
request.Style=MapStyle.AerialWithLabels;
//Building client proxy object instances of ImageryService
var client=new ImageryServiceClient();
client.GetImageryMetadataCompleted +=(0,args)=>//Response the interface for processing requests
{
  if(args.Error==null)
  {
     var response=args.Result;
     this.tbMetadataResult.Text=response.Results[0].ImageUri.ToString();
     this.tbHeight.Text=response.Results[0].ImageSize.Height.ToString();
     this.tbWidth.Text=response.Results[0].ImageSize.Width.ToString();
  }
} ;
//Initiate asynchronous calls
client.GetImageryMetadataAsync(request);

Appendix D

The pseudo-code for generating a 3D building grid.
using UnityEngine;
Foreach Building
{
  Foreach Geometry
  {
    Convert Lat/Lon to metres;
  Convert from X/Y plane to X/Z plane;
  Move Centre of polygon to the origin;
  Triangulate & extrude;
  Translate back out to original location;
  }
}

Appendix E

Core codes underly gesture API.
using UnityEngine.VR.WSA.Input;
//Explanation: The following is an explanation of classes, methods and attributes: Gesture Source State contains detailed information about gesture input sources.
// Register the underlying input source click event
GestureManager.Pressed += GestureManager_Pressed;
//Register gestures release event
GestureManager.SourceReleased += GestureManager_Released;
//Register test event for the source of gestures
GestureManager.SourceDetected += GestureManager_Detected;
//Register update move changes of gestures event
GestureManager.SourceUpdated += GestureManager_Updated;
//Register losing the source of gestures event
GestureManager.SourceLost += GestureManager_Lost;
// Deal with underlying click interaction event
void GestureManager_Pressed(GestureSourceState state)
{
 // State includes users’ location of gazing, location of gestures, speed, condition and other physical information.
  // deal with underlying**interaction event
  ........................................
  //Stop clicking and press interaction event
  GestureManager.Pressed -= GestureManager_Pressed;
  //Stop**interaction event
  ........................................
}

Appendix F

Key codes develop speech (dictation).
UnityEngine.Windows.Speech
//Explanation: The key to voice dictation is to use Dictation Recognizer to convert the user’s voice into text. Dictation Recognizer provides the function of dictation. It can register and monitor the time of the voice dictation process and the end event of the voice, so it can provide feedback to the user in the process of voice dictation and at the end of dictation. The following are explanations of classes, methods and attributes: The Start () and Top () methods enable and disable dictation recognition, respectively. Once the identifier is complete, the Dispose () method should be used to process the resources used. If it is not released before then, it will automatically release these resources during garbage collection, but with additional performance costs.
//Create a dictation recognizer
DictationRecognizer dictationRecognizer = new DictationRecognizer();
//register dictation result event
dictationRecognizer.DictationResult += DictationRecognizer_DictationResult;
//register process event
dictationRecognizer.DictationHypothesis += DictationRecognizer_DictationHypothesis;
//register end event
dictationRecognizer.DictationComplete += DictationRecognizer_DictationComplete;
//register error event
dictationRecognizer.DictationError += DictationRecognizer_DictationError;
//Start recognizing
dictationRecognizer.Start();

References

  1. Azhar, S. Building information modeling (BIM): Trends, benefits, risks, and challenges for the AEC industry. Leadersh. Manag. Eng. 2011, 11, 241–252. [Google Scholar] [CrossRef]
  2. Kennard, R.W.; Stone, L.A. Computer aided design of experiments. Technometrics 1969, 11, 137–148. [Google Scholar] [CrossRef]
  3. Liu, X.; Wang, X.; Wright, G.; Cheng, J.; Li, X.; Liu, R. A state-of-the-art review on the integration of Building Information Modeling (BIM) and Geographic Information System (GIS). ISPRS Int. J. Geo-Inf. 2017, 6, 53. [Google Scholar] [CrossRef]
  4. OGC City Geography Markup Language (CityGML) En-Coding Standard. Available online: https://portal.opengeospatial.org/files/?artifact_id=47842 (accessed on 1 September 2019).
  5. Wang, W.; Wu, X.; Chen, G.; Chen, Z. Holo3DGIS: Leveraging Microsoft HoloLens in 3D Geographic Information. ISPRS Int. J. Geo-Inf. 2018, 7, 60. [Google Scholar] [CrossRef]
  6. Johnson, A.; Leigh, J.; Morin, P.; Van Keken, P. GeoWall: Stereoscopic visualization for geoscience research and education. IEEE Comput. Graph. Appl. 2006, 26, 10–14. [Google Scholar] [CrossRef]
  7. Noor, A.K. The HoloLens revolution. Mech. Eng. 2016, 138, 30–35. [Google Scholar] [CrossRef]
  8. Germs, R.; Van Maren, G.; Verbree, E.; Jansen, F.W. A multi-view VR interface for 3D GIS. Comput. Graph. 1999, 23, 497–506. [Google Scholar] [CrossRef]
  9. Wang, W.; Lv, Z.; Li, X.; Xu, W.; Zhang, B.; Zhu, Y.; Yan, Y. Spatial query based virtual reality GIS analysis platform. Neurocomputing 2018, 274, 88–98. [Google Scholar] [CrossRef]
  10. Li, X.; Lv, Z.; Hu, J.; Zhang, B.; Yin, L.; Zhong, C.; Feng, S. Traffic management and forecasting system Based on 3d gis. In Proceedings of the CCGrid 2015: 15th IEEE/ACM International Symposium on Cluster, Cloud and Grid Computing, Shenzhen, China, 4–7 May 2015. [Google Scholar]
  11. Jurado, J.M.; Graciano, A.; Ortega, L.; Feito, F.R. Web-based GIS application for real-time interaction of underground infrastructure through virtual reality. In Proceedings of the SIGSPATIAL 2017: The 25th ACM SIGSPATIAL International Conference on Advances in Geographic Information Systems, Los Angeles, CA, USA, 7–10 November 2017. [Google Scholar]
  12. Li, X.; Lv, Z.; Hu, J.; Zhang, B.; Shi, L.; Feng, S. XEarth: A 3D GIS Platform for managing massive city information. In Proceedings of the 2015 IEEE International Conference on Computational Intelligence and Virtual Environments for Measurement Systems and Applications, Shenzhen, China, 12–14 June 2015. [Google Scholar]
  13. Huang, W.; Sun, M.; Li, S. A 3D GIS-based interactive registration mechanism for outdoor augmented reality system. Expert Syst. Appl. 2016, 55, 48–58. [Google Scholar] [CrossRef]
  14. Fernández-Palacios, B.J.; Morabito, D.; Remondino, F. Access to complex reality-based 3D models using virtual reality solutions. J. Cult. Herit. 2017, 23, 40–48. [Google Scholar] [CrossRef]
  15. Boulos, M.N.K.; Lu, Z.; Guerrero, P.; Jennett, C.; Steed, A. From urban planning and emergency training to Pokémon Go: Applications of virtual reality GIS (VRGIS) and augmented reality GIS (ARGIS) in personal, public and environmental health. Int. J. Health Geogr. 2017, 16, 7. [Google Scholar] [CrossRef] [PubMed]
  16. Lv, Z.; Li, X.; Li, W. Virtual reality geographical interactive scene semantics research for immersive geography learning. Neurocomputing 2017, 254, 71–78. [Google Scholar] [CrossRef]
  17. Google Cardboard. Available online: https://vr.google.com/cardboard/ (accessed on 1 September 2019).
  18. Microsoft HoloLens. Available online: https://www.microsoft.com/en-gb/hololens/ (accessed on 1 September 2019).
  19. HTC Vive. Available online: https://www.vive.com/uk/ (accessed on 1 September 2019).
  20. Facebook Oculus Rift. Available online: https://www.oculus.com/ (accessed on 1 September 2019).
  21. Sony PlayStation. Available online: https://www.playstation.com/en-gb/explore/playstation-vr/ (accessed on 1 September 2019).
  22. Kress, B.C.; Cummings, W.J. Optical architecture of HoloLens mixed reality headset. In Proceedings of the SPIE, Munich, Germany, 26 June 2017. [Google Scholar]
  23. Aruanno, B.; Garzotto, F.; Rodriguez, M.C. HoloLens-based Mixed Reality Experiences for Subjects with Alzheimer’s Disease. In Proceedings of the 12th Biannual Conference on Italian SIGCHI Chapter, Cagliari, Italy, 18–20 September 2017. [Google Scholar]
  24. Chinara, C.; Feingold, G.; Shanbhag, A.; Weiniger, K. ARnold: A Mixed Reality Short Film using Microsoft HoloLens. In Proceedings of the SMPTE 2017 Annual Technical Conference and Exhibition, Hollywood & Highland, Los Angeles, CA, USA, 23–26 October 2017. [Google Scholar]
  25. Strzys, M.P.; Kapp, S.; Thees, M.; Kuhn, J.; Lukowicz, P.; Knierim, P.; Schmidt, A. Augmenting the thermal flux experiment: A mixed reality approach with the HoloLens. Phys. Teach. 2017, 55, 376–377. [Google Scholar] [CrossRef]
  26. Rosen, E.; Whitney, D.; Phillips, E.; Chien, G.; Tompkin, J.; Konidaris, G.; Tellex, S. Communicating robot arm motion intent through mixed reality head-mounted displays. arXiv 2017, arXiv:1708.03655. [Google Scholar]
  27. Sha, X.; Jia, Z.; Sun, W.; Hao, Y.; Xiao, X.; Hu, H. Development of Mixed Reality Robot Control System Based on HoloLens. In Proceedings of the ICIRA 2019: International Conference on Intelligent Robotics and Applications, Singapore, 10–11 January 2019. [Google Scholar]
  28. Vieweg, S.; Hodges, A. Rethinking context. Computer 2014, 47, 22–27. [Google Scholar]
  29. Stark, E.; Bistak, P.; Kozak, S.; Kucera, E. Virtual laboratory based on Node.js technology. In Proceedings of the 21st International Conference on Process Control (PC), Strbske Pleso, Slovakia, 6–9 June 2017. [Google Scholar]
  30. Turini, G.; Condino, S.; Parchi, P.D.; Viglialoro, R.M.; Piolanti, N.; Gesi, M.; Ferrari, V. A microsoft hololens mixed reality surgical simulator for patient-specific hip arthroplasty training. In Proceedings of the 5th International Conference on Augmented Reality, Virtual Reality and Computer Graphics, Otranto (LE), Italy, 24–27 June 2018. [Google Scholar]
  31. Nowak, A.; Woźniak, M.; Pieprzowski, M.; Romanowski, A. Advancements in Medical Practice Using Mixed Reality Technology. In Proceedings of the 9th International Conference on Innovations in Bio-Inspired Computing and Applications, Kochi, India, 17–19 December 2018. [Google Scholar]
  32. Hurter, C.; McDuff, D. Cardiolens: Remote physiological monitoring in a mixed reality environment. In Proceedings of the SIGGRAPH 2017, 44th Conference on Computer Graphics and Interactive Techniques, Los Angeles, CA, USA, 30 July–3 August 2017. [Google Scholar]
  33. Mitsuno, D.; Ueda, K.; Hirota, Y.; Ogino, M. Effective application of mixed reality device HoloLens: Simple manual alignment of surgical field and holograms. Plast. Reconstr. Surg. 2019, 143, 647–651. [Google Scholar] [CrossRef] [PubMed]
  34. Al Janabi, H.F.; Aydin, A.; Palaneer, S.; Macchione, N.; Al-Jabir, A.; Khan, M.S.; Ahmed, K. Effectiveness of the HoloLens mixed-reality headset in minimally invasive surgery: A simulation-based feasibility study. Surg. Endosc. 2019. [Google Scholar] [CrossRef]
  35. OpenStreetMap Data. Available online: https://planet.openstreetmap.org/ (accessed on 1 September 2019).
  36. Bing Maps Website. Available online: https://docs.microsoft.com/en-us/bingmaps/ (accessed on 1 September 2019).
  37. Web Services Standards. Available online: https://www.w3.org/standards/webofservices/ (accessed on 1 September 2019).
  38. Unity3d Website. Available online: http://www.unity3d.com/ (accessed on 1 September 2019).
  39. Overpass API Website. Available online: http://www.overpass-api.de/ (accessed on 1 September 2019).
  40. XML Website. Available online: https://www.w3.org/XML/ (accessed on 1 September 2019).
  41. GeoJSON Website. Available online: https://GeoJSON.org/ (accessed on 1 September 2019).
  42. Richardson, L.; Ruby, S. RESTful Web Services; O’Reilly Media, Inc.: Sebastopol, CA, USA, 2008; pp. 79–105. [Google Scholar]
  43. URL Website. Available online: http://www.w3.org/Addressing/URL/url-spec.html (accessed on 1 September 2019).
  44. Full Serializer Website. Available online: https://github.com/jacobdufault/fullserializer (accessed on 1 September 2019).
  45. Triangulator. Available online: http://wiki.unity3d.comf/index.php?title=Triangulator (accessed on 1 September 2019).
  46. Spatial Mapping Website. Available online: https://msdn.microsoft.com/en-us/magazine/mt745096.aspx (accessed on 1 September 2019).
  47. Goodchild, M.F. Citizens as sensors: The world of volunteered geography. GeoJournal 2007, 69, 211–221. [Google Scholar] [CrossRef]
  48. Zhang, X.; Chen, N.; Chen, Z.; Wu, L.; Li, X.; Zhang, L.; Di, L.; Gong, J.; Li, D. Geospatial sensor web: A cyber-physical infrastructure for geoscience research and application. Earth-Sci. Rev. 2018, 185, 684–703. [Google Scholar] [CrossRef]
  49. Gong, J.; Geng, J.; Chen, Z. Real-time GIS data model and sensor web service platform for environmental data management. Int. J. Health Geogr. 2015, 14, 2. [Google Scholar] [CrossRef]
  50. Chen, Z.; Chen, N. A Real-Time and Open Geographic Information System and Its Application for Smart Rivers: A Case Study of the Yangtze River. ISPRS Int. J. Geo-Inf. 2019, 8, 114. [Google Scholar] [CrossRef] [Green Version]
Figure 1. Architecture and design of HoloDym3DGeoSce.
Ijgi 08 00539 g001
Figure 2. Web service-based 3D geographic scene modelling.
Ijgi 08 00539 g002
Figure 3. Steps of texture mapping.
Ijgi 08 00539 g003
Figure 4. Process of texture mapping.
Ijgi 08 00539 g004
Figure 5. Generating a 3D model with texture based on Unity3D rendering GeoJSON data.
Ijgi 08 00539 g005
Figure 6. Main content of interaction design.
Ijgi 08 00539 g006
Figure 7. Conceptual design of gazing.
Ijgi 08 00539 g007
Figure 8. Flow chart of gazing stability design.
Ijgi 08 00539 g008
Figure 9. Dynamic loading map of Robson Hill.
Ijgi 08 00539 g009
Figure 10. Dynamic loading of Mount Rainier.
Ijgi 08 00539 g010
Figure 11. Dynamic creation of a 3D digital city.
Ijgi 08 00539 g011
Figure 12. Performance changes of HoloLens before and after creation of dynamic holographic geographic scenes.
Ijgi 08 00539 g012
Figure 13. Incomplete data during loading of Web service-based HoloLens map data.
Ijgi 08 00539 g013
Table 1. Summary of performance data before and after dynamic creation of a 3D geographic scene.
NetworkI/OGPUCPU
Before the network loads the data0 Mb0 MB40%20%
After the network loads the data0.85 Mb4.74 MB90%43%
Table 2. The testers’ information and their test results (1 is the worst and 10 is the best).
PeopleEvaluation Index System and the Results
Visual ClaritySystem EfficiencyEasy LearningInteroperabilityComfortFlexibility
Old man1010109910
Old Woman1010109910
Schoolchild10101010910
High-school student101010101010
Master student in GIS101010101010
PhD. Student in GIS101010101010
Master student in history101010101010
PhD. Student in chemistry101010101010
Professor in GIS101010101010
Middle-aged Doctor101010101010
Average scores 1010109.89.710

