Article

Spatiotemporal Distribution of Nonseismic Landslides during the Last 22 Years in Shaanxi Province, China

1
Shaanxi Key Laboratory of Earth Surface System and Environmental Carrying Capacity, Northwest University, Xi’an 710127, China
2
Institute of Earth Surface System and Hazards, Northwest University, Xi’an 710127, China
3
College of Urban and Environmental Sciences, Northwest University, Xi’an 710127, China
4
State Key Laboratory of Hydroscience and Engineering, Tsinghua University, Beijing 100084, China
5
School of Business, Xi’an University of Finance and Economics, Xi’an 710061, China
*
Author to whom correspondence should be addressed.
ISPRS Int. J. Geo-Inf. 2019, 8(11), 505; https://doi.org/10.3390/ijgi8110505
Submission received: 10 September 2019 / Revised: 25 October 2019 / Accepted: 6 November 2019 / Published: 9 November 2019
(This article belongs to the Special Issue Geospatial Approaches to Landslide Mapping and Monitoring)

Abstract

:
The spatiotemporal distribution of landslides provides valuable insight for the understanding of disastrous processes and landslide risk assessment. In this work, we compiled a catalog of landslides from 1996 to 2017 based on existing records, yearbooks, archives, and fieldwork in Shaanxi Province, China. The statistical analyses demonstrated that the cumulative frequency distribution of the annual landslide number was empirically described by a power-law regression. Most landslides occurred from July to October. The relationship between landslide time interval and their cumulative frequency could be fitted using an exponential regression. The cumulative frequency of the landslide number could be approximated using the power-law function. Moreover, many landslides caused fatalities, and the number of fatalities was related to the number of landslides each month. Moreover, the cumulative frequency was significantly correlated with the number of fatalities and exhibited a power-law relationship. Furthermore, obvious differences were observed in the type and density of landslides between the Loess Plateau and the Qinba Mountains. Most landslides were close to stream channels and faults, and were concentrated in cropland at elevations from 600–900 m and on slope gradients from 30–40°. In addition, the landslide frequency increased as the annual rainfall levels increased over a large spatial scale, and the monthly distribution of landslides presented a significant association with the precipitation level. This study provides a powerful method for understanding the spatiotemporal distribution of landslides via a rare landslide catalog, which is important for engineering design and planning and risk management.

1. Introduction

Landslides are frequent geohazards that cause significant casualties and economic losses every year all over the world [1,2,3,4,5,6,7,8]. Shaanxi Province in China exhibits an extremely high exposure risk for landslides because of its peculiar geomorphological and geological characteristics [9,10]. In particular, landslide events have been increasing because of population and economic growth, land use changes, and precipitation extremes [11,12].
Understanding the spatiotemporal distribution of landslide occurrence plays an essential role in assessing and modeling landslide hazards [13,14,15,16], estimating erosion and denudation rates [17,18], establishing effective landslide early warning systems [19,20], and providing clear knowledge of historical environmental changes [21,22]. Several studies on various environmental conditions have focused on landslide spatial distributions, mapping, and risk assessments [6,23,24]. However, assessing the spatiotemporal distribution of landslides is difficult because the spatiotemporal characteristics of historical landslides are poorly understood based on current landslide classifications [18,25,26,27]. Compared with other natural hazards, landslides are difficult to identify at a large scale due to the lack of consistent reports [28,29]. Therefore, this gap must be filled by scientific and technical efforts [18,30]. It is also important to accurately understand landslide risk by developing and analyzing a historical landslide database [31].
In the current study, a landslide catalog of Shaanxi Province was obtained from existing yearbooks, landslide records, and archives. The aims of this study were to analyze the yearly and monthly landslide distribution, determine the cumulative frequency of the annual landslide number, quantify the relation between landslide distributions and time intervals, estimate the frequency of fatalities, compare the landslide spatiotemporal distribution between the Loess Plateau and the Qinba Mountains, and reveal the relationship between landslides and their influencing factors. These objectives are of practical importance for engineering design and landslide risk management.

2. Materials and Methodology
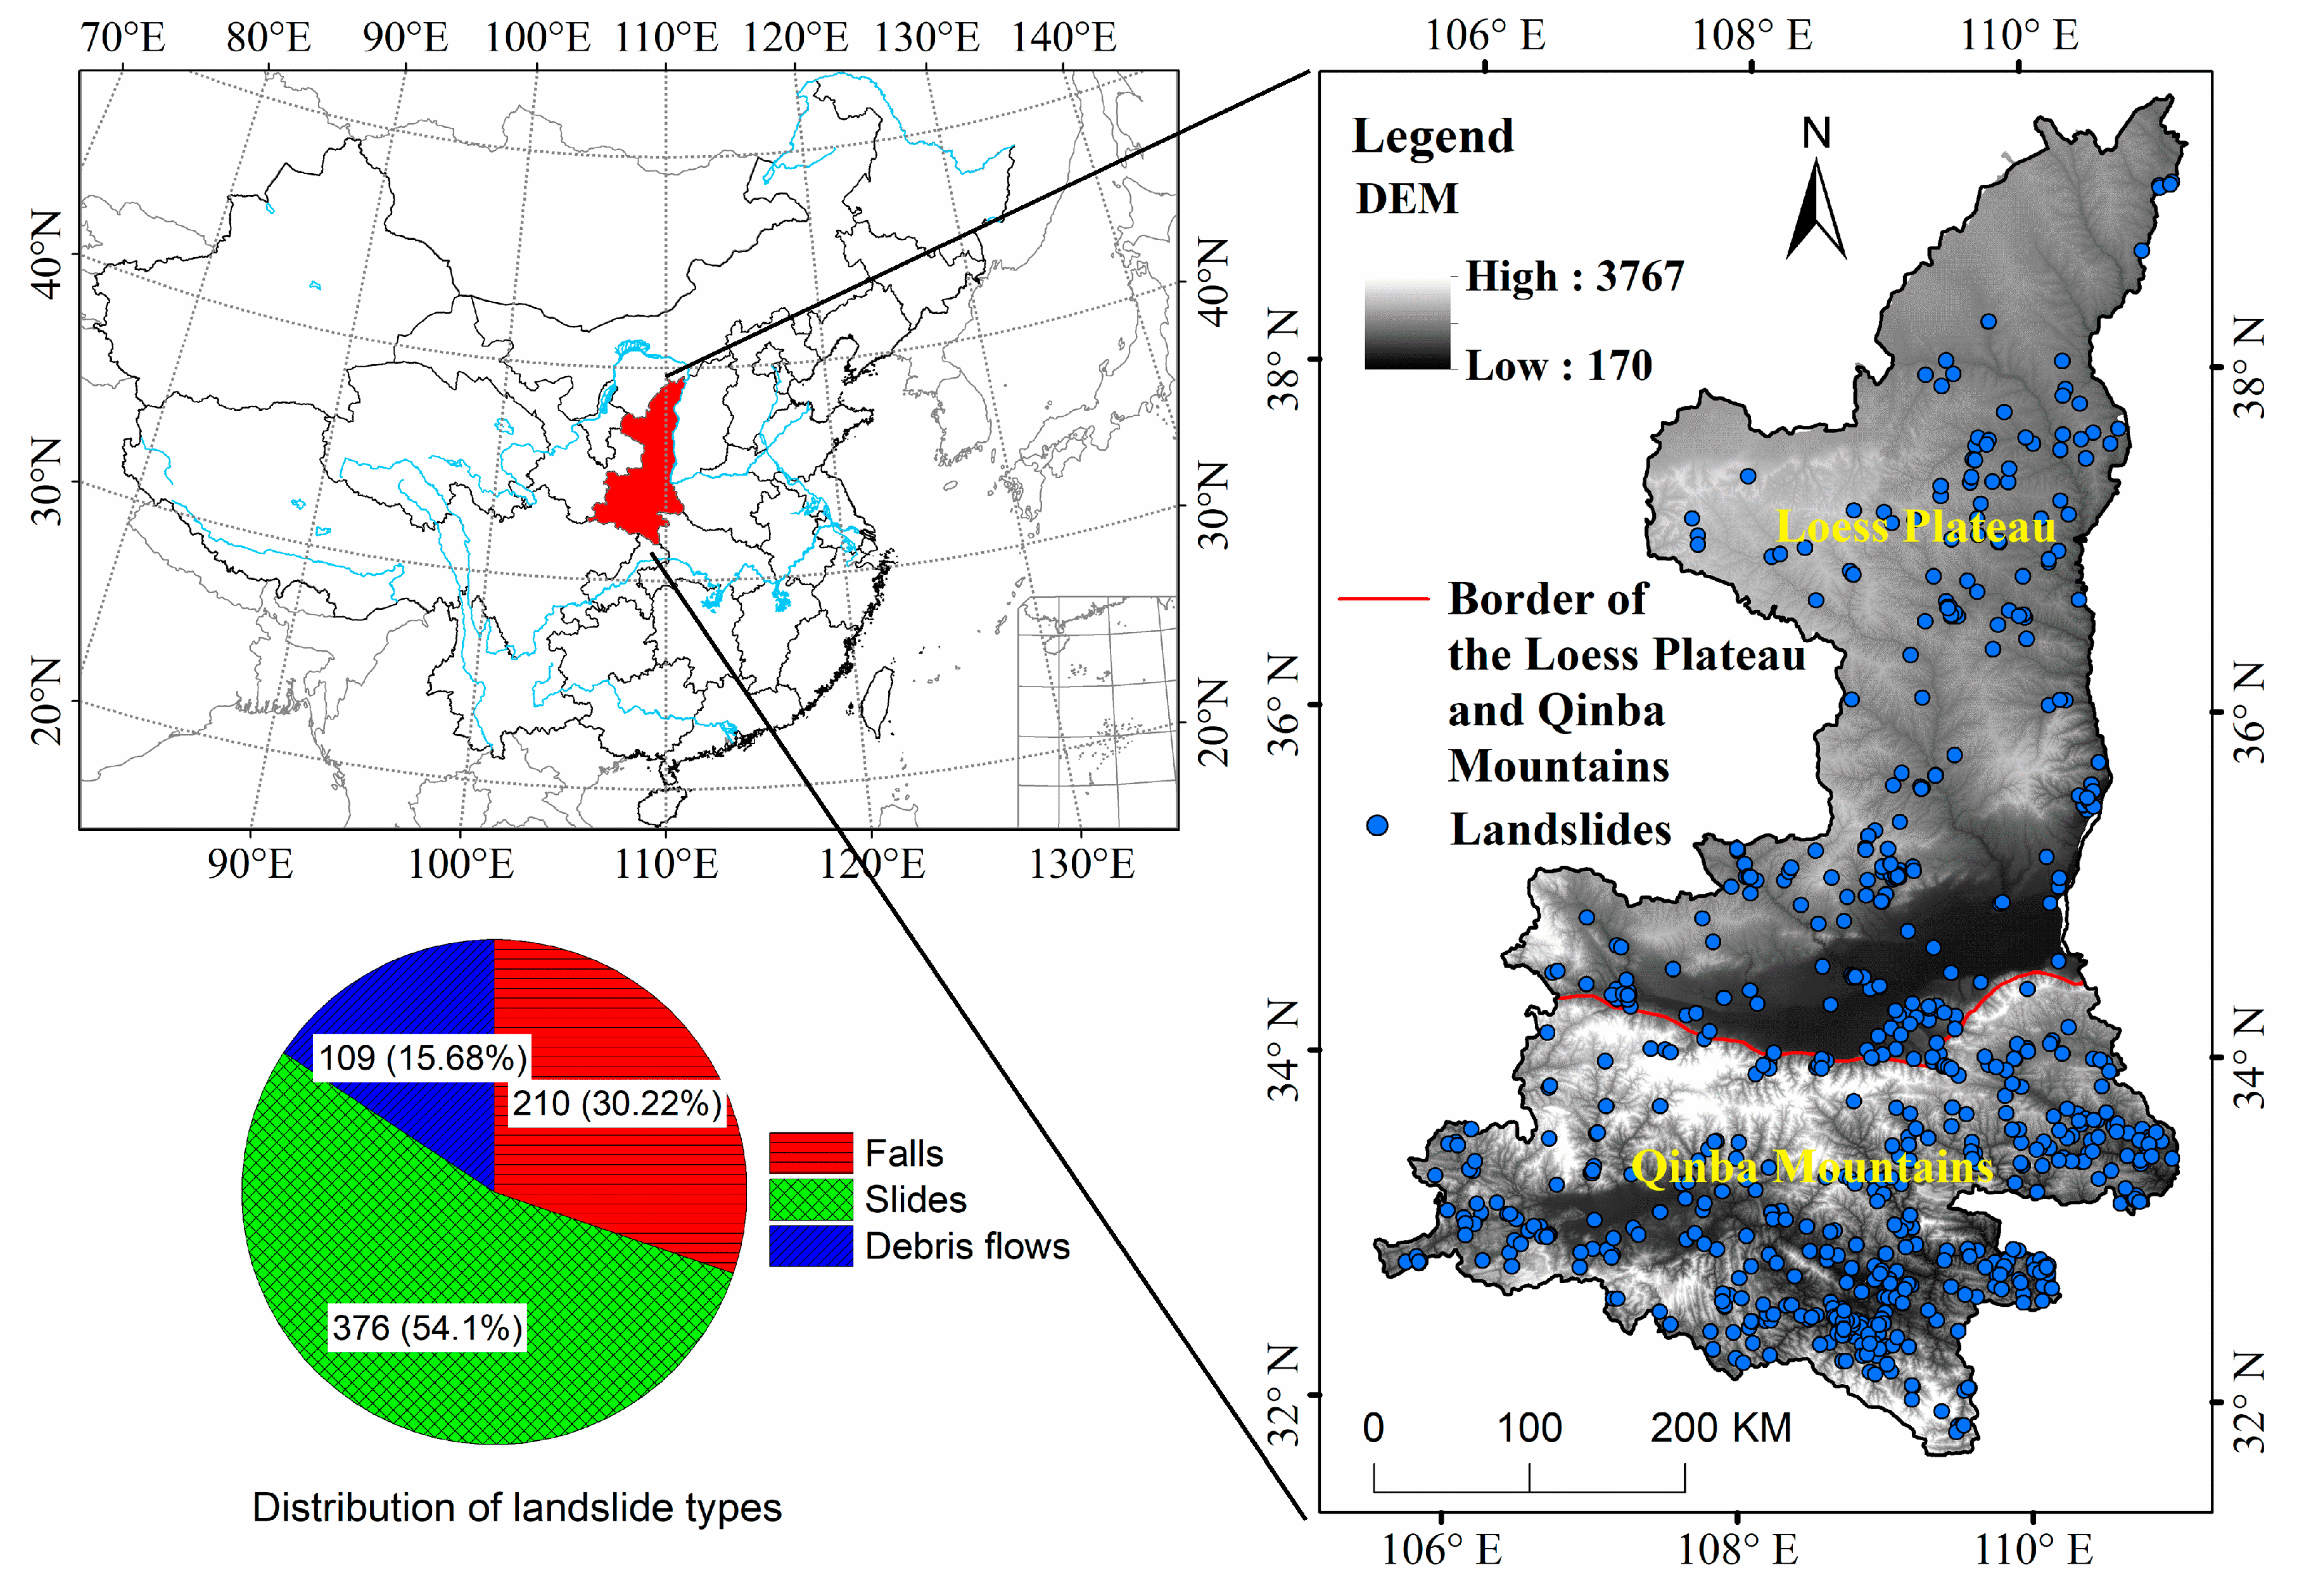
2.1. Study Area

The study area (approximately 20.58 km2) is located in the catchment of the Yellow and Yangtze River watersheds in central China (Figure 1). Large climate variability occurs across Shaanxi Province, which presents temperate, warm-temperate, and subtropical continental monsoon climates from north to south. This region features warm summers, dry winters, and strong monsoon-impacted rainy seasons. The annual precipitation and air temperature of Shaanxi Province are 576.9 mm and 13.0 °C, respectively. Approximately 70% of the annual precipitation falls during the wet season between May and September, and the frequency and magnitude of precipitation have been increasing because of weather events. The precipitation and number of landslides decrease from south to north. Many landslides have occurred in the Qinba Mountains and were triggered by intensive precipitation events. The landslide spatial distribution is associated with the center of high-intensity rainfall.
The permanent resident population in Shaanxi Province is 38 million. The Guanzhong Plain is more populated than the northern and southern areas. In much of Shaanxi Province, many landslides are triggered by excavations related to mining and the construction of roads and buildings, and many houses are built on steep terrain. In 2018, the gross domestic product (GDP) of Shaanxi Province was 2443 billion RMB, and the fossil fuel sector is a large industry.
The study area consists of two different types of landscapes in Shaanxi Province that can be approximately classified as the Loess Plateau and the Qinba Mountains in Shaanxi Province.
The Loess Plateau in Shaanxi Province is covered by thick loess or similar deposits. Loess is a highly porous, clastic, homogeneous, and silty sedimentary deposit formed by the accumulation of wind-deposited material [9,32], and the sedimentary thickness varies greatly [9]. This area is severely incised and characterized by a fragmented topography [9,33]. The stratigraphy from top to bottom is Malan loess, Lishi loess, Wucheng loess, and Mesozoic basement rocks. The materials and units of the Mesozoic rock basement of loess include monzonitic granite, biotite monzonitic granite, granodiorite, rapakivi granite, etc. Gabbroic-dioritic dark inclusion are commonly found in rock masses. Some rocks exhibit a plaque-like structure.
The Qinba Mountains are located in southern Shaanxi Province and formed during the collision of the North China Block and the South Chinese Yangtze Platform. The geology of the Qinba Mountains, which formed in response to intense tectonic activity and multiple crustal block interactions, is complex [34]. This area has many active faults, thrusts, and folds [35]. The Qinba Mountains are mainly metamorphic rocks and granites, including multi-schist, gneiss, dolomite, limestone, marble, slate, phyllite, etc. The deep metamorphic rocks are part of the Taihua Group and the Qinling Group of the former Ordovician. During the Yanshan period, granite intruded into the metamorphic rocks of the Taihua Group. The rock is hard and has a massive structure, and the lithology is uniform. Joints have developed and crossed each other. The granite body is divided into diamond-shaped blocks of different sizes. Most rock formations are layered structures that are dense and of medium strength, and these units are prone to landslides. The fragmented landscape was sculpted by the rapid tectonic uplift that started in the Tertiary and Quaternary and by intense soil erosion. The steep topography and high-intensity rainfall make this area prone to landslides. Landslides triggered by rainfall [36] and earthquakes are very widespread.

2.2. Data Collection

Landslides in Shaanxi Province have a high yearly frequency and are associated with large numbers of fatalities and large economic losses [10]. A detailed historical landslide database is an important tool for use in statistical analyses of these phenomena [35]. Because a single earthquake occurs in a particular year and triggers few landslides, there is no periodic pattern, and it is difficult to determine the rules of nonseismic landslides. Thus, we focused on nonseismic landslides and developed a catalog of landslides using existing landslide records and archives in this study. Most of the information on landslide occurrences was collected from the Shaanxi Province Yearbook of Disaster Prevention. Moreover, we conducted a considerable amount of fieldwork during 2015–2018 in the study area (Figure 2), in which we measured and mapped 120 landslides in detail. The fieldwork was aided by the interpretation of remote sensing images, Google Earth images, and geological and geomorphological maps. However, these images and maps do not offer detailed dates of landslide occurrences. Hence, we obtained most of the landslide temporal information from the Shaanxi Province Yearbook of Disaster Prevention. We validated and cross-checked this information using fieldwork, scientific reports, local historical archives, and chronicles. The landslide information from different sources validated each other. The landslide information includes the locations, mass movement type, and reported landslide dates. During the fieldwork, we also collected information on the slope gradient, elevation, curvature, and slope aspect. All landslides were classified according to the classification of Varnes [37] and Hungr et al. [38], and include slides, falls, and debris flows. This catalog includes 695 reported landslide occurrences from 1996 to 2017, including 210 falls, 376 slides, and 109 debris flows (Figure 1). No landslides from 1996 to 2017 in this study area were reactivations. This inventory represents a continuous source of landslide information. The landslide information included the landslide site numbers, types, locations, nearest populated places, losses, dates of occurrences, fatalities, etc. The site number includes a unique ID number for each individual landslide. The locations of landslides are denoted by latitude and longitude coordinates. The nearest populated places include villages, cities, and regions. The fatalities indicate the number of deaths caused by fatal landslides. We imported the landslide information into a geographic information system (GIS). Digital terrain analysis was performed with ArcGIS 10.2 (ESRI Inc. Redlands, CA, USA) and SAGA 6.0.0 software (Institute of Geography at the University of Hamburg, Hamburg, Germany). Here, the landslide information was preferential toward only landslides that affected buildings and roads, those resulting in fatalities and damages, and those that were near residential areas. In fact, it was very difficult to obtain complete inventories over large areas. The landslide dataset in this study area provides a minimum landslide number and represents the baseline for empirical thresholds of landslide temporal trends. The accuracy and precision of the mapped landslides were sufficient for use in investigating the spatiotemporal distribution.

2.3. Methods

2.3.1. Power-Law Relationship

We used the power-law relationship to fit the cumulative frequency of the annual landslide number, daily landslide number, and fatality number. These relationships can be expressed as follows:
C C F = a N L b
where CCF is the cumulative frequency; NL is the annual landslide number, daily landslide number, or and fatality number; and a and b are constants.

2.3.2. Exponential Relationship

We used an exponential relationship to fit the cumulative frequency of time intervals between landslide events. This relationship can be expressed as follows:
C C F T = c T d
where CCFT is the cumulative frequency, T is the time interval between landslide events, and c and d are constants.

2.3.3. Spatial Analysis of Landslides

In this work, we used the kernel density estimation, mean center, density, and surface tools of the ArcGIS software to conduct the spatial analysis of the landslides. The resolution of the digital elevation model (DEM) was 25 m × 25 m. The stream channels were obtained from the DEM using the SAGA software hydrology module. We interpolated the average annual rainfall data using ordinary kriging. Then, we calculated the statistics of the landslide number distribution for different elevations, annual rainfall, faults, slope gradients, and land use.

3. Results and Interpretation

3.1. The Temporal Distribution of Landslides

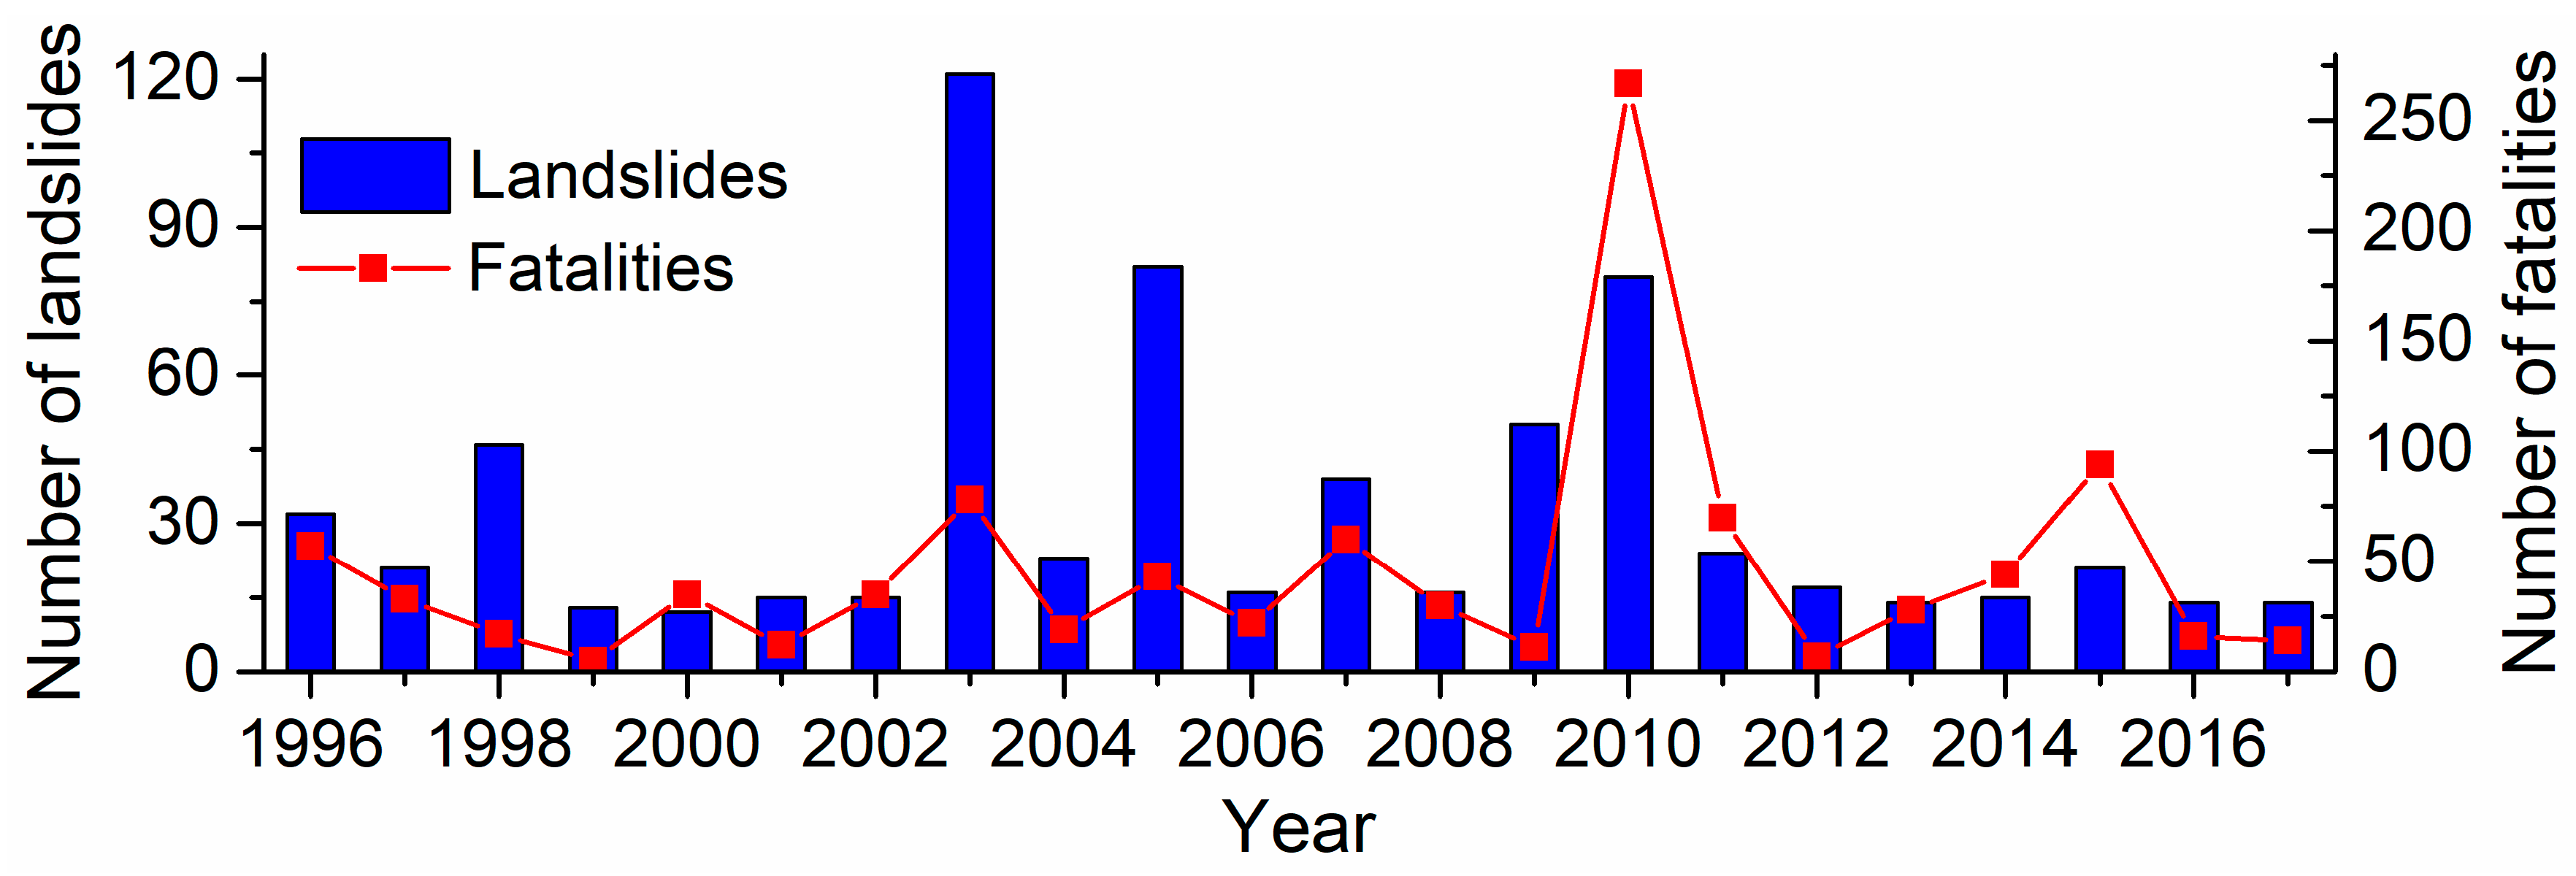
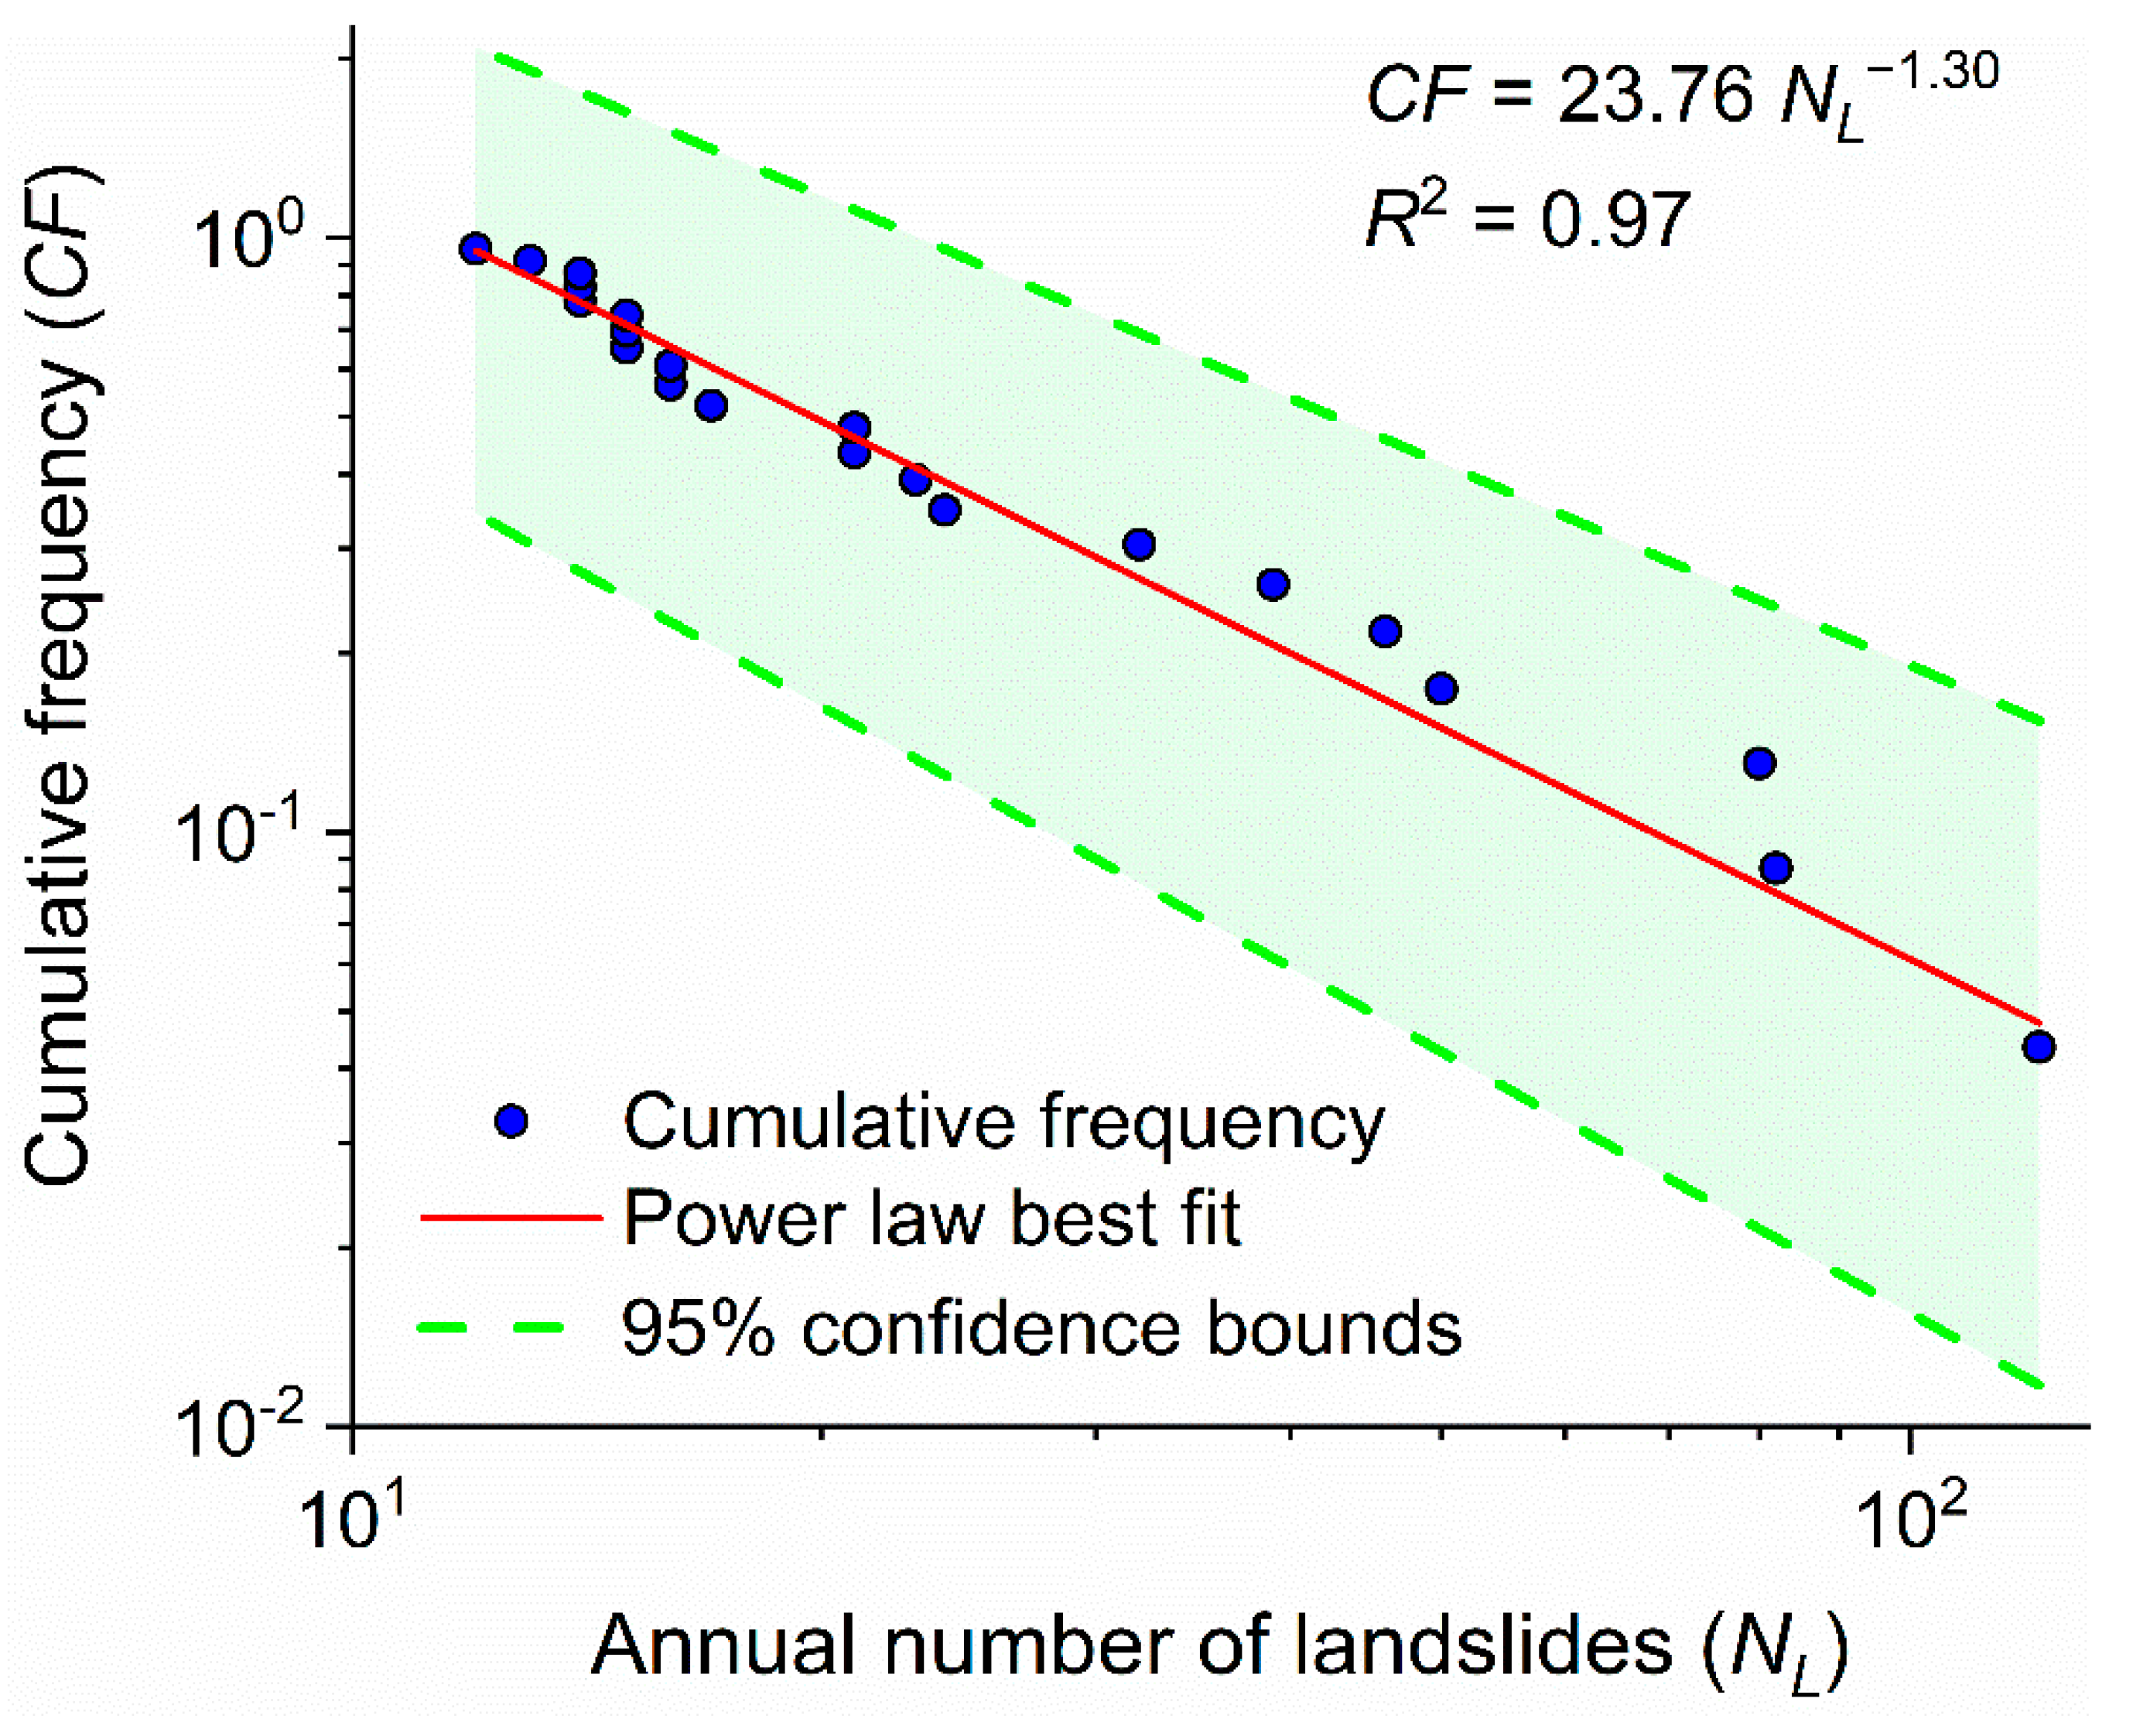
3.1.1. Annual Distribution of Landslides

Figure 3 shows the annual distribution of landslides and fatalities from 1996 to 2017. Landslides were particularly frequent in 1998, 2003, 2005, 2007, 2009, and 2010 because several rainstorms occurred during those years. The number of fatalities was very high in 2010. The average landslide number per year was approximately 32 and the average number of fatalities per year was 45 in Shaanxi Province. Figure 3 reveals that the landslide time series and fatalities show considerable annual variability.
Moreover, we analyzed the cumulative frequency of the annual landslide number and found that it decreased sharply as the annual landslide number increased. Although a limited theoretical basis is available to obtain a regression to fit this relation, we could fit this decay using a simple power-law regression (Figure 4), which suggests that a self-similar behavior occurs in this relation. This function resulted in the following relationships:
C F = 23.76 N L 1.30   ( R 2 = 0.97 , p < 0.01 )
where CF is the cumulative frequency and NL is the annual number of landslides. As shown in Figure 4, we determined the 95% confidence bounds.

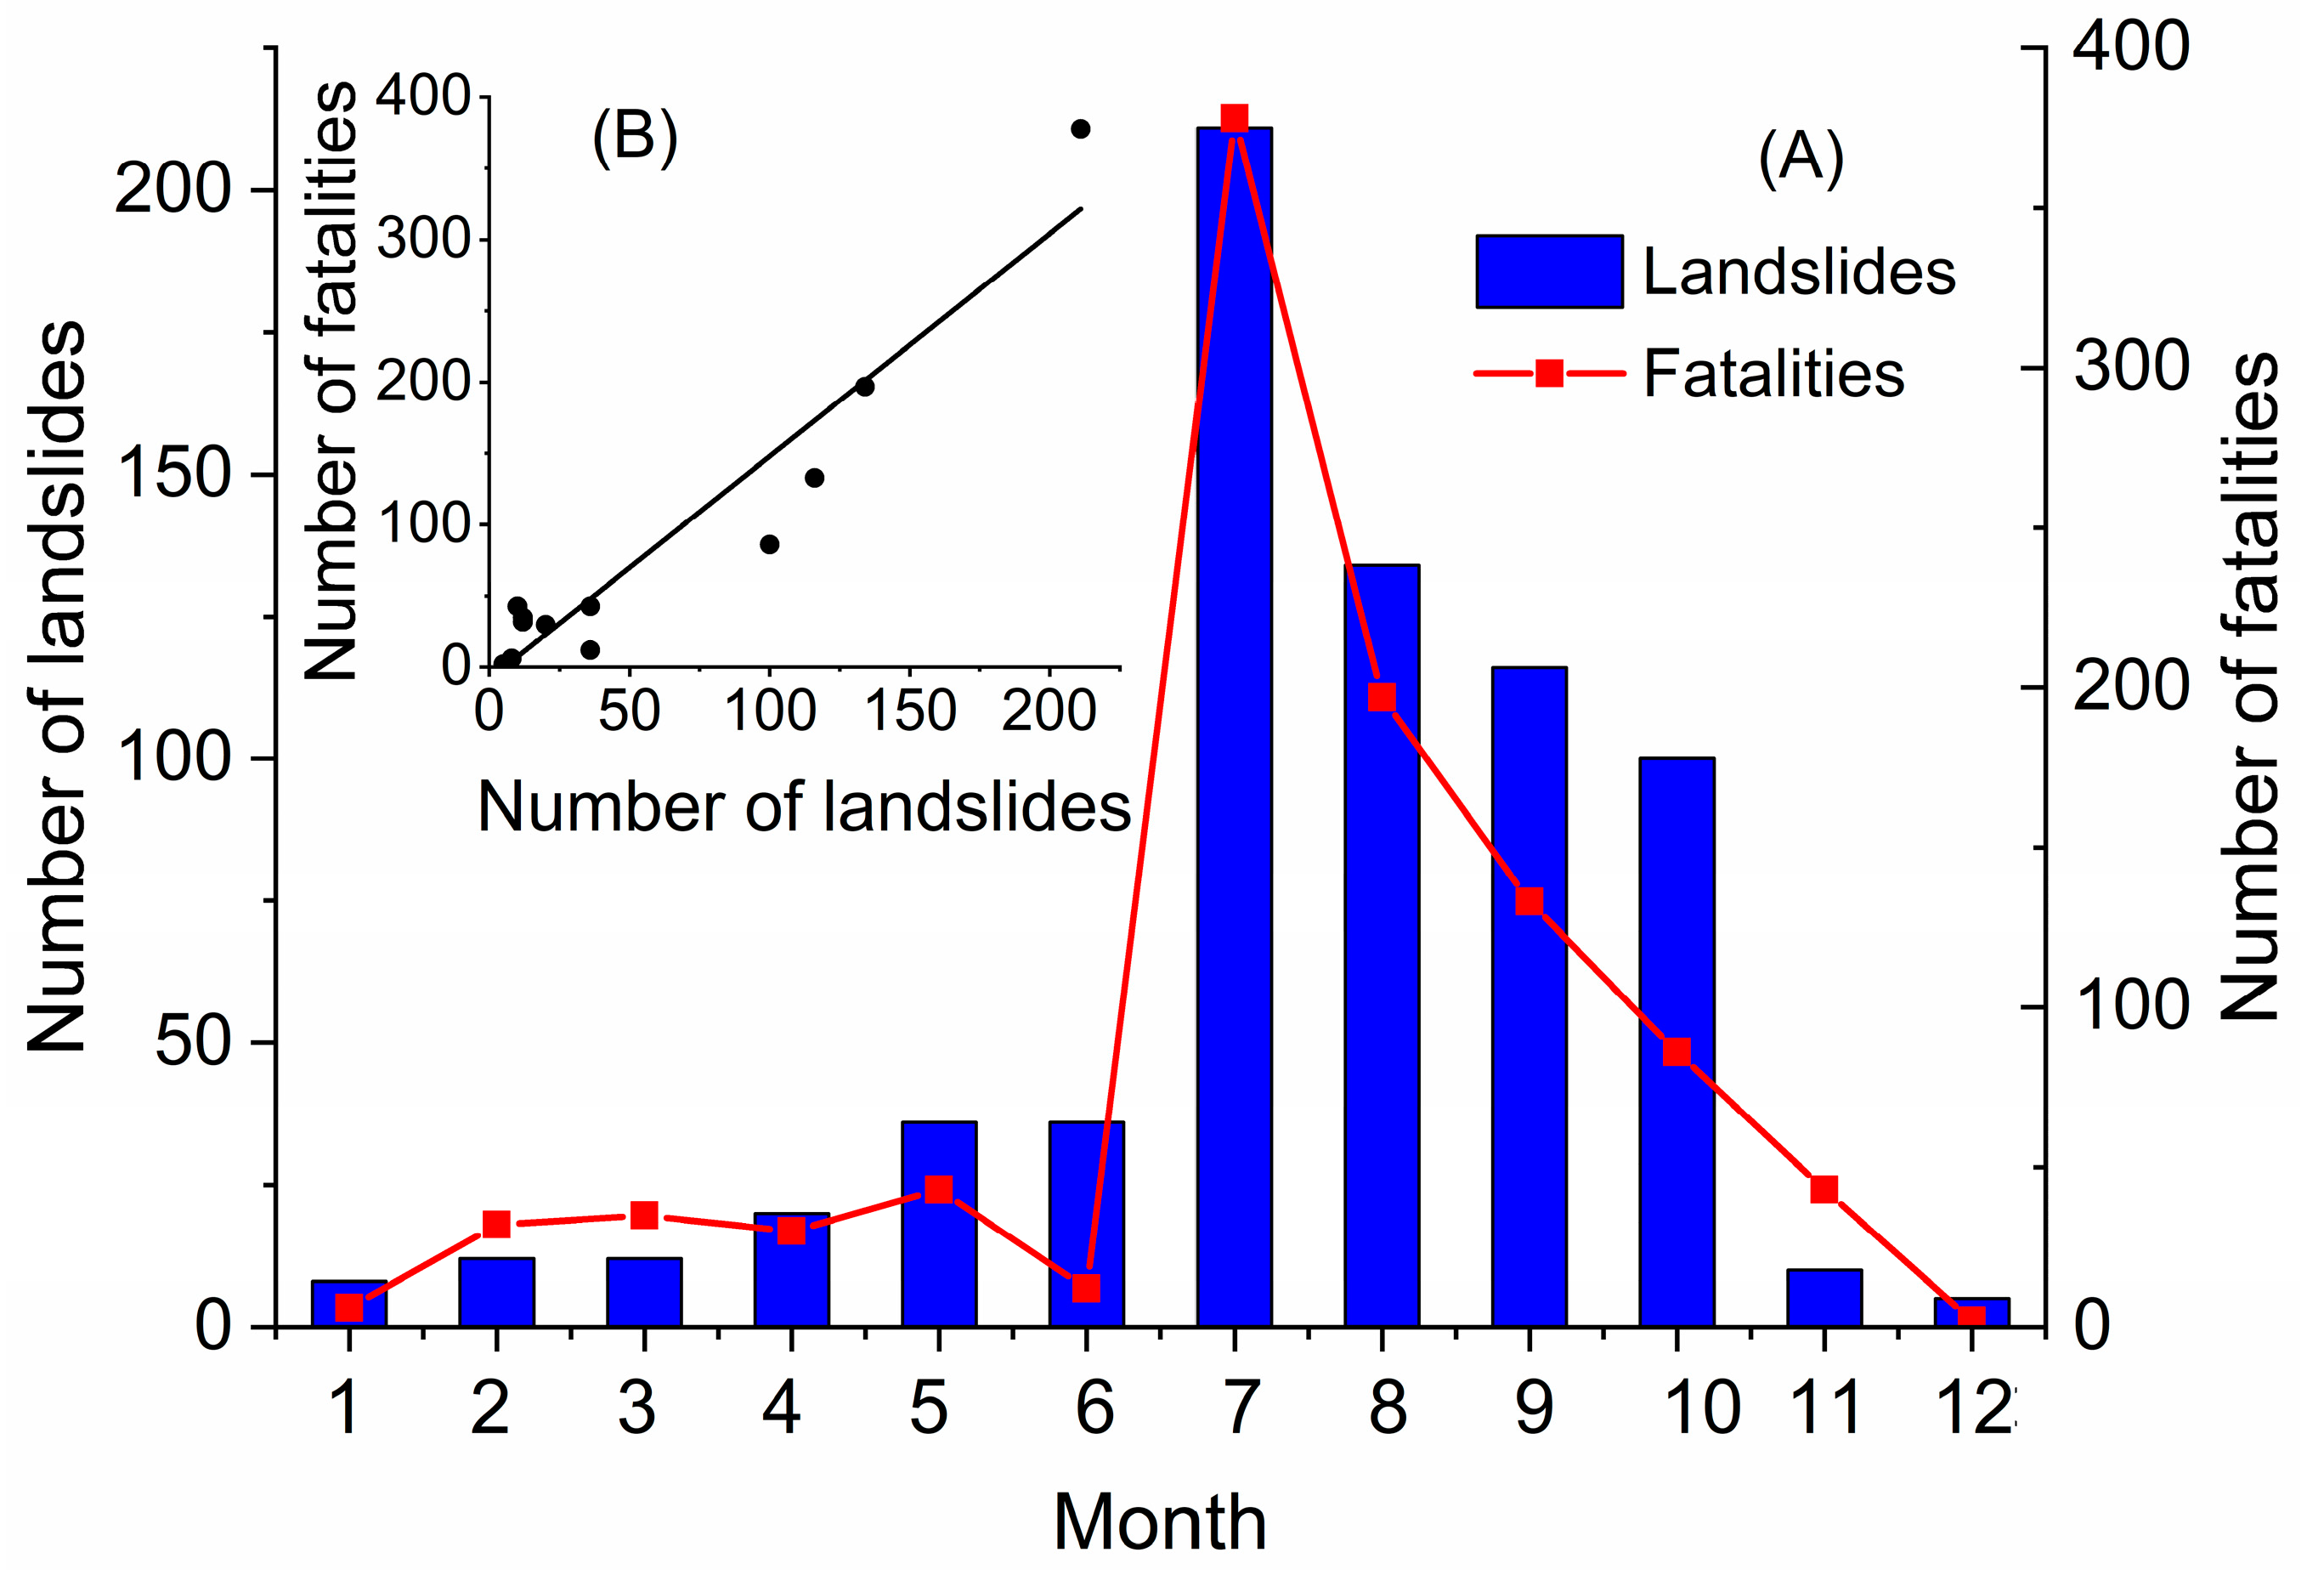
3.1.2. Monthly and Seasonal Distribution of Landslides

Figure 5A shows the monthly landslide number and fatalities over the past 22 years. Approximately 80% of the total landslide occurrences and fatalities occurred between July and October. We further found that the monthly landslide number was related to the monthly fatality number. The monthly fatality number increased as the monthly landslide number increased. This relation can be described using a linear fitting curve (Figure 5B).
Fall (50% of the total landslides) was the most destructive season, followed by summer (40% of the total landslides), spring (6% of the total landslides), and winter (3% of the total landslides) (Figure 5A).

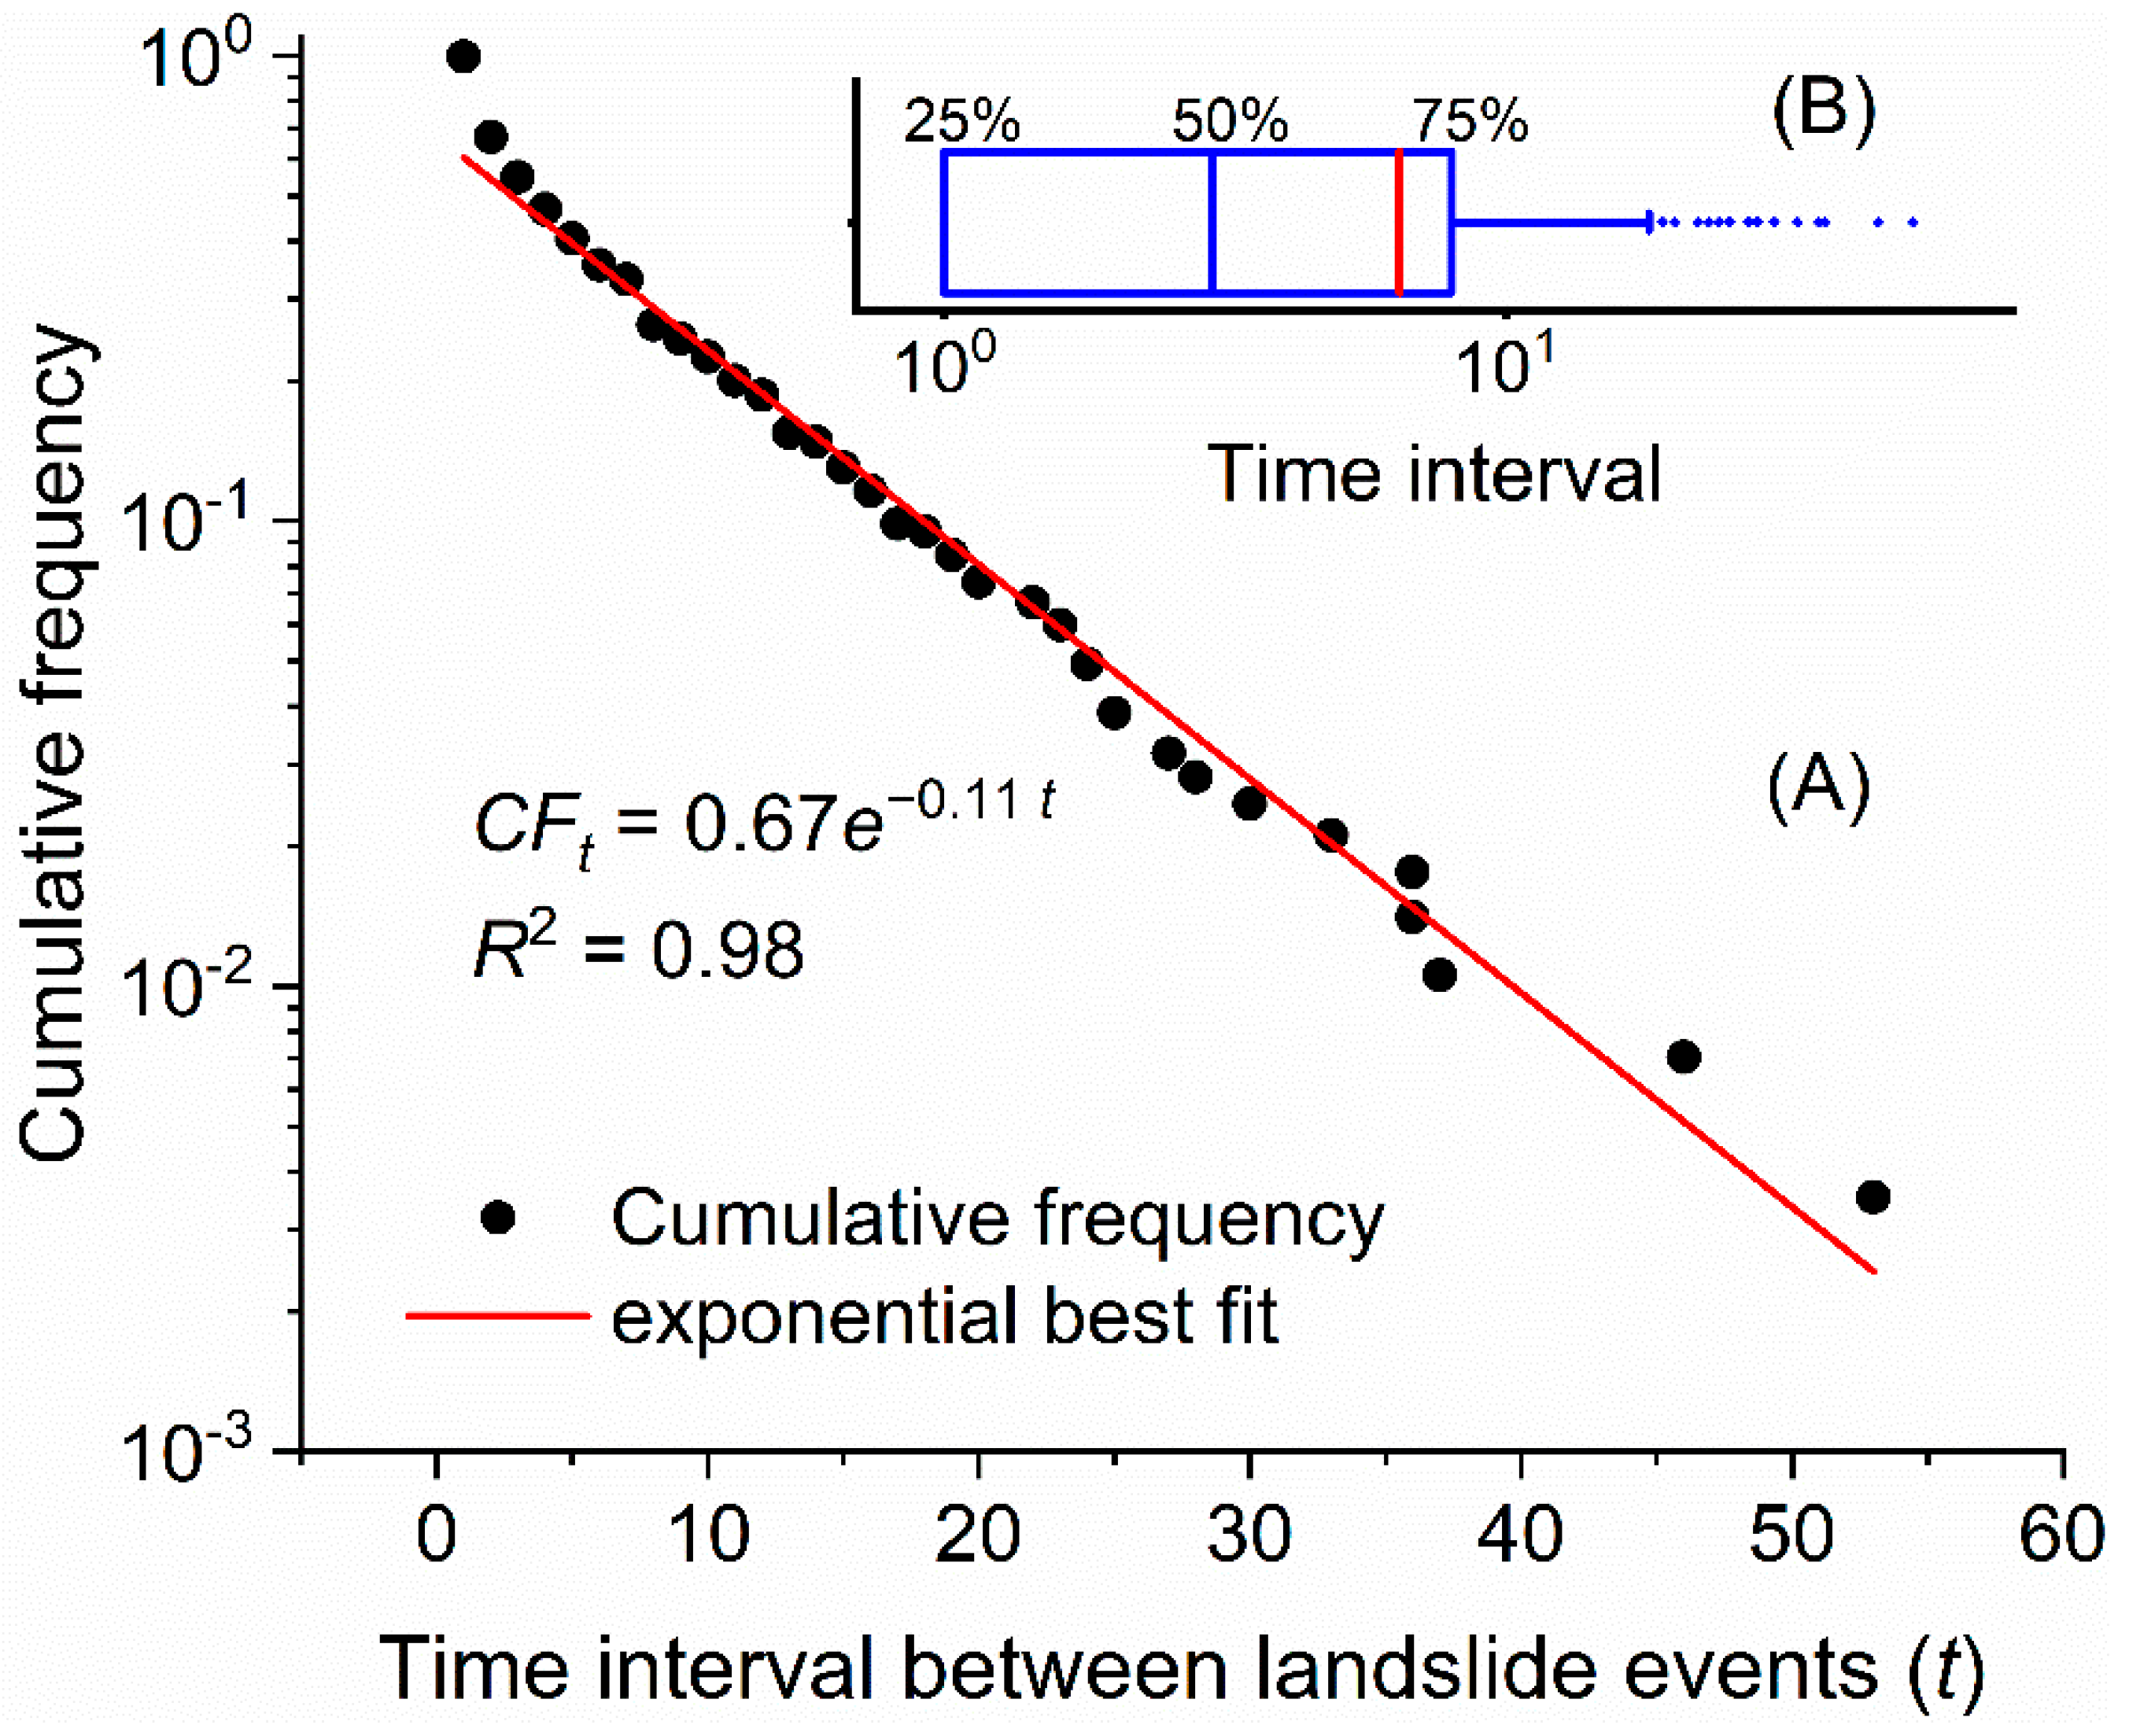
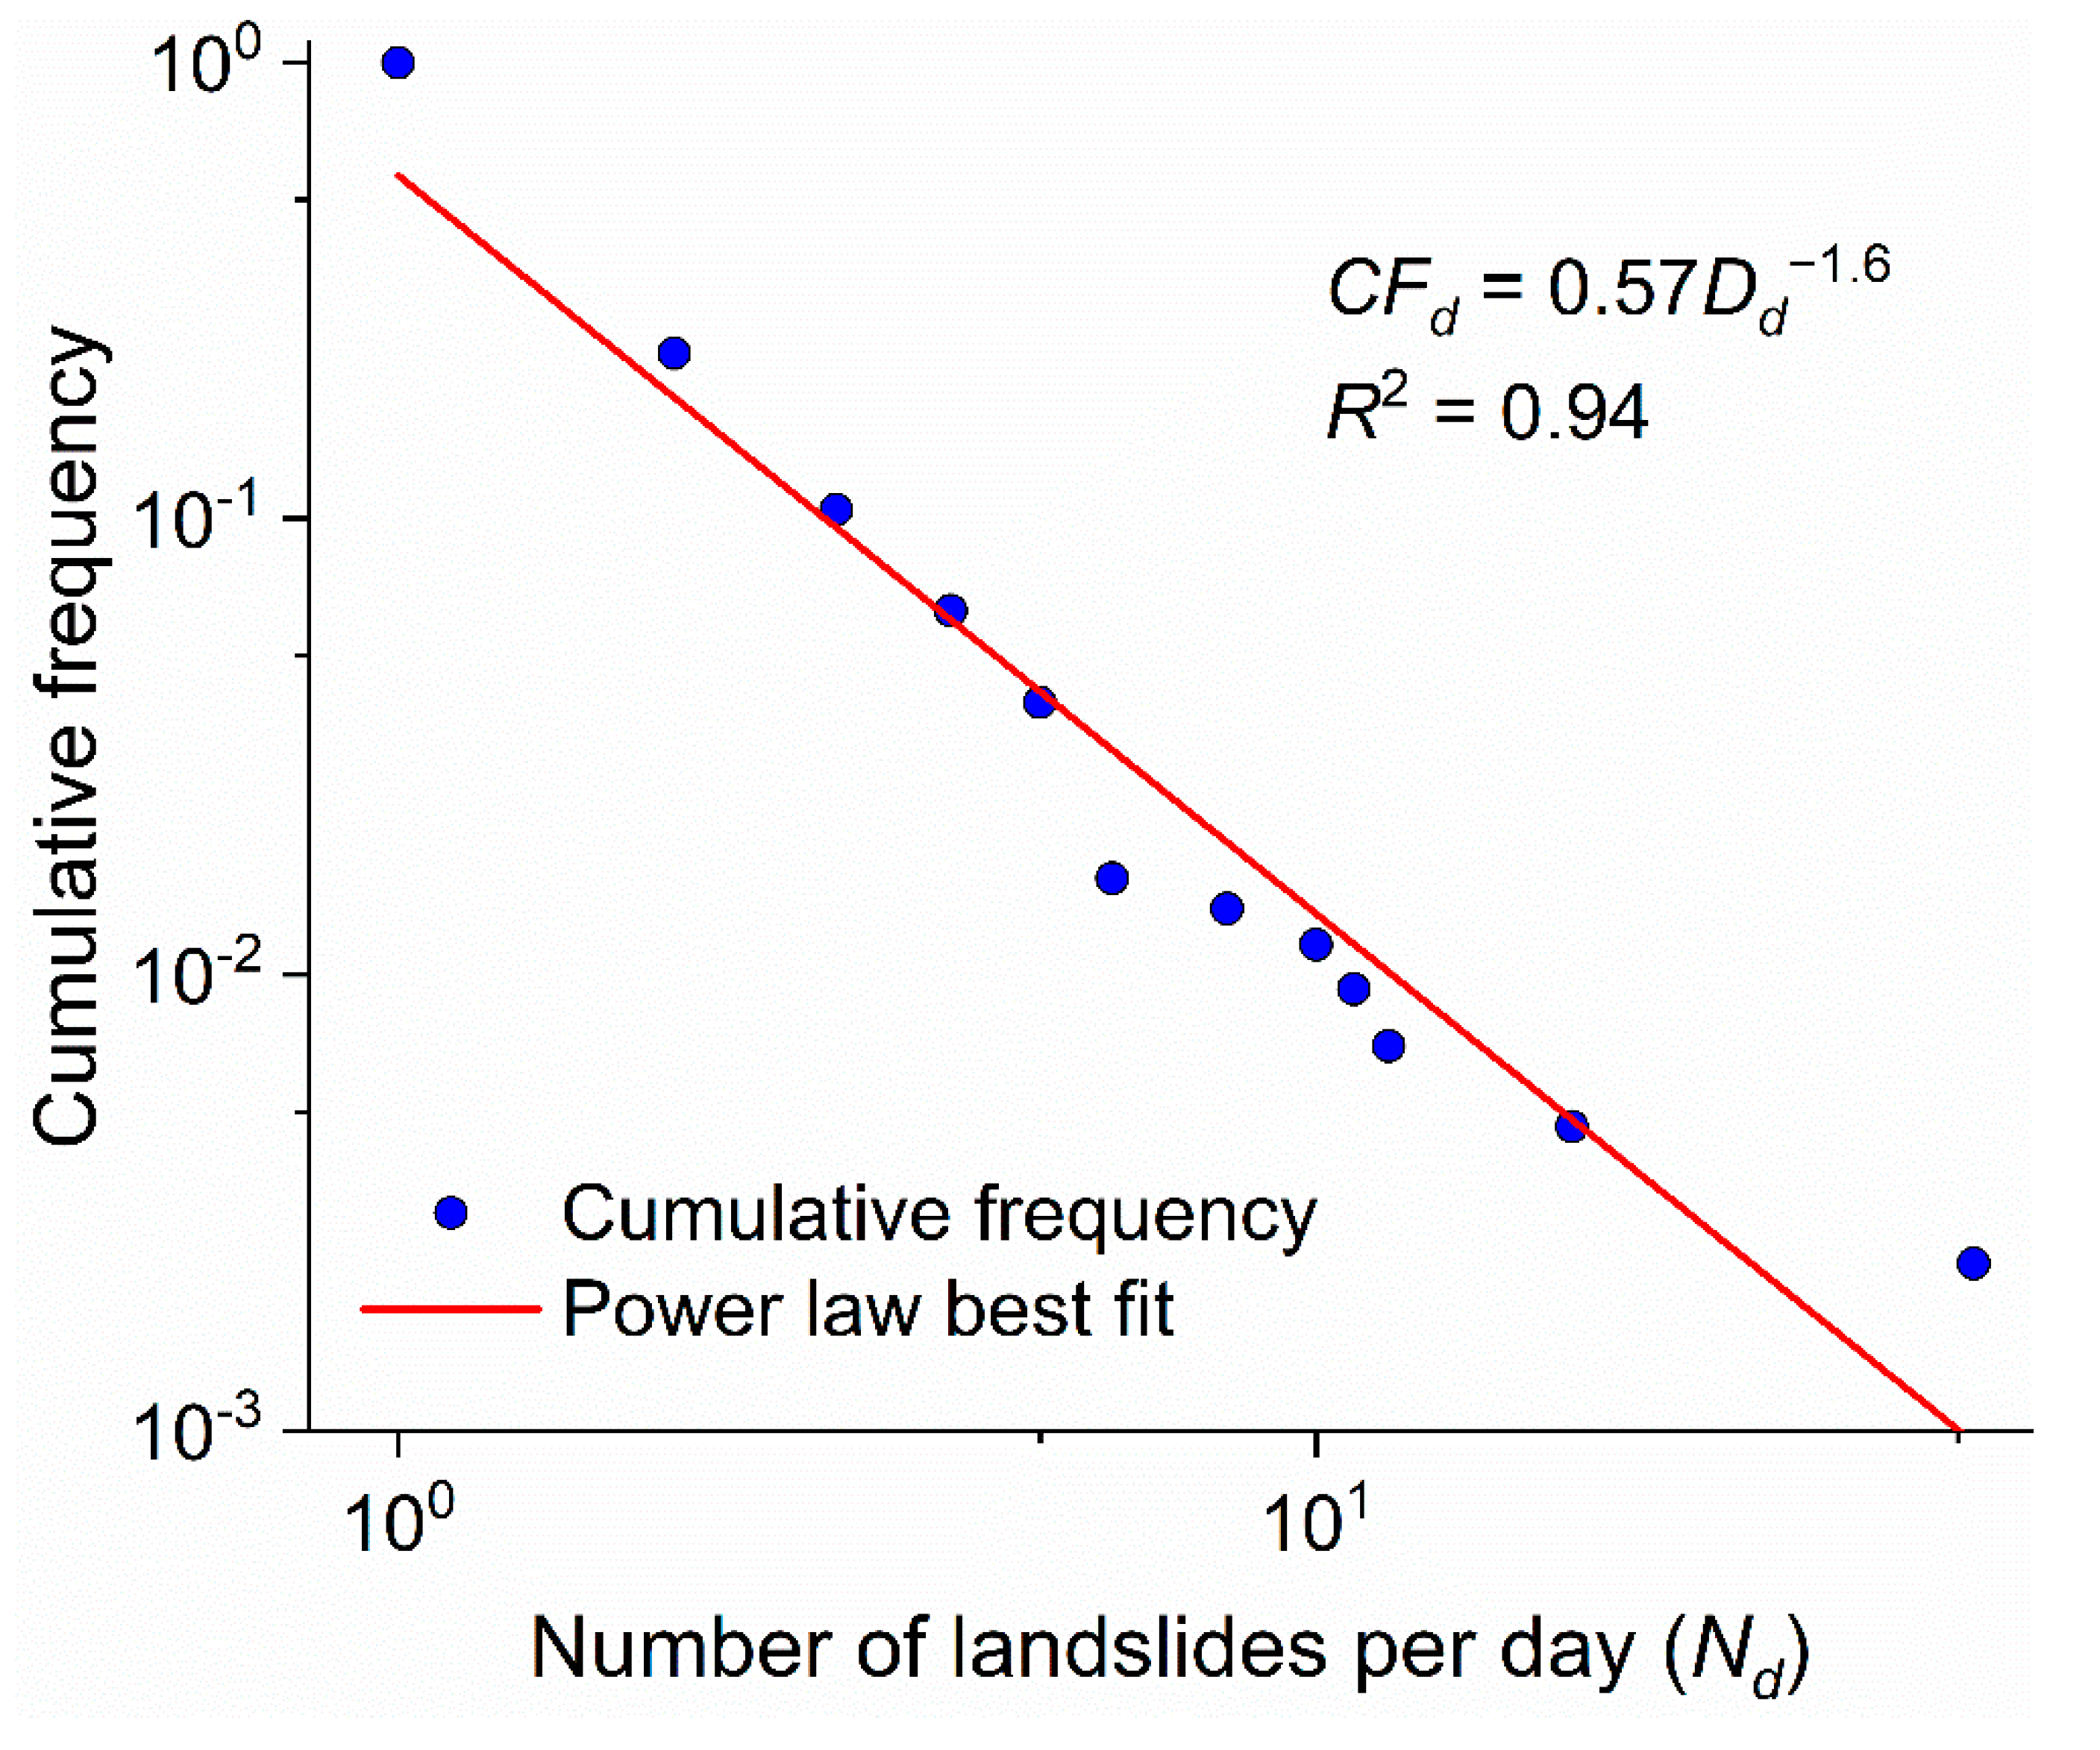
3.1.3. Daily Landslide Number and Time Intervals between Landslide Occurences

As illustrated in Figure 5A, the year can be divided into two parts: the period with the majority of landslides was from July to October, and the period with the fewest landslides was from November to June. The months with the majority of landslide occurrences are frequently evaluated. Thus, we focused on the temporal landslide distribution from July to October. To facilitate the investigation of the temporal distribution of landslides, we defined a single landslide event as all landslide occurrences on the same day. As shown in Figure 6B, the average time interval between landslide events was approximately six days, which implies that landslide events were very frequent. Most time intervals between landslide events were very small, and time intervals of less than two days accounted for 45% of the total time intervals.
In addition, we found that the cumulative frequency decreased with increasing landslide time intervals. This relation could be approximated using an exponential function (Figure 6A):
C F t = 0.67 e 0.11 t   ( R 2 = 0.98 , p < 0.01 )
where CFt is the cumulative frequency and t is the landslide time interval.
Furthermore, we analyzed the cumulative frequency of the daily landslide number during the studied time period and found that the cumulative frequency decreased as the daily landslide number increased. This relation was empirically well correlated with the power-law function (Figure 7).

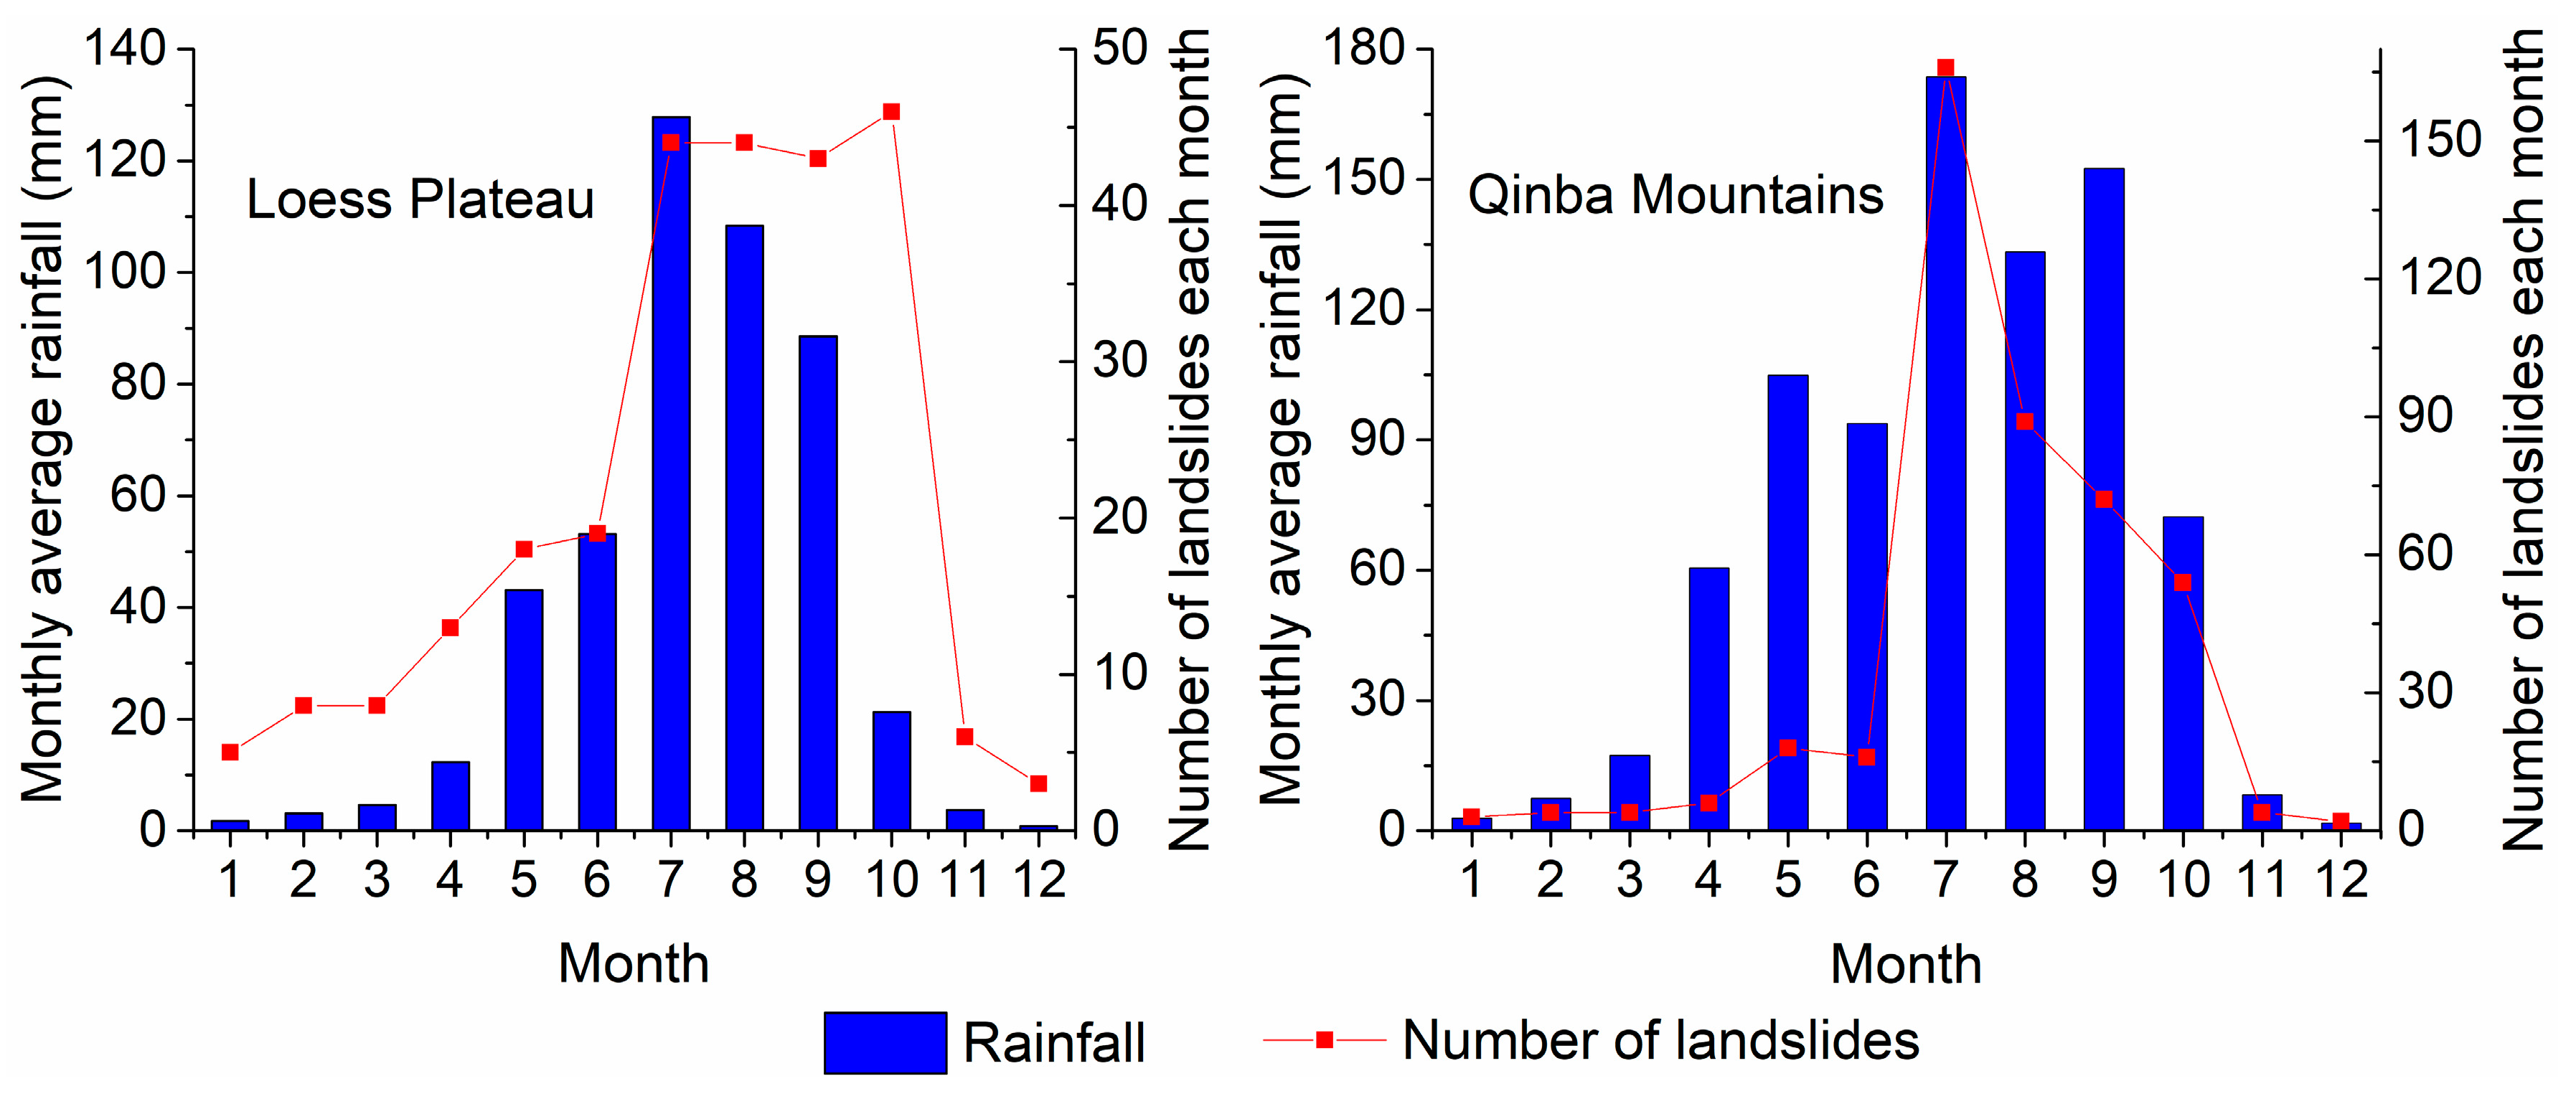
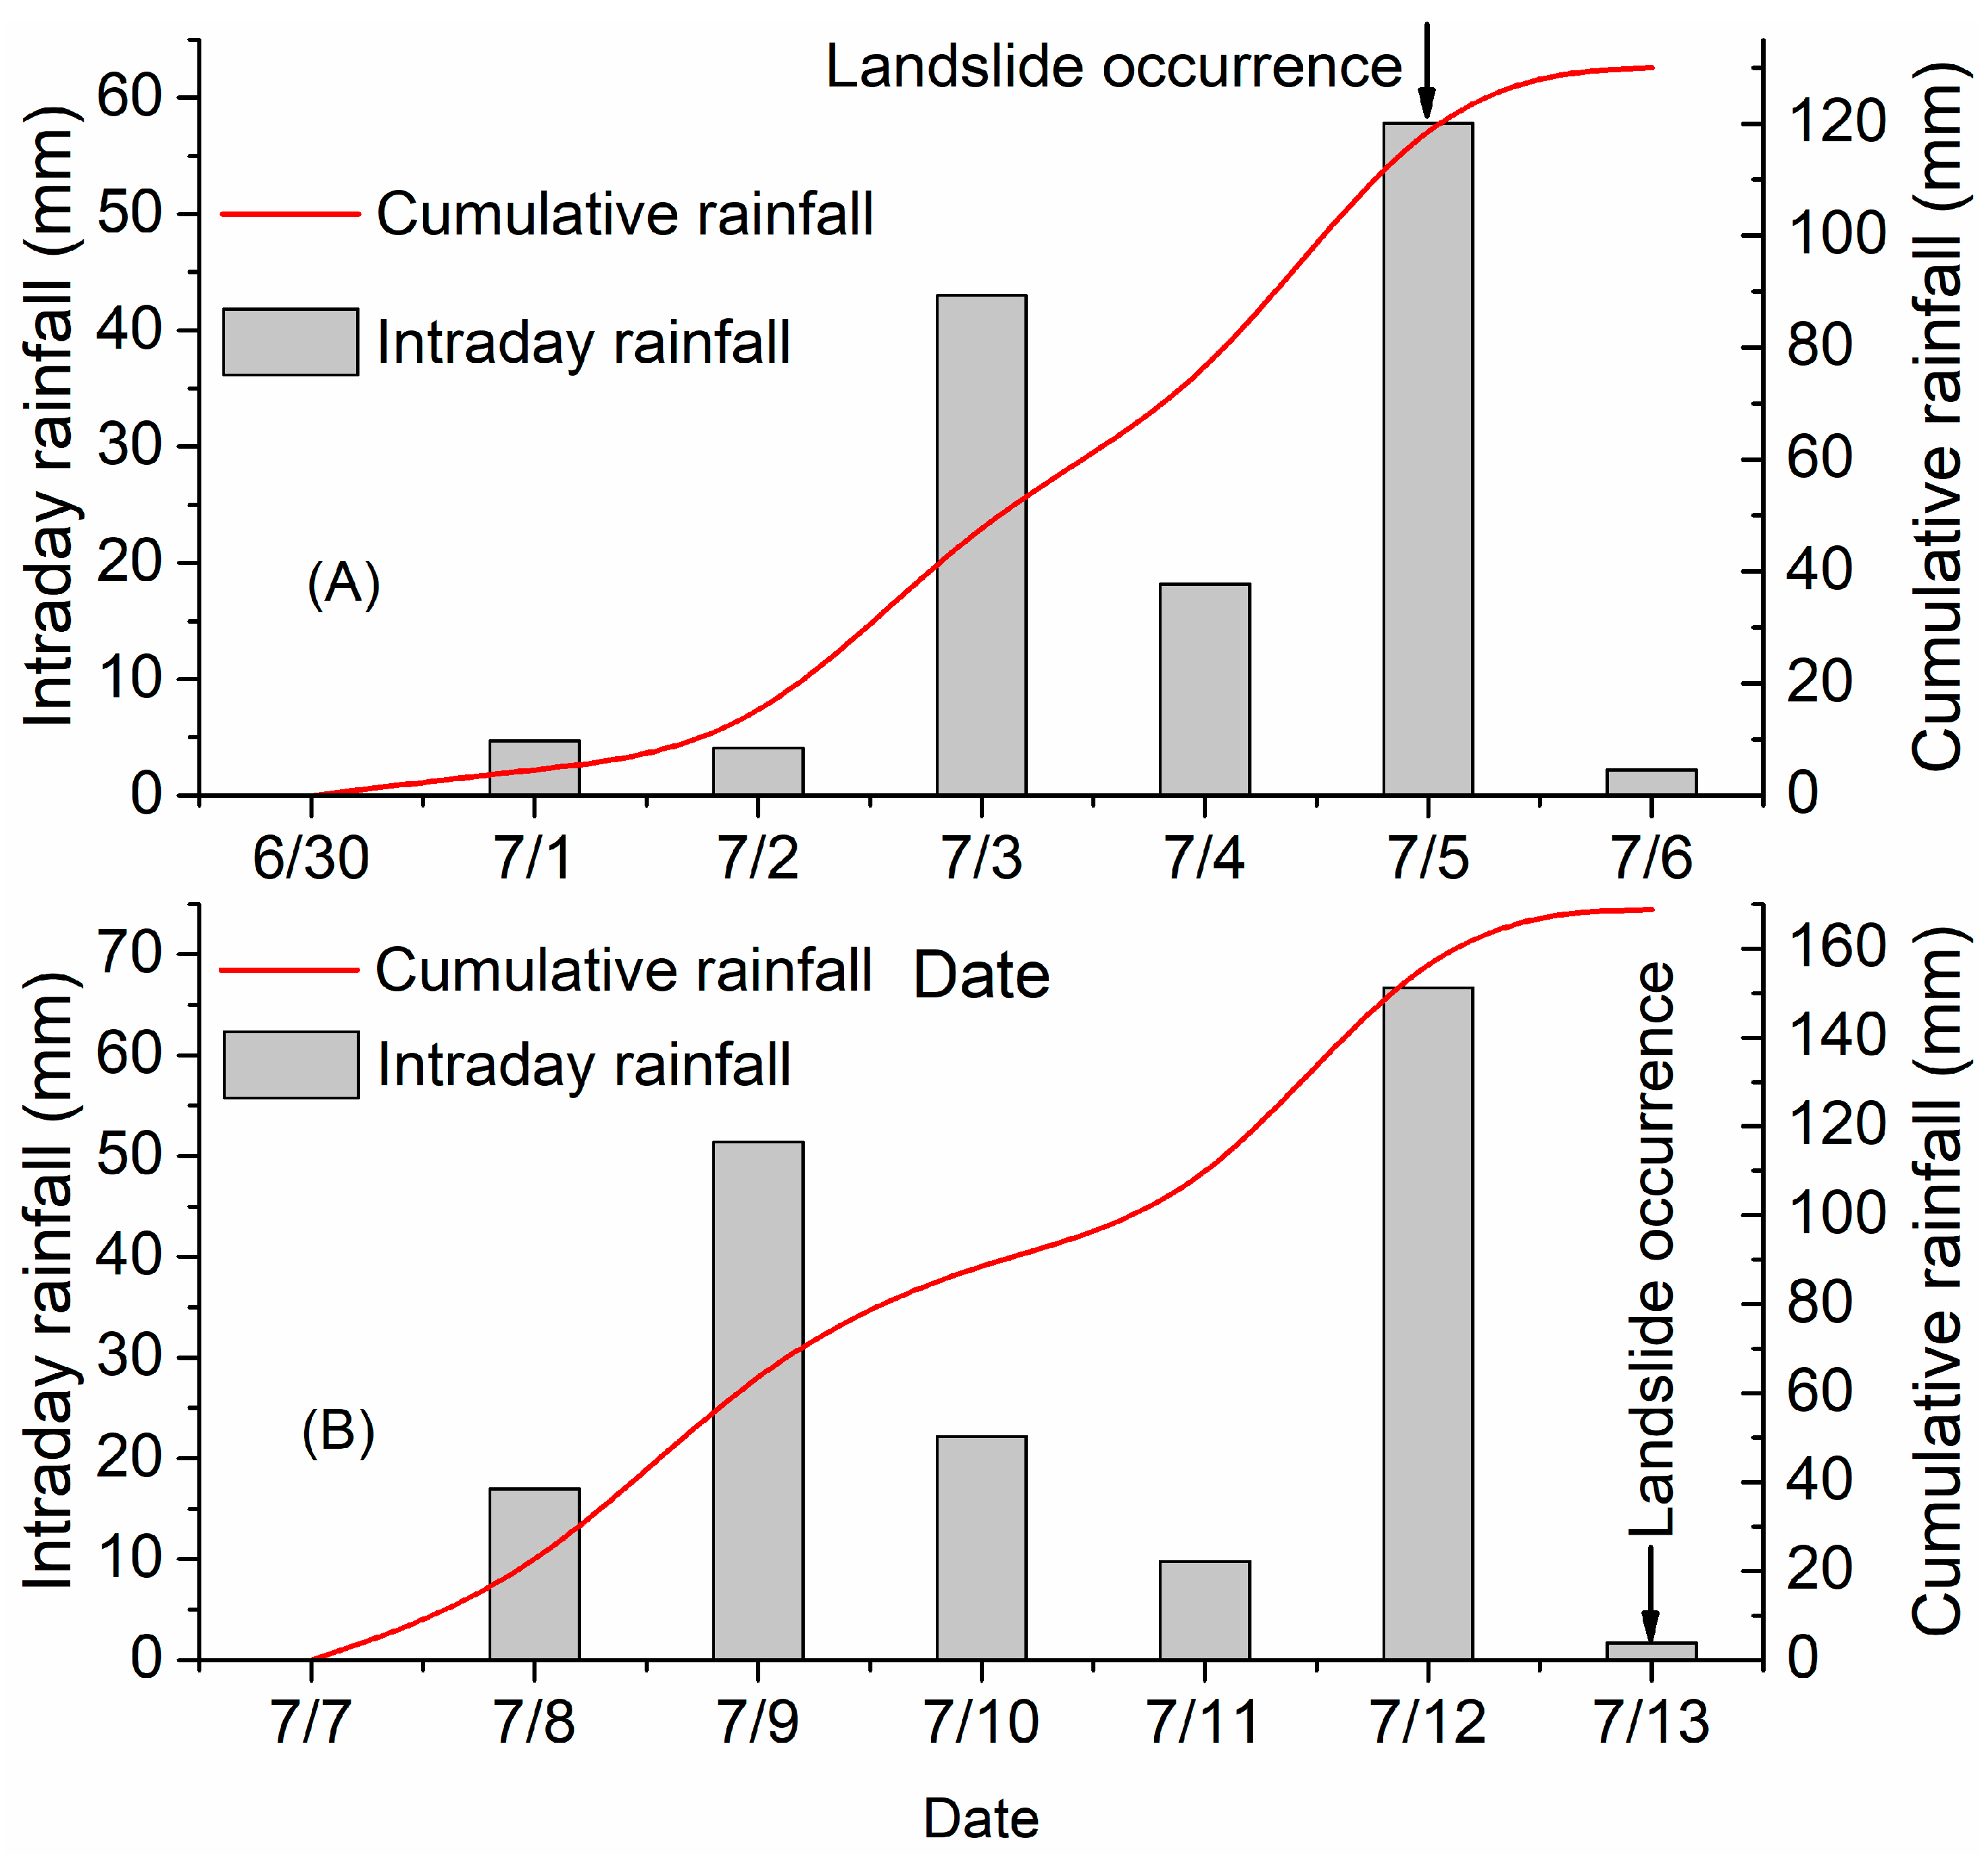
3.1.4. Landslide Distribution Associated with Rainfall

As shown in Figure 8, an obvious relationship occurred between the monthly precipitation and landslide number. The monthly rainfall distribution and landslide number were highly consistent. Most of the landslides occurred during the rainy season, and approximately 69% and 87% of the total landslides in the Loess Plateau and Qinba Mountains were concentrated from July to October, respectively. However, although relatively little rainfall occurred in October, more landslides were observed during this month because the soil moisture was relatively high due to the high rainfall in the preceding three months. Moreover, most of the landslides were triggered by long-lasting and intense rainfall events. For example, landslides occurred on 5 July 2011 in Lueyang and on 13 July 2013 in Wuqi County (Figure 9), and although the rainfall on 13 July 2013 was low, the high rainfall during the preceding time period was responsible for this occurrence.

3.2. The Spatial Distribution of Landslides

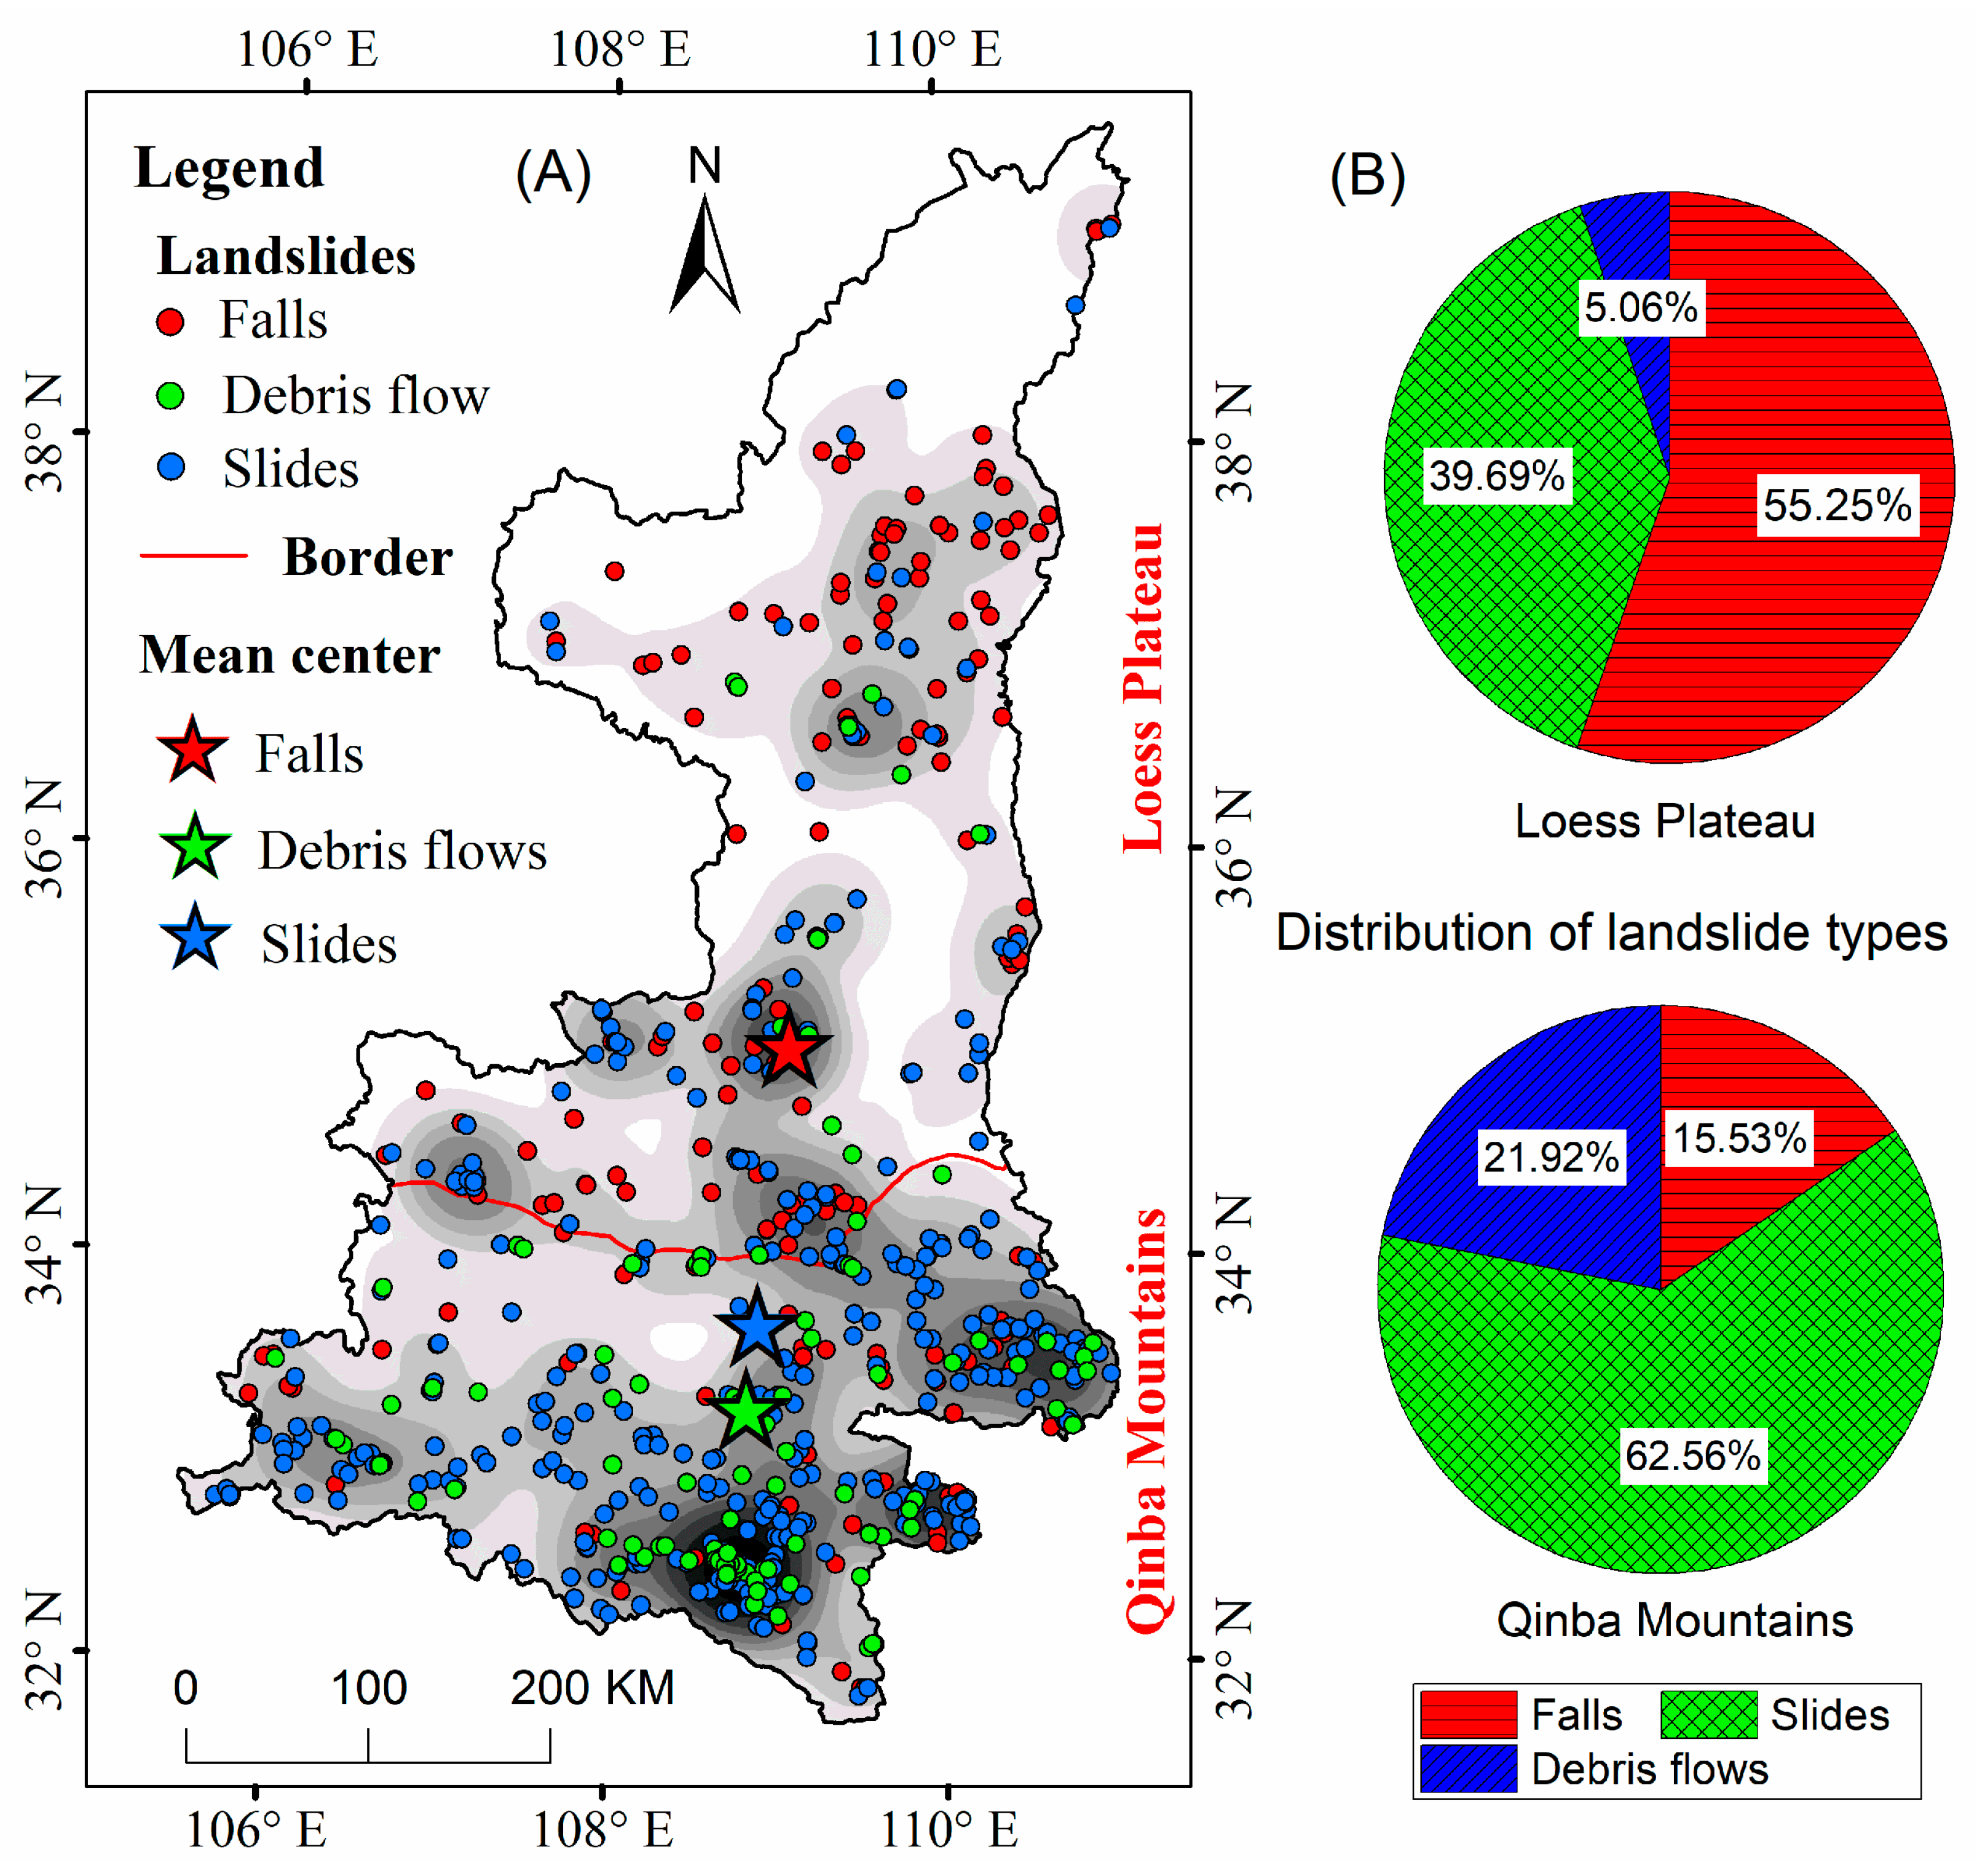
3.2.1. Geographical Distribution of Landslide Types and Densities among Different Geomorphologic Types

The landslide map shows 695 nonseismic landslides from the approximately 22-year interval between 1996 and 2017 in Shaanxi Province. The average number density in the Loess Plateau and Qinba Mountains was 21 and 53 landslides per 104 km2, respectively. The average number density in the Qinba Mountains was 2.5 times higher than that in the Loess Plateau. Moreover, the landslides were clustered in space. As illustrated in Figure 10, several landslide cluster centers were found.
In addition, most landslides were of the slide type in Shaanxi Province. Of the total number of landslides, 30% were falls, 54% were slides, and 16% were debris flows. The distribution of landslide types differed between the Loess Plateau and the Qinba Mountains. Falls accounted for 55% of the total landslides observed in the Loess Plateau but only 16% of the total landslides in the Qinba Mountains. Debris flows constituted 5% of the total landslides in the Loess Plateau but 22% of the total landslides in the Qinba Mountains (Figure 10). To reveal the spatial distribution, we calculated the mean centers of the landslides. As shown in Figure 10, the mean center of the falls type occurred in the Loess Plateau, and the mean centers of the slides and debris flows were in the Qinba Mountains. These results imply that there were different mean centers for different landslide types. Falls in the Loess Plateau accounted for approximately 68% of the total falls in Shaanxi Province, and debris flows in the Qinba Mountains accounted for approximately 88% of the total debris flows in Shaanxi Province. These findings suggest that falls were prone to occurring in the Loess Plateau and that debris flows were prone to occurring in the Qinba Mountains.

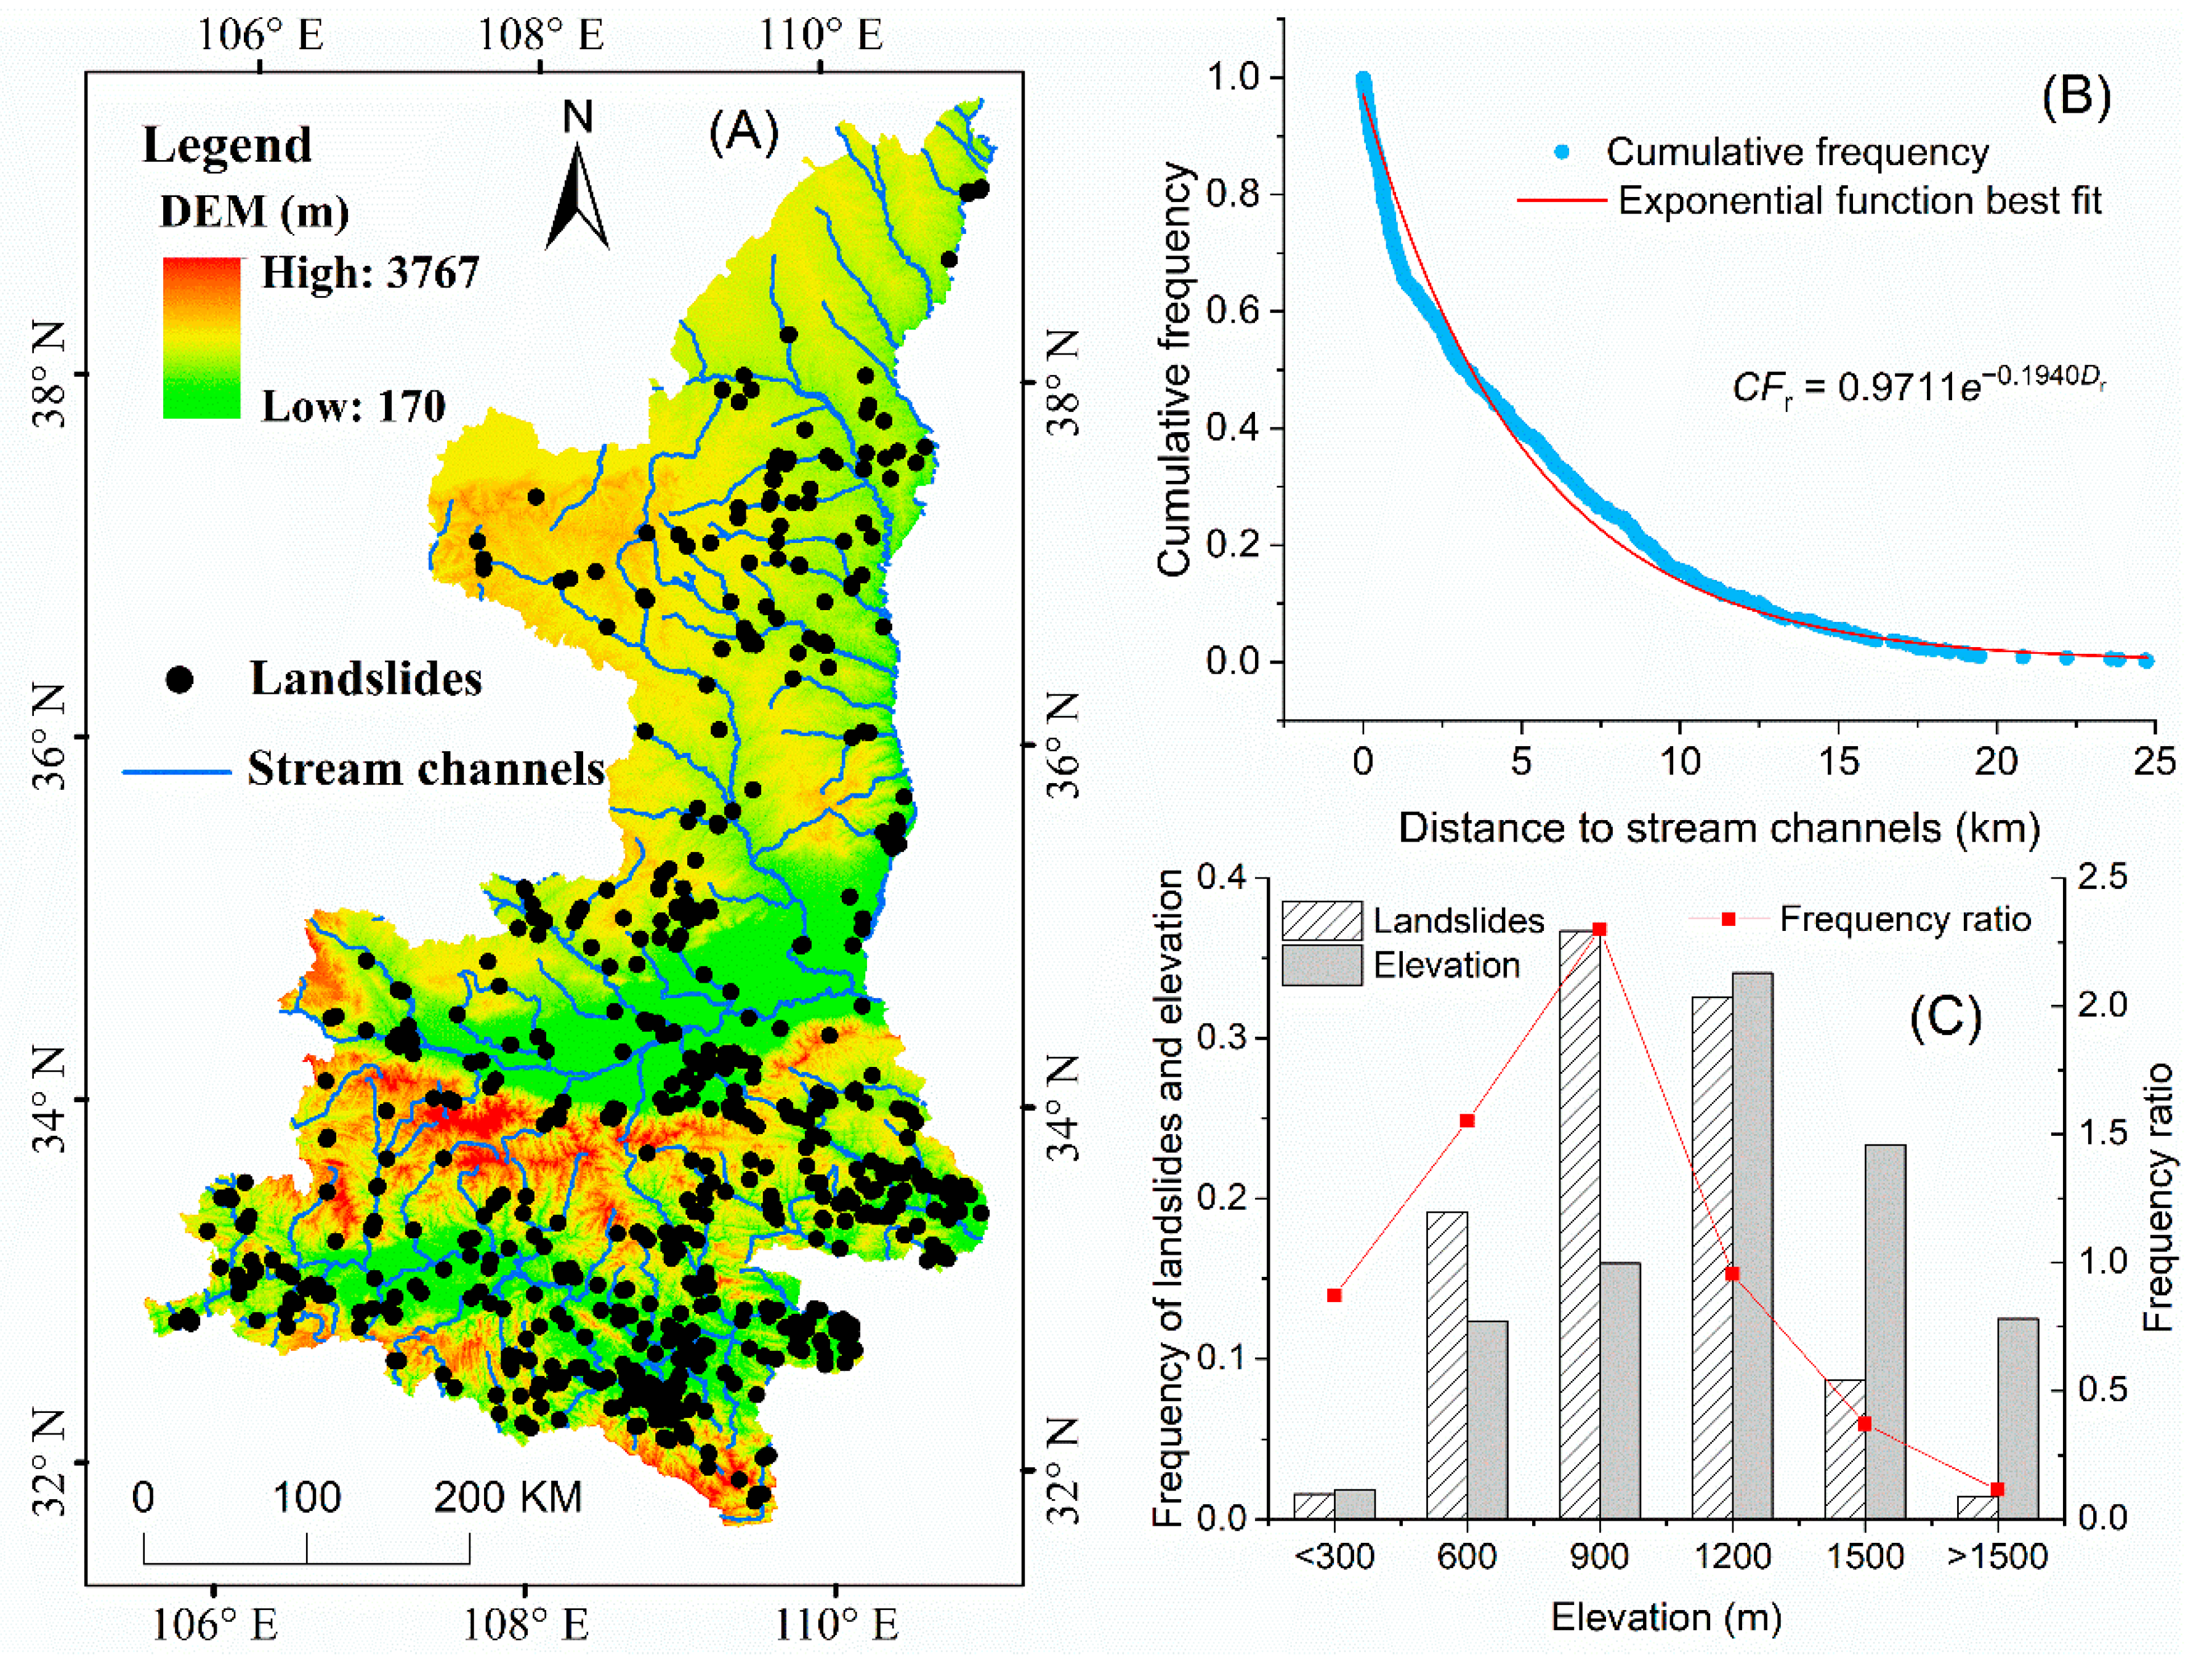
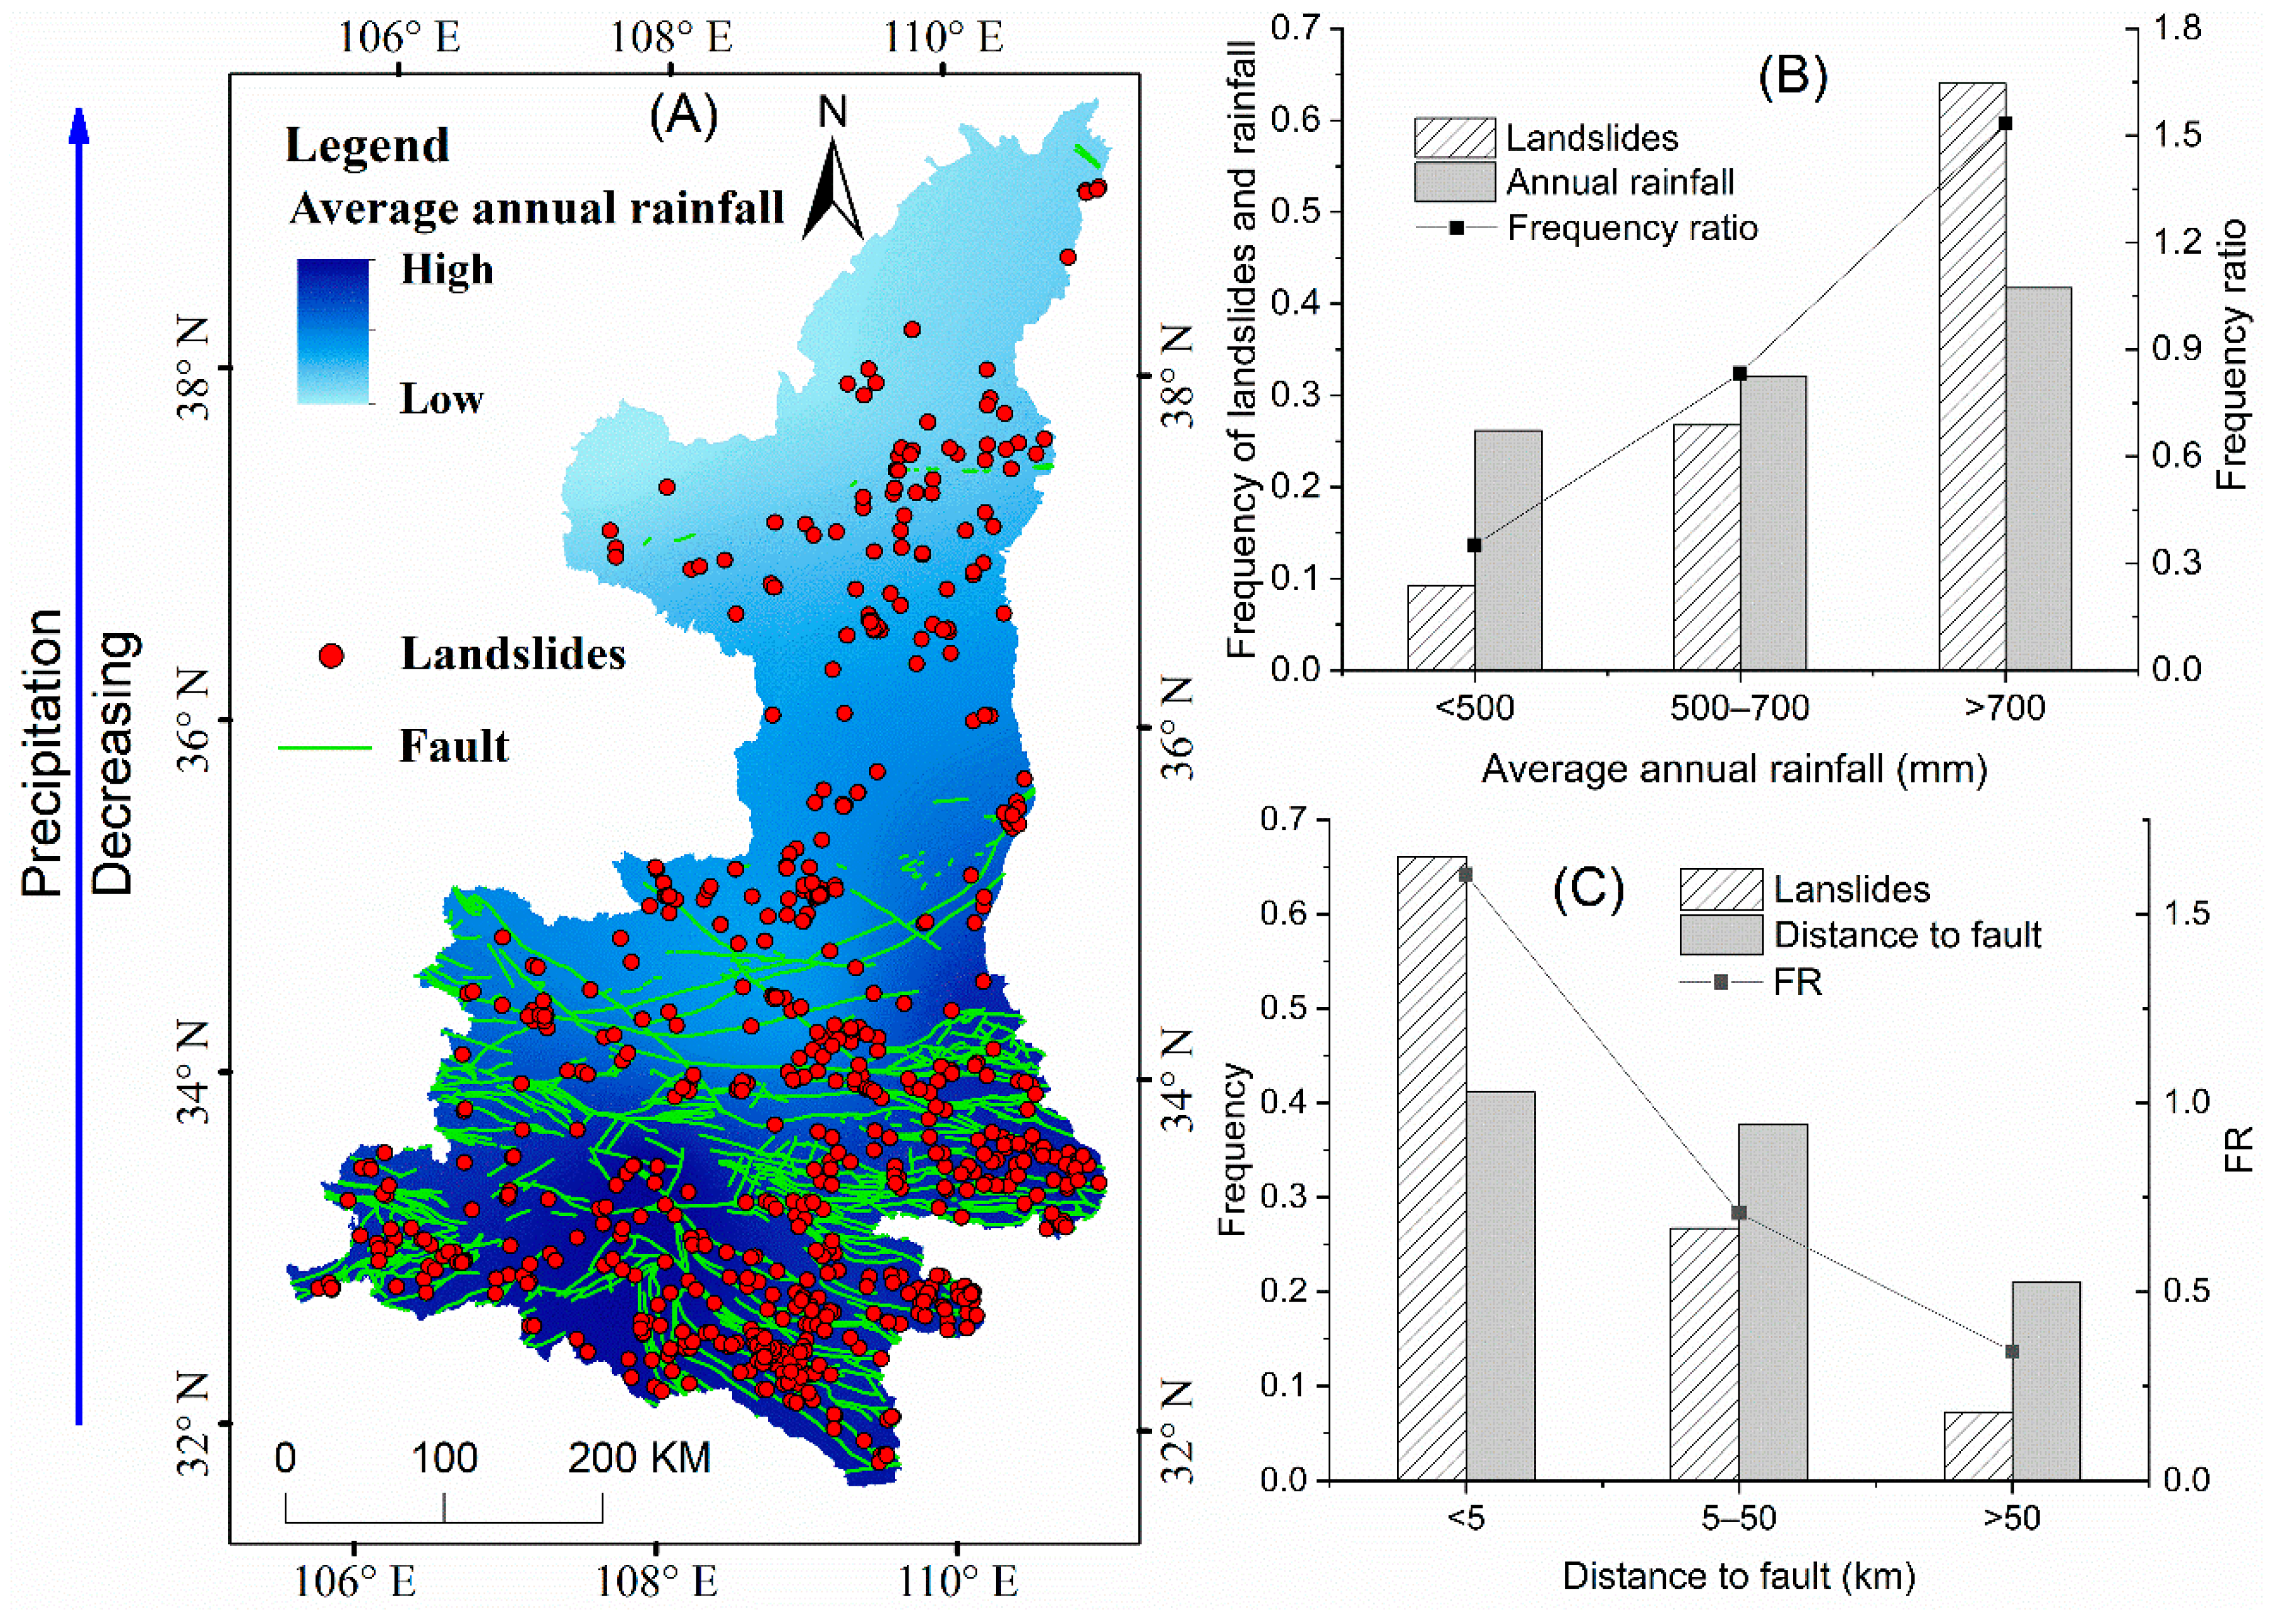
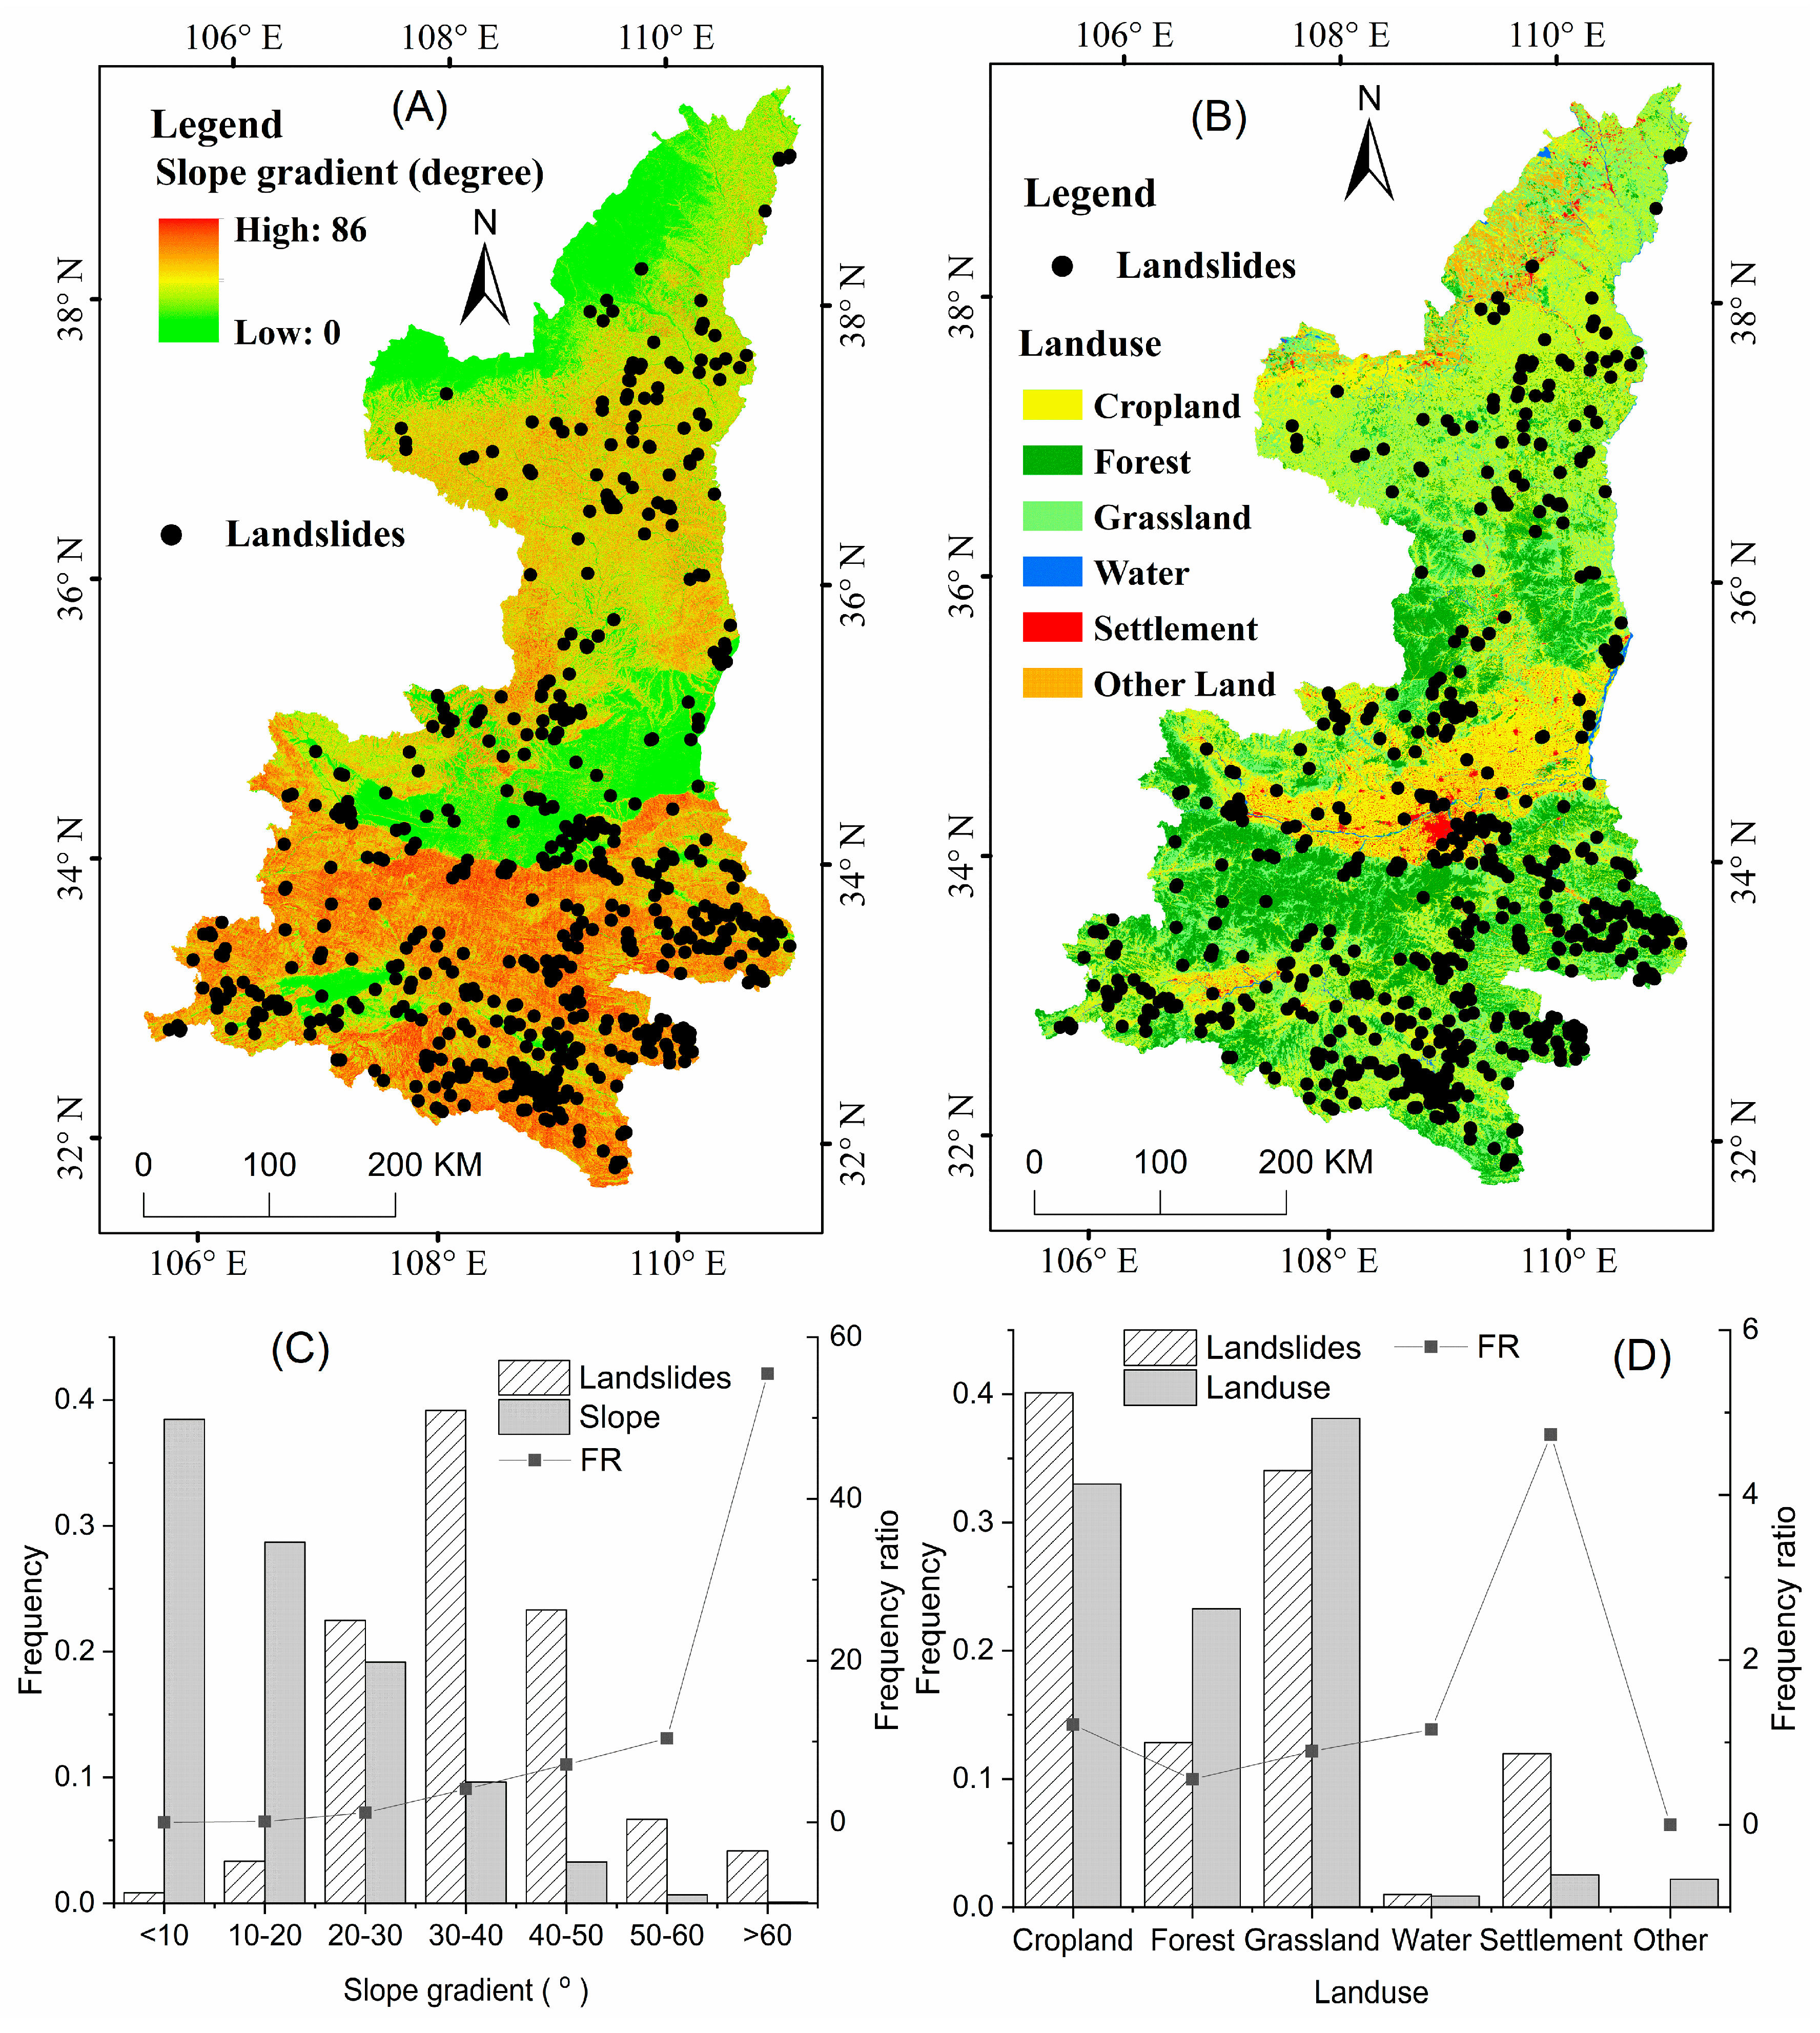
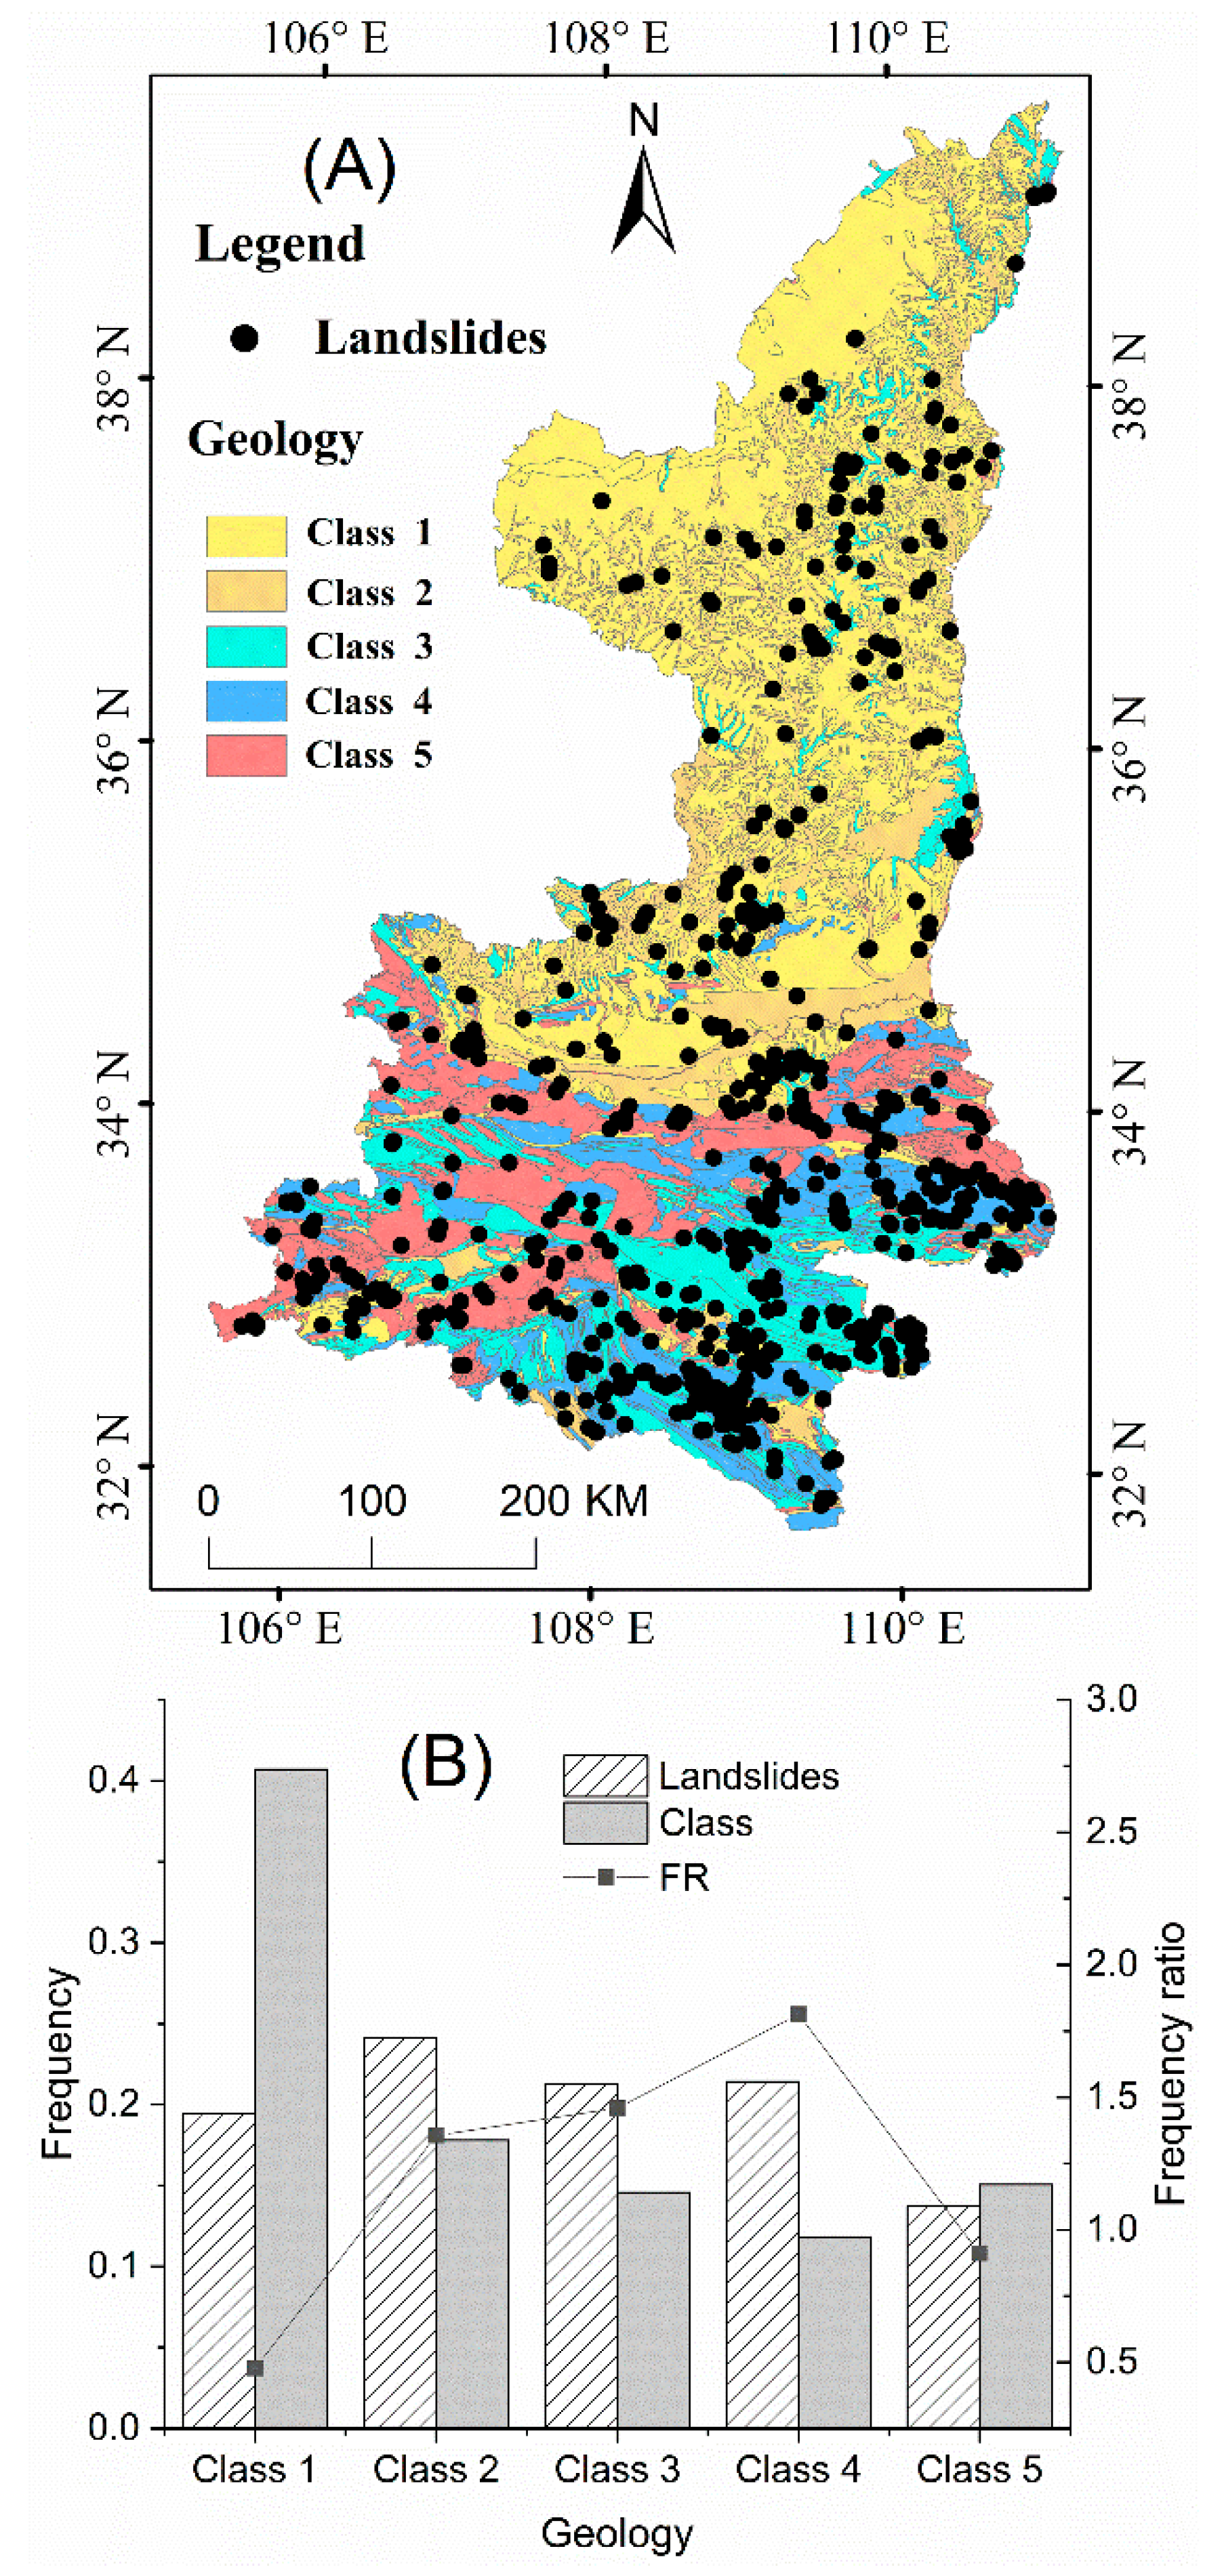
3.2.2. Relationships between Landslides and Influencing Factors

Rivers undercut the foot of the slopes and influence the slope instability. The distances to stream channels were calculated using the Euclidean Distance ArcGIS Tool. Concentrated water erosion influences the landslide occurrences. Figure 11A reveals that most landslides occurred near rivers. Additionally, further analysis found that the cumulative frequency gradually decreased as the distance to stream channels increased, and this relationship could be fitted well using an exponential function (Figure 11B).
Elevation is considered an important frequently used parameter. The relationship between the landslide frequency and elevation is shown in Figure 11C. The elevation varied between 170 m and 3767 m. The elevation was explored by binning elevation values into 300-m intervals. We divided elevations into six groups. The highest density of landslides occurred at elevations of 600–900 m. The middle of the province, where the elevation is low and landslide occurrences were relatively fewer, encompasses a larger area of cropland and population. The higher elevations in this study area are covered by dense forest. The landslide frequency ratios (the ratio of the landslide number to the area for each category) indicated that the relative density of landslide occurrences first increased and then decreased with increasing elevation.
Figure 12A shows the spatial distribution of the average annual rainfall and faults in Shaanxi Province. The mean annual precipitation for the period of 1957–2016 was used to create the precipitation distribution map using the inverse distance-weighted method. The average annual rainfall gradually decreased from south to north. To show the relationship between the landslide distribution and annual rainfall, we classified the study area into three categories according to the annual rainfall level: <500 mm, 500–700 mm, and >700 mm. As shown in Figure 12B, the number of landslides also decreased as the average annual rainfall decreased. About 64% of all landslides occurred in areas with an annual rainfall >700 mm, which covered 42% of the study area. The frequency ratio in the areas with rainfall >700 mm was 4.36 times that in the area with rainfall <500 mm.
The distance to a fault is also considered an important landslide-influencing factor. To assess the relationship between the distance to a fault and landslide occurrences, the distance to faults were calculated to create three buffer zones with the following intervals: 0–5 km, 5–50 km and >50 km. Statistical analysis demonstrated that the landslide frequency decreased as the distance from the fault increased and that most of the landslides (66%) were concentrated within a distance from a fault of less than 5 km (Figure 12C). Hence, the closer an area is to a fault, the higher the landslide density.
The slope gradient, which can influence the regional hydraulic behavior and moisture content, is a basic topographical feature. Slope gradients derived from the DEM ranged from 0° to 86°. We divided the slope gradients into seven categories. As shown in Figure 13A,C, most of the landslides occurred on slopes of 30–40°. The lowest frequencies of landslides were on gentle and steep slopes. However, in terms of the frequency ratio (FR), the landslide relative frequency increased as the slope gradient increased. The FR approach found that slopes of more than 60° had the highest relative frequency.
Land use was a significant factor influencing the slope instability. Vegetation protects slopes against soil erosion and shallow landslides. Here, we grouped the land use types into six classes: forest, grassland, cropland, settlement, water body, and other land. Grassland is the main land use type and cropland was the second-largest land use type. More than 71% of the area had a cropland or grassland use type. Settlements are distributed along the river valleys and gullies. As shown in Figure 13B,D, the majority of the landslides occurred on cropland and grassland. The FR approach found that settlement land use exhibited the highest relative landslide frequency.
Lithology can influence the geo-mechanical characteristics of soil. We grouped the geological units of the study into five classes, as shown in Figure 14. Classes one to five represent very soft rock, soft rock, moderately soft rock, hard rock, and very hard rock, respectively. Loess is the dominant lithology in class 1. Loess has the characteristics of a higher water permeability and collapsibility. In terms of the frequency ratio (FR), lithology class 4 was the most landslide-prone (Figure 14A,B).

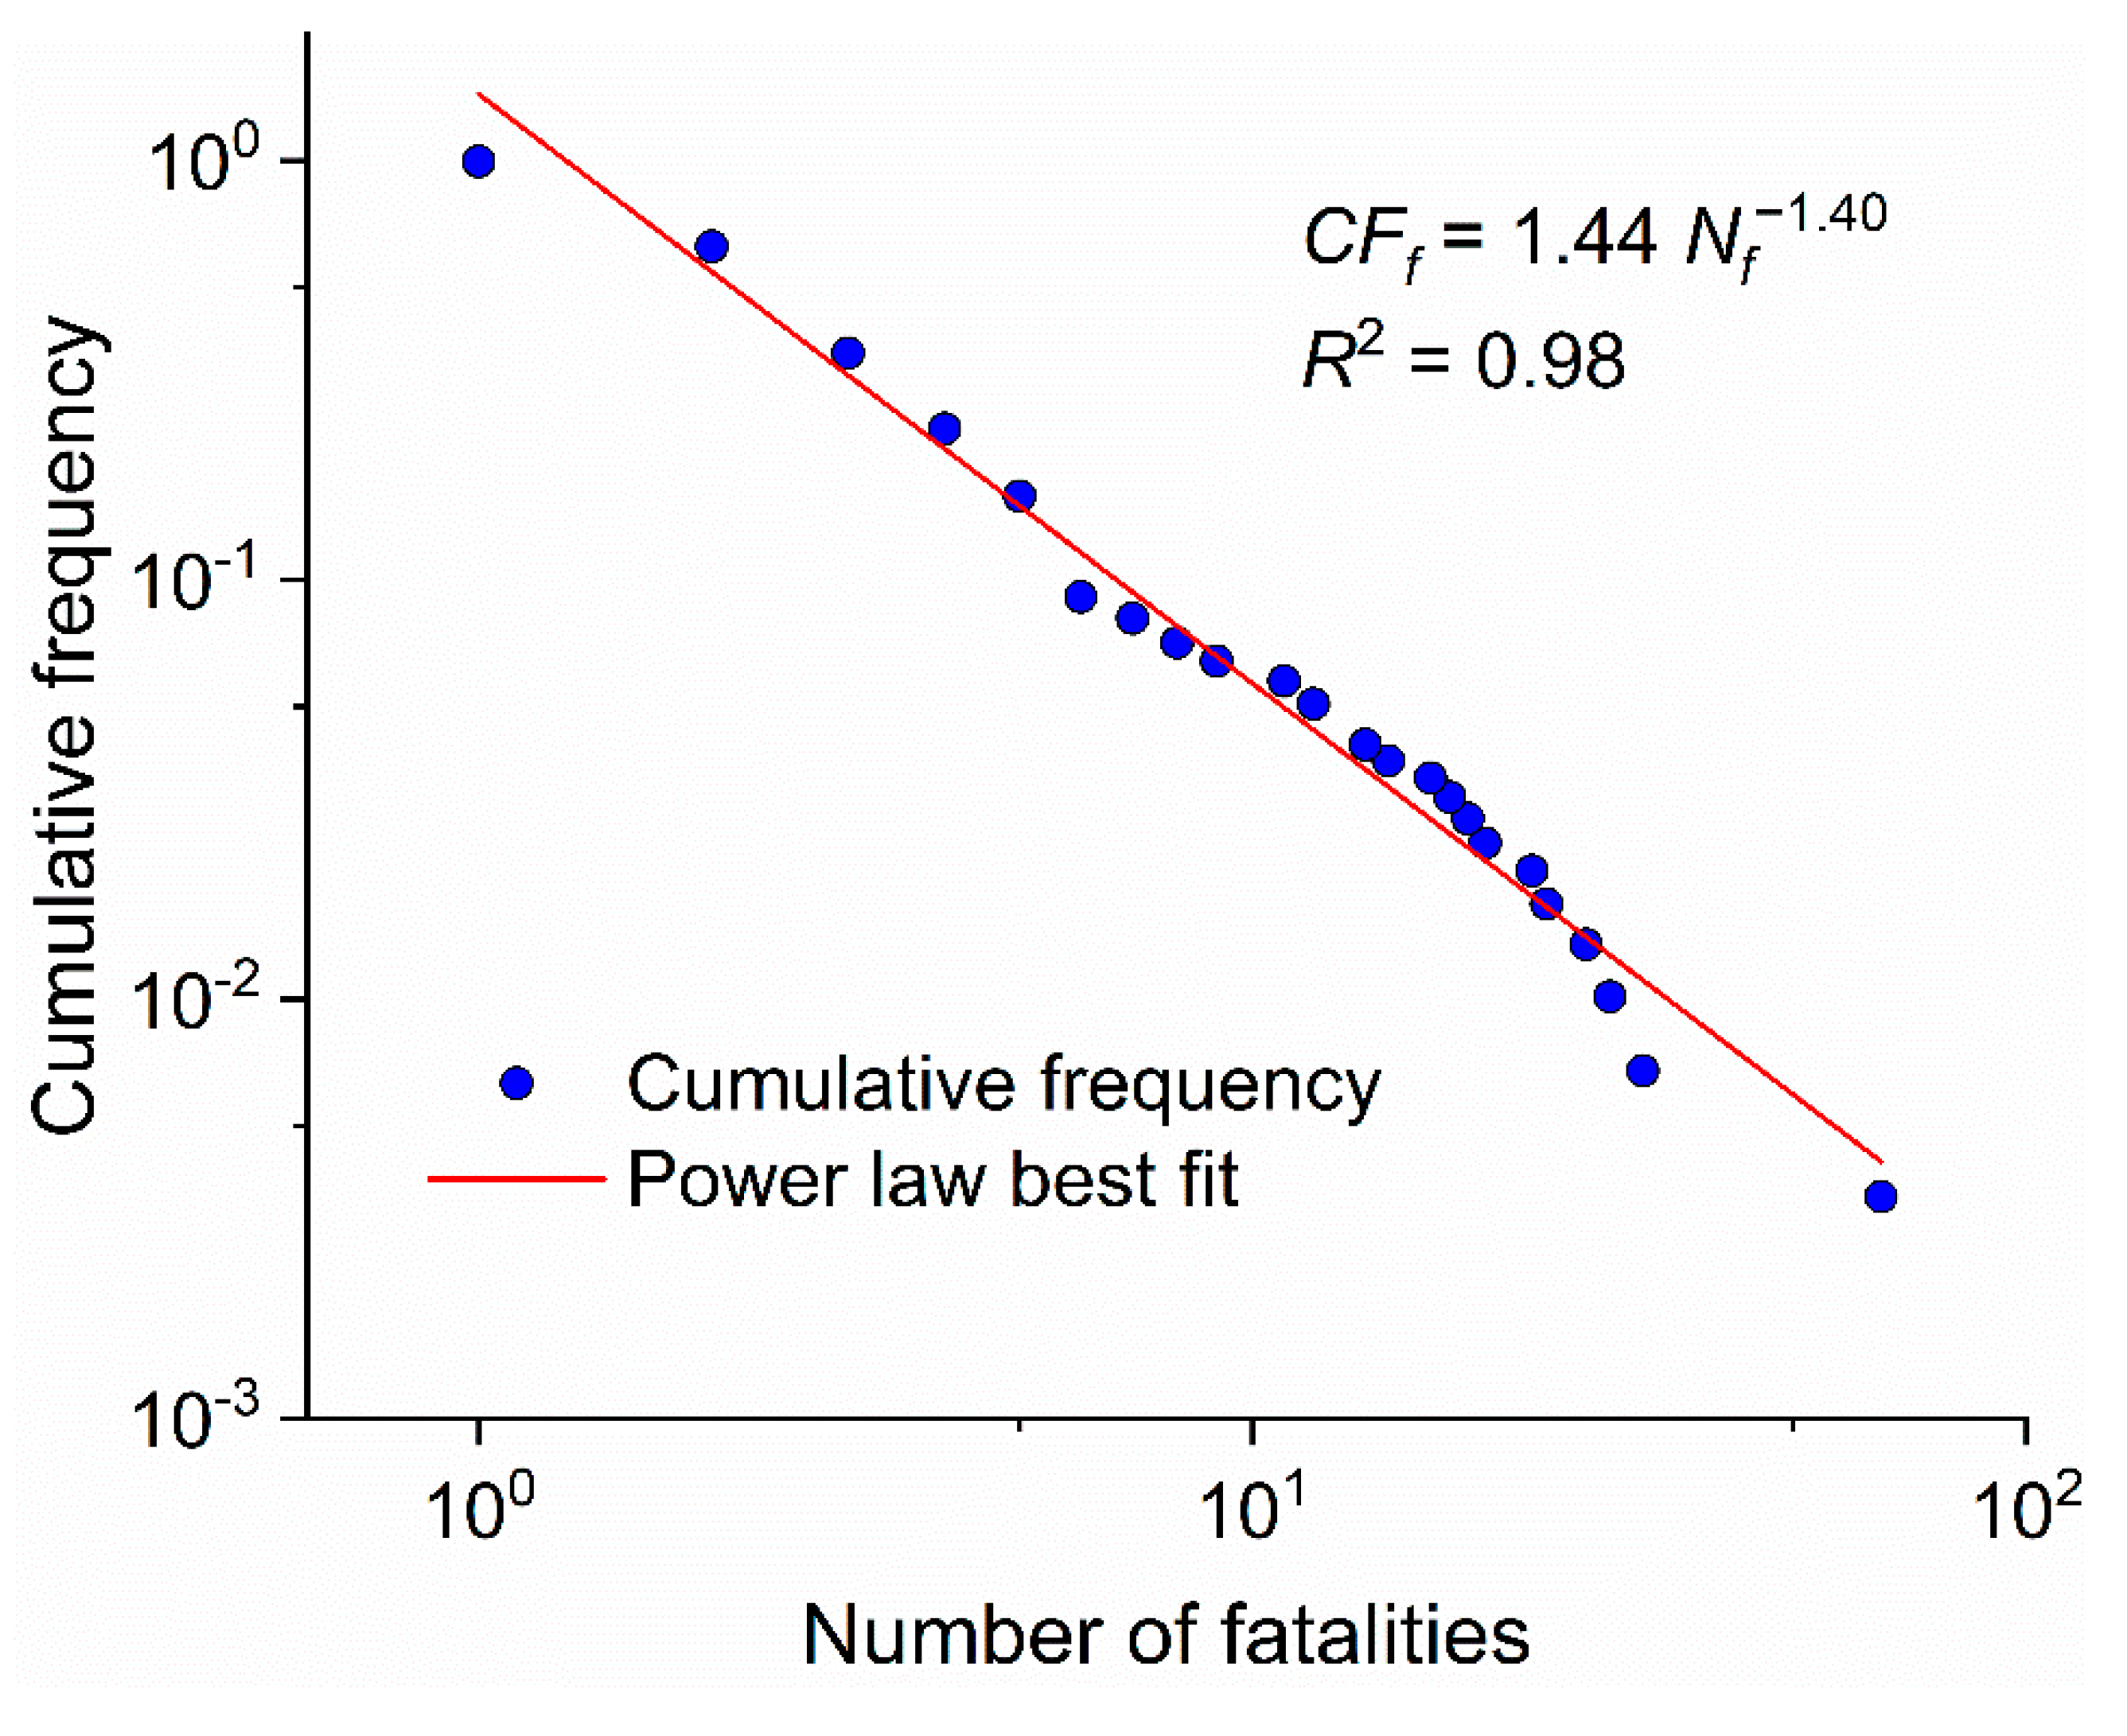
3.3. Distribution of Fatality Numbers

Landslides that caused deaths accounted for approximately 42% of the total collected landslides. The average fatality number caused by fatal landslides was three persons. Some serious fatal landslides caused the majority of fatalities within a certain year. For example, the Shanyang landslide, which occurred on 12 August 2015 resulted in 65 deaths. Here, based on the analysis of the cumulative frequency of fatalities associated with fatal landslides, we found that the cumulative frequency decreased sharply as the fatality number increased. This relation can be approximated using a power-law regression (Figure 15):
C F f = 1.44 N f 1.40   ( R 2 = 0.98 , p < 0.01 )
where CFf is the cumulative frequency and Nf is the number of fatalities.

4. Discussion

4.1. Completeness of Landslide Catalogs

Mapping the consistent temporal occurrence of landslides is a very challenging task when covering large physiographic and climatic regions over significantly long periods [39]. Therefore, the most widespread landslide catalogs are concerned with the spatial information of landslide events and have not specifically recorded landslide occurrences over time [40,41]. Some researchers have established global-, continental-, national-, and regional-scale landslide catalogs [5,31,42,43]. However, there is still no complete historical database of landslides in Shaanxi Province, China. In this work, we provide a first attempt to analyze the spatiotemporal distribution of landslides. We collected historical temporal and spatial records of landslides as completely as possible and used these data to study the statistical characteristics of landslides during the past 22 years in Shaanxi Province, China. Here, the catalogs include only landslides that were located near infrastructures and that resulted in damage. These catalogs are meaningful and informative for this study, as discussed above.

4.2. Temporal Distribution of Landslides

4.2.1. Frequency Distribution of the Time Intervals between Landslide Events

Several systems tend to exhibit a critical state and a power-law distribution that stems from self-organized criticality, and these systems include sand piles, earthquakes, and landslides [21,35,44,45]. Many researchers have used distribution curves to fit the probability density of interevent occurrences in environmental time series [16,46,47]. In this study, we modeled the cumulative frequency of the landslide time intervals using a least squares technique and found that the cumulative frequency of landslide time intervals from July to October followed an inverse power-law distribution. This result is similar to that of Witt et al. [16], who showed that the probability density of landslide time intervals followed a power-law function. These equations are important for developing landslide erosion models and performing risk assessments in a given area.

4.2.2. Frequency Distribution of Daily Landslide Numbers

Although our catalog was built from noninstrumental records, the cumulative frequency distribution of the daily landslide number exhibited an obvious power-law distribution. This result is similar to those from Rossi et al. [18] and Tatard et al. [48], who showed that inverse power-law scaling exists between the landslide frequency and the daily landslide number. Moreover, the probability density distribution of the daily landslide intensity was approximated using the power-law, zeta, and Zipf distributions. Rossi et al. [18] noted that the proxy limitation of incompleteness may influence the heavy-tailed distribution. Determining the landslide probability distribution over time is very important because it can be used to calculate the landslide number within a given time span under specific circumstances [16,48,49,50].

4.2.3. The Relation between Landslide Events and Rainfall

Many studies have shown that there are some complex links between landslide events and rainfall forcing [51]. The landslide number was not related to the annual precipitation over a long-term temporal scale [18]. However, further analysis of the landslide occurrences and monthly rainfall revealed that seasonal or monthly rainfall variations were significant for the landslide occurrences. Most landslides occurred during the rainy season. This finding is similar to the results from Lin and Wang [31] and Zhang and Huang [12], who found that the landslide temporal distribution is closely associated with the monthly rainfall in China. Moreover, the triggering of landslides is strongly related to the daily precipitation. In particular, the landslide number increases with increasing annual precipitation over a large area.

4.3. Spatial Distribution of Landslides

The Loess Plateau and Qinba Mountains in Shaanxi Province represent two different types of landscapes. As discussed earlier, obvious differences are observed in the landslide type, density, and time series among these two regions. These differences result from differences in the topography, geomorphology, geology, soil, vegetation, and other characteristics between the Loess Plateau and the Qinba Mountains [35,52]. We found that the majority of landslides in the Loess Plateau and Qinba Mountains were falls and slides, respectively. In particular, many debris flows occurred in the Qinba Mountains because of the high-intensity rainfall in this area. The landslide density in the Qinba Mountains was obviously higher than that in the Loess Plateau, which can be partly attributed to the intense tectonic activity and higher relative relief and precipitation in the Qinba Mountains. Obvious changes in the number of landslides were not observed from July to October in the Loess Plateau. In contrast, a decrease in the landslide number was observed from July to October in the Qinba Mountains.
The influencing factors have a significant effect on landslide occurrence and can be utilized in landslide prediction in the future [21,53,54]. Hence, many authors have used numerous different landslide-influencing factors to conduct landslide susceptibility and hazard assessments [55,56]. With the development of powerful microcomputers, relevant topographical, geomorphological, and geological factors have been obtained and processed using GIS technology and its applications [57,58,59,60]. Our findings regarding the relationship between the influencing factors and landslide occurrences in this work are similar to those of previous works [55,56]. In this work, we found that the distance to stream channels, slope gradient, and average annual rainfall play important roles as triggering factors for landslides. Most landslides occur close to the stream channels and within a distance from a fault of less than 5 km. These findings are similar to those of previous studies [52,61]. The highest relative frequency of landslides occurred at elevations of 600–900 m. The landslide relative frequency increased with the increase of the annual precipitation and slope gradient. This finding is similar to that of Qiu et al. [62], who found that there exists a strong positive correlation between the relative landslide density and slope gradient. Most landslides were recorded on cropland and grassland. Our results are also similar to those of Meinhardt et al. [61], who found that the root cohesion of crops and grass is low compared with that of forests. We found that there was no obvious relationship between landslides and lithology. This was because although loess is prone to landslides, relatively lower rainfall occurs over loess terrain.

4.4. Distribution of the Fatality Numbers

Landslides kill people every year all over the world [29,63]. Although numerous studies have focused on individual landslides, landslide distributions, and risk assessments, limited data are available on landslide fatalities [12,63]. China features the highest number of landslide fatalities but few data on landslide deaths are available. In the present work, the number of fatalities due to individual landslides ranged from 1 to 65. The results show that the cumulative frequency of the fatality number can be fitted using a power-law function. Our findings are similar to those obtained by Guzzetti [63], Petley [5], and Zhang and Huang [12], who found that the frequency distribution of fatalities follows a power-law decay function. This finding is important for the assessment of landslide risk [5].

5. Conclusions

We compiled a nonseismic landslide catalog for the period of 1996–2017 in Shaanxi Province, China. The results showed that the cumulative frequency decreased with the increase of the annual landslide number, and the relation could be described using a simple power-law regression. Most landslides were concentrated in the rainy season, and a linear relationship was observed between the fatality number and the landslide number in each month. We found that most time intervals between landslide events were very short, and the relation between the cumulative frequency and landslide time interval could be approximated using an exponential regression. Moreover, the cumulative frequency of the landslide number was empirically well correlated with the power-law regression. The statistical analysis demonstrated that approximately 42% of the total collected landslides caused deaths. The cumulative frequency of the fatality number could be fitted using a power-law relation. Furthermore, we found that the landslide types and densities were significantly different between the Loess Plateau and Qinba Mountains. Landslides occurred closer to stream channels and faults, and cropland and grassland presented high landslide densities. Most landslides were concentrated in areas with slope gradients of 30–40°, annual rainfall >700 mm, and elevations of 600–900 m. The landslide distribution showed a good correlation with the precipitation levels. The advantages of this analysis are that we developed a detailed historical landslide inventory and have provided a simplified framework for determining the spatiotemporal distribution of nonseismic landslides on a large scale. The limitation of the analysis is that the landslide data were preferentially collected and may be limited in terms of completeness. We expect these findings to be utilized in landslide risk assessment and management in the future.

Author Contributions

Conceptualization, Haijun Qiu; methodology, Dongdong Yang; software, Zijing Liu; Vlidation, Sheng Hu, Shuyue Ma, and Yanqian Pei; formal analysis, Yifei Cui; investigation, Shuyue Ma; resources, Haijun Qiu, and Junqing Hao; data curation, Dongdong Yang, and Junqing Hao; writing—original draft preparation, Haijun Qiu; writing—review and editing, Yifei Cui; visualization, Dongdong Yang; supervision, Haijun Qiu; project administration, Haijun Qiu; funding acquisition, Haijun Qiu.

Funding

This research was funded by the International Science & Technology Cooperation Program of China (grant no. 2018YFE0100100), the Second Tibetan Plateau Scientific Expedition and Research (STEP) program (grant no. 2019QZKK0903), and the National Natural Science Foundation of China (grant no. 41771539).

Acknowledgments

The authors would like to thank Yanlin Wang for helping us to prepare the landslide inventories.

Conflicts of Interest

The authors declare no conflict of interest.

References

  1. Brabb, E.E. The World Landslide Problem. Episodes 1991, 14, 52–61. [Google Scholar] [CrossRef]
  2. Fell, R. Landslide risk assessment and acceptable risk. Can. Geotech. J. 1994, 31, 261–272. [Google Scholar] [CrossRef]
  3. Qiu, H.; Cui, P.; Hu, S.; Regmi, A.D.; Wang, X.; Yang, D. Developing empirical relationships to predict loess slide travel distances: A case study on the Loess Plateau in China. Bull. Eng. Geol. Environ. 2018, 77, 1299–1309. [Google Scholar] [CrossRef]
  4. Salvati, P.; Bianchi, C.; Rossi, M.; Guzzetti, F. Societal landslide and flood risk in Italy. Nat. Hazards Earth Syst. Sci. 2010, 10, 465–483. [Google Scholar] [CrossRef]
  5. Petley, D. Global patterns of loss of life from landslides. Geology 2012, 40, 927–930. [Google Scholar] [CrossRef]
  6. Trigila, A.; Iadanza, C.; Esposito, C.; Scarascia-Mugnozza, G. Comparison of Logistic Regression and Random Forests techniques for shallow landslide susceptibility assessment in Giampilieri (NE Sicily, Italy). Geomorphology 2015, 249, 119–136. [Google Scholar] [CrossRef]
  7. Cui, Y.; Zhou, X.J.; Guo, C.X. Experimental study on the moving characteristics of fine grains in wide grading unconsolidated soil under heavy rainfall. J. Mt. Sci. 2017, 14, 417–431. [Google Scholar] [CrossRef]
  8. Cui, Y.; Cheng, D.; Choi, C.E.; Jin, W.; Lei, Y.; Kargel, J.S. The cost of rapid and haphazard urbanization: Lessons learned from the Freetown landslide disaster. Landslides 2019, 16, 1167–1176. [Google Scholar] [CrossRef]
  9. Derbyshire, E.; Van Asch, T.; Billard, A.; Meng, X. Modelling the erosional susceptibility of landslide catchments in thick loess: Chinese variations on a theme by Jan de Ploey. Catena 1995, 25, 315–331. [Google Scholar] [CrossRef]
  10. Zhuang, J.; Peng, J.; Wang, G.; Javed, I.; Wang, Y.; Li, W. Distribution and characteristics of landslide in Loess Plateau: A case study in Shaanxi province. Eng. Geol. 2018, 236, 89–96. [Google Scholar] [CrossRef]
  11. Qiu, H.; Cui, P.; Regmi, A.D.; Hu, S.; Zhang, Y.; He, Y. Landslide distribution and size versus relative relief (Shaanxi Province, China). Bull. Eng. Geol. Environ. 2018, 77, 1331–1342. [Google Scholar] [CrossRef]
  12. Zhang, F.; Huang, X. Trend and spatiotemporal distribution of fatal landslides triggered by non-seismic effects in China. Landslides 2018, 15, 1663–1674. [Google Scholar] [CrossRef]
  13. Keefer, D.K.; Larsen, M.C. Assessing landslide hazards. Science 2007, 316, 1136–1138. [Google Scholar] [CrossRef] [PubMed]
  14. Corominas, J.; Moya, J. A review of assessing landslide frequency for hazard zoning purposes. Eng. Geol. 2008, 102, 193–213. [Google Scholar] [CrossRef]
  15. Fell, R.; Corominas, J.; Bonnard, C.; Cascini, L.; Leroi, E.; Savage, W.Z.; on behalf of the JTC-1 Joint Technical Committee on Landslides and Engineered Slopes (2008). Guidelines for landslide susceptibility, hazard and risk zoning for land use planning. Eng. Geol. 2008, 102, 85–98. [Google Scholar] [CrossRef] [Green Version]
  16. Witt, A.; Malamud, B.D.; Rossi, M.; Guzzetti, F.; Peruccacci, S. Temporal correlations and clustering of landslides. Earth Surf. Process. Landf. 2010, 35, 1138–1156. [Google Scholar] [CrossRef]
  17. Korup, O. Geomorphic imprint of landslides on alpine river systems, southwest New Zealand. Earth Surf. Process. Landf. 2005, 30, 783–800. [Google Scholar] [CrossRef]
  18. Rossi, M.; Witt, A.; Guzzetti, F.; Malamud, B.D.; Peruccacci, S. Analysis of historical landslide time series in the Emilia-Romagna region, northern Italy. Earth Surf. Process. Landf. 2010, 35, 1123–1137. [Google Scholar] [CrossRef]
  19. Paudel, P.P.; Omura, H.; Kubota, T.; Inoue, T. Spatio-temporal patterns of historical shallow landslides in a volcanic area, Mt. Aso, Japan. Geomorphology 2017, 88, 21–33. [Google Scholar] [CrossRef]
  20. Baum, R.L.; Godt, J.W. Early warning of rainfall-induced shallow landslides and debris flows in the USA. Landslides 2010, 7, 259–272. [Google Scholar] [CrossRef]
  21. Guzzetti, F.; Reichenbach, P.; Cardinali, M.; Galli, M.; Ardizzone, F. Probabilistic landslide hazard assessment at the basin scale. Geomorphology 2005, 72, 272–299. [Google Scholar] [CrossRef]
  22. Qiu, H.; Cui, Y.; Hu, S.; Yang, D.; Pei, Y.; Yang, W. Temporal and spatial distributions of landslides in the Qinba Mountains, Shaanxi Province, China. Geomat. Nat. Hazards Risk. 2019, 10, 599–621. [Google Scholar] [CrossRef]
  23. Varnes, D.J. Landslide Hazard Zonation: A Review of Principles and Practice; Natural Hazards Series 3; Commission on Landslides of the IAEG; UNESCO: Paris, France, 1984; p. 63. [Google Scholar]
  24. Yin, J.; Chen, J.; Xu, X.; Wang, X.; Zheng, Y. The characteristics of the landslides triggered by the Wenchuan Ms 8.0 earthquake from Anxian to Beichuan. J. Asian Earth Sci. 2010, 37, 452–459. [Google Scholar] [CrossRef]
  25. Van Asch, T.W.; Van Steijn, H. Temporal patterns of mass movements in the French Alps. Catena 1991, 18, 515–527. [Google Scholar] [CrossRef]
  26. Dikau, R.; Schrott, L. The temporal stability and activity of landslides in Europe with respect to climatic change (TESLEC): Main objectives and results. Geomorphology 1999, 30, 1–12. [Google Scholar] [CrossRef]
  27. Piacentini, D.; Troiani, F.; Daniele, G.; Pizziolo, M. Historical geospatial database for landslide analysis: The Catalogue of Landslide OCcurrences in the Emilia-Romagna Region (CLOCkER). Landslides 2018, 15, 811–822. [Google Scholar] [CrossRef]
  28. Guzzetti, F.; Mondini, A.C.; Cardinali, M.; Fiorucci, F.; Santangelo, M.; Chang, K.T. Landslide inventory maps: New tools for an old problem. Earth-Sci. Rev. 2012, 112, 42–66. [Google Scholar] [CrossRef] [Green Version]
  29. Kirschbaum, D.; Stanley, T.; Zhou, Y. Spatial and temporal analysis of a global landslide catalog. Geomorphology 2015, 249, 4–15. [Google Scholar] [CrossRef]
  30. Pennington, C.; Freeborough, K.; Dashwood, C.; Dijkstra, T.; Lawrie, K. The National Landslide Database of Great Britain: Acquisition, communication and the role of social media. Geomorphology 2015, 249, 44–51. [Google Scholar] [CrossRef] [Green Version]
  31. Lin, Q.; Wang, Y. Spatial and temporal analysis of a fatal landslide inventory in China from 1950 to 2016. Landslides 2018, 15, 2357–2372. [Google Scholar] [CrossRef]
  32. Qiu, H.; Cui, P.; Regmi, A.D.; Hu, S.; Wang, X.; Zhang, Y. The effects of slope length and slope gradient on the size distributions of loess slides: Field observations and simulations. Geomorphology 2018, 300, 69–76. [Google Scholar] [CrossRef]
  33. Liu, T.S. Loess and Environment; China Ocean Press: Beijing, China, 1985. [Google Scholar]
  34. Shao, S. Qinling Orogenic Belt: Its Palaeozoic-Mesozoic Evolution and Metallogenesis. Acta Geol. Sin.-Engl. Ed. 2000, 74, 452–457. [Google Scholar] [CrossRef]
  35. Qiu, H.; Cui, P.; Regmi, A.D.; Hu, S.; Wang, X.; Zhang, Y.; He, Y. Influence of topography and volume on mobility of loess slides within different slip surfaces. Catena 2017, 157, 180–188. [Google Scholar] [CrossRef]
  36. Chen, X.Z.; Cui, Y.F. The formation of the Wulipo landslide and the resulting debris flow in Dujiangyan City, China. J. Mt. Sci. 2017, 14, 1100–1112. [Google Scholar] [CrossRef]
  37. Varnes, D.J. Slope movement types and processes. In Landslides; Analysis and Control, Special Report; Schuster, R.L., Krizck, R.J., Eds.; Transportation Research Board. National Academy of Sciences: Washington, DC, USA, 1978; Volume 176, pp. 11–33. [Google Scholar]
  38. Hungr, O.; Leroueil, S.; Picarelli, L. The Varnes classification of landslide types, an update. Landslides 2014, 11, 167–194. [Google Scholar] [CrossRef]
  39. Kirschbaum, D.B.; Adler, R.; Hong, Y.; Hill, S.; Lerner-Lam, A. A global landslide catalog for hazard applications: Method, results, and limitations. Nat. Hazards 2010, 52, 561–575. [Google Scholar] [CrossRef]
  40. Tonini, M.; Pedrazzini, A.; Penna, I.; Jaboyedoff, M. Spatial pattern of landslides in Swiss Rhone Valley. Nat. Hazards 2014, 73, 97–110. [Google Scholar] [CrossRef]
  41. Komac, M.; Hribernik, K. Slovenian national landslide database as a basis for statistical assessment of landslide phenomena in Slovenia. Geomorphology 2015, 249, 94–102. [Google Scholar] [CrossRef]
  42. Damm, B.; Klose, M. The landslide database for Germany: Closing the gap at national level. Geomorphology 2015, 249, 82–93. [Google Scholar] [CrossRef]
  43. Haque, U.; Blum, P.; Da Silva, P.F.; Andersen, P.; Pilz, J.; Chalov, S.R.; Lamas, P.C. Fatal landslides in Europe. Landslides 2016, 13, 1545–1554. [Google Scholar] [CrossRef]
  44. Bak, P.; Tang, C.; Wiesenfeld, K. Self-organized criticality. Phys. Rev. A. 1988, 38, 364–374. [Google Scholar] [CrossRef]
  45. Crovelli, R.A. Probability Models for Estimation of Number and Costs of Landslides; Geological Survey: Reston, VA, USA, 2000. [Google Scholar]
  46. Hainzl, S.; Scherbaum, F.; Beauval, C. Estimating background activity based on interevent-time distribution. Bull. Seismol. Soc. Am. 2006, 96, 313–320. [Google Scholar] [CrossRef]
  47. Santhanam, M.S.; Kantz, H. Return interval distribution of extreme events and long-term memory. Phys. Rev. E 2008, 78, 051113. [Google Scholar] [CrossRef] [PubMed] [Green Version]
  48. Tatard, L.; Grasso, J.R.; Helmstetter, A.; Garambois, S. Characterization and comparison of landslide triggering in different tectonic and climatic settings. J. Geophys. Res.-Earth Surf. 2010, 115, F4. [Google Scholar] [CrossRef]
  49. Coe, J.A.; Godt, J.W.; Baum, R.L.; Bucknam, R.C.; Michael, J.A. Landslide susceptibility from topography in Guatemala. In Landslides: Evaluation and Stabilisation; Lacerda, W.A., Ehrlich, M., Fontoura, S.A.B., Sayao, A.S.F., Eds.; Taylor & Francis Group: London, UK, 2004; pp. 69–78. [Google Scholar]
  50. Zêzere, J.L.; Garcia, R.A.C.; Oliveira, S.C.; Reis, E. Probabilistic landslide risk analysis considering direct costs in the area north of Lisbon (Portugal). Geomorphology 2008, 94, 467–495. [Google Scholar] [CrossRef]
  51. Guzzetti, F.; Peruccacci, S.; Rossi, M.; Stark, C.P. The rainfall intensity–duration control of shallow landslides and debris flows: An update. Landslides 2008, 5, 3–17. [Google Scholar] [CrossRef]
  52. Qiu, H.; Regmi, A.D.; Cui, P.; Cao, M.; Lee, J.; Zhu, X. Size distribution of loess slides in relation to local slope height within different slope morphologies. Catena 2016, 145, 155–163. [Google Scholar] [CrossRef]
  53. Van Westen, C.J.; Castellanos, E.; Kuriakose, S.L. Spatial data for landslide susceptibility, hazard, and vulnerability assessment: An overview. Eng. Geol. 2008, 102, 112–131. [Google Scholar] [CrossRef]
  54. Conforti, M.; Pascale, S.; Robustelli, G.; Sdao, F. Evaluation of prediction capability of the artificial neural networks for mapping landslide susceptibility in the Turbolo River catchment (northern Calabria, Italy). Catena 2014, 113, 236–250. [Google Scholar] [CrossRef]
  55. Brabb, E.E.; Pampeyan, E.H.; Bonilla, M.G. Landslide Susceptibility in San Mateo Country, California; Miscellaneous, Field Studies Map MF–360, scale 1:62500; US Geological Survey: Reston, VA, USA, 1972.
  56. Degraff, J.V.; Romersburg, H.C. Regional landslide-susceptibility for wildland management: A matrix approach. Coates Vitek (eds.) 1980, 19, 410–414. [Google Scholar]
  57. Carrara, A.; Cardinali, M.; Detti, R.; Guzzetti, F.; Pasqui, V.; Reichenbach, P. GIS techniques and statistical models in evaluating landslide hazard. Earth Surf. Process. Landf. 1991, 16, 427–445. [Google Scholar] [CrossRef]
  58. Guzzetti, F.; Carrara, A.; Cardinali, M.; Reichenbach, P. Landslide hazard evaluation: A review of current techniques and their application in a multi-scale study, Central Italy. Geomorphology 1999, 31, 181–216. [Google Scholar] [CrossRef]
  59. Irigaray, C.; Fernández, T.; Hamdouni, R.E.; Chacón, J. Evaluation and validation of landslide-susceptibility maps obtained by a gis matrix method: Examples from the betic cordillera (southern spain). Nat. Hazards 2007, 41, 61–79. [Google Scholar] [CrossRef]
  60. Chacón, J.; Irigaray, C.; Fernandez, T.; El Hamdouni, R. Engineering geology maps: Landslides and geographical information systems. Bull. Eng. Geol. Environ. 2006, 65, 341–411. [Google Scholar] [CrossRef]
  61. Meinhardt, M.; Fink, M.; Tünschel, H. Landslide susceptibility analysis in central Vietnam based on an incomplete landslide inventory: Comparison of a new method to calculate weighting factors by means of bivariate statistics. Geomorphology 2015, 234, 80–97. [Google Scholar] [CrossRef]
  62. Qiu, H.; Cui, P.; Regmi, A.D.; Hu, S.; Hao, J. Loess slide susceptibility assessment using frequency ratio model and artificial neural network. Q. J. Eng. Geol. Hydrogeol. 2019, 52, 38–45. [Google Scholar] [CrossRef]
  63. Guzzetti, F. Landslide fatalities and the evaluation of landslide risk in Italy. Eng. Geol. 2000, 58, 89–107. [Google Scholar] [CrossRef]
Figure 1. Location of the study area and digital elevation model (DEM). The inset shows the position of Shaanxi Province.
Ijgi 08 00505 g001
Figure 2. Photographs of typical landslides in the study area. (a) The slide that occurred on 30 July 2017 at 108°40′38″, 36°53′39″. (b) The slide that occurred on 1 August 2017 at 109°19′10″, 36°50′45″. (c) The debris flow that occurred on 7 August 2007 at 108°46′41″, 32°30′39″ (photograph by Zhaoshu Li). (d) The fall that occurred on 30 July 2017 at 108°42′14″, 36°52′26″.
Ijgi 08 00505 g002
Figure 3. Graph showing the number of landslides and number of landslide fatalities each year for the period of 1996–2017.
Ijgi 08 00505 g003
Figure 4. Cumulative frequency of the annual landslide number.
Ijgi 08 00505 g004
Figure 5. (A,B)Monthly distribution of the landslide number.
Ijgi 08 00505 g005
Figure 6. (A) Cumulative frequency of time intervals between landslide events from July to October. (B) Box plot shows distribution of time intervals.
Ijgi 08 00505 g006
Figure 7. Cumulative frequency of the daily landslide number.
Ijgi 08 00505 g007
Figure 8. Monthly distribution of landslides and rainfall.
Ijgi 08 00505 g008
Figure 9. (A,B) Intraday and cumulative rainfall from 30 June to 6 July 2011 in Lueyang County and from 7 July to 13 July 2013 in Wuqi County.
Ijgi 08 00505 g009
Figure 10. Distribution of the kernel density (A), mean center (A), and landslide type (B).
Ijgi 08 00505 g010
Figure 11. (A) Digital elevation model (DEM) and stream channels. (B) Relationships between landslides and distance to stream channels. (C) Relationships between landslides and elevation.
Ijgi 08 00505 g011
Figure 12. (A) Average annual rainfall and faults. (B) Relationships between landslides and average annual rainfall. (C) Relationships between landslides and distance to fault.
Ijgi 08 00505 g012
Figure 13. Relationships between landslides and influencing factors: Left (A,C) slope gradient and Right (B,D) land use.
Ijgi 08 00505 g013
Figure 14. (A) Geologic map. (B) Relationships between landslides and geology.
Ijgi 08 00505 g014
Figure 15. Cumulative frequency of fatality number.
Ijgi 08 00505 g015

